TopStory
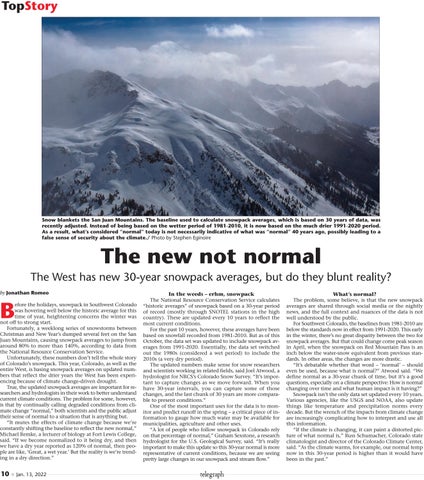
Snow blankets the San Juan Mountains. The baseline used to calculate snowpack averages, which is based on 30 years of data, was recently adjusted. Instead of being based on the wetter period of 1981-2010, it is now based on the much drier 1991-2020 period. As a result, what’s considered “normal” today is not necessarily indicative of what was “normal” 40 years ago, possibly leading to a false sense of security about the climate./ Photo by Stephen Eginoire
The new not normal The West has new 30-year snowpack averages, but do they blunt reality? by Jonathan Romeo
B
efore the holidays, snowpack in Southwest Colorado was hovering well below the historic average for this time of year, heightening concerns the winter was not off to strong start. Fortunately, a weeklong series of snowstorms between Christmas and New Year’s dumped several feet on the San Juan Mountains, causing snowpack averages to jump from around 80% to more than 140%, according to data from the National Resource Conservation Service. Unfortunately, these numbers don’t tell the whole story of Colorado’s snowpack. This year, Colorado, as well as the entire West, is basing snowpack averages on updated numbers that reflect the drier years the West has been experiencing because of climate change-driven drought. True, the updated snowpack averages are important for researchers and hydrologists in their work to better understand current climate conditions. The problem for some, however, is that by continually calling degraded conditions from climate change “normal,” both scientists and the public adjust their sense of normal to a situation that is anything but. “It mutes the effects of climate change because we’re constantly shifting the baseline to reflect the new normal,” Michael Remke, a lecturer of biology at Fort Lewis College, said. “If we become normalized to it being dry, and then we have a dry year reported as 120% of normal, then people are like, ‘Great, a wet year.’ But the reality is we’re trending in a dry direction.”
10 n Jan. 13, 2022
In the weeds – erhm, snowpack The National Resource Conservation Service calculates “historic averages” of snowpack based on a 30-year period of record (mostly through SNOTEL stations in the high country). These are updated every 10 years to reflect the most current conditions. For the past 10 years, however, these averages have been based on snowfall recorded from 1981-2010. But as of this October, the data set was updated to include snowpack averages from 1991-2020. Essentially, the data set switched out the 1980s (considered a wet period) to include the 2010s (a very dry period). The updated numbers make sense for snow researchers and scientists working in related fields, said Joel Atwood, a hydrologist for NRCS’s Colorado Snow Survey. “It’s important to capture changes as we move forward. When you have 30-year intervals, you can capture some of those changes, and the last chunk of 30 years are more comparable to present conditions.” One of the most important uses for the data is to monitor and predict runoff in the spring – a critical piece of information to gauge how much water may be available for municipalities, agriculture and other uses. “A lot of people who follow snowpack in Colorado rely on that percentage of normal,” Graham Sexstone, a research hydrologist for the U.S. Geological Survey, said. “It’s really important to make this update so this 30-year normal is more representative of current conditions, because we are seeing pretty large changes in our snowpack and stream flow.”
telegraph
What’s normal? The problem, some believe, is that the new snowpack averages are shared through social media or the nightly news, and the full context and nuances of the data is not well understood by the public. For Southwest Colorado, the baselines from 1981-2010 are below the standards now in effect from 1991-2020. This early in the winter, there’s no great disparity between the two for snowpack averages. But that could change come peak season in April, when the snowpack on Red Mountain Pass is an inch below the water-snow equivalent from previous standards. In other areas, the changes are more drastic. “It’s debatable whether that word – ‘normal’ – should even be used, because what is normal?” Atwood said. “We define normal as a 30-year chunk of time, but it’s a good questions, especially on a climate perspective: How is normal changing over time and what human impact is it having?” Snowpack isn’t the only data set updated every 10 years. Various agencies, like the USGS and NOAA, also update things like temperature and precipitation norms every decade. But the wrench of the impacts from climate change are increasingly complicating how to interpret and use all this information. “If the climate is changing, it can paint a distorted picture of what normal is,” Russ Schumacher, Colorado state climatologist and director of the Colorado Climate Center, said. “As the climate warms, for example, our normal temp now in this 30-year period is higher than it would have been in the past.”


