T TOOLBOX
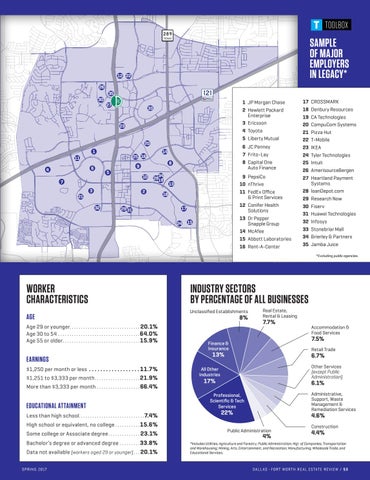
SAMPLE OF MAJOR EMPLOYERS IN LEGACY*
12 22 26 35 30
27
1 JP Morgan Chase 2 Hewlett Packard Enterprise 3 Ericsson 4 Toyota 5 Liberty Mutual
33
23
20 1
25 16
11
8
9
6
4
5
10
7 3
34 2819
2
21 32
6 JC Penney 7 Frito-Lay 8 Capital One Auto Finance
14
29 31
9 PepsiCo 10 nThrive 11 FedEx Office & Print Services 12 Conifer Health Solutions 13 Dr Pepper Snapple Group 14 McAfee 15 Abbott Laboratories 16 Rent-A-Center
13
18 17 24
15
17 18 19 20 21 22 23 24 25 26 27 28 29 30 31 32 33 34 35
CROSSMARK Denbury Resources CA Technologies CompuCom Systems Pizza Hut T-Mobile IKEA Tyler Technologies Intuit AmerisourceBergen Heartland Payment Systems loanDepot.com Research Now Fiserv Huawei Technologies Infosys Stonebriar Mall Brierley & Partners Jamba Juice *Excluding public agencies.
WORKER CHARACTERISTICS AGE Age 29 or younger. . . . . . . . . . . . . . . . . . . . . . . . . . . . . . . 20.1% Age 30 to 54 . . . . . . . . . . . . . . . . . . . . . . . . . . . . . . . . . . . . 64.0% Age 55 or older . . . . . . . . . . . . . . . . . . . . . . . . . . . . . . . . . . 15.9%
EARNINGS $1,250 per month or less . . . . . . . . . . . . . . . . . . 11.7% $1,251 to $3,333 per month . . . . . . . . . . . . . . . . . . . . 21.9% More than $3,333 per month . . . . . . . . . . . . . . . . . . . 66.4%
EDUCATIONAL ATTAINMENT Less than high school. . . . . . . . . . . . . . . . . . . . . . . . . . . . . 7.4% High school or equivalent, no college . . . . . . . . . . . 15.6% Some college or Associate degree . . . . . . . . . . . . . . 23.1% Bachelor’s degree or advanced degree . . . . . . . . . 33.8% Data not available (workers aged 29 or younger) . . . 20.1% SPRING 2017
INDUSTRY SECTORS BY PERCENTAGE OF ALL BUSINESSES Unclassified Establishments
8%
Real Estate, Rental & Leasing
7.7%
Accommodation & Food Services
7.5%
Finance & Insurance
Retail Trade
13%
6.7%
Other Services (except Public Administration)
All Other Industries
17%
6.1%
Administrative, Support, Waste Management & Remediation Services
Professional, Scientific & Tech Services
22%
4.6%
Public Administration
4%
Construction
4.4%
*Includes Utilities; Agriculture and Forestry; Public Administration; Mgt. of Companies; Transportation and Warehousing; Mining; Arts, Entertainment, and Recreation; Manufacturing; Wholesale Trade; and Educational Services.
D A L L A S - F O R T W O R T H R E A L E S TAT E R E V I E W / 5 3