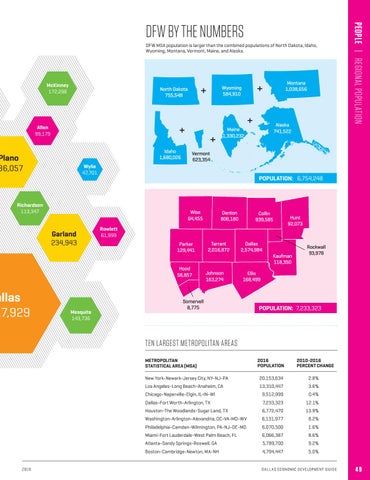
DFW MSA population is larger than the combined populations of North Dakota, Idaho, Wyoming, Montana, Vermont, Maine, and Alaska.
+ +
North Dakota 755,548 North Dakota 755,548
McKinney 172,298
+ +
Allen 99,179
Idaho 1,680,026 Idaho 1,680,026
Plano 86,057
+ Vermont+
Rowlett 61,999
Wise 64,455 Wise 64,455 Parker 129,441 Parker 129,441 Hood 56,857 Hood 56,857
Mesquite 143,736
Alaska 741,522 Alaska 741,522
POPULATION: 6,754,248 POPULATION: POPULATION: 6,754,248 6,754,248 POPULATION: 7,233,323 POPULATION: 7,233,323
Richardson 113,347
allas 17,929
+ +
623,354 Vermont 623,354
Wylie 47,701
Garland 234,943
Maine 1,330,232 Maine 1,330,232
Montana 1,038,656 Montana 1,038,656
+ +
Wyoming 584,910 Wyoming 584,910
PEOPLE | REGIONAL POPULATION
DFW BY THE NUMBERS
Denton 806,180 Denton 806,180 Tarrant 2,016,872 Tarrant 2,016,872 Johnson 163,274 Johnson 163,274
Collin 939,585 Collin 939,585 Dallas 2,574,984 Dallas 2,574,984 Ellis 168,499 Ellis 168,499
Somervell 8,775 Somervell 8,775
Hunt 92,073 Hunt 92,073
Kaufman 118,350 Kaufman 118,350
Rockwall 93,978 Rockwall 93,978
POPULATION: 7,233,323
TEN LARGEST METROPOLITAN AREAS METROPOLITAN STATISTICAL AREA (MSA)
2018
2016 POPULATION
2010-2016 PERCENT CHANGE
New York-Newark-Jersey City, NY-NJ-PA
20,153,634
2.8%
Los Angeles-Long Beach-Anaheim, CA
13,310,447
3.6%
Chicago-Naperville-Elgin, IL-IN-WI
9,512,999
0.4%
Dallas-Fort Worth-Arlington, TX
7,233,323
12.1%
Houston-The Woodlands-Sugar Land, TX
6,772,470
13.9%
Washington-Arlington-Alexandria, DC-VA-MD-WV
6,131,977
8.2%
Philadelphia-Camden-Wilmington, PA-NJ-DE-MD
6,070,500
1.6%
Miami-Fort Lauderdale-West Palm Beach, FL
6,066,387
8.6%
Atlanta-Sandy Springs-Roswell, GA
5,789,700
9.2%
Boston-Cambridge-Newton, MA-NH
4,794,447
5.0%
D A L L A S ECONOMIC DEVELOPMENT G U I D E
49