
1 minute read
PEDESTRIAN COUNTERS


A Pedestrian Counter is a digital device installed to monitor foot traffic day in and day out at 10 key locations around the Ithaca Commons. While there are many points of entry onto the Commons, the counters provide an excellent source of data to better understand the pedestrian volume, behavior, and trends downtown.
DIA works with a company called SpringBoard, based out of the UK, with US service based out of California and Massauchettts. The counters were installed and went online in March 2020 just days before the national pandemic lockdown. Prior to 2020, the DIA contracted with another firm, Motion Left to provide pedestrain counter data, but in a smaller number of locations.
Advertisement
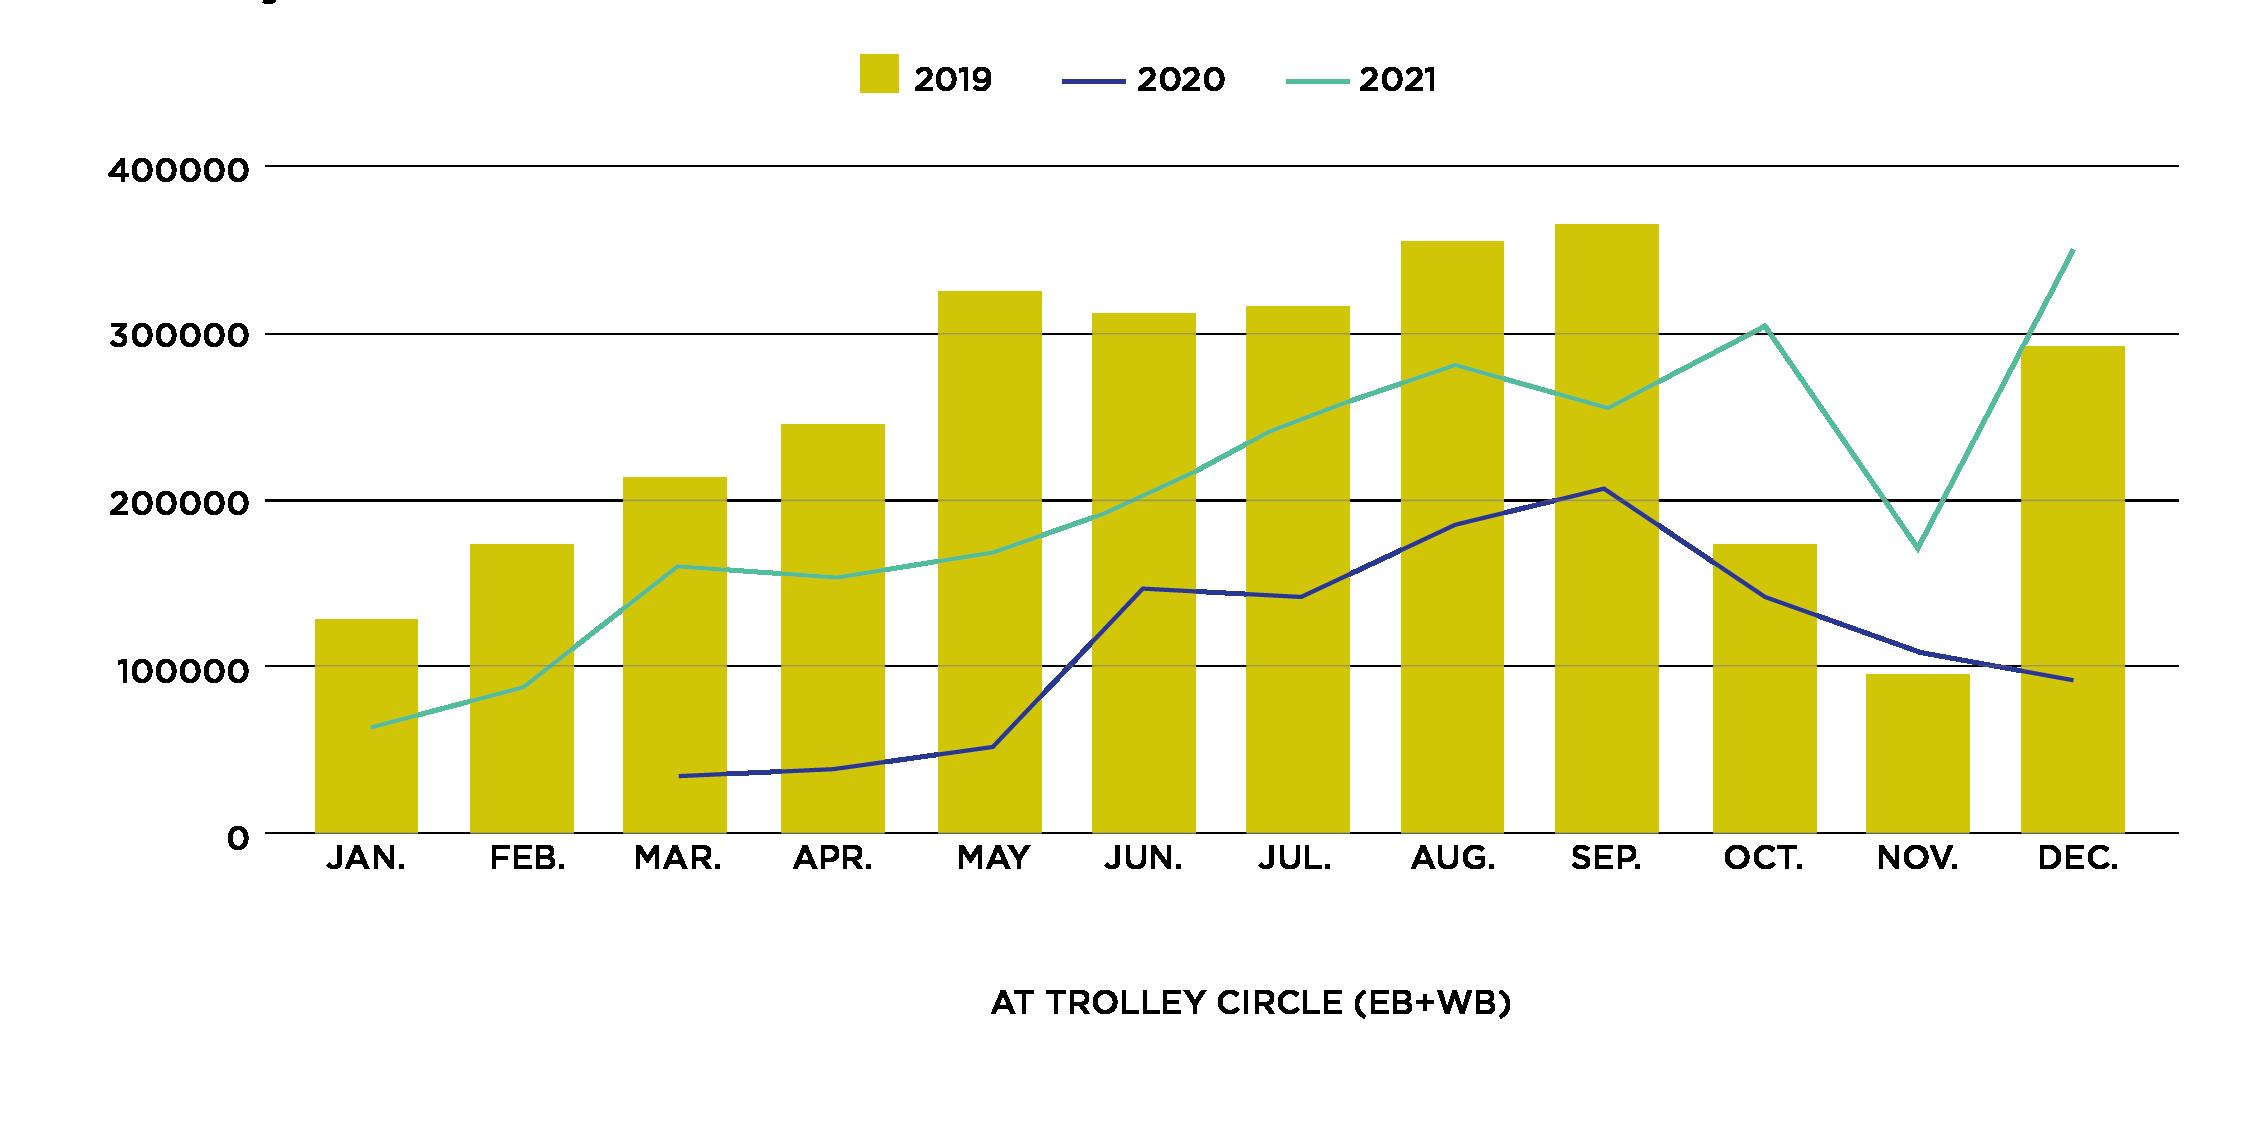
The chart above: YOY Footfalls 2019-2021 at our Trolley Circle EB & WB counter locations, our most popular areas for pedestrian traffic. Data from MotionLoft and SpringBoard.
Pedestrian Counter Reports
Study Period: Wk 14 April 5, 2021 - Wk 10 March 13, 2022
Combined Foot Traffic
5,294,213| ALL LOCATIONS + ALL DIRECTIONALITY
BUSIEST:
MONTH: September 2021, August 2021, May 2021 (in order)
WEEK: September 27, 2021 - October 3, 2021
LOCATION + DIRECTIONALITY: Trolley Circle-Westbound
AVERAGE:
TOP 3 DAY(S) OF THE WEEK: SATURDAY, FRIDAY, SUNDAY (in order)
TOP 4 HOUR(S) OF THE DAY: 1:00PM, 2:00PM, 12:00PM, 6:00PM (in order)
Trolley Circle
2,214,311 DIRECTIONALITY: Eastbound toward Aurora St., Westbound toward Cayuga St.
BUSIEST MONTH: AUGUST DAY: SATURDAY HOUR: 1:00 PM
Restaurant Row
1,584,342 DIRECTIONALITY: North, East, South + Westbound
BUSIEST MONTH: SEPTEMBER DAY: SATURDAY HOUR: 6:00 PM
Cayuga Street
1,495,578 DIRECTIONALITY: North, East, South + Westbound
BUSIEST MONTH: SEPTEMBER DAY: SATURDAY HOUR: 1:00 PM