1 minute read
DOWNTOWN RECOVERY MEASURED BY FOOT TRAFFIC


Though a coronavirus vaccination was released in the spring and the State and County health departments relaxed health and safety mandates during the summer making it easier for people to travel, the pandemic continued to have a significant impact on our pedestrian traffic on the Commons in 2021. Footfalls were down by nearly 15% from 2019, according to footfalls recorded by our pedestrian counters.
A bright spot; however, footfalls during the first eight weeks of 2022 are already surpassing 2021 which means pedestrian traffic is getting closer to our pre-pandemic counts.
Advertisement
This Annual Performance chart shows Commons pedestrian traffic compared by week: 2020 (blue), 2021 (green), 2022 (lime). The green line shows 2021 foot traffic surpassed 2020 foot, traffic counts. This makes sense given all the positive changes happening in 2021 during the pandemic that allowed people to return to work and travel: many state restrictions were eased allowing businesses to reopen. By spring 2021, a vaccination was available making it safer for vaccinated workers, visitors, and tourists to return to our community. Plus, you see in the above graph, 2022 (the lime line) footfalls are already surpassing 2021.
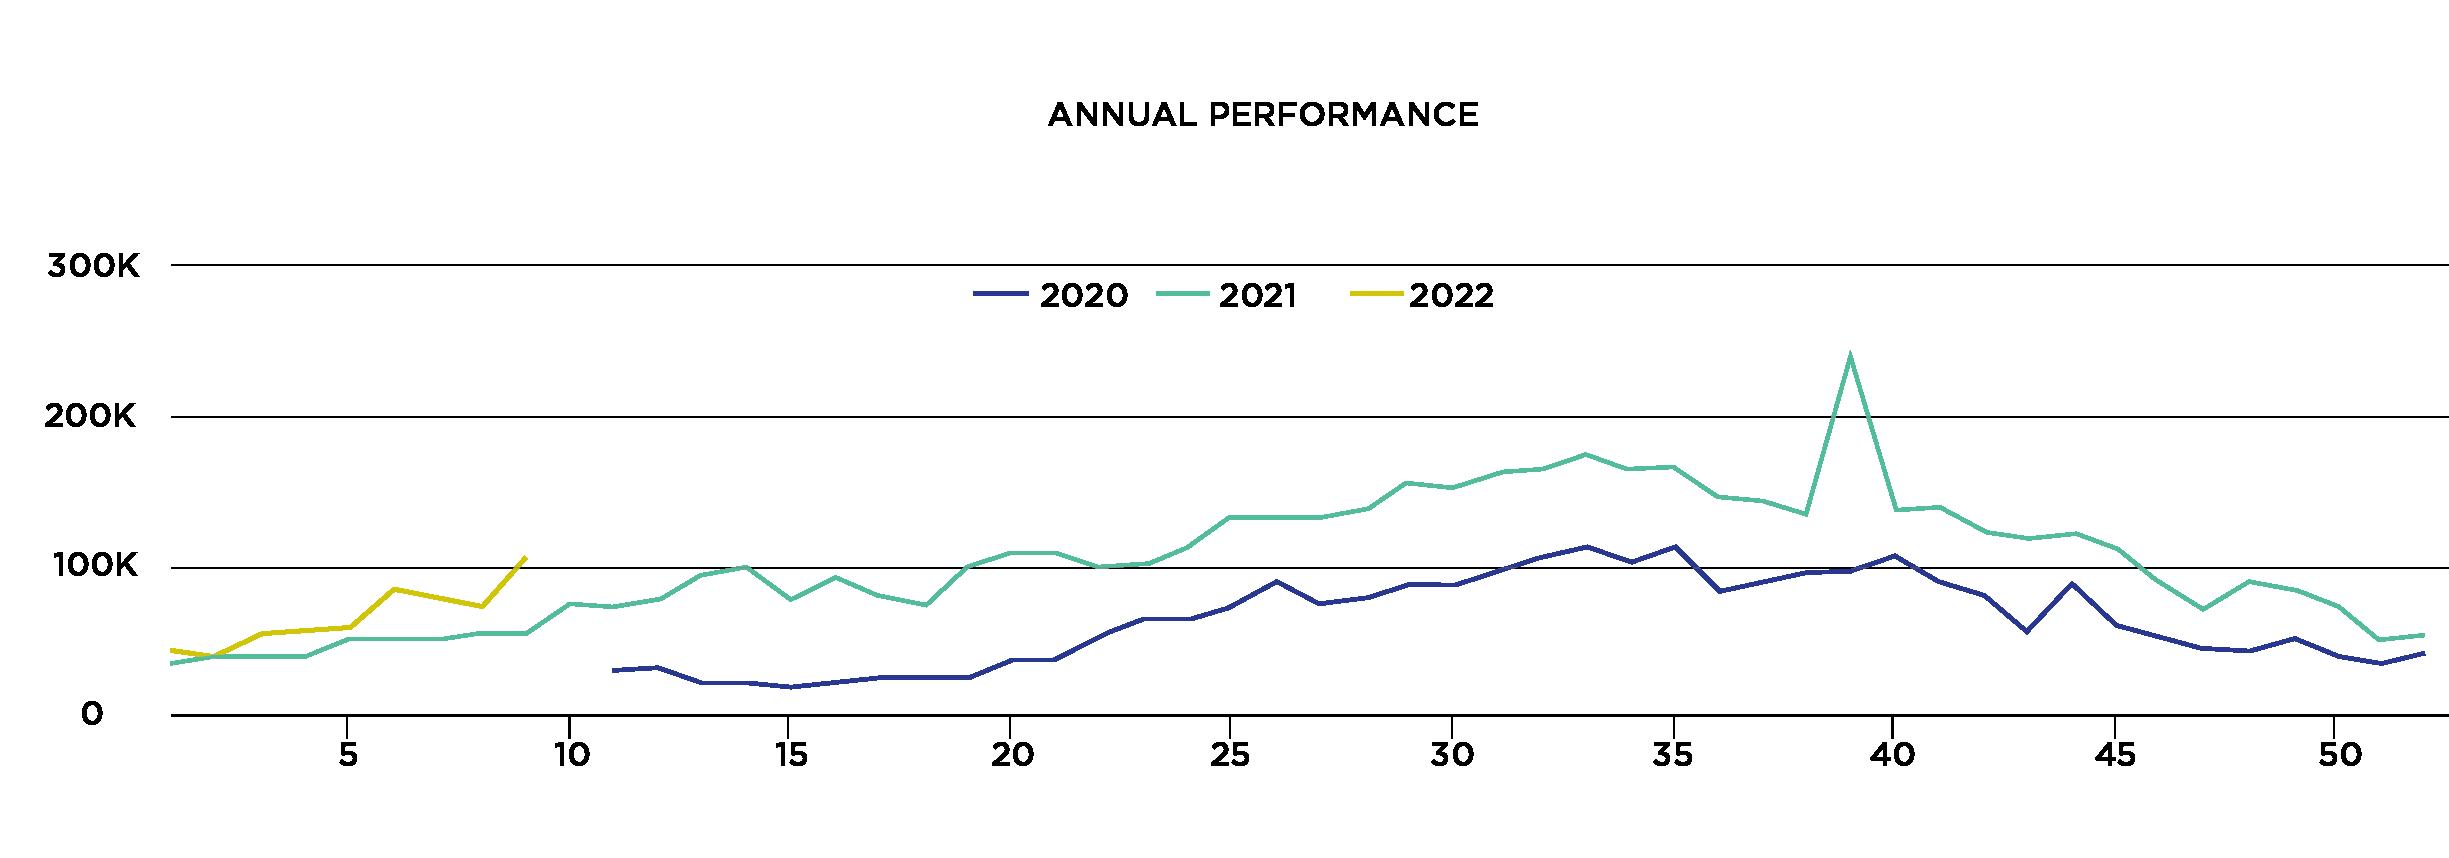
Foot traffic year over year
2019 2,700,396**
2020 1,055,833** (avail. March 30 to December 2020)
2021 2,307,163**
**YoY Range: The previous MotionLoft pedestrian counters tallied 2019 foot traffic for Trolley Circle and half a year’s worth of foot traffic on the Commons near Aurora Street/Restaurant Row. MotionLoft counters were decommissioned on Jan. 17, 2020. The new SpringBoard pedestrian counters were installed during the 14th week of 2020 (March 30-April 5), the week before NYS was shutdown. SpringBoard provided additional counters so we can measure footfalls at in all directions at three points — Trolley Circle, Aurora Street, Cayuga Street.