STATE of DOWNTOWN
2021 + 2022
FOREWORD


This edition of the State of Downtown comes at a historically unusual time. As such, this year in review includes elements of Downtown's recovery through 2021 and 2022.
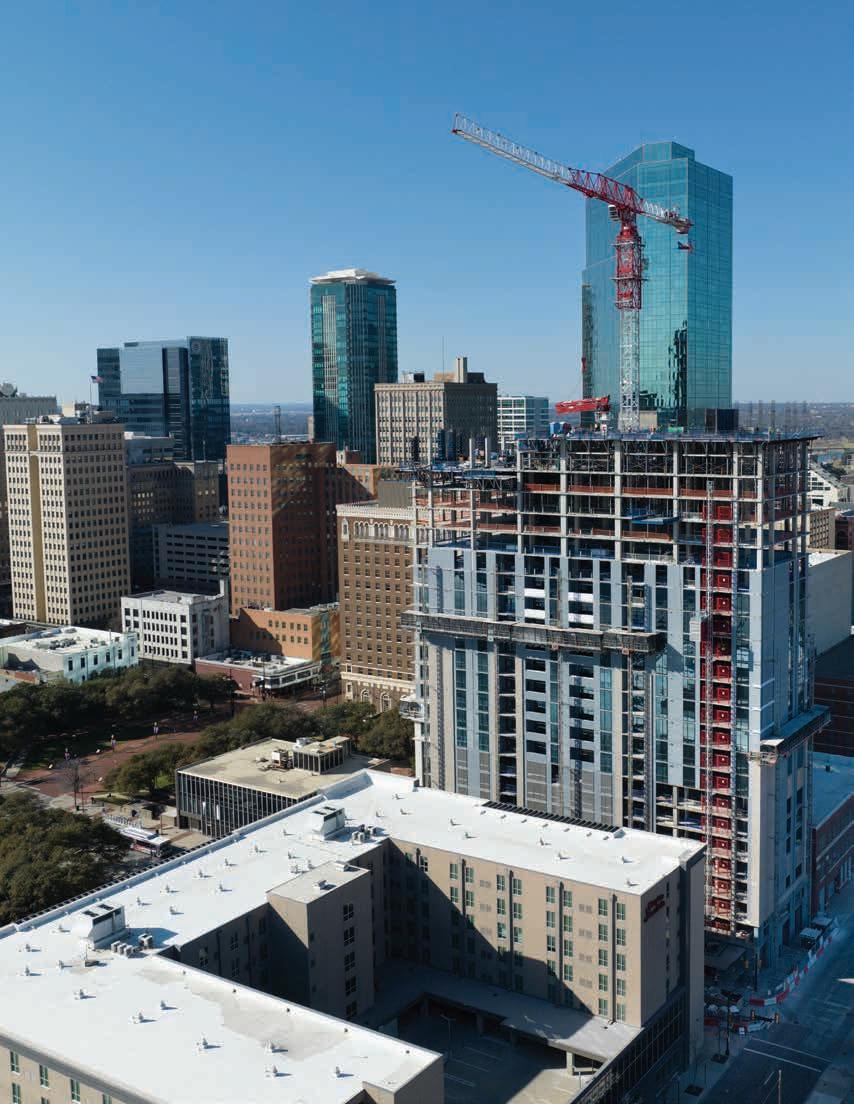
The primary 2021 Downtown Fort Worth economic indicators reflect an extraordinary post-COVID recovery. As of Q4 2022, more than $2 billion of multifamily, education, institutional, and hospitality developments are either planned or under construction. This is striking evidence that Downtown is emerging from the pandemic with great strength.
Office occupancy rebounded, but the return of office workers was slower than expected. Hotel occupancy reflects weekend and leisure travelers and conventioneers filling much of the void left by the temporarily absent business traveler. Relative to pre-COVID foot traffic, Downtown Fort Worth has recovered 90% of its retail foot traffic and 110% of its domestic tourism visits as of Q4 2022.
Residential construction continued rapidly, while announcements of new proposed high-rise apartment buildings point to a robust residential run at the top of the market. However, delivery timing may be influenced by interest rates.
There is a new energy in the southeastern portion of Downtown with the Convention Center expansion, Omni Fort Worth Hotel expansion, Texas A&M University's expansion, and Trinity Metro's proposal for a 1.2-mile railroad extension from Downtown to the Fort Worth Medical District.
The $403M funding for Panther Island has put this long-envisioned project back in focus. Downtown is picking up speed as the world and Fort Worth return to normal business cycles. The projects on the horizon are the beginning of a new wave of center city development. *Source:
Smith Director of Research
 Larry Auth Public Improvement District Board Chairman

Placer.ai
Shane
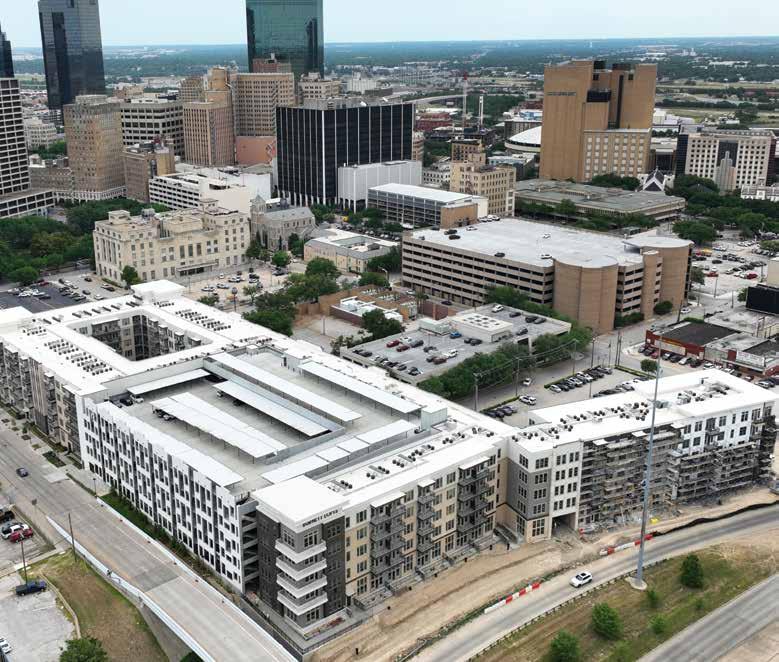
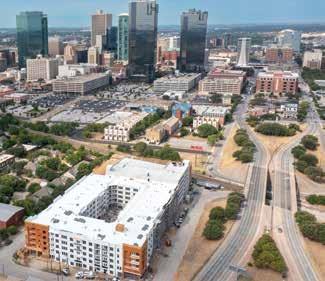
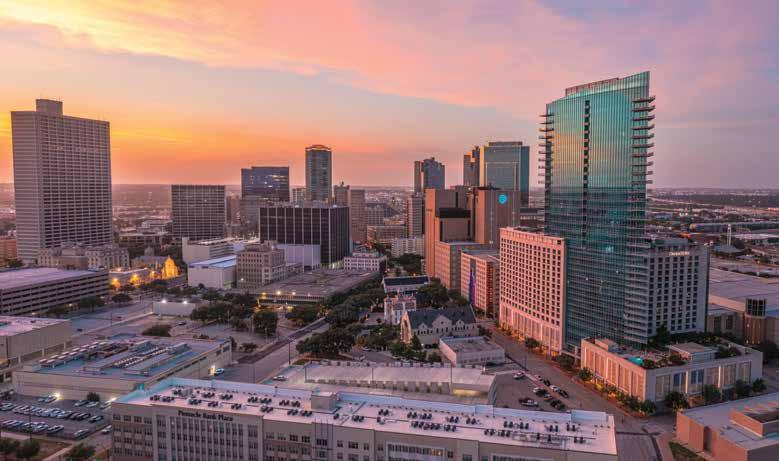
Cover Photo: Deco 969, Brian Luenser TABLE OF CONTENTS Year in Review 2 Office and Employment 12 Population and Housing 24 Hospitality 34 Retail ...............................................................................38 Quality of Life 40 Education 44 Transportation 46 PID Advisory Board 54
ABOUT US
DFWI’s Mission
The mission of Downtown Fort Worth, Inc., is to be the catalyst for transforming Downtown into a vibrant place to live, visit, enjoy, and conduct business through aggressive leadership of programs, projects, and partnerships.
Who We Are
Formed in 1981, DFWI is Downtown Fort Worth’s planning, advocacy, public space, and project management organization. DFWI also builds Downtown Fort Worth’s vitality by serving as a liaison, ombudsman, and information source for property owners, residents, business owners, lenders, developers, community organizations, and policymakers.
What We Do
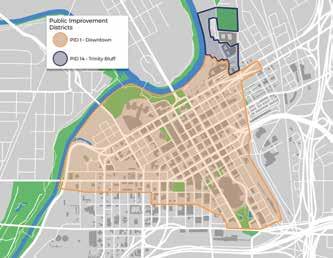
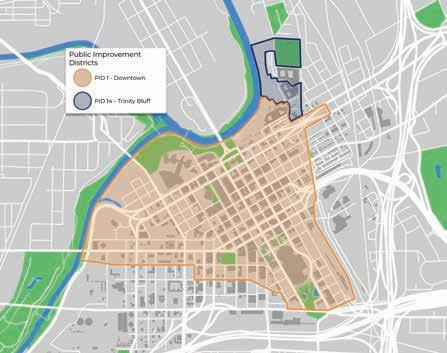
DFWI is a 501(c)(6) non-profit membership organization. In addition to coordinating the Downtown planning process, advocacy, member services, communications, and leadership, DFWI members founded the first Public Improvement District (PID) in the state of Texas in 1986. DFWI continues to manage PID #1 and manages PID #14. These PIDs provide enhanced services to property owners including maintenance and landscaping, public space management, promotions and marketing, research, transportation, planning, and security enhancements to 564 acres of Downtown.
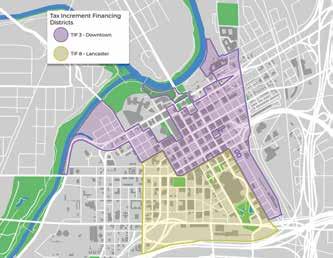
DFWI also administers the Downtown Tax Increment Finance (TIF) District by contract with the City of Fort Worth. Eligible TIF projects include parking, infrastructure assistance to new developments, historic preservation, affordable housing, transportation, and education.
DFWI staffs the Fort Worth Downtown Neighborhood Alliance, an organization of Downtown residents that promotes, preserves, encourages, and enhances residential quality of life in Downtown Fort Worth. Downtown Fort Worth Initiatives, Inc. (DFWII) is a 501(c)(3) nonprofit corporation that provides a pathway for foundation grants, philanthropic donations, and other contributions to help fund charitable, educational, and public-purpose Downtown projects. Each year DFWII helps to bring more than 260,000 people to Downtown by producing the MAIN ST. Fort Worth Arts Festival and the GM Financial Parade of Lights. DFWII also developed the JFK Tribute in Fort Worth, redeveloped Burnett Park, and is currently administering the Heritage Park restoration design.
DFWII is a partner with Fort Worth Housing Solutions in the 172-unit, mixed-income Jennings Place apartment community.
1 STATE OF DOWNTOWN FORT WORTH 2022
DOWNTOWN SUMMARY
Office Market
13.6 million square feet of total office space inventory
43% of total office space is Class A
Average rate for Class A: $32.82 per square foot
88% total office occupancy rate
Residential
Fort Worth had the third highest numeric population increase from 2020–2021 of all U.S. cities
Downtown population: 8,685 residents
906 condos and townhomes
4,241 existing apartment units
439 senior living units
3,257 additional residential units are in various stages of the planning process and currently under construction
Hotels
3,733 existing hotel rooms
15 existing hotels
1,538 additional rooms are in various stages of the planning process and currently under construction
Planned development includes an additional 600 rooms due to the Convention Center development
64% 12-month average occupancy rate
Tourism
18.3 million visits in 2022
13% of all Downtown visitors have a household income of $75,000 to $100,000
8% of Downtown visitors have household income of greater than $200,000
2 STATE
2022 YEAR
OF DOWNTOWN FORT WORTH
IN REVIEW
Transportation
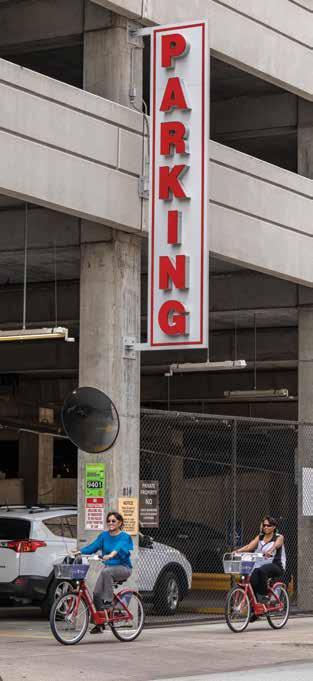
5,873 free metered parking spaces available after 6 p.m. on weekdays and all day on weekends
16 Bike Sharing stations
Trinity Railway Express rail connects Central Station to downtown Dallas Union Station in one hour
TEXRail rail connects Central Station to the DFW Airport Terminal B Station in one hour
440,500 cars a day travel the I-35W, I-30, SH 287, and SH 121 highways that service Downtown
Higher Education
3 STATE OF DOWNTOWN FORT WORTH 2022
University of Texas at Arlington Fort Worth Tarrant County College Texas A&M University School of
Texas A&M University
(planned)
Law
campus expansion
Entertainment Venues Downtown Fort Worth VENUE AVAILABLE SEATS Fort Worth Convention Center (Arena Seating) 10,418 Bass Performance Hall 2,056 AMC Palace 9 623 Four Day Weekend 212 Jubilee Theatre 147 Circle Theatre 125
YEAR IN REVIEW
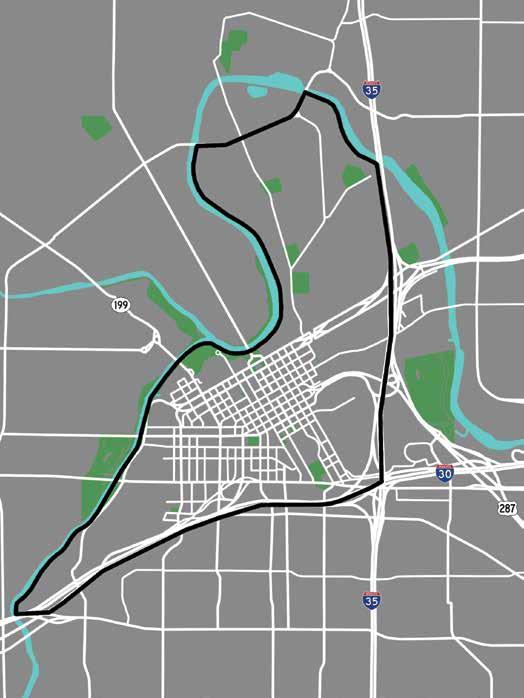
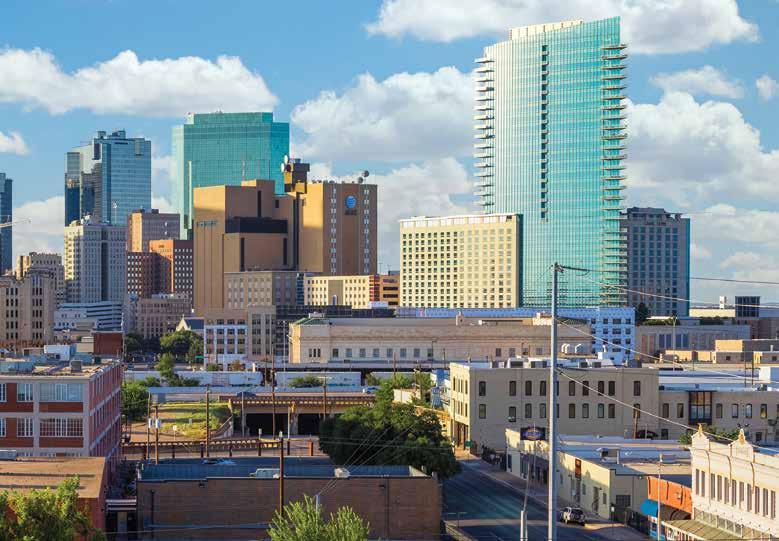
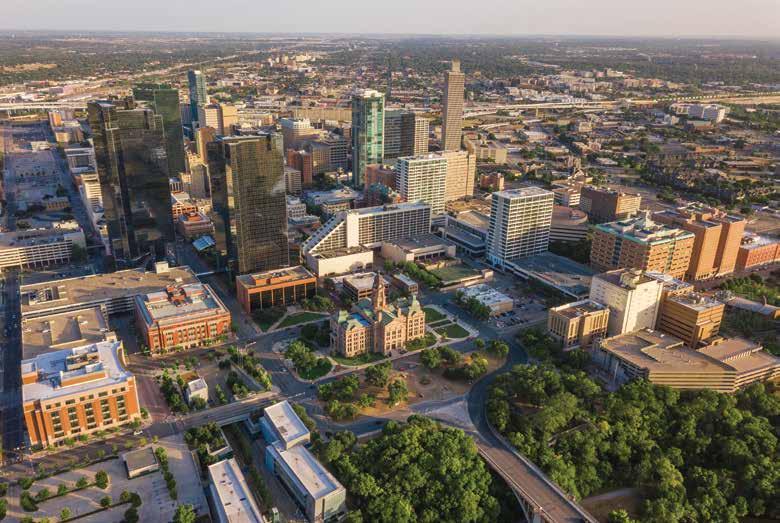
Big Picture
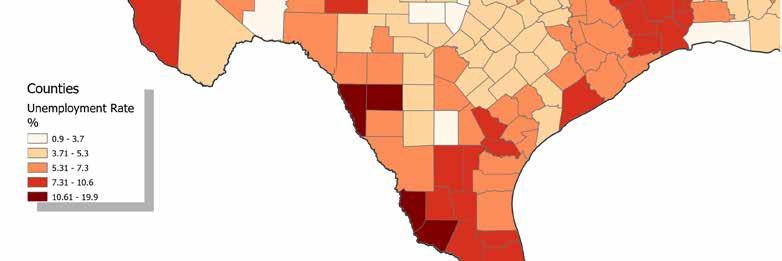
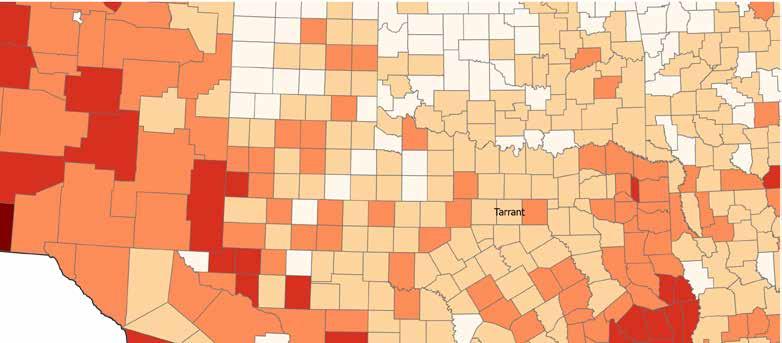
Downtown Fort Worth is a 3.3-square-mile North Texas submarket. With over 37,000 employees, Downtown Fort Worth is the densest employment center in Tarrant County. In 2020, Downtown Fort Worth generated $3.1 billion of private payroll.
The unemployment rate in Tarrant County decreased by 2.1 percentage points, from 7.4% in 2020 to 5.3% in 2021. This aligns with the United States’ recovery in the post-COVID economic environment.
The City of Fort Worth’s population is estimated to have grown by 1.9% from 2020 to 2021 to 935,508. Fort Worth topped the nation in population numeric gain making it the 13th most populated city in the U.S. In contrast, the U.S. population grew at a much slower rate of 0.1% due mainly to declining birth rates, lower international migration, and the impact of the COVID-19 pandemic.
4
STATE OF DOWNTOWN FORT WORTH 2022
Downtown Fort Worth Boundary
RateofGrowth Population

5 STATE OF DOWNTOWN FORT WORTH 2022 Fort Worth Population Growth DFW Population Growth 950,000 900,000 850,000 800,000 750,000 700,000 4% 3% 2% 3% 2% 1% 1% 0% 2011 2012 2013 2014 2015 2016 2017 2018 2019 2020 2021 2022 Rateof Growth Population 8,000,000 7,800,000 7,600,000 7,200,000 6,800,000 6,400,000 7,400,000 7,000,000 6,600,000 6,200,000 2.5% 2.1% 1.7% 1.1% 0.7% 1.9% 2.3% 1.5% 0.9% 0.5% 2010 2011 2012 2013 2014 2015 2016 2017 2018 2019 2020 2021
Source: City of Fort Worth, U.S. Census Source: U.S. Census
YEAR IN REVIEW
Office:
Downtown’s Class A occupancy rate slipped from 81% in Q4 2019 to 79% in Q4 2022. Class A space represents 40% of Downtown’s 13M square feet of total office space.
The occupancy rate for total office space is exhibiting a slight downtrend from its pandemic levels. However, there has been a decreasing trend in office occupancy since 2015. This downward trend is a result of the 2008 recession, the oil and gas crash from 2014-2016, and COVID. Further diversification of Downtown’s industry base will reverse this trend and insulate Downtown from industrial market volatility.
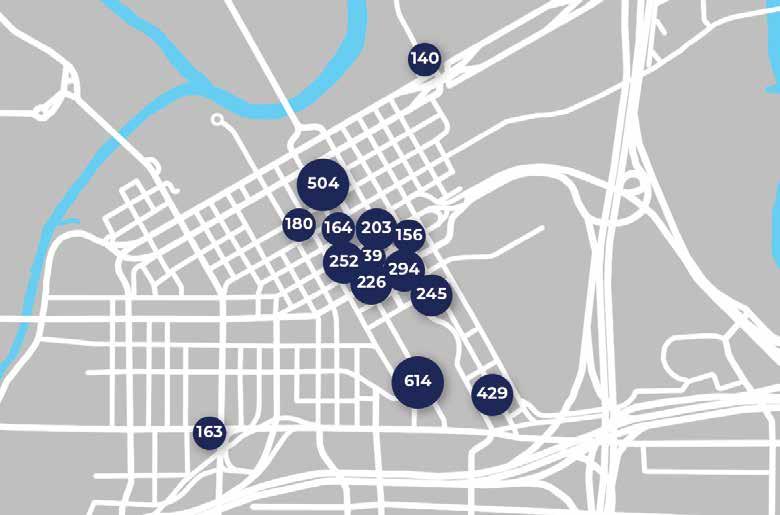
Class A Office Occupancy Rates
Class A Office Buildings
6 STATE OF DOWNTOWN FORT WORTH 2022
Source: CoStar Source: CoStar
0 200,000 400,000 600,000 1,000,000 800,000 1,200,000 Burnett Plaza 777 Main Bank of America Tower – City Center Wells Fargo Tower – City Center Frost Tower Two City Place The Carnegie – Sundance Square The Chase Bank Building – Sundance Square One City Place Summit Building 2 Summit Building 1 The Cassidy Building – Sundance Square
Westbrook Building – Sundance Square
Building Area in SF
The
Rentable
90% 85% 95% 80% 75% 70% 65% 60% 2012 Q1 2012 Q2 2012 Q3 2012 Q4 2013 Q1 2013 Q2 2013 Q3 2013 Q4 2014 Q1 2014 Q2 2014 Q3 2014 Q4 2015 Q1 2015 Q2 2015 Q3 2015 Q4 2016 Q1 2016 Q2 2016 Q3 2016 Q4 2017 Q1 2017 Q2 2017 Q3 2017 Q4 2018 Q1 2018 Q2 2018 Q3 2018 Q4 2019 Q1 2019 Q2 2019 Q3 2019 Q4 2020 Q1 2020 Q2 2020 Q3 2020 Q4 2021 Q1 2021 Q2 2021 Q3 2021 Q4 2022 Q1 2022 Q2 2022 Q3 2022 Q4
Total Office Occupancy Rates
Oil and Gas Collapse
Unemployment Rates from 2012–2022
Average Payroll Per Employee
7 STATE OF DOWNTOWN FORT WORTH 2022
Source: BLS, LAUS; not seasonally adjusted Source: CoStar DFW Texas 14% 12% 10% 8% 6% 4% 2% 0% 2012 Q1 2012 Q2 2012 Q3 2012 Q4 2013 Q1 2013 Q2 2013 Q3 2013 Q4 2014 Q1 2014 Q2 2014 Q3 2014 Q4 2015 Q1 2015 Q2 2015 Q3 2015 Q4 2016 Q1 2016 Q2 2016 Q3 2016 Q4 2017 Q1 2017 Q2 2017 Q3 2017 Q4 2018 Q1 2018 Q2 2018 Q3 2018 Q4 2019 Q1 2019 Q2 2019 Q3 2019 Q4 2020 Q1 2020 Q2 2020 Q3 2020 Q4 2021 Q1 2021 Q2 2021 Q3 2021 Q4 2022 Q1 2022 Q2 2022 Q3 2022 Q4 Source: U.S. Census Bureau, CBP 2020 Payroll ZIP CODE (SUBMARKET) PRIVATE-SECTOR EMPLOYEES PAYROLL 76102 (Downtown) 37,971 $3,086,162,000 76104 (Near Southside) 34,709 $2,395,583,000 76107 (West Side) 27,490 $1,331,326,000 $70,000 $60,000 $90,000 $80,000 $50,000 $40,000 $30,000 $20,000 $0 Downtown Fort Worth Near Southside West Side 92% 90% 88% 86% 84% 82% 80% 78% 76% 2012 Q1 2012 Q2 2012 Q3 2012 Q4 2013 Q1 2013 Q2 2013 Q3 2013 Q4 2014 Q1 2014 Q2 2014 Q3 2014 Q4 2015 Q1 2015 Q2 2015 Q3 2015 Q4 2016 Q1 2016 Q2 2016 Q3 2016 Q4 2017 Q1 2017 Q2 2017 Q3 2017 Q4 2018 Q1 2018 Q2 2018 Q3 2018 Q4 2019 Q1 2019 Q2 2019 Q3 2019 Q4 2020 Q1 2020 Q2 2020 Q3 2020 Q4 2021 Q1 2021 Q2 2021 Q3 2021 Q4 2022 Q1 2022 Q2 2022 Q3 2022 Q4 COVID
YEAR IN REVIEW
Apartments:
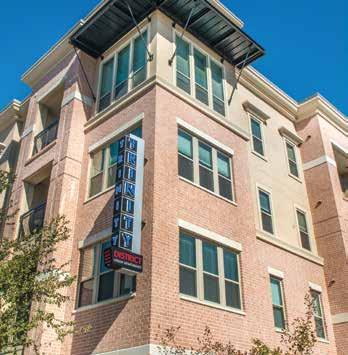
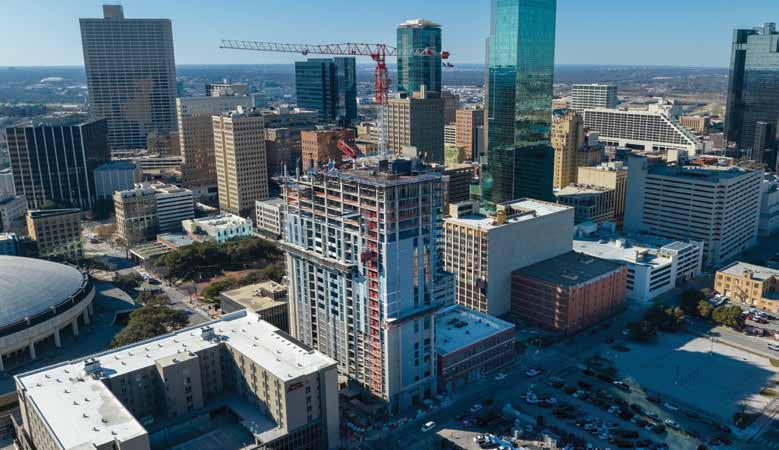
Downtown’s apartment inventory is 4,241 units. Developments in the planning process indicate significant residential growth with 3,021 additional units in the pipeline. As of Q4 2022, there are 1,264 apartment units currently under construction. This includes Deco 969, with 302 apartments, expected to open in 2023.
Downtown’s apartment occupancy rate as of Q4 2022 is 90%, significantly above its pre-pandemic level of 73% in Q1 2019. There have been 717 additional units completed since 2019. Since Q1 2019, the average apartment rent per square foot has increased by 10.7%. Downtown concession rates are at 0.9%, their lowest since 2015. This, combined with rising market rents and low vacancies, indicates high demand for Downtown apartments.
8 STATE OF DOWNTOWN FORT WORTH 2022
Burnett Lofts
9 STATE OF DOWNTOWN FORT WORTH 2022 Average Apartment Occupancy Rate Downtown Fort Worth 100% 95% 90% 85% 80% 75% 70% 65% 2012 Q1 2012 Q2 2012 Q3 2012 Q4 2013 Q1 2013 Q2 2013 Q3 2013 Q4 2014 Q1 2014 Q2 2014 Q3 2014 Q4 2015 Q1 2015 Q2 2015 Q3 2015 Q4 2016 Q1 2016 Q2 2016 Q3 2016 Q4 2017 Q1 2017 Q2 2017 Q3 2017 Q4 2018 Q1 2018 Q2 2018 Q3 2018 Q4 2019 Q1 2019 Q2 2019 Q3 2019 Q4 2020 Q1 2020 Q2 2020 Q3 2020 Q4 2021 Q1 2021 Q2 2021 Q3 2021 Q4 2022 Q1 2022 Q2 2022 Q3 2022 Q4 Source: CoStar Average Apartment Rent Per Square Foot Downtown Fort Worth Downtown Apartment Concession Rate $2.00 $1.90 $1.80 $1.70 $1.60 $1.50 $1.40 $1.30 2012 Q1 2012 Q2 2012 Q3 2012 Q4 2013 Q1 2013 Q2 2013 Q3 2013 Q4 2014 Q1 2014 Q2 2014 Q3 2014 Q4 2015 Q1 2015 Q2 2015 Q3 2015 Q4 2016 Q1 2016 Q2 2016 Q3 2016 Q4 2017 Q1 2017 Q2 2017 Q3 2017 Q4 2018 Q1 2018 Q2 2018 Q3 2018 Q4 2019 Q1 2019 Q2 2019 Q3 2019 Q4 2020 Q1 2020 Q2 2020 Q3 2020 Q4 2021 Q1 2021 Q2 2021 Q3 2021 Q4 2022 Q1 2022 Q2 2022 Q3 2022 Q4 Source: CoStar Source: CoStar 5.0% 4.5% 4.0% 3.5% 3.0% 2.5% 2.0% 1.5% 1.0% 0.5% 0% 2012 Q1 2012 Q2 2012 Q3 2012 Q4 2013 Q1 2013 Q2 2013 Q3 2013 Q4 2014 Q1 2014 Q2 2014 Q3 2014 Q4 2015 Q1 2015 Q2 2015 Q3 2015 Q4 2016 Q1 2016 Q2 2016 Q3 2016 Q4 2017 Q1 2017 Q2 2017 Q3 2017 Q4 2018 Q1 2018 Q2 2018 Q3 2018 Q4 2019 Q1 2019 Q2 2019 Q3 2019 Q4 2020 Q1 2020 Q2 2020 Q3 2020 Q4 2021 Q1 2021 Q2 2021 Q3 2021 Q4 2022 Q1 2022 Q2 2022 Q3 2022 Q4
YEAR IN REVIEW
Hospitality:
Downtown’s current hotel inventory includes over 3,700 rooms, with 538 additional rooms currently under construction. In addition, the city is planning a 600-1,000-room Convention Center hotel alongside the future Convention Center expansion.
Currently, the Sandman is renovating the nearly century-old Waggoner Building into a 245-room Sandman Signature Hotel. Also, Le Meridien is renovating The Hilton Annex to be a 13-story, 189-room hotel. The Avid Hotel on Samuels Avenue will add 104 additional rooms to Downtown’s inventory.
As with other industries, the pandemic exposed hotels to dramatic shifts in travel, convention, and tourism demand. Downtown hotels today show signs of recovery with a 64% occupancy rate as of Q4 2022. This is just one percentage point lower than the DFW metroplex rate of 65%. The return of business travelers and conventioneers and the Convention Center expansion will add significantly to Downtown room demand.
Hotel Occupancy Rates
10 STATE OF DOWNTOWN FORT WORTH 2022
Source: CoStar 80% 40% 50% 60% 70% 20% 30% 10% 0% Jan 2017 Apr 2017 Jul 2017 Oct 2017 Jan 2018 Apr 2018 Jul 2018 Oct 2018 Jan 2019 Apr 2019 Jul 2019 Oct 2019 Jan 2020 Apr 2020 Jul 2020 Oct 2020 Jan 2021 Apr 2021 Jul 2021 Oct 2021 Jan 2022 Apr 2022 Jul 2022 Oct 2022 Downtown Fort Worth Dallas CBD DFW Metroplex Source: CoStar Downtown Hotel RevPAR by Class $120 $140 $80 $100 $40 $60 $20 $0 Luxury & Upper Upscale Upscale & Upper Midscale Jan 2017 Apr 2017 Jul 2017 Oct 2017 Jan 2018 Apr 2018 Jul 2018 Oct 2018 Jan 2019 Apr 2019 Jul 2019 Oct 2019 Jan 2020 Apr 2020 Jul 2020 Oct 2020 Jan 2021 Apr 2021 Jul 2021 Oct 2021 Jan 2022 Apr 2022 Jul 2022 Oct 2022
Hotel Revenue Per Available Room
Retail:
Downtown contains a variety of restaurants, retail shops, and entertainment venues. Visitor traffic for 2022 was 18.4 million, an 8% increase from 2021, yet 18% lower than pre-pandemic traffic of 2019.
Retail Chain Recovery Domestic Tourism Recovery
Downtown Fort Worth Visits by Month
11 STATE OF DOWNTOWN FORT WORTH 2022
2.5 Visits Per Million 1.5 1.0 2.0 0.5 0.0 2022 Visits 2021 Visits 2020 Visits 2019 Visits January Feburary March April June May August July October September November December Source: Placer.ai Source: Placer.ai
Source: CoStar $120 $140 $80 $100 $40 $60 $20 $0 Downtown Fort Worth Dallas CBD DFW Metroplex Jan 2017 Apr 2017 Jul 2017 Oct 2017 Jan 2018 Apr 2018 Jul 2018 Oct 2018 Jan 2019 Apr 2019 Jul 2019 Oct 2019 Jan 2020 Apr 2020 Jul 2020 Oct 2020 Jan 2021 Apr 2021 Jul 2021 Oct 2021 Jan 2022 Apr 2022 Jul 2022 Oct 2022 -11% compared to Oct. 2019 89% +9% compared to Oct. 2019 109%
OFFICE AND EMPLOYMENT
COMPANIES GET MORE IN DOWNTOWN.
The Downtown office market has largely recovered from COVID-related losses and appears to be on an upward trend. The “flight to quality” that seems to be bolstering other center city markets nationwide may be in play in Fort Worth too. Office tenants are upgrading their current offices to amenity-rich Class A space. Even so, with a 15% total office vacancy rate, there are still more office space options in Downtown now than in recent years. With a Downtown presence in the third fastest growing city in the nation,* companies get a location that is a magnet for talent and growth. From scores of restaurants and stores within easy walking distance to hotels, conference facilities, and mass transit, Downtown is Fort Worth’s leader in office-related amenities.
37,971 total number of employees
1,453 total number of businesses $3.1 Billion in private payroll
Office Occupancy Rate Downtown Fort Worth
95% 90% 85% 80% 75% 70% 65% 2012 Q1 2012 Q2 2012 Q3 2012 Q4 2013 Q1 2013 Q2 2013 Q3 2013 Q4 2014 Q1 2014 Q2 2014 Q3 2014 Q4 2015 Q1 2015 Q2 2015 Q3 2015 Q4 2016 Q1 2016 Q2 2016 Q3 2016 Q4 2017 Q1 2017 Q2 2017 Q3 2017 Q4 2018 Q1 2018 Q2 2018 Q3 2018 Q4 2019 Q1 2019 Q2 2019 Q3 2019 Q4 2020 Q1 2020 Q2 2020 Q3 2020 Q4 2021 Q1 2021 Q2 2021 Q3 2021 Q4 2022 Q1 2022 Q2 2022 Q3 2022 Q4
Source: CoStar STATE OF DOWNTOWN FORT WORTH 2022 12
Source: U.S. Census, CBP 2020 *U.S. Census 2022
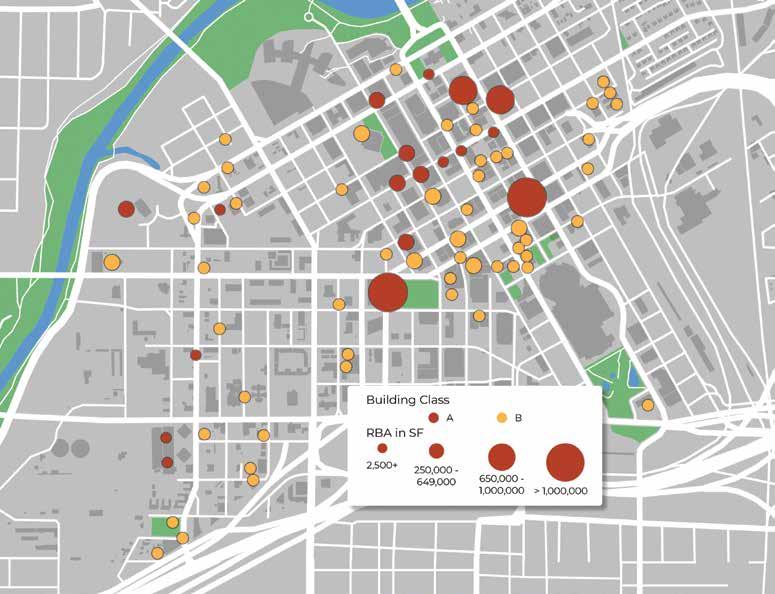
Class A Office Buildings 13 0 200,000 400,000 600,000 1,000,000 800,000 1,200,000 Burnett Plaza 777 Main Bank of America Tower – City Center Wells Fargo Tower – City Center Frost Tower Two City Place The Carnegie – Sundance Square The Chase Bank Building – Sundance Square One City Place Summit Building 2 Summit Building 1 The Cassidy Building – Sundance Square The Westbrook Building – Sundance Square Rentable Building Area in SF 5,656,310 square feet of Class A office space STATE OF DOWNTOWN FORT WORTH 2022
United States – Office Space
OFFICE AND EMPLOYMENT
Dallas CBD – Office Space

Source: CoStar Source: CoStar 50,000,000 30,000,000 10,000,000 (10,000,000) (30,000,000) (50,000,000) (70,000,000) (90,000,000) (1,500,000) 300,000 200,000 100,000 0 (200,000) (400,000) (300,000) (500,000) (100,000) 14% 8% 10% 12% 6% 4% 2% 0% 0% 18% 6% 20% 8% 10% 12% 14% 16% 4% 2% 0% 2012 Q1 2012 Q2 2012 Q3 2012 Q4 2013 Q1 2013 Q2 2013 Q3 2013 Q4 2014 Q1 2014 Q2 2014 Q3 2014 Q4 2015 Q1 2015 Q2 2015 Q3 2015 Q4 2016 Q1 2016 Q2 2016 Q3 2016 Q4 2017 Q1 2017 Q2 2017 Q3 2017 Q4 2018 Q1 2018 Q2 2018 Q3 2018 Q4 2019 Q1 2019 Q2 2019 Q3 2019 Q4 2020 Q1 2020 Q2 2020 Q3 2020 Q4 2021 Q1 2021 Q2 2021 Q3 2021 Q4 2022 Q1 2022 Q2 2022 Q3 2022 Q4 2012 Q1 2012 Q2 2012 Q3 2012 Q4 2013 Q1 2013 Q2 2013 Q3 2013 Q4 2014 Q1 2014 Q2 2014 Q3 2014 Q4 2015 Q1 2015 Q2 2015 Q3 2015 Q4 2016 Q1 2016 Q2 2016 Q3 2016 Q4 2017 Q1 2017 Q2 2017 Q3 2017 Q4 2018 Q1 2018 Q2 2018 Q3 2018 Q4 2019 Q1 2019 Q2 2019 Q3 2019 Q4 2020 Q1 2020 Q2 2020 Q3 2020 Q4 2021 Q1 2021 Q2 2021 Q3 2021 Q4 2022 Q1 2022 Q2 2022 Q3 2022 Q4 Net Absorption Net Deliveries Vacancy Net Absorption Net Deliveries Vacancy 2012 Q1 2012 Q2 2012 Q3 2012 Q4 2013 Q1 2013 Q2 2013 Q3 2013 Q4 2014 Q1 2014 Q2 2014 Q3 2014 Q4 2015 Q1 2015 Q2 2015 Q3 2015 Q4 2016 Q1 2016 Q2 2016 Q3 2016 Q4 2017 Q1 2017 Q2 2017 Q3 2017 Q4 2018 Q1 2018 Q2 2018 Q3 2018 Q4 2019 Q1 2019 Q2 2019 Q3 2019 Q4 2020 Q1 2020 Q2 2020 Q3 2020 Q4 2021 Q1 2021 Q2 2021 Q3 2021 Q4 2022 Q1 2022 Q2 2022 Q3 2022 Q4 Net Absorption Net Deliveries Vacancy 50,000,000 30,000,000 1,500,000 1,000,000 500,000 0 (500,000) (1,500,000) (1,000,000) 300,000 14% 12% 35% 25% 15% 30% 20% 10% 5% 0% 20% 2012 Q1 2012 Q2 2012 Q3 2012 Q4 2013 Q1 2013 Q2 2013 Q3 2013 Q4 2014 Q1 2014 Q2 2014 Q3 2014 Q4 2015 Q1 2015 Q2 2015 Q3 2015 Q4 2016 Q1 2016 Q2 2016 Q3 2016 Q4 2017 Q1 2017 Q2 2017 Q3 2017 Q4 2018 Q1 2018 Q2 2018 Q3 2018 Q4 2019 Q1 2019 Q2 2019 Q3 2019 Q4 2020 Q1 2020 Q2 2020 Q3 2020 Q4 2021 Q1 2021 Q2 2021 Q3 2021 Q4 2022 Q1 2022 Q2 2022 Q3 2022 Q4 Net Absorption Net Deliveries Vacancy Net Absorption Net Deliveries Vacancy STATE OF DOWNTOWN FORT WORTH 2022 14
Fort Worth CBD – Office Space
Class A Office Occupancy Rates
Source: CoStar 300,000 200,000 100,000 0 (200,000) (400,000) (300,000) (500,000) (100,000) 18% 6% 20% 8% 10% 12% 14% 16% 4% 2% 0% 2012 Q1 2012 Q2 2012 Q3 2012 Q4 2013 Q1 2013 Q2 2013 Q3 2013 Q4 2014 Q1 2014 Q2 2014 Q3 2014 Q4 2015 Q1 2015 Q2 2015 Q3 2015 Q4 2016 Q1 2016 Q2 2016 Q3 2016 Q4 2017 Q1 2017 Q2 2017 Q3 2017 Q4 2018 Q1 2018 Q2 2018 Q3 2018 Q4 2019 Q1 2019 Q2 2019 Q3 2019 Q4 2020 Q1 2020 Q2 2020 Q3 2020 Q4 2021 Q1 2021 Q2 2021 Q3 2021 Q4 2022 Q1 2022 Q2 2022 Q3 2022 Q4 Net Absorption Net Deliveries Vacancy 2012 Q1 2012 Q2 2012 Q3 2012 Q4 2013 Q1 2013 Q2 2013 Q3 2013 Q4 2014 Q1 2014 Q2 2014 Q3 2014 Q4 2015 Q1 2015 Q2 2015 Q3 2015 Q4 2016 Q1 2016 Q2 2016 Q3 2016 Q4 2017 Q1 2017 Q2 2017 Q3 2017 Q4 2018 Q1 2018 Q2 2018 Q3 2018 Q4 2019 Q1 2019 Q2 2019 Q3 2019 Q4 2020 Q1 2020 Q2 2020 Q3 2020 Q4 2021 Q1 2021 Q2 2021 Q3 2021 Q4 2022 Q1 2022 Q2 2022 Q3 2022 Q4 Net Absorption Net Deliveries Vacancy 95% 90% 85% 80% 75% 70% 65% 60% 2012 Q1 2012 Q2 2012 Q3 2012 Q4 2013 Q1 2013 Q2 2013 Q3 2013 Q4 2014 Q1 2014 Q2 2014 Q3 2014 Q4 2015 Q1 2015 Q2 2015 Q3 2015 Q4 2016 Q1 2016 Q2 2016 Q3 2016 Q4 2017 Q1 2017 Q2 2017 Q3 2017 Q4 2018 Q1 2018 Q2 2018 Q3 2018 Q4 2019 Q1 2019 Q2 2019 Q3 2019 Q4 2020 Q1 2020 Q2 2020 Q3 2020 Q4 2021 Q1 2021 Q2 2021 Q3 2021 Q4 2022 Q1 2022 Q2 2022 Q3 2022 Q4 Fort Worth CBD Dallas CBD
Downtown Fort Worth Source: CoStar 15 STATE OF DOWNTOWN FORT WORTH 2022
Metro Area Office Vacancy Rates
12 per. mov. avg. 20% 18% 16% 12% 14% 10% 8% 6% 4% 2% 0% 2012 2013 2014 2015 2016 2017 2018 2019 2020 2021 2022 40% 35% 25% 20% 30% 15% 10% 5% 0% 2012 2013 2014 2015 2016 2017 2018 2019 2020 2021 2022 20% 18% 16% 14% 12% 10% 8% 6% 4% 2% 0% 2012 2013 2014 2015 2016 2017 2018 2019 2020 2021 2022 25% 20% 15% 10% 5% 0% 2012 2013 2014 2015 2016 2017 2018 2019 2020 2021 2022 30% 25% 20% 15% 10% 5% 0% 2012 2013 2014 2015 2016 2017 2018 2019 2020 2021 2022 25% 20% 15% 10% 5% 0% 2012 2013 2014 2015 2016 2017 2018 2019 2020 2021 2022 20% 18% 16% 14% 12% 10% 8% 6% 4% 2% 0% 2012 2013 2014 2015 2016 2017 2018 2019 2020 2021 2022 18% 16% 14% 12% 10% 8% 6% 4% 2% 0% 2012 2013 2014 2015 2016 2017 2018 2019 2020 2021 2022
OFFICE AND EMPLOYMENT
Source: CoStar –Q1 2022 Downtown Fort Worth Dallas Stemmons Freeway
Dallas CBD Dallas West LBJ Freeway Dallas Uptown Dallas Central Expressway Las Colinas STATE OF DOWNTOWN FORT WORTH 2022 16
Frisco/The Colony
Metro Area Class A Office Vacancy Rates

30% 25% 20% 15% 10% 5% 0% 2012 2013 2014 2015 2016 2017 2018 2019 2020 2021 2022 40% 35% 25% 20% 30% 15% 10% 5% 0% 2012 2013 2014 2015 2016 2017 2018 2019 2020 2021 2022 25% 20% 15% 10% 5% 0% 2012 2013 2014 2015 2016 2017 2018 2019 2020 2021 2022 35% 30% 25% 20% 15% 10% 5% 0% 2012 2013 2014 2015 2016 2017 2018 2019 2020 2021 2022 35% 30% 25% 20% 15% 10% 5% 0% 2012 2013 2014 2015 2016 2017 2018 2019 2020 2021 2022 25% 20% 15% 10% 5% 0% 2012 2013 2014 2015 2016 2017 2018 2019 2020 2021 2022 25% 20% 15% 10% 5% 0% 2012 2013 2014 2015 2016 2017 2018 2019 2020 2021 2022 20% 16% 18% 14% 12% 10% 8% 4% 2% 6% 0% 2012 2013 2014 2015 2016 2017 2018 2019 2020 2021 2022 12 per. mov. avg.
Source: CoStar –Q1 2022 Downtown Fort Worth Dallas Stemmons Freeway
Colony Dallas CBD Dallas West LBJ Freeway Dallas Uptown Dallas Central Expressway Las Colinas 17 STATE OF DOWNTOWN FORT WORTH 2022
Frisco/The
Metro Area Class A Office Market Rent ($/SF)
OFFICE AND EMPLOYMENT
Source: CoStar –Q1 2022 $35 $25 $30 $20 $15 $10 $5 $0 2012 2013 2014 2015 2016 2017 2018 2019 2020 2021 2022 $35 $25 $30 $20 $15 $10 $5 $0 2012 2013 2014 2015 2016 2017 2018 2019 2020 2021 2022 $40 $35 $25 $15 $30 $20 $10 $5 $0 2012 2013 2014 2015 2016 2017 2018 2019 2020 2021 2022 $30 $25 $20 $15 $10 $5 $0 2012 2013 2014 2015 2016 2017 2018 2019 2020 2021 2022 $35 $30 $25 $20 $15 $10 $5 $0 2012 2013 2014 2015 2016 2017 2018 2019 2020 2021 2022 $35 $30 $25 $20 $15 $10 $5 $0 2012 2013 2014 2015 2016 2017 2018 2019 2020 2021 2022 $45 $40 $35 $30 $25 $20 $15 $10 $5 $0 2012 2013 2014 2015 2016 2017 2018 2019 2020 2021 2022 $50 $40 $45 $35 $30 $25 $20 $15 $10 $5 $0 2012 2013 2014 2015 2016 2017 2018 2019 2020 2021 2022 12 per. mov. avg. Downtown Fort Worth Dallas Stemmons Freeway Frisco/The
Dallas CBD
West LBJ Freeway Dallas Uptown Dallas Central Expressway Las Colinas STATE OF DOWNTOWN FORT WORTH 2022 18
Colony
Dallas
Metro Area Class B Office Market Rent ($/SF)
Source: CoStar –Q1 2022 $35 $30 $25 $20 $15 $10 $5 $0 2012 2013 2014 2015 2016 2017 2018 2019 2020 2021 2022 $30 $25 $20 $15 $10 $5 $0 2012 2013 2014 2015 2016 2017 2018 2019 2020 2021 2022 $25 $20 $15 $10 $5 $0 2012 2013 2014 2015 2016 2017 2018 2019 2020 2021 2022 $30 $25 $15 $20 $10 $5 $0 2012 2013 2014 2015 2016 2017 2018 2019 2020 2021 2022 $25 $20 $15 $10 $5 $0 2012 2013 2014 2015 2016 2017 2018 2019 2020 2021 2022 $20 $18 $16 $14 $12 $10 $8 $6 $4 $2 $0 2012 2013 2014 2015 2016 2017 2018 2019 2020 2021 2022 $30 $25 $15 $20 $10 $5 $0 2012 2013 2014 2015 2016 2017 2018 2019 2020 2021 2022 $30 $25 $15 $20 $10 $5 $0 2012 2013 2014 2015 2016 2017 2018 2019 2020 2021 2022 12 per. mov. avg. Downtown Fort Worth
Stemmons Freeway
Colony Dallas CBD
West LBJ Freeway Dallas Uptown Dallas Central Expressway Las Colinas 19 STATE OF DOWNTOWN FORT WORTH 2022
Dallas
Frisco/The
Dallas
OFFICE AND EMPLOYMENT
Average Market Rent ($/SF) for Class A and B Office

Downtown Fort Worth Source: CoStar STATE OF DOWNTOWN FORT WORTH 2022 20
Average Office Market Rent ($/SF)
Q4 2022 Source: CoStar $20 $30 $40 $60 $50 $10 $0 Class A Class B Frisco Mid-Cities Las Colinas Fort Worth Southwest Alliance Downtown Fort Worth Dallas Uptown Dallas Stemmons Freeway Dallas Central Expressway Downtown Dallas Dallas LBJ Dallas Preston Center $35.0 $30.0 $25.0 $20.0 $15.0 $10.0 $5.0 $0 35% 40% 45% 50% 30% 25% 20% 15% 10% 5% 0% 2012 Q1 2012 Q2 2012 Q3 2012 Q4 2013 Q1 2013 Q2 2013 Q3 2013 Q4 2014 Q1 2014 Q2 2014 Q3 2014 Q4 2015 Q1 2015 Q2 2015 Q3 2015 Q4 2016 Q1 2016 Q2 2016 Q3 2016 Q4 2017 Q1 2017 Q2 2017 Q3 2017 Q4 2018 Q1 2018 Q2 2018 Q3 2018 Q4 2019 Q1 2019 Q2 2019 Q3 2019 Q4 2020 Q1 2020 Q2 2020 Q3 2020 Q4 2021 Q1 2021 Q2 2021 Q3 2021 Q4 2022 Q1 2022 Q2 2022 Q3 2022 Q4 Class B Class Spread in % Class A
Unemployment Rates from 2012-2022
Source: Source: BLS, LAUS; not seasonally adjusted 21 STATE OF DOWNTOWN FORT WORTH 2022 12.0% 11.0% 10.0% 9.0% 8.0% 7.0% 6.0% 5.0% 4.0% 3.0% City of Fort Worth City of Dallas Texas Unemployment Rtae Jan 2020 Feb 2020 Mar 2020 Apr 2020 May 2020 Jun 2020 Jul 2020 Aug 2020 Sep 2020 Oct 2020 Nov 2020 Dec 2020 Jan 2021 Feb 2021 Mar 2021 Apr 2021 May 2021 Jun 2021 Jul 2021 Aug 2021 Sep 2021 Oct 2021 Nov 2021 Dec 2021 Jan 2022 Feb 2022 Mar 2022 Apr 2022 May 2022 Jun 2022 Jul 2022 Aug 2022 Sep 2022
OFFICE AND EMPLOYMENT
National Regional Office Statistics Q4 2022
Business Profile – Number of Businesses Per Category
AVERAGE ASKING RENT OVERALL VACANCY RATE Atlanta $23.30 10% Austin $43.47 14% Boston $41.28 10% Chicago $29.66 15% Dallas/Fort Worth $25.65 15% Denver $28.96 15% Houston $28.80 19% Los Angeles $42.11 15% New York $57.53 12% Philadelphia $26.95 10% Phoenix $27.96 15% Seattle $38.59 11% Washington, DC $38.70 16% Source: CoStar
Downtown Fort Worth Source: US Census Bureau 2020 CBP 0 50 100 150 250 200 300 350 450 400 Mining, Quarrying, and Oil and Gas Extraction Utilities Construction Manufacturing Wholesale Trade Retail Trade Transportation and Warehousing Information Finance and Insurance Real Estate and Rental and Leasing Management of Companies and Enterprises Professional, Scientific, and Technical Services Administrative and Support and Waste Management and Remediation Services Education Services Healthcare and Social Assistance Arts, Entertainment, and Recreation Accommodation and Food Services Other Services (Except Public Administration) STATE OF DOWNTOWN FORT WORTH 2022 22
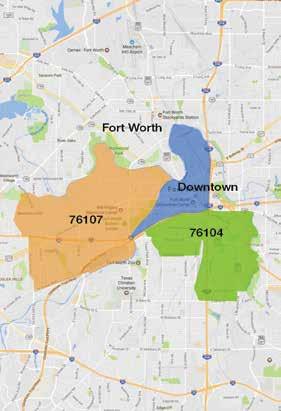
Downtown, the Near Southside, and the West Side combined generate $6,974,797,000 in annual payroll. Downtown Fort Worth has the highest number of employees and generates the largest payroll among all the employment centers in the county.
Average Payroll Per Employee in Private Sector
Source: U.S. Census Bureau 2020 CBP
ZIP CODE (SUBMARKET) PRIVATE-SECTOR EMPLOYEES PAYROLL PAYROLL PER EMPLOYEE 76102 (Downtown) 37,971 $3,086,162,000 $81,277 76104 (Near Southside) 34,709 $2,395,583,000 $69,019 76107 (West Side/ Cultural District) 27,490 $1,331,326,000 $48,429 $70,000 $60,000 $90,000 $80,000 $50,000 $40,000 $30,000 $20,000 $0 Downtown Fort Worth Near Southside West Side 23 STATE OF DOWNTOWN FORT WORTH 2022
LIVING THE DOWNTOWN LIFESTYLE.
The Downtown residential inventory continues to grow. Since 2019, 717 new units have been added. As of Q4 2022, 1,264 are under construction, and 1,987 are in various stages of the planning process.
According to CoStar, the apartment occupancy rate was 90% as of Q4 2022. The 10-year average Downtown occupancy rate is 89%.
Source: North Texas Real Estate Information Systems, Inc.
Downtown has 906 condos and townhomes.
Q3 2022 condo and townhome median sales price was $319,950 or $307/SF.
Source: North Texas Real Estate Information Systems, Inc.
The Downtown apartment inventory is 4,241 units, with 1,264 units under construction as of Q4 2022. The total inventory including apartments, owned units, and senior living is 5,586 units.
Source: CoStar
2021 Census estimates show Fort Worth's population increased by 12,916 from 2020 to 2021. This places Fort Worth with the 2nd highest population increase among all Texas cities and 3rd largest in the country.
Source: U.S. Census
8,685 residents live in Downtown.
Source: U.S. Census
The average market apartment rent per square foot (SF) has increased from $1.68 to $1.87 per SF from Q1 2020 to Q4 2022.
Source: CoStar
41% of Downtown residents have a bachelor's degree or higher.

Source: U.S. Census
The median Downtown household income is $81,521. The median DFW Metro area household income is $72,882.
Source: U.S. Census
STATE OF DOWNTOWN FORT WORTH 2022 24
POPULATION AND HOUSING
Current Housing Growth:
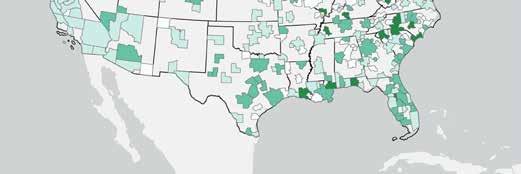
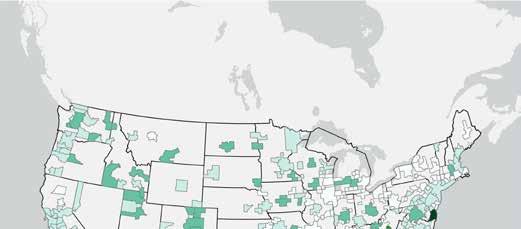
Texas led the nation with 233,536 building permits issued for new residential units as of October 2022. The 2022 national average was 28,260. Fort Worth ranked fourth highest in Texas for new residential building permits in 2021 and the highest in the DFW Metroplex.
25 STATE OF DOWNTOWN FORT WORTH 2022
Apartments Absorption, Net Deliveries, and Vacancy Downtown Fort Worth Average Apartment Occupancy Rate Downtown Fort Worth 800 700 600 500 300 200 400 100 0 35% 25% 20% 30% 15% 10% 5% 0% Net Absorption Net Deliveries Vacancy 2012 2013 2014 2015 2016 2017 2018 2019 2020 2021 2022 100% 95% 90% 85% 80% 75% 70% 65% 2012 Q1 2012 Q2 2012 Q3 2012 Q4 2013 Q1 2013 Q2 2013 Q3 2013 Q4 2014 Q1 2014 Q2 2014 Q3 2014 Q4 2015 Q1 2015 Q2 2015 Q3 2015 Q4 2016 Q1 2016 Q2 2016 Q3 2016 Q4 2017 Q1 2017 Q2 2017 Q3 2017 Q4 2018 Q1 2018 Q2 2018 Q3 2018 Q4 2019 Q1 2019 Q2 2019 Q3 2019 Q4 2020 Q1 2020 Q2 2020 Q3 2020 Q4 2021 Q1 2021 Q2 2021 Q3 2021 Q4 2022 Q1 2022 Q2 2022 Q3 2022 Q4 Source: CoStar Source: CoStar
POPULATION AND HOUSING
Deco 969 is Downtown Fort Worth's first high-rise residential apartment tower in more than 30 years.
Amenities of the 27-story, 302-unit building will include a resort-style pool and spa, streetlevel retail, a fitness center, dog grooming facilities, a sky lounge, coworking space, a roof deck with a fireplace, and a concierge. Deco 969 will welcome the first residents in 2023.
STATE OF DOWNTOWN FORT WORTH 2022 26
Average Apartment Rent Downtown Fort Worth Average Apartment Rent Per Square Foot Downtown Fort Worth $1.95 $1.90 $1.85 $1.80 $1.70 $1.75 $1.60 $1.65 $1.55 $1.50 2019 Q1 2019 Q2 2019 Q3 2019 Q4 2020 Q1 2020 Q2 2020 Q3 2020 Q4 2021 Q1 2021 Q2 2021 Q3 2021 Q4 2022 Q1 2022 Q2 2022 Q3 2022 Q4 $1,700 $1,650 $1,550 $1,600 $1,450 $1,500 $1,400 $1,350 2019 Q1 2019 Q2 2019 Q3 2019 Q4 2020 Q1 2020 Q2 2020 Q3 2020 Q4 2021 Q1 2021 Q2 2021 Q3 2021 Q4 2022 Q1 2022 Q2 2022 Q3 2022 Q4 Source: CoStar Source: CoStar
Population Growth
Texas ranked among the top three states for the highest 10-year population growth from 2010–2020.
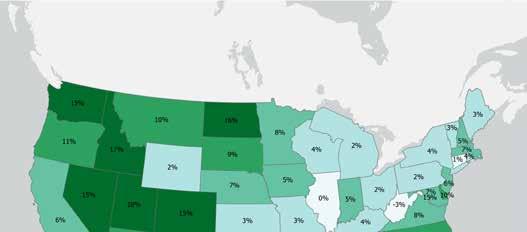
The DFW MSA experienced a 21% population growth from 2010–2020.
Tarrant County experienced a 17% population growth from 2010–2020.
27 STATE OF DOWNTOWN FORT WORTH 2022 Downtown Residents Full-Time Employment by Industry 0 100 200 300 500 400 600 700 800 Agriculture, Forestry, Fishing and Hunting, and Mining Construction Manufacturing Wholesale Trade Retail Trade Transportation and Warehousing, and Utilities Information Finance and Insurance, and Real Estate and Rental and Leasing Professional, Scientific, and Management, and Administrative and Waste Management Services Educational Services, and Healthcare and Social Assistance Arts, Entertainment, and Recreation, and Accommodation and Food Services Other Services, Except Public Administration Public Administration Source: U..S. Census Bureau 2021 Esri,Garmin,FAO,NO AA,EPA 10 Year Population Change : 2010 - 2020 Esri Garmin,FAO,NO AA,EPA 10 Year MSA Population Change : 2010 - 2020 Core Based Statistical Areas 10 year pop growth % -45% - 3% 4% - 15% 16% - 41% 42% - 129% 130% - 234%
POPULATION AND HOUSING
Survey data findings (DFWI Downtown Residential Survey, 2020): This demographic data is from residential surveys DFWI has conducted since 2007. The purpose of these surveys is to monitor trends in the changing profile of the Downtown population. The survey data below was collected in 2020.
The survey instrument was delivered to 3,745 households Downtown using first-class mail. The response rate was 9.8%, providing a margin of error of ±5% at a 95% confidence level. The findings of the data are designed to be a high-level overview, and the survey samples may not be representative of the population.
Age
41% of Downtown residents are under 40 years old
61% of apartment renters are under 40 years old
63% of Downtown residents are unmarried
1.5
The average number of adults living in each household
Household Type Source: Downtown Fort Worth, Inc., Residential Survey, 2020
STATE OF DOWNTOWN FORT WORTH 2022 28
15% (the highest proportion) of residents come from a previous zip code within 7 miles from Downtown Fort
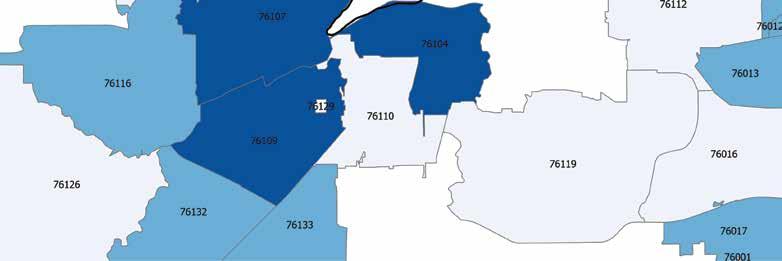
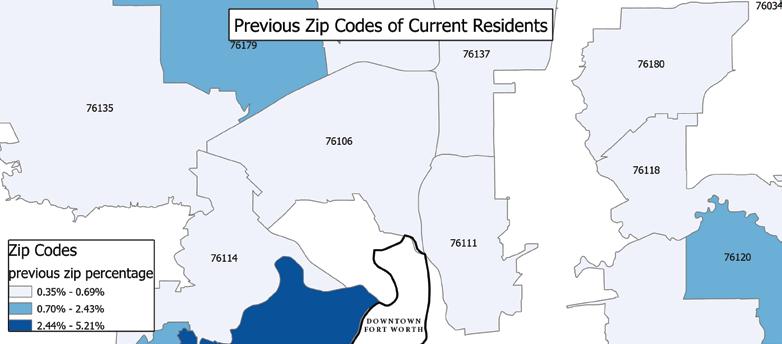
29 STATE OF DOWNTOWN FORT WORTH 2022
Previous Residents
Marital Status Downtown Fort Worth Residents Highest Degree Completed Downtown Fort Worth Residents 0 10 20 30 50 40 United States Fort Worth Downtown Fort Worth Percentage Married – 15 years and over 0% 5% 10% 15% 25% 20% United States Fort Worth Downtown Fort Worth Age 25 years and over Graduate or Professional Degree Bachelor’s Degree Source: U.S. Census Bureau 2020 Source: U.S. Census Bureau 2020 76107 76109 76104 76129
Worth
POPULATION AND HOUSING
Condos and Townhome Sales in Downtown
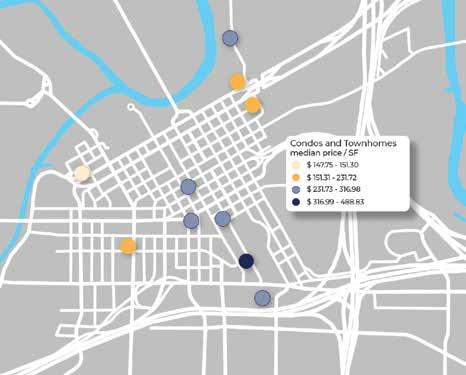
The median sales total price for all condo and townhomes sold in Q3 2022 = $319,950. The median sales price per SF for all condo and townhomes sold in Q3 2022 = $307.
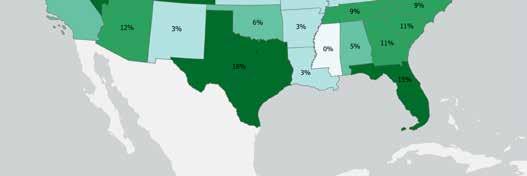
City of Fort Worth Housing Price Changes from 2020–2021
31 additional condo and townhome units are planned.
STATE OF DOWNTOWN FORT WORTH 2022 30
Condominiums and Townhomes Sold
140 100 80 120 60 40 20 0 2012 2013 2014 2015 2016 2017 2018 2019 2020 2021 35% 25% 20% 30% 15% 10% 5% 0% $0–$69,999 $70,000–$99,999 $100,000–$149,999 $150,000–$199,999 $200,000–$249,999 $250,000–$299,999 $300,000–$399,999 $400,000–$499,999 $500,000–$749,999 $750,000–$999,999 $1,000,000+ 2021 2020 Source: Texas Real Estate Research Center Source: North Texas Real Estate Information Systems, Inc.
For 2022, the median sales price per SF for Downtown condos was $293. The median sales price per SF for Downtown townhomes was $263.
31 STATE OF DOWNTOWN FORT WORTH 2022
Price Condominiums
Sales Price Townhomes Downtown Fort Worth Condominium vs. Townhome Sales Price Per SF $900,000 $700,000 $500,000 $800,000 $400,000 $300,000 $600,000 $200,000 $100,000 Downtown Fort Worth Downtown Dallas DFW Metroplex 2017 2018 2019 2020 2021 $700,000 $600,000 $400,000 $300,000 $500,000 $200,000 $100,000 Downtown Fort Worth Downtown Dallas DFW Metroplex 2017 2018 2019 2020 2021 $300 $250 $150 $100 $200 $50 $0 Condos Townhomes 2017 2018 2019 2020 2021 $900,000 $700,000 $500,000 $800,000 $400,000 $300,000 $600,000 $200,000 $100,000 Downtown Fort Worth Downtown Dallas DFW Metroplex 2017 2018 2019 2020 2021 $700,000 $600,000 $400,000 $300,000 $500,000 $200,000 $100,000 Downtown Fort Worth Downtown Dallas DFW Metroplex 2017 2018 2019 2020 2021 $300 $250 $150 $100 $200 $50 $0 Condos Townhomes 2017 2018 2019 2020 2021 $900,000 $700,000 $500,000 $800,000 $400,000 $300,000 $600,000 $200,000 $100,000 Downtown Fort Worth Downtown Dallas DFW Metroplex 2017 2018 2019 2020 2021 $700,000 $600,000 $400,000 $300,000 $500,000 $200,000 $100,000 Downtown Fort Worth Downtown Dallas DFW Metroplex 2017 2018 2019 2020 2021 $300 $250 $150 $100 $200 $50 $0 Condos Townhomes 2017 2018 2019 2020 2021
Median Sales
Median
Source: North Texas Real Estate Information Systems, Inc. Source: North Texas Real Estate Information Systems, Inc. Source: North Texas Real Estate Information Systems, Inc.
POPULATION AND HOUSING
STATE OF DOWNTOWN FORT WORTH 2022 32
Residential Sales Price Downtown Fort Worth
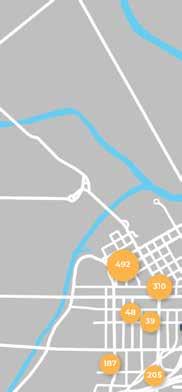
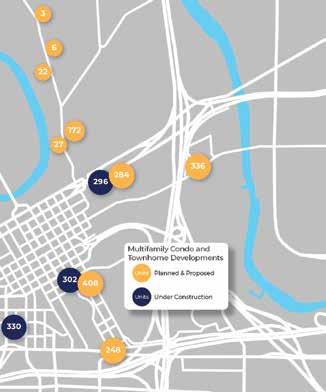
Residential Sales Price Per Square Foot Downtown Fort Worth $350,000 $250,000 $200,000 $300,000 $150,000 $100,000 $50,000 $0 2012 2013 2014 2015 2016 2017 2018 2019 2020 2021 Q3 2022 $250 $200 $350 $300 $150 $100 $50 $0 2012 2013 2014 2015 2016 2017 2018 2019 2020 2021 Q3 2022 $350,000 $250,000 $200,000 $300,000 $150,000 $100,000 $50,000 $0 2012 2013 2014 2015 2016 2017 2018 2019 2020 2021 Q3 2022 $250 $200 $350 $300 $150 $100 $50 $0 2012 2013 2014 2015 2016 2017 2018 2019 2020 2021 Q3 2022 Residential Units Planned, Announced, and/or Under Construction Downtown Fort Worth PROJECT UNITS PROJECT UNITS Burnett Lofts 330 Weatherford Street Apartments 492 The Huntley 296 The McCullough 39 1101 Poindexter St. 3 811 Samuels 22 Deco 969 302 Public Market Building 205 The Harrison 27 The Grayson on 4th 336 Trinity Highline 172 Greer St. Condominium Project 6 7th and Henderson 310 Weatherford Street Flats 284 AHS Calhoun (The Jones) 408 The Palmer 25 Source: Downtown Fort Worth, Inc. Total 3,257 Source: North Texas Real Estate Information Systems, Inc. Source: North Texas Real Estate Information Systems, Inc.
Median
Median
Housing Construction in Downtown Fort Worth
Housing Construction in Downtown Fort Worth
Since 2016, only 11 condo and townhome units have been delivered. Thirty-one units totaling $4.2M are planned.
33 STATE OF DOWNTOWN FORT WORTH 2022
Renter Occupied Units 0 500 1,000 1,500 2,000 2021–2022 2016–2020 2011–2015 2006–2010 2000–2005 Pre-1999 Rate of Construction Growth Condominiums and Townhomes PERIOD DOWNTOWN 2006–2010 72% 2011–2015 0% 2016–2020 1% 2021–2022 0% Sources: Downtown Fort Worth, Inc., and the City of Fort Worth
of Construction Growth Renter Occupied Units PERIOD DOWNTOWN 2006–2010 82% 2011–2015 1% 2016–2020 78% 2021–2022 10%
Downtown Fort Worth, Inc., and the City of Fort Worth
Rate
Sources:
Owner Occupied Condominiums and Townhomes 0 100 200 300 400 2021–2022 2016–2020 2011–2015 2006–2010 2000–2005 Pre-1999
Source:
North Texas Real Estate Information Systems, Inc.
Source: CoStar
The Huntley
BUSINESS AND LEISURE TRAVELERS AGREE, DOWNTOWN IS THE PLACE TO STAY.
Downtown Fort Worth’s hospitality market recovery from COVID is being driven by the return of conventioneers and a marked increase in weekend hotel traffic. Increased tourism in Fort Worth has helped significantly, as we have emerged from the pandemic, and continues to be a meaningful room night driver while business travel continues its slow recovery.
Downtown is home to 7% of the city’s hotels but 23% of the total room inventory. The hospitality market is poised for another dramatic jump with the $500M Convention Center expansion, now in the planning process.
The city expects this expansion will be joined by the development of a new 600-1,000-room convention headquarters hotel.
Downtown Fort Worth Hotels paid $35M (35%) of Fort Worth’s hotel occupancy taxes in Q3 2022*
34 HOSPITALITY
Hotels Planned (P) or Under Construction (UC) HOTEL ROOMS Omni Expansion (P) 400 Sandman Signature (UC) 245 Avid Fort Worth West (UC) 104 Le Meridien Fort Worth Downtown (UC) 189 Fort Worth Convention Center Hotel (P) 600 Total 1,538 Source: Downtown Fort Worth, Inc.
STATE OF DOWNTOWN FORT WORTH 2022
Texas Comptroller 2022
*Source:
35 City’s Share of Total Hotel Inventory Total Inventory of Rooms by Central Business District Average 2022 Revenue Per Available Room (RevPAR) by City Arlington $72 Richardson $70 Dallas $74 Fort Worth $81 Grapevine $121 Irving $75 Frisco $88 Average $81 Source: CoStar Average 2022 RevPAR by Central Business District Downtown Fort Worth $117 Downtown Dallas $108 Downtown Houston $105 Downtown Austin $168 Average $125 Source: CoStar Arlington Richardson Plano Dallas Fort Worth Grapevine Irving 43% 18% 14% 8% 8% 5% 4% 0 5,000 10,000 15,000 25,000 20,000 Downtown Fort Worth Downtown Dallas Downtown Houston Downtown Austin Data available as of Q1 2022 Data available as of Q1 2022 Data available as of Q4 2022 Data available as of Q4 2022 Data available as of Q4 2022 Hotel Occupancy by Region 30% 35% 40% 45% 55% 50% 60% 65% 70% 75% Downtown Fort Worth Downtown Dallas Downtown Houston Downtown Austin DFW Metroplex Texas USA Source: CoStar STATE OF DOWNTOWN FORT WORTH 2022
Hotel Revenue Per Available Room
Hotel Occupancy Rates
Current Hotel Room Inventory
3,733 total hotel rooms
36
HOSPITALITY
Source: CoStar $120 $140 $80 $100 $40 $60 $20 $0 Downtown Fort Worth Dallas CBD DFW Metroplex 2017 Q1 2017 Q2 2017 Q3 2017 Q4 2018 Q1 2018 Q2 2018 Q3 2018 Q4 2019 Q1 2019 Q2 2019 Q3 2019 Q4 2020 Q1 2020 Q2 2020 Q3 2020 Q4 2021 Q1 2021 Q2 2021 Q3 2021 Q4 2022 Q1 2022 Q2 2022 Q3 2022 Q4
Source: CoStar Downtown Fort Worth Dallas CBD DFW Metroplex 2017 Q1 2017 Q2 2017 Q3 2017 Q4 2018 Q1 2018 Q2 2018 Q3 2018 Q4 2019 Q1 2019 Q2 2019 Q3 2019 Q4 2020 Q1 2020 Q2 2020 Q3 2020 Q4 2021 Q1 2021 Q2 2021 Q3 2021 Q4 2022 Q1 2022 Q2 2022 Q3 2022 Q4 80% 40% 50% 60% 70% 20% 30% 10% 0%
Downtown Hotel RevPAR by Class
37 STATE OF DOWNTOWN FORT WORTH 2022 Source: CoStar
2017 Q1 2017 Q2 2017 Q3 2017 Q4 2018 Q1 2018 Q2 2018 Q3 2018 Q4 2019 Q1 2019 Q2 2019 Q3 2019 Q4 2020 Q1 2020 Q2 2020 Q3 2020 Q4 2021 Q1 2021 Q2 2021 Q3 2021 Q4 2022 Q1 2022 Q2 2022 Q3 2022 Q4 Luxury & Upper Upscale Upscale & Upper Midscale $120 $140 $80 $100 $40 $60 $20 $0 Downtown Hotel Average Daily Rate by Class Source: CoStar 2017 Q1 2017 Q2 2017 Q3 2017 Q4 2018 Q1 2018 Q2 2018 Q3 2018 Q4 2019 Q1 2019 Q2 2019 Q3 2019 Q4 2020 Q1 2020 Q2 2020 Q3 2020 Q4 2021 Q1 2021 Q2 2021 Q3 2021 Q4 2022 Q1 2022 Q2 2022 Q3 2022 Q4 Luxury & Upper Upscale Upscale & Upper Midscale $200 $250 $100 $150 $50 $0 Fort Worth Convention Center Facts Exhibit Hall Total exhibit space 253,226 SF Total exhibit hall space 182,613 SF Largest room ceiling height 25 Feet Maximum group number 25,000 Total # of meeting rooms 38 Arena Total arena floor 25,960 SF Total # of arena seats 10,418 Total temporary seats 2,500 Ballroom Total ballroom space 28,160 SF Total guests 3,000 Source: Visit Fort Worth Top 10 Convention Center Events (Q1 2021 – Q1 2022) NAME SHOW ATTENDEES CONTRACT ROOMS 1. 2021 UIL Spirit State Championship 32,500 3,250 2. 2022 UIL Spirit State Championship 32,500 3,079 3. 2021 American Cheerleader Association National Championships 25,000 4,244 4. 2021 Metroplex Challenge 14,000 1,230 5. 2022 American Cheerleader Association National Championships 14,000 2,111 6. 2022 Metroplex Challenge 10,000 1,587 7. 2021 Texas FFA Annual Convention and Trade Show 10,000 10,701 8. 2021 Anime Frontier Show 10,000 695 9. 2021 Concealed Carry Expo 5,000 1,120 10. 2021 Texas State Taekwondo Championship 4,200 280 Source: Visit Fort Worth
DOWNTOWN HAS IT ALL – DINING, DRINKS, DANCING, SHOPPING, THEATRE, AND MORE.

38 STATE OF DOWNTOWN FORT WORTH 2022 RETAIL Downtown Fort Worth Visits by Month 2.5 Visits Per Million 1.5 1.0 2.0 0.5 0.0 2022 Visits 2021 Visits 2020 Visits 2019 Visits January Feburary March April June May August July October September November December Source: Placer.ai Source: Placer.ai Downtown hosted a total of : 18.3 million visits in 2022. 2019 visits: 22.4 Million
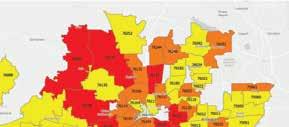
top visitor home ZIP codes were: Wedgwood East neighborhood, Fort Worth, TX City of Burleson, TX Downtown continues its pre-pandemic recovery in the retail sector. Downtown observed an increase in traffic relative to 2020. In 2021, Downtown increased its tourist traffic by 35%.*
The
percentage of visitors 0.26% - 0.46% 0.47% - 0.76% 0.77% - 1.19% Top Visitor ZIP Codes - Year 2021 90+ restaurants and bars 9 coffee shops 21 retail stores *Placer.ai 2021
Retail Drivers
Current Hotel Inventory: 3,733 Rooms
Current Residential Inventory: 5,586 Units
$400M planned Convention Center expansion
$300M planned Texas A&M University expansion
37,971 employees
Promising Retail Trends
The number of Downtown multifamily units will increase with near future development. Adding units creates demand for retail space to serve these households.
Downtown Fort Worth – Total TABC Receipts
Alcohol sales data shows Downtown pandemic recovery
13% of all Downtown visitors have a household income of $75,000 to $100,000.
8% of all Downtown visitors have a household income of greater than $200,000.
Household Income Distribution for Downtown Fort Worth Visitors
39 STATE OF DOWNTOWN FORT WORTH 2022
14% 10% 8% 12% 6% 4% 2% 0% <$10K $15K–20K $10K–15K $30K–35K $20K–25K $40K–45K $35K–40K $50K–60K $45K–50K $75K–100K $60K–75K $100K–125K $125K–150K $150K–200K >$200K $25K–30K $70 $60 $50 $30 $20 $40 $10 $0 2007 2012 2012 2011 2009 2008 2010 2013 2014 2015 2016 2017 2018 2019 2020 2021 2022 Dollars in Millions Source: Placer.ai Source: TABC
DOWNTOWN FORT WORTH IS KNOWN FOR ITS OUTSTANDING QUALITY OF LIFE.
Downtown is a safe, clean, exciting place to live, work, shop, and play. By providing a wide range of amenities, services, and activities, our city center offers something for everyone. Downtown supports an excellent urban lifestyle, from cosmopolitan cultural experiences, relaxing parks, and special events to exciting entertainment options and outdoor opportunities.
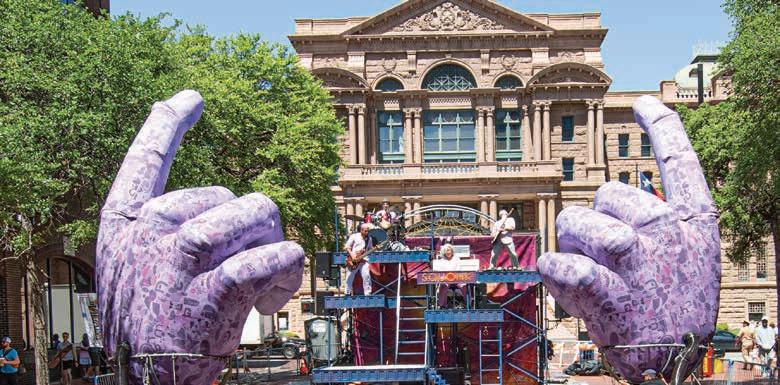
Home to the MAIN ST. Fort Worth Arts Festival and GM Financial Parade of Lights


40 STATE OF DOWNTOWN FORT WORTH 2022 QUALITY OF LIFE
Entertainment Venues Downtown Fort Worth VENUE AVAILABLE SEATS Fort Worth Convention Center (Arena Seating) 10,418 Bass Performance Hall 2,056 AMC Palace 9 623 Four Day Weekend 212 Jubilee Theatre 147 Circle Theatre 125
Sid Richardson Museum boasts 40 paintings by Frederic Remington, Charles M. Russell, and other premier Western artists.
Sundance Square Plaza Entertainment
Parks/Recreation
385 acres of park land service Downtown
Access to more than 100 miles of scenic and safe trails for running, walking, cycling, and horseback riding
Downtown’s Trinity Waterfront offers seasonal canoeing, kayaking, paddle boarding, and fishing
Ten parks including the Fort Worth Water Gardens, Burnett Park, and General Worth Square serve Downtown
Heritage Park
Partnering with the City of Fort Worth, Tarrant County and Streams and Valleys, DFWII is working on plans to renovate Heritage Park Plaza and make significant improvements to Paddock Park and the Heritage Park bluff. This project will require significant fundraising, currently underway. Project completion is estimated for 2026.
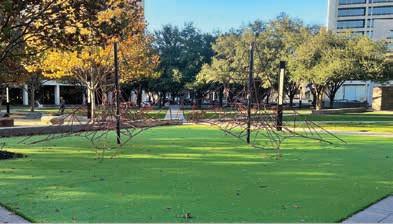
Burnett Park
Using grant funds from Burnett Foundation and the City of Fort Worth, DFWII has replaced the play surface in Burnett Park with new artificial grass and padding beneath. Thanks to the generosity of the Burnett Foundation and Burnett Plaza, a second deck was added to the south side of the park. This new deck increases the area available for programming and provides more room for the new park furniture.
City Hall Open Space
The acquisition of the Pier 1 building for City Hall creates new opportunities for public use of green space. The lawn on the north side of the building is being designed for recreational uses. In addition to paths and exercise circuits, the plan contemplates leaving the large area in the center as unprogrammed open space, a welcome addition to Downtown!
Downtown Pets
Doggie Stations – Thousands of new Downtown residents means more dogs in Downtown and the need for “in the moment cleanup.” To that end, the PID has installed a number of “Wag-n-bag” stations throughout Downtown. If you are taking your dog for a walk, please use them! And, if there is a place we should install a new station, let us know.
41 STATE OF DOWNTOWN FORT WORTH 2022
Burnett Park
QUALITY OF LIFE
PID #1 & #14
Created in 1986, Downtown Fort Worth Public Improvement District (PID) #1, administered by DFWI, offers a comprehensive program of services including research, marketing, Downtown planning assistance, sidewalk cleaning, street sweeping, security enhancement, litter removal, and bird abatement. In the fall of 2020, a new Outreach Coordinator joined the team within the Ambassador Program and has worked to connect those in need to proper social services using strategic case-level management.
From 1986 to 2009, the PID services were renewed by petition every five years by an overwhelming majority of property owners. Because of the PID’s ongoing success, it was reestablished in 2009 for a 20-year period by the Fort Worth City Council, following the submission of petitions from property owners representing 83% of the property value and 80% of the land area in the district. Downtown Fort Worth Improvement District #14 was established in June 2009. District contractors provide services along Samuels Avenue daily. In the spring of 2022, PID crews repaired areas of the Pioneers Rest Cemetery fencing. In addition to the work at Pioneers Rest Cemetery, crews repainted over 30 pedestrian light poles along Samuels Avenue.
$3,478,745 in services annually
1,249 trees serviced within PIDs
13,500 square feet of planters in bloom year-round
75,000 flowers planted annually
1,984 cubic yards (53,568 cubic feet) of dirt/debris removed from streets, curbs, and gutters annually
15,660 linear miles of sidewalks cleaned annually
7,488 miles of curb and gutter cleaning annually
17 full-time clean-team members
13 Ambassadors
1 Outreach Coordinator
27 dump trucks of recycle material collected each year
42 STATE OF DOWNTOWN
2022
FORT WORTH
Over 150 Downtown trees lighted and managed by the PID
Tax Increment Finance District #3
A significant partnership that adds to the success of Downtown is the Downtown Tax Increment Finance (TIF) District and the other Downtownoriented TIFs. The Downtown TIF makes strategic investments in parking, infrastructure, historic preservation, and residential development.
The TIF is a collaboration of the City of Fort Worth, Tarrant County, Tarrant County Hospital District, Tarrant County College District, and Tarrant Regional Water District.
To date, the TIF has obligated roughly $99 million, leveraging $911 million in private development and facilitating $55.05 million in public investment. In tax year 2021 the TIF generated $14.6 million of tax increment to the taxing district partners.
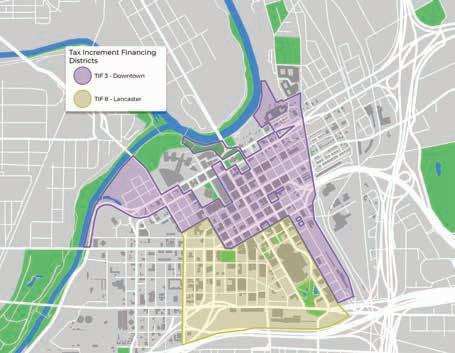
The TIF is capped in revenues at $5 million per year; the remainder of the tax increment, $9.6 million, was returned to the taxing jurisdictions.
DFWI manages the Downtown TIF through a contract with the TIF Board of Directors.
43 STATE OF DOWNTOWN FORT WORTH 2022
Source: Downtown Fort Worth, Inc., and Tarrant Appraisal District Downtown TIF Costs, Investments, and Tax Increment $1,200 $1,400 Millions $800 $1,000 $400 $600 $200 $0 1999 2000 2001 2002 2003 2004 2005 2006 2007 2008 2009 2010 2011 2012 2013 2014 2015 2016 2017 2018 2019 2020 2021 City’s TIF Contribution TIF Cost Tax Increment Value Investments $322 $1,136 $0 $200 $400 $600 $1,000 $800 $1,200 Before TIF Value Current TIF Value Millions Taxable Value of TIF Ashton Hotel Crescent Garage/ Bass Hall Chase Building Family Law Center The Tower Pecan Place UTA Carnegie Building Marriott Towne Place Oliver’s City Place Garage/ Retail Westbrook, Commerce Buildings Cassidy Building Hunter Plaza Two City Place Trinity Bluff
EDUCATION IS A KEY TO DOWNTOWN’S FUTURE.
44 STATE OF DOWNTOWN FORT WORTH 2022 EDUCATION Source: Texas Education Agency University of Texas Arlington, Texas A&M University School of Law, and Tarrant County College have a growing presence in Downtown and enhance workforce development.
0 100 200 300 600 500 400 Charles Nash Elementary Young Women’s Leadership Academy Texas Academy of Biomedical Sciences I.M. Terrell Academy for STEM and VPA Total Students 2019–2020 2018–2019 2020–2021 2017–2018
Enrollment
Primary and Secondary School
Since Texas A&M University acquired the law school in 2013, it has experienced the most significant jump in reputation score of any law school in the United States. The school went from unranked to 46th among 203 accredited law schools nationally in nine years.
Texas A&M School of Law recently passed its Texas counterparts at Baylor University, Southern Methodist University, and the University of Houston in the latest U.S. News & World Report rankings. It is now second in the state behind only the University of Texas School of Law.
Between 2017 and 2021, applications more than doubled from 1,862 to 3,818 More than 4,000 applications in 2022
On target for a 164 median LSAT and a 3.9+ median undergraduate GPA
First or second among Texas law schools for Texas Bar Examination pass rate in 2020 and 2021
10th in the nation for job placement for the last two years
The new expanded Texas A&M University campus, emphasizing innovation, entrepreneurship, and technology, will help advance the region's goals. The campus will help position the Metroplex as a hub of the new economy – including in aerospace and mobility, healthcare, energy, telecommunications, and other growth areas.
Source: Texas A&M
UTA Fort Worth is a satellite location of the University of Texas at Arlington. Its state-ofthe-art facilities combine historic architecture and comprehensive amenities in a convenient Downtown location. The Registered Nurse to Bachelor of Science in Nursing campus-based program offered at UTA Fort Worth has been ranked #19 out of 65 campusbased RN to BSN programs.
Source: UTA Fort Worth
Tarrant County College, Trinity River Campus, is a two-year college with the goal of providing affordable and open access to quality teaching and learning. The Downtown campus includes the College of Health Care Professions, with programs including Anesthesia Technology, Radiologic Technology, Nuclear Medicine Technology, Nursing, Vascular Interventional Radiography, Vocational Nursing, and Surgical Technology.
Tarrant County College offers a great number of continuing education and special interest programs all year. Be sure to visit Tarrant County College (tccd.edu) for more information.
Source: Tarrant County College
45 STATE OF DOWNTOWN FORT WORTH 2022
DOWNTOWN IS FORT WORTH’S TRANSIT HUB.
Downtown's Fort Worth Central Station serves as the gathering point for Trinity Metro bus routes, The Dash, Molly the Trolly shuttle service, Trinity Railway Express (TRE), TEXRail, Amtrak, and the Greyhound Bus Line. Currently, 11 bus routes connect all parts of Fort Worth to Downtown. The TRE offers eight stops between Downtown Fort Worth and Dallas. TEXRail offers six stops between Downtown and DFW International Airport Terminal B. Both lines represent excellent commute options for Downtown employees.
Downtown is also home to 16 Bike Sharing stations. In 2021, Downtown saw a 17% increase in ridership over 2020. The top-performing stations were Panther Island Pavilion, City Place, Trinity Uptown, Omni Fort Worth Hotel, and 777 Main.
Downtown visitors enjoy 5,873 free parking spaces available after 6 p.m. on weekdays and all day on weekends. The City of Fort Worth provides 2,562 spaces of free after hours on-street metered parking. The remaining 3,311 spaces are parking garages, courtesy of the Downtown Tax Increment Finance District.

TRANSPORTATION 46 STATE OF DOWNTOWN FORT WORTH 2022
380,019 Downtown TEXRail riders (2021)
923,633 Trinity Railway Express (TRE) riders (2021)
Dallas-Fort Worth International Airport
• 22 miles from Downtown
• Direct access to the Terminal B Station via TEXRail
• 62+ MILLION passengers in 2021
four hours
• DFW airport ranked 2nd busiest passenger airport in the world for 2021
• 28 passenger airlines serve DFW International Airport
Every major city in the continental United States can be accessed within four hours
Approximately 170,000+ passengers daily
Meacham International Airport, Fort Worth's premier general aviation facility, is located just 5 miles from Downtown.
Highways serving Downtown:
• I-35
• I-30
• Hwy 121
• Hwy 287
47 STATE OF DOWNTOWN FORT WORTH 2022
TRANSPORTATION 48 STATE OF DOWNTOWN FORT WORTH 2022
City ofFortWorth,Texas Parks & Wildlife,Esri,HERE,Garmin,SafeG raph,METI/N ASA,USGS,EPA,NPS, USDA Dallas Source: ESRI
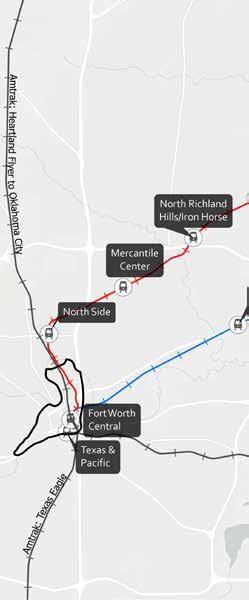
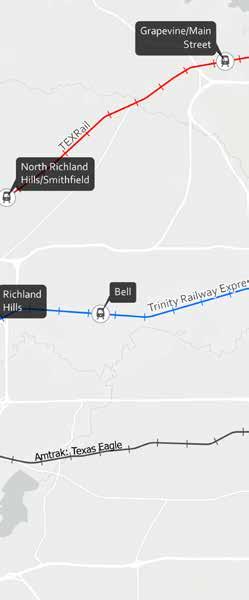
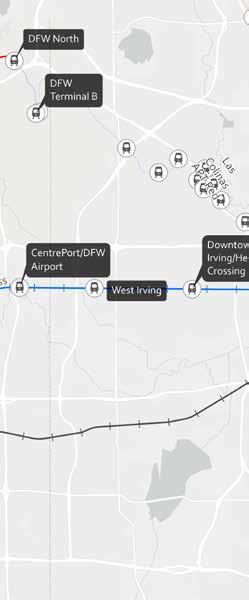
Fort Worth Metro Area Rail Transit Services
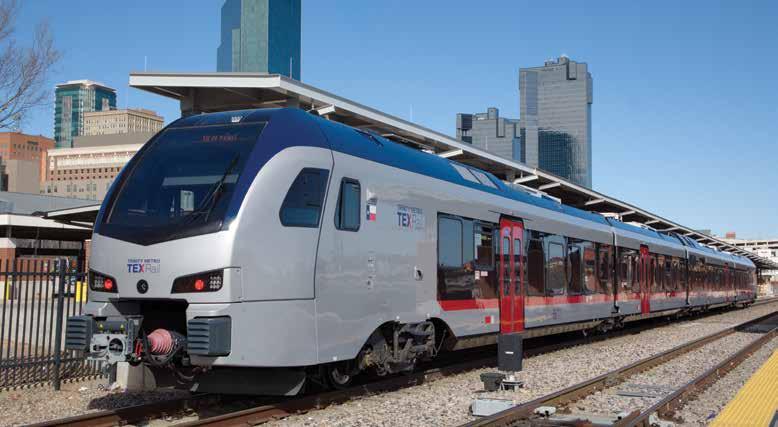
TEXRail:
• Over 380,000 passengers rode TEXRail in 2021.
• TEXRail, Trinity Metro's 25-mile commuter rail, connects Downtown to DFW International Airport in 50 minutes.
• Each train has 229 seats and a total capacity of 488.
• TEXRail amenities include a designated quiet car, level boarding, bike racks, USB charging ports, seatback trays and tables, and overhead luggage racks.
• TEXRail operates on the same schedule seven days a week, including all holidays.
• A proposed 2.1-mile expansion would extend TEXRail into the Near Southside.
Sources: National Transit Database; Trinity Metro
TEXRail Monthly Ridership
Trinity Railway Express Monthly Ridership
49 STATE OF DOWNTOWN FORT WORTH 2022
Sources: National Transit Database; Trinity Metro Sources: National Transit Database; Trinity Metro 120,000 100,000 60,000 80,000 40,000 20,000 0 TEXRail 12-month Average Jan 2017 Apr 2017 Jul 2017 Oct 2017 Jan 2018 Apr 2018 Jul 2018 Oct 2018 Jan 2019 Apr 2019 Jul 2019 Oct 2019 Jan 2020 Apr 2020 Jul 2020 Oct 2020 Jan 2021 Apr 2021 Jul 2021 Oct 2021 Jan 2022 Apr 2022 Jul 2022 Oct 2022 250,000 200,000 100,000 150,000 50,000 0 TRE 12-month Average Jan 2017 Apr 2017 Jul 2017 Oct 2017 Jan 2018 Apr 2018 Jul 2018 Oct 2018 Jan 2019 Apr 2019 Jul 2019 Oct 2019 Jan 2020 Apr 2020 Jul 2020 Oct 2020 Jan 2021 Apr 2021 Jul 2021 Oct 2021 Jan 2022 Apr 2022 Jul 2022 Oct 2022
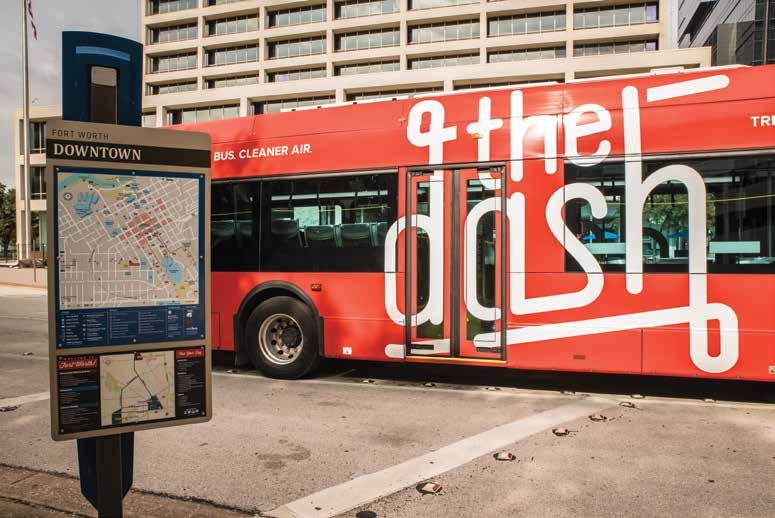
The Dash
The Dash is Trinity Metro’s allelectric bus that connects Downtown with the Cultural District and the West 7th entertainment corridor. The Dash provides daily service with later hours on Friday and Saturday nights.
The Dash Annual Ridership
TRANSPORTATION 50 STATE OF DOWNTOWN FORT WORTH 2022
Source: Trinity Metro
60,000 50,000 20,000 30,000 40,000 10,000 0 2019 2020 2021 2022 & $# + & $& $ & $& #
Source: Trinity Metro
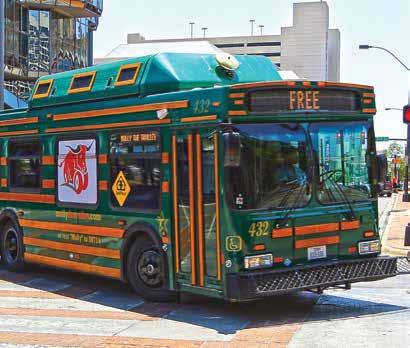
Molly the Trolly
The Molly route travels from the Fort Worth Convention Center to Sundance Square seven days a week from 10 a.m. to 10 p.m. The time between buses is approximately 15 minutes.
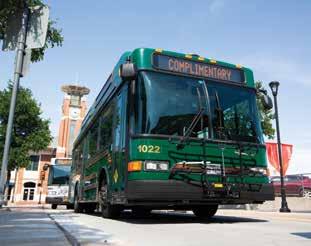
Molly also serves Trinity Metro’s Fort Worth Central Station, giving passengers access to commuter rail, Amtrak, inner-city and interstate bus services, Fort Worth Bike Sharing, and rental car services.
Rider fares on Molly the Trolley are complimentary, thanks to subsidies from Sundance Square, Visit Fort Worth, DFWI, and Downtown hotels.
Molly the Trolley ceased operation during the COVID pandemic from April 2020 until October 2021.
Molly the Trolley Annual Ridership
Trinity Metro Bus Monthly Ridership
51 STATE OF DOWNTOWN FORT WORTH 2022
100,000 80,000 70,000 50,000 30,000 10,000 60,000 90,000 40,000 20,000 0 2019 2020 2021 2022 Suspended Operations
Source: Trinity Metro
Source: Federal Transit Administration 300,000 350,000 400,000 500,000 450,000 200,000 250,000 100,000 150,000 50,000 $0 Jan 19 Mar 19 May 19 July 19 Sept 19 Nov 19 Jan 20 Mar 20 May 20 July 20 Sept 20 Nov 20 Jan 21 Mar 21 May 21 July 21 Sept 21 Nov 21 Jan 22 Mar 22 May 22 July 22 Sept 22 Metro 12-month Average Source: Trinity Metro
Means of Transportation to Work: Car, Truck, or Van
Means of Transportation to Work: Public Transportation
Means of
to Work: Carpool
Means of
to Work: Walk or Bicycle
TRANSPORTATION 52 STATE OF DOWNTOWN FORT WORTH 2022
Transportation
Transportation
7% 5% 4% 6% 8% 3% 2% 1% 0% Downtown Austin Downtown Dallas Downtown Fort Worth Downtown San Antonio 25% 20% 30% 15% 75% 65% 60% 70% 55% 50% 45% 40% Downtown Austin Downtown Dallas Downtown Fort Worth Downtown San Antonio 6% 4% 5% 3% 2% 1% 0% Downtown Austin Downtown Dallas Downtown Fort Worth Downtown San Antonio 7% 5% 4% 6% 8% 3% 2% 1% 0% Downtown Austin Downtown Dallas Downtown Fort Worth Downtown San Antonio 25% 20% 30% 75% 65% 60% 70% 55% 50% 45% 40% Downtown Austin Downtown Dallas Downtown Fort Worth Downtown San Antonio 6% 4% 5% 3% 2% 1% 0% Downtown Austin Downtown Dallas Downtown Fort Worth Downtown San Antonio 7% 5% 4% 6% 8% 3% 2% 1% 0% Downtown Austin Downtown Dallas Downtown Fort Worth Downtown San Antonio 25% 30% 75% 65% 60% 70% 55% 50% 45% 40% Downtown Austin Downtown Dallas Downtown Fort Worth Downtown San Antonio 6% 4% 5% 3% 2% 1% 0% Downtown Austin Downtown Dallas Downtown Fort Worth Downtown San Antonio 7% 5% 4% 6% 8% 3% 2% 1% 0% Downtown Austin Downtown Dallas Downtown Fort Worth Downtown San Antonio 25% 20% 30% 15% 10% 5% 0% Downtown Austin Downtown Dallas Downtown Fort Worth Downtown San Antonio 55% 50% 45% 40% Downtown Austin 6% 4% 5% 3% 2% 1% 0% Downtown Austin Source: U.S. Census ACS 2020. ZIP codes used for downtown: Austin –78701, San Antonio –78205, Dallas 75201 & 75202 Source: U.S. Census ACS 2020. ZIP codes used for downtown: Austin –78701, San Antonio –78205, Dallas 75201 & 75202 Source: U.S. Census ACS 2020. ZIP codes used for downtown: Austin – 78701, San Antonio – 78205, Dallas 75201 & 75202 Source: U.S. Census ACS 2020. ZIP codes used for downtown: Austin – 78701, San Antonio – 78205, Dallas 75201 & 75202

53 STATE OF DOWNTOWN FORT WORTH 2022 Average Daily Traffic Count Selected State and Federal Highways Serving Downtown Fort Worth Source: Texas Department of Transportation Specialized Parking Valet 153 Bus loading zones 32 Commercial loading zones 150 Passenger loading zones 70 Total metered spaces (free on evening and weekends) 2,562
Fort Worth Transportation and Public Works Department 120,000 140,000 180,000 160,000 200,000 80,000 100,000 40,000 60,000 20,000 $0 2001 2002 2003 2004 2005 2006 2007 2008 2009 2010 2011 2012 2013 2014 2015 2016 2017 2018 2019 2020 2021 I-35W I-30 SH 287 SH 121
Source:
Larry Auth
Omni Hotel (Chair)
Laura Bird
Anthracite Realty Partners
Johnny Campbell
City Center Fort Worth
Gary Cumbie
The Cumbie Consultancy
Jennifer Eslinger
Burnett Plaza
Amber Finley
Finley Resources, Inc.
Drew Hayden
The Worthington Renaissance Fort Worth Hotel
Marie Holliday, DMD
Fort Worth Metropolitan Black Chamber of Commerce
Ashlee Johnson
Ron Investments, Ltd.
Whit Kelly
777 Main
Ed Kraus
Sundance Square
Walter Littlejohn
The Fort Worth Club
Michelle Lynn
Building Owners & Managers Association
Renee Massey
Red Oak Realty
Mark Michalski
Kimpton Harper Hotel
Don Perfect
ONCOR
Carissa Taylor
AC Hotel Marriott
Carlos De La Torre
Fort Worth Downtown
Neighborhood Alliance
Courtney Towson
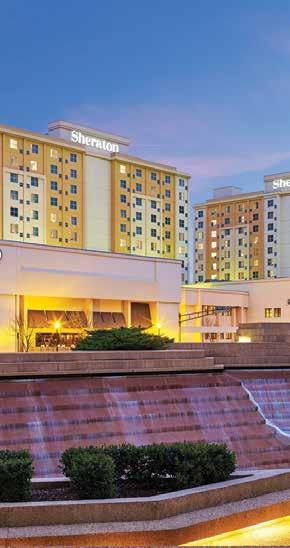
Sheraton Fort Worth Downtown Hotel
Jed Wagenknecht
Blackstone Courtyard
TRANSPORTATION 54 STATE OF DOWNTOWN FORT WORTH 2022
PID ADVISORY BOARD
Credits
Downtown Fort Worth, Inc., is grateful to the following organizations and individuals for their assistance in producing the State of Downtown publication:
City of Fort Worth
Mary Margaret Davis
Real Estate Broker
Phil Dupler
Director of Planning
Trinity Metro
Peter Elliot
Parking Manager
Fort Worth Transportation and Public Works
Downtown Fort Worth, Inc.,
Publications
• Annual Report
• In View
• Residential Survey Report
• State of Downtown
Information Sources
City of Fort Worth
CoStar
Downtown Fort Worth, Inc.
ESRI
Federal Transit Administration
Greater Fort Worth Association of Realtors
National Association of Realtors
North Texas Real Estate InformationSystems, Inc.
Placer.ai
Southern Land Company
Tarrant County
Tarrant County
Appraisal District
Tarrant County College
Texas A&M Real Estate Research Center
Texas A&M School of Law
Texas Alcoholic Beverage Commission
Texas Comptroller of Public Accounts
Amanda Harrier
Director of Events and Communications
Greater Fort Worth Association of Realtors
Dr. Sean Maddison
Tarrant County College
Arrie Mitchell
Economic Development Specialist
City of Fort Worth
Texas Department of Transportation
Texas Education Agency
Texas Workforce Commission
Trinity Metro U.S. Bureau of Labor Statistics
U.S. Census Bureau
University of Texas at Arlington Visit Fort Worth Young Women’s Leadership Academy
Downtown Fort Worth, Inc. Staff
Andy Taft President
Matt Beard Director of Public Improvements
Cleshia Butler
Administrative Assistant
Chris Chaney
Event Production Manager
Jay Downie Event Producer
Brandi Ervin Controller
Nina Petty
Texas A&M University
School of Law
Michael Wollman
The University of Texas at Arlington, Fort Worth Center
CREDITS
Becky Fetty
Director of Membership and Marketing
Melissa Konur
Director of Planning
KayLee Pratt
Marketing and Special Projects Manager
Shane Smith
Director of Research
Barbara Sprabary
Executive Assistant and Office Manager
A service of Downtown Fort Worth, Inc.
55 STATE OF DOWNTOWN FORT WORTH 2022

Published in January 2023 Downtown Fort Worth, Inc. 777 Taylor Street, Suite 100 Fort Worth, Texas 76102 817.870.1692 | dfwi.org #DowntownFortWorth /DowntownFortWorth /DTFortWorth /DowntownFortWorth
