2 minute read
and Veterinary Feed Directives
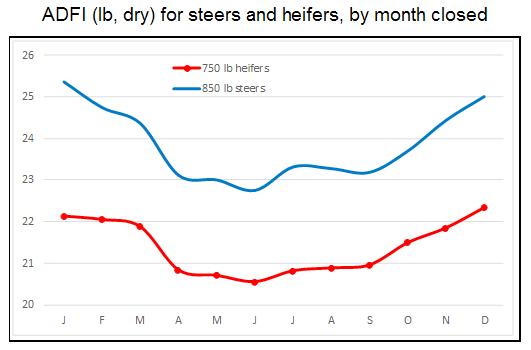
ADFI for steers or heifers of common weights, by month closed.
At first it seems to contradict the earlier statement about photo-period, because cattle closed in early summer months have the lowest average intake. That makes sense, though, because those cattle actually had short daylight for much of their feeding period, especially during the critical first few months on feed (probably Oct-Dec), when their intake patterns were being established.
On the other hand, cattle placed in early summer, and fed mostly during long daylight season, would be closed in Dec or Jan and have high average feed consumption.
20.89 lb, a difference of 1.65 lb/head/day. This difference occurs because steers are heavier. Steers average 61 lb heavier placement weight (799 vs 736) and 134 lb heavier out weight (1397 vs 1263).
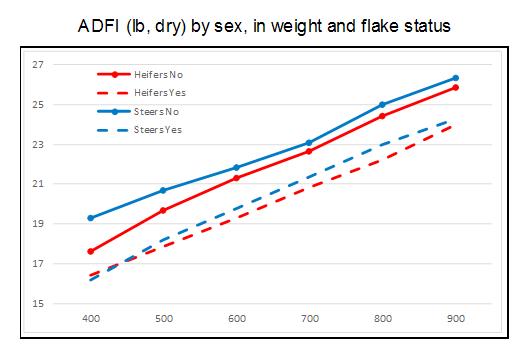
Chart 1 shows the relationship between placement weight and average daily feed intake for steers and heifers. Note that both lines are pretty straight, increasing by about 1.5 lb for every 100 lb heavier in weight. Note also that at any given in weight, steers eat about 0.6 lb more than heifers. This difference is simply due to weight, not any intrinsic difference between the sexes.
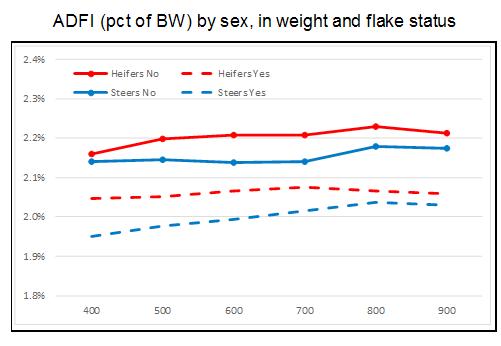
At any given placement weight, steers will weigh about 110 lb more at slaughter so their mean weight will be higher for the feeding period. In fact, when expressed as a percentage of mean body weight, heifers average 2.09% of their body weight consumed per day, steers 2.05%.
Seasonality: Seasonality affects many forms of behavior, including feed consumption. Cattle are more active and eat more feed when daylight is long, during summer months. When daylight is shorter, cattle eat less. Chart 2 shows
Diet or grain processing: The energy content and composition of the diet also affects the amount of feed consumed. In general, cattle eat smaller amounts as dietary energy increases. Research has shown that as the fat level of the diet increases, feed consumption decreases. Closeout data support the same conclusion.
Charts 3 and 4 show feed intake for steers and heifers of different weights, grouped by whether or not their diet included flaked grain (yes or no). Data are expressed either in pounds consumed (dry basis) or as a percentage of mean body weight. When corn is flaked, starch becomes more available and cattle get about 10% more energy from each pound of corn so flaked diets have higher energy content and cattle consume less.
Normal variation: Not all pens of 850 lb steers placed in September are the same, either. Properly dosing feed additives requires understanding normal variation as well.
Chart 5 is population distributions of average feed intake of two common weight groups of cattle. For each line, the highest point represents the most common occurrence. For example, the 850 lb steer line is highest at 23 lb average intake and nearly as high at 24 lb. Around 21% of lots of 850 lb steers had average feed consumption of 23 lb and nearly as many ate 24 lb.
The tails of the line are the outer limits of consumption, with the lowest level at 18 lb for the 850 lb steers (less than 1% of them ate that amount) and the highest level at 30 lb. The line for 750 lb heifers has similar shape, but at a couple pounds lower consumption.
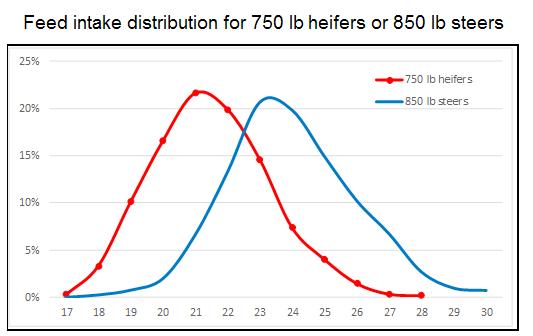
These lines represent the bell-shaped curve that describes most populations for lots of types of traits.
Summary
Proper diet formulation requires a good estimate of how much feed cattle will eat. To properly prescribe medicated feed additives, and to meet the requirements of the Veterinary Feed Directive, veterinarians, nutritionists and their cattle feeding clients, will need to understand the factors that affect feed consumption, including known biological relationships and normal variation.


