BITCOINSTRENGTHENSASFED RATECUTSPARKSVOLATILITY

MARKETSIGNALS

BitcoinonthePathofRecoveryAmidst AlleviatingSellPressure
MACROUPDATE

FedRateCutsRippleAcross Markets:Bonds,Liquidity,and HousingStrains


BitcoinonthePathofRecoveryAmidst AlleviatingSellPressure
MACROUPDATE
FedRateCutsRippleAcross Markets:Bonds,Liquidity,and HousingStrains
Bitcoinralliedpast$112,500andbrieflytouched$118,000followingtheFederal Reserveʼs rate cut, driven by short covering and speculative buying. While profit-taking introduced volatility, derivatives markets shifted from a risk-off stancetomorebalancedpositioning,easingdownsideconcerns.
Perpetual futures played a central role, with open interest hitting a cycle high beforemoderatingunderpolicy-drivenvolatility.Shortliquidationsaheadofthe FOMC announcement triggered squeezes that fueled the rally, though subsequentlongliquidationshighlightedthemarketʼssensitivitytoleverage.
On-chaindatashowthatBitcoinnowtradesabovethecostbasisof95percent of supply $115,200, restoring profitability for most holders. Sustaining this leveliskeytomaintainingmomentum;adropbelowcouldinviterenewedselling pressureandretestthe$105,500$115,200range.
The Federal Reserveʼs first rate cut since 2024 highlights its delicate balancing act between softening labour markets and stubborn inflation. Chair Jerome Powell stressed that employment risks are now taking priority, even as dissent within the Fed reveals divisions over how far easing should go. With growth slowing and inflation likely settling above target, the Fed appears willing to tolerate higher prices to cushion jobs, though political pressure and volatile marketreactionscontinuetocloudthepolicyoutlook.

Thesepressuresaremostevidentinhousing.Newconstructionhasdroppedto multi-year lows, builder sentiment remains depressed, and price cuts are widespreadasinventoriesswell.Whilemortgagerateshaveeased,affordability remainsconstrainedbyweakjobmarketsandtighterliquidity,leavingresidential investment a drag on growth. Taken together, the Fedʼs cautious easing, the Treasuryʼs funding strategy, and a struggling housing market suggest that monetary relief alone may not prevent the economy from facing prolonged headwinds.
The global crypto landscape is being shaped by a convergence of macroeconomic stress, sovereign digital currency initiatives, and regulatory breakthroughs that could redefine digital asset markets. In the UK, surging governmentborrowingandrisingdebtcostshaveheightenedvolatilityinbonds andsterling,strengtheningthecaseforBitcoinasahedgeagainstfragilefiscal foundations.
In Europe, finance ministers advanced plans for a digital Euro by agreeing on frameworksforissuanceandholdinglimits,framingtheprojectasbothpayment modernisationandasteptowardfinancialsovereignty.Meanwhile,intheUS,the SECʼs adoption of generic listing rules for spot crypto ETFs could fast-track launchesinaslittleas75days,openingthedoortoproductsbeyondBitcoinand Ethereum. Together, these shifts show how crypto is increasingly tied to fiscal pressures, central bank digital currency strategies, and regulatory reform, dynamicsthatwillshapebothgrowthandvolatilityahead.
BitcoinonthePathofRecoveryAmidst AlleviatingSellPressure

● FedBalancesJobsandInflationasRate CutsSignalaStagflation-LiteEra
● FedʼsRateCutReshapesBondMarkets
● USHousingMarketWeakensasBuilders CutBackAmidInventoryGlut
● UKGovernmentBorrowingSurgesto£18 BillioninAugust
● EUFinanceMinistersOutlineFramework forDigitalEuroDecisions


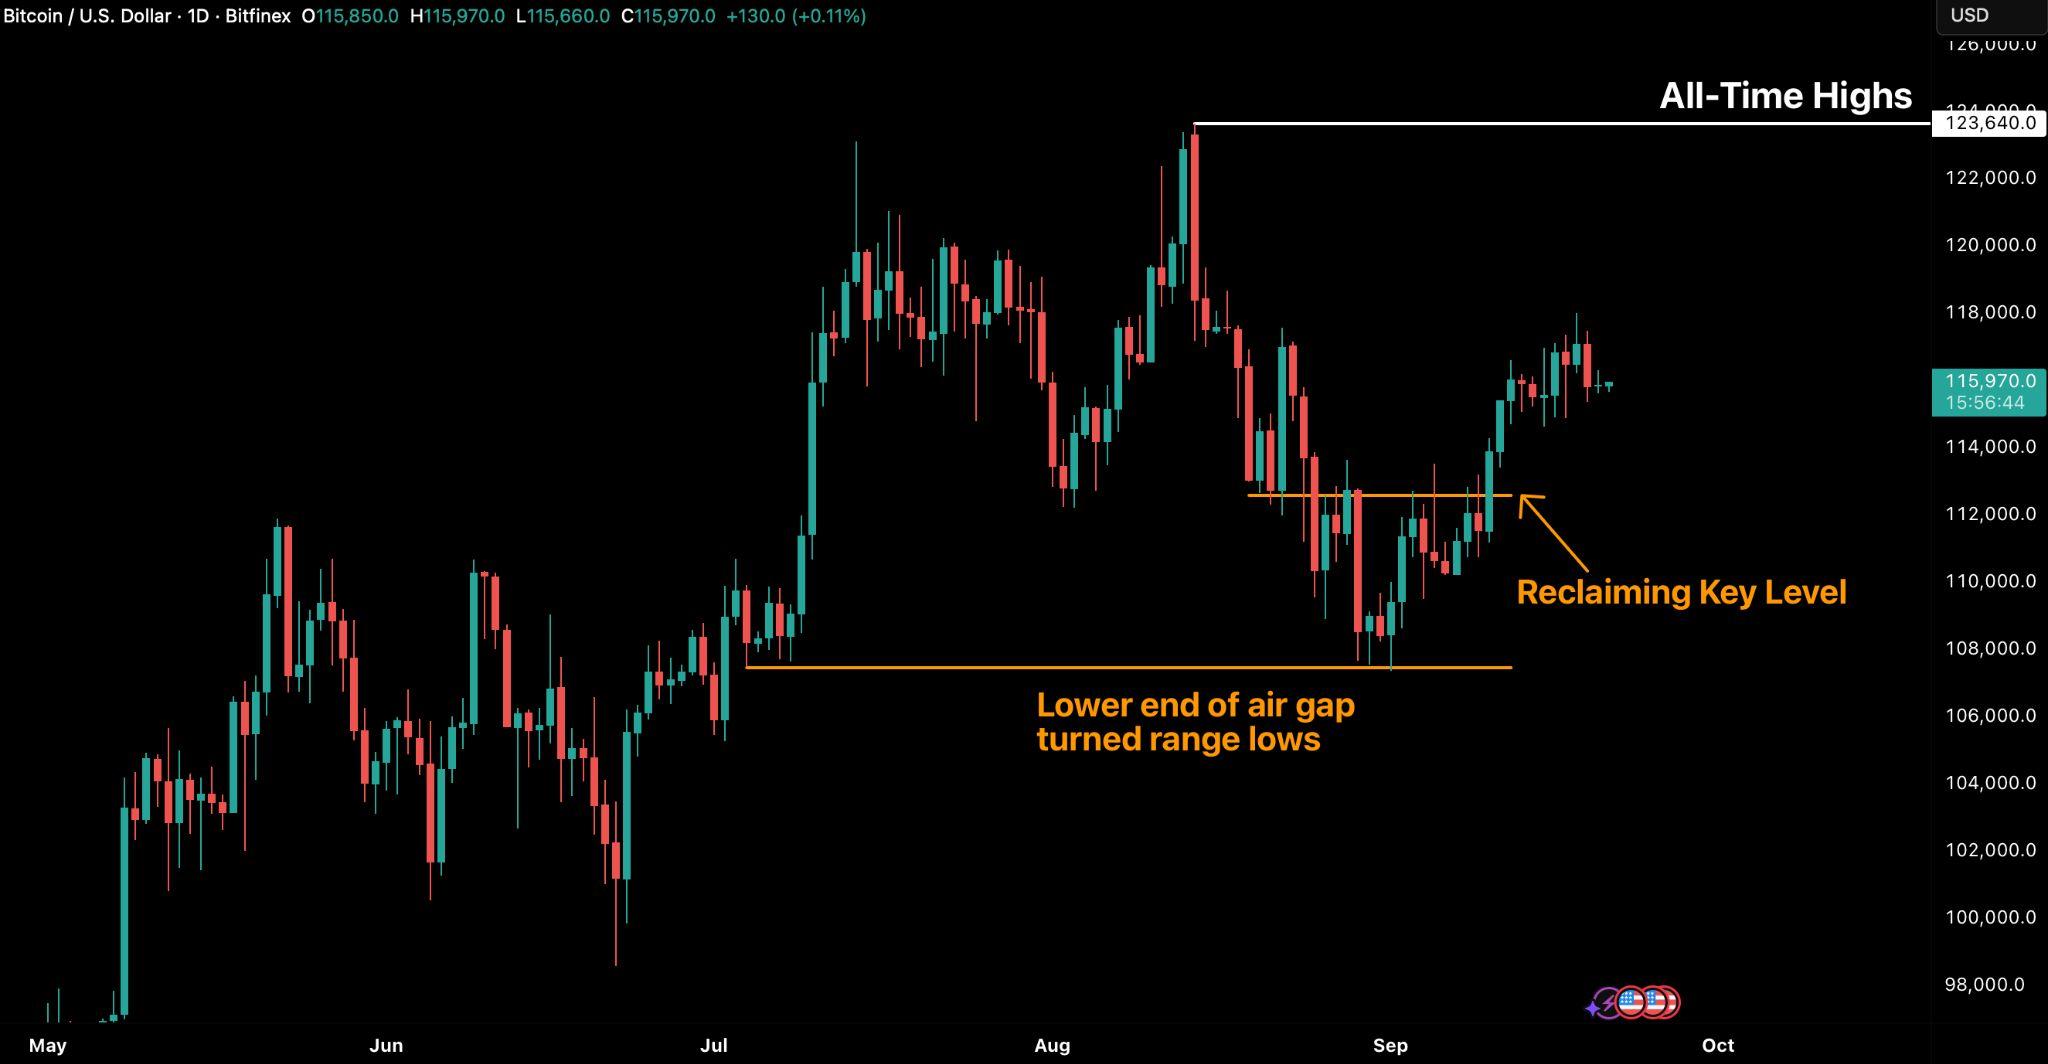
Bitcoin extended its advance after reclaiming the key $112,500 level highlighted in the previous edition of Bitfinex Alpha. Following the Federal OpenMarketCommitteeʼsFOMC)ratecutdecision,awaveofshortcovering and speculative buying propelled BTC to a high of $118,000.This move was followedbyprofit-takingandamodestretracementonlowertimeframes,as themarketdigestedgains.
Figure1.BTC/USDDailyChart.Source:Bitfinex)
BTC built moderate momentum heading into the September 17th FOMC meeting. Derivatives markets transitioned from a risk-off stance to a more balanced positioning, with downside concerns easing following the policy announcement. In spot markets, modest selling pressure was evident, while perpetual futures absorbed liquidity through a series of short squeezes, reinforcing near-term stability.
In the perpetual futures market, the Cumulative Volume Delta CVD) bias has shiftedmarkedlyfromextremesellingtoanear-balancedstate.

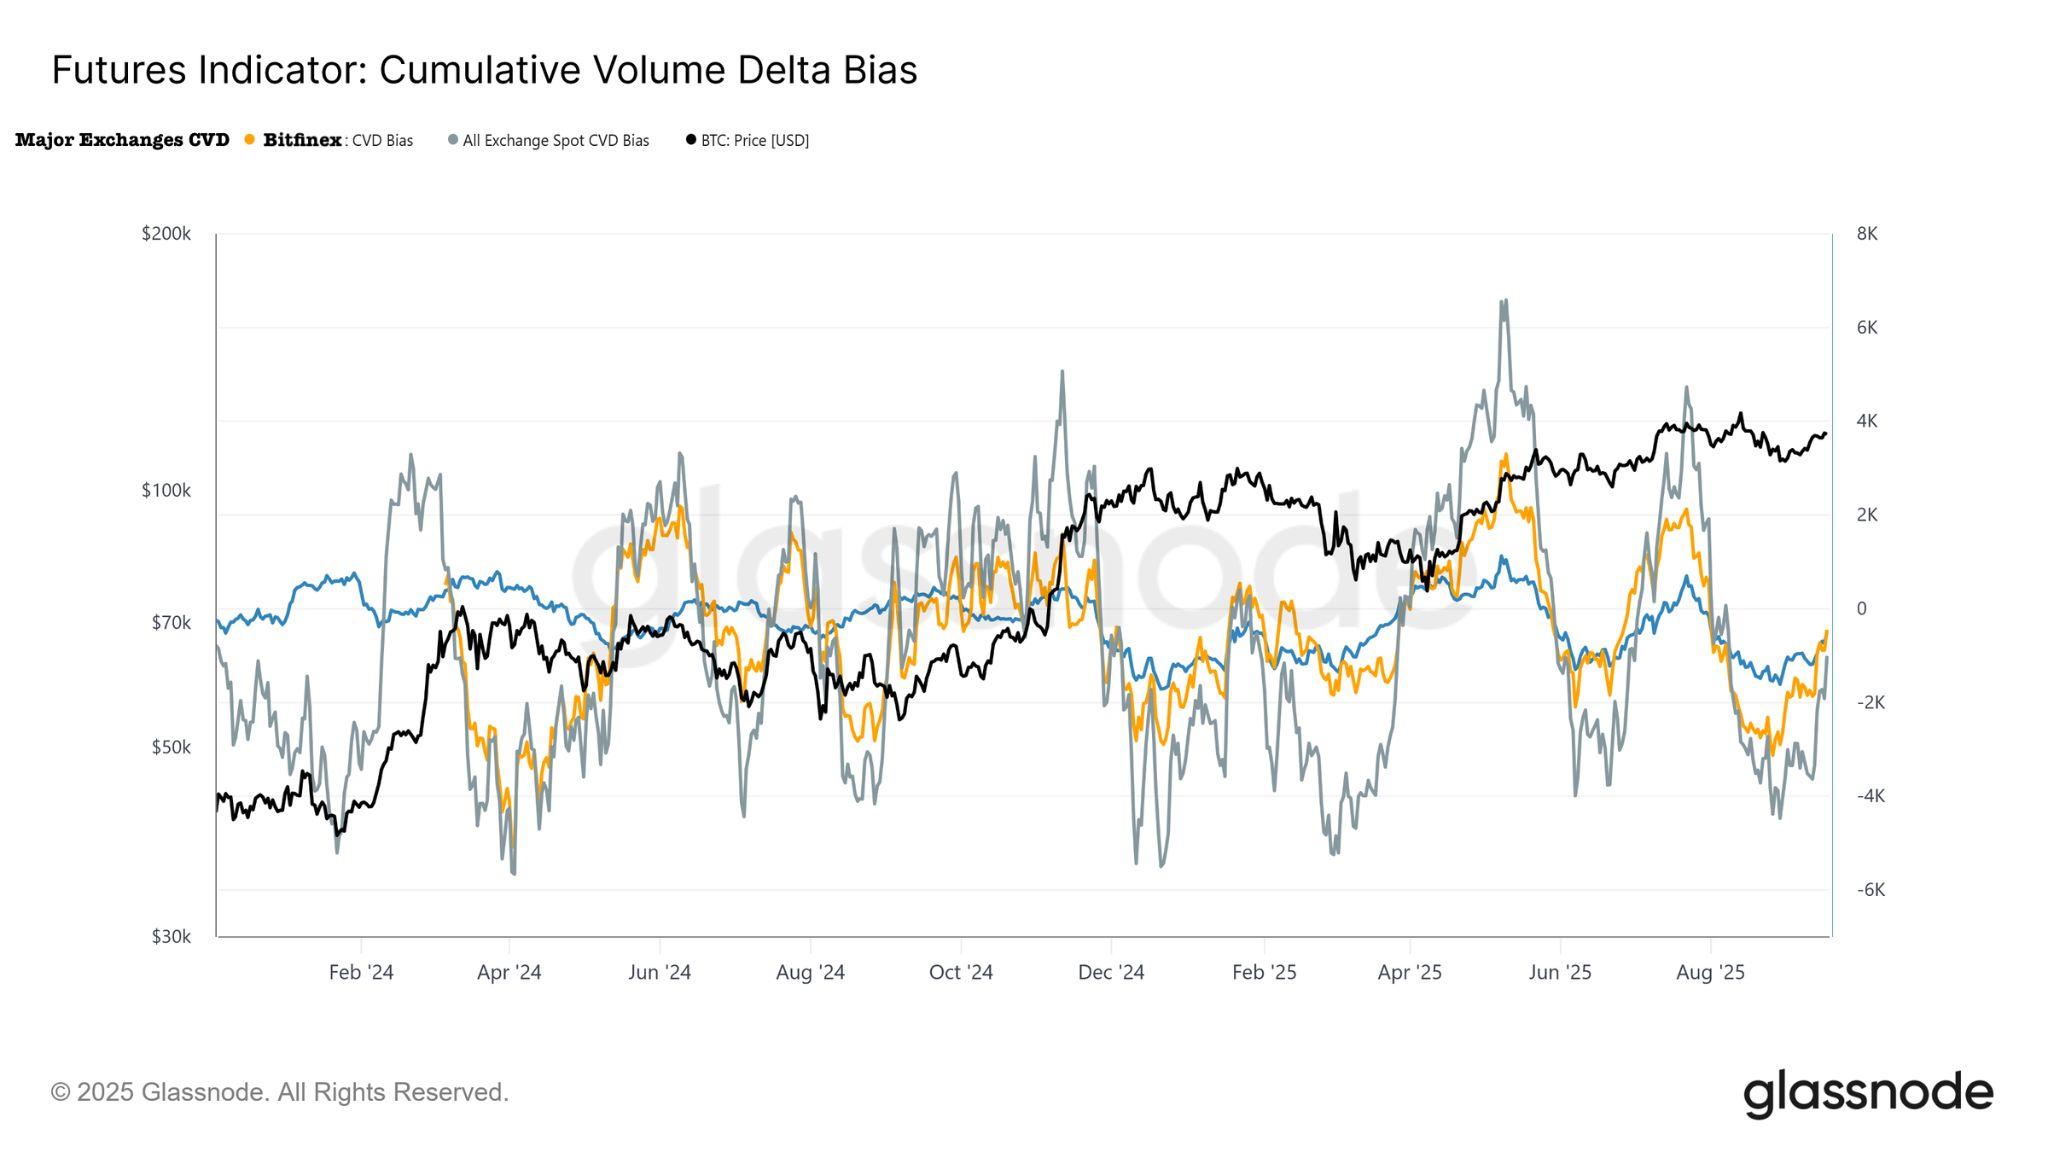
This transition signals a meaningful return of liquidity, with buy-side flows offsettingthepersistentsellpressurethatdominatedfromlateAugustthroughthe FOMCmeeting.Suchstabilisationhighlightsthecriticalroleoffuturesmarketsin underpinningtherally,asspeculatorspositionedaheadoftheratecutandpriced intheprospectofasupportivepolicyoutcome.
Given the outsized role of futures in current market dynamics, perpetual indicatorsprovideaclearerlensonshort-termsentiment.Perpetualopeninterest OI)climbedtoacyclehighofroughly$85.91billiononSeptember13th,signalling aggressive positioning ahead of the FOMC. However, by Monday, choppy price actionforcedOIlowerto$82.22billion,adeclineofaround4.3percent.
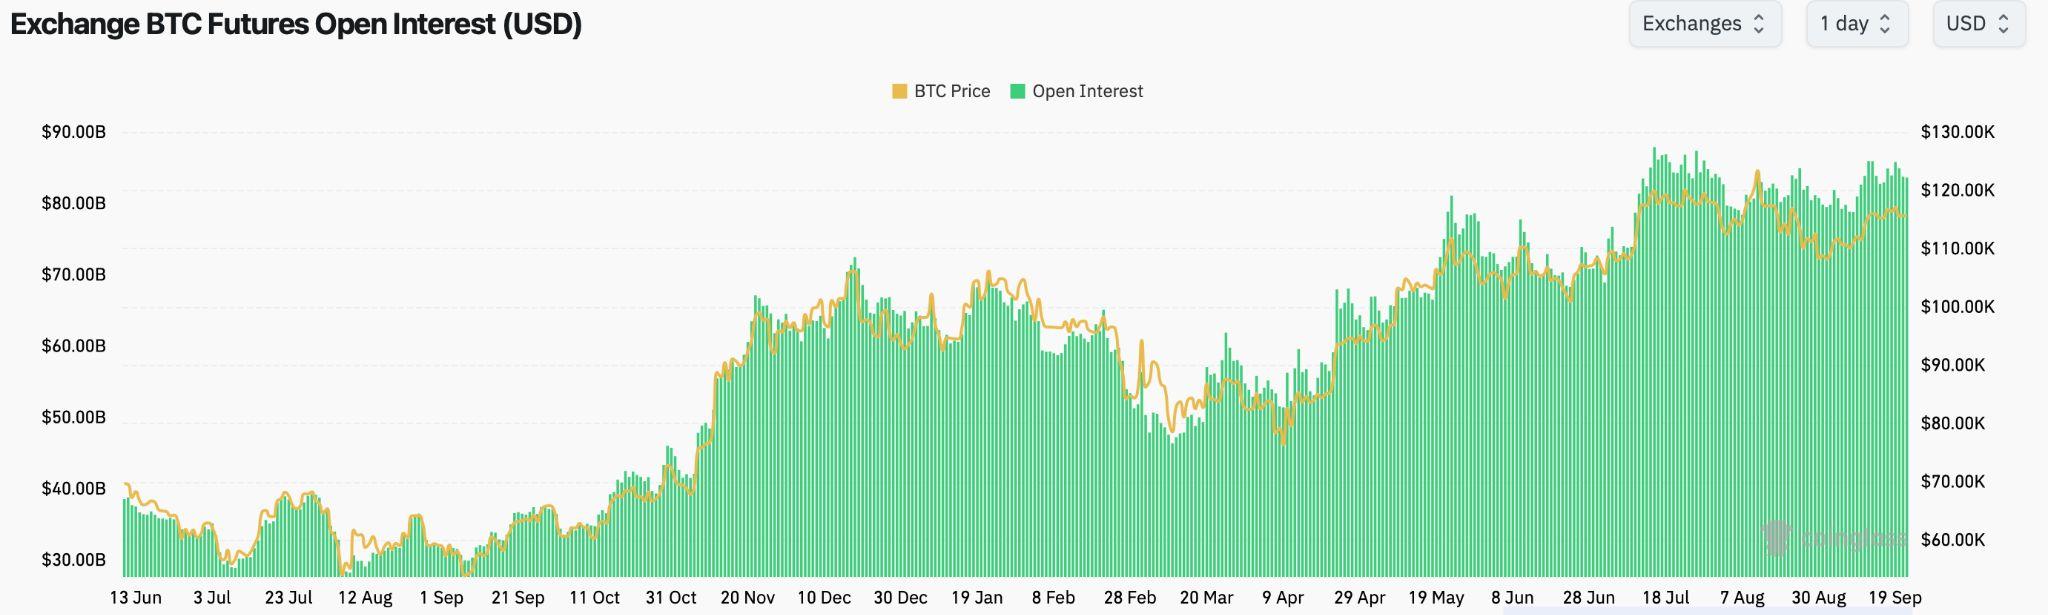

Since the FOMC meeting, OI has stabilised within the $8384 billion range, reflectingtheriseinintradayvolatilityandthetendencyforleveragedtradersto be flushed around key macro events. This underscores the heightened sensitivity of the futures market to policy-driven catalysts and its central role in shapingshort-termpriceaction.
An analysis of liquidation dominance over the past 30 days shows that the decline in open interest between September 13th-17th was primarily driven by shortliquidations.Thisdynamicproducedasequenceofshortsqueezesahead oftheFOMCannouncement,fuellingmomentumonthelongsideofperpetuals.
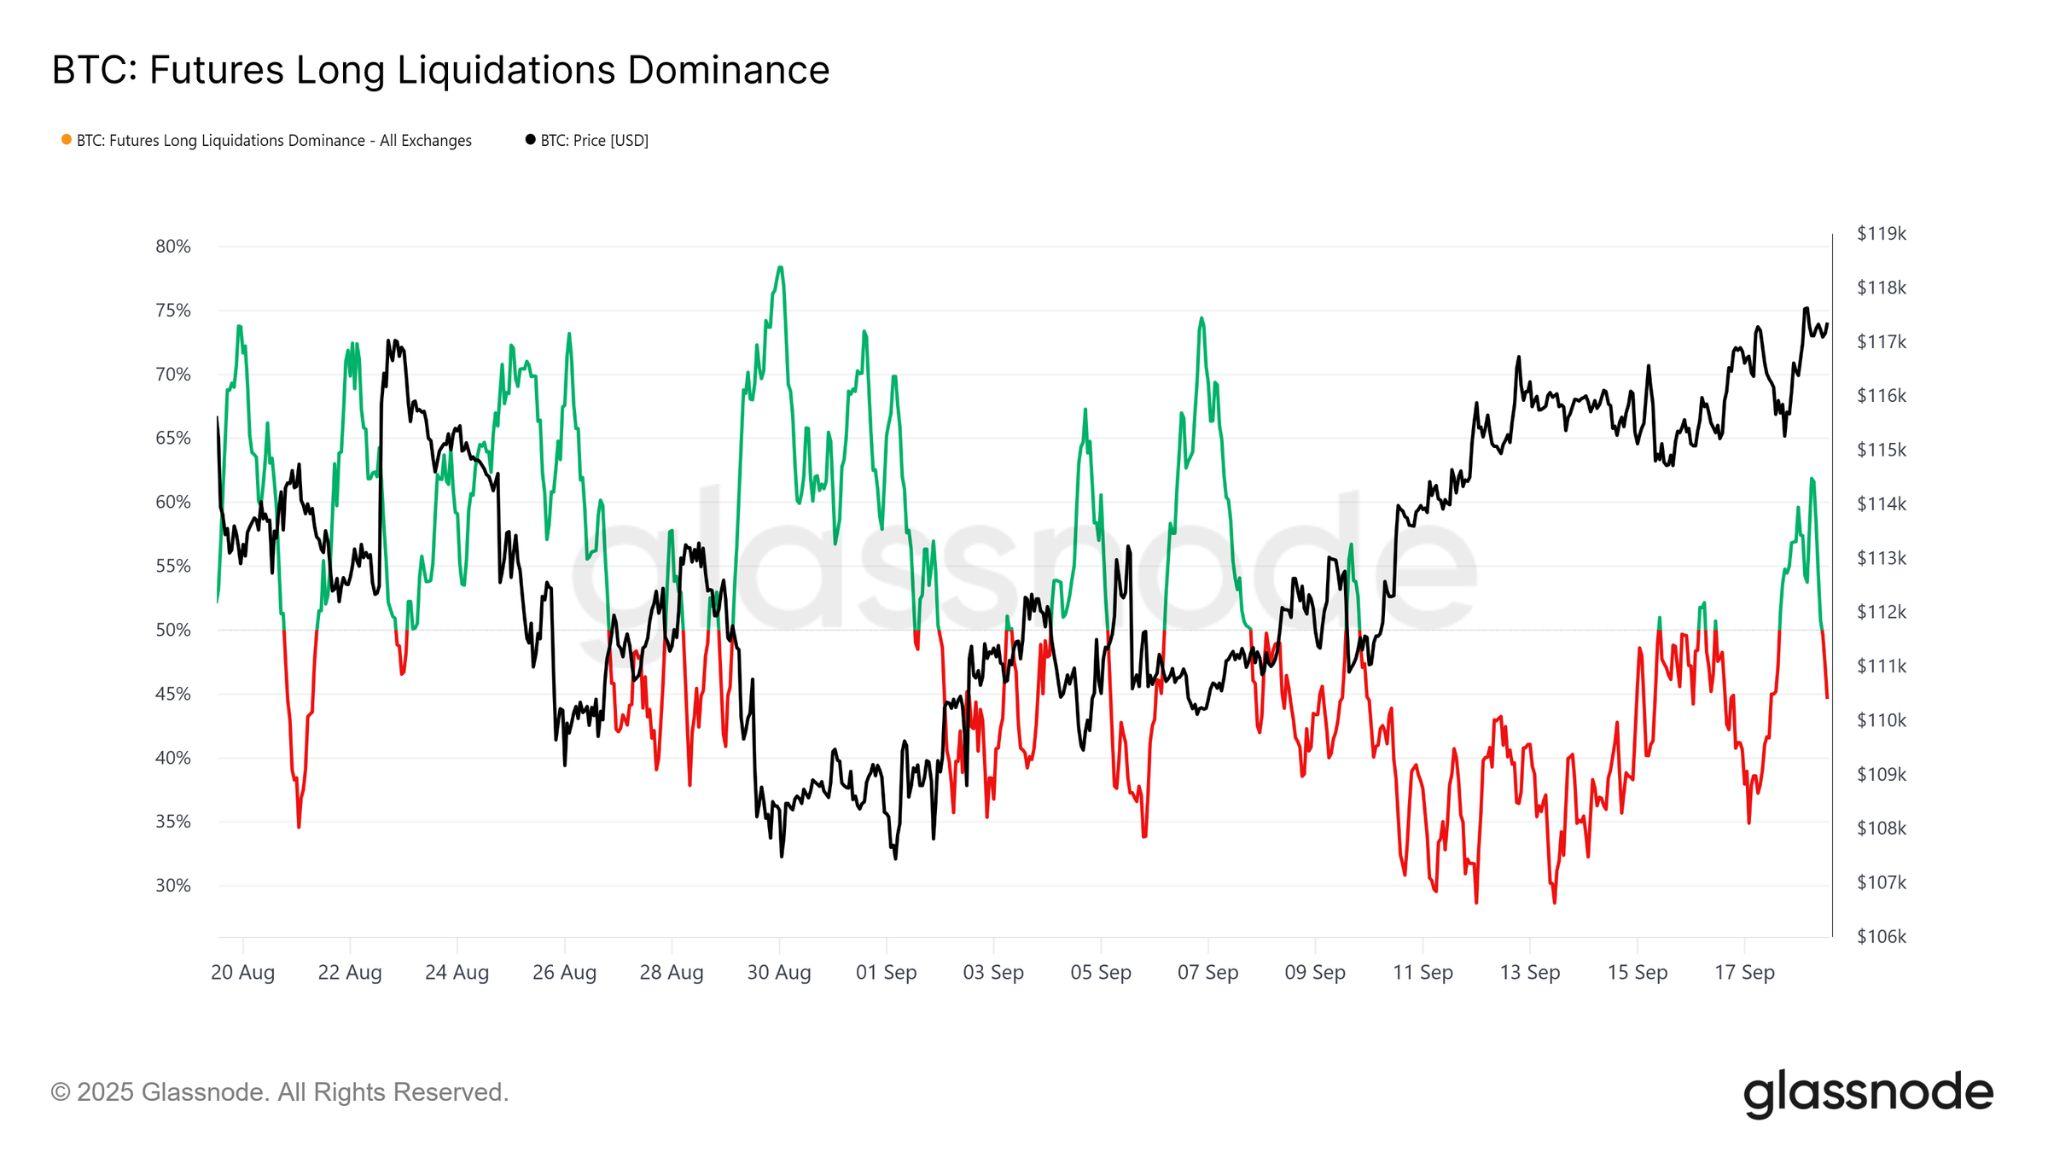
Source:Glassnode)
That regime shifted abruptly following the sharp post-rate cut pullback to $115,000, which triggered a wave of highly leveraged long liquidations. As a result, liquidation dominance spiked to 62 percent, underscoring how quickly positioningflippedunderpolicy-drivenvolatility.
Having assessed perpetual futures and volume delta indicators, it is equally importanttoexamineon-chainmetricsforabroaderviewofinvestorbehaviour.
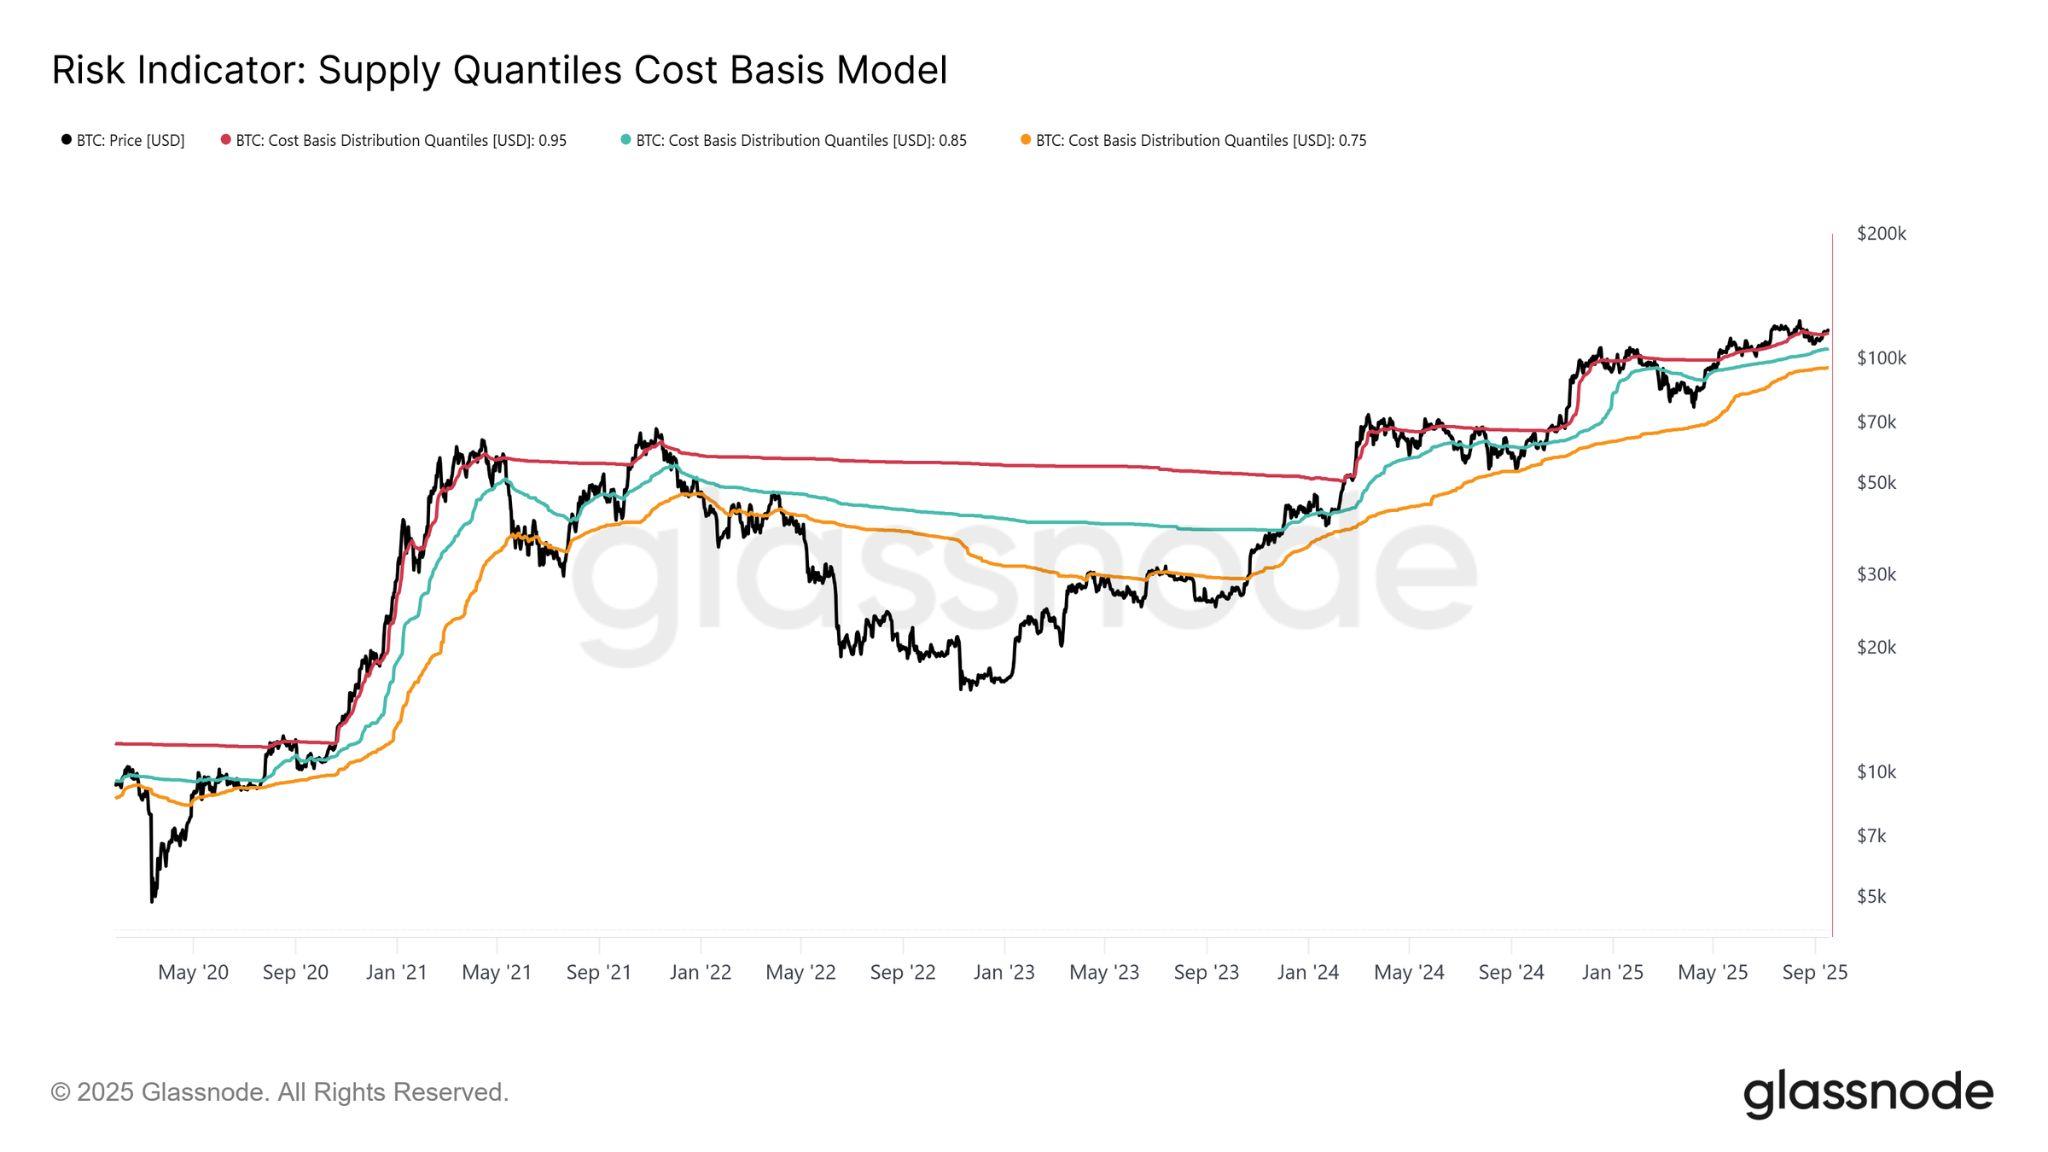
Figure5. BitcoinSupplyDistributionAcrossVariousInvestorProfiles. Source:Glassnode)
FollowingtheFOMCmeeting,BTCclimbedto$118,000,amovethatpushedthe majorityofsupplybackintoprofit.AccordingtotheSupplyQuantilesCostBasis model,BTCnowtradesabovethecostbasisof95percentofsupply,estimated at $115,200. Sustaining this level is critical for preserving demand-side momentumandmaintainingconfidenceamongholders.
Conversely, a failure to remain above $115,200 would increase the likelihood of BTC contracting back into the 8595 percent quantile range between $105,500 and $115,200. Such a retracement could expose weaker conviction among holdersandtriggerrenewedsellingpressure.


The Federal Reserve cut its benchmark interest rate by a quarter of a percentage point last Wednesday,September 17th,lowering it to a range of 4.00to4.25percent.Themove,reportedintheFederalReserveʼslatestpolicy statement, marked the first rate reduction since December and reflected mountingconcernoveraweakeninglabourmarket,evenasinflationremains abovetarget.
Fed Chair Jerome Powell emphasised that policymakers are walking a fine line between supporting employment and containing inflation. Payroll growth has slowed to near stall speed, unemployment among minorities and younger workers is climbing, and the average workweek is shrinking, clear signals that thelabourmarketisunderpressure.“Weseethatthelabourmarketissoftening. And we don't need it to soften any more, don't want it to,ˮ Powell remarked, underscoring that risks to employment are now taking greater weight in the Fedʼsdecisions.
The decision, however, was not unanimous. Stephen Miran, the Fedʼs newest governor and a former White House adviser, dissented in favour of a deeper half-point cut. His stance highlighted a growing divide inside the central bank, where some members see the need for aggressive easing while others remain wary of persistent inflation. The so-called “dot plotˮ of the Fedʼs Summary of EconomicProjections revealedawiderangeofexpectations:someforeseethe policy rate dropping below 3 percent next year, while others pencilled in rates above4percentbyyear-end.
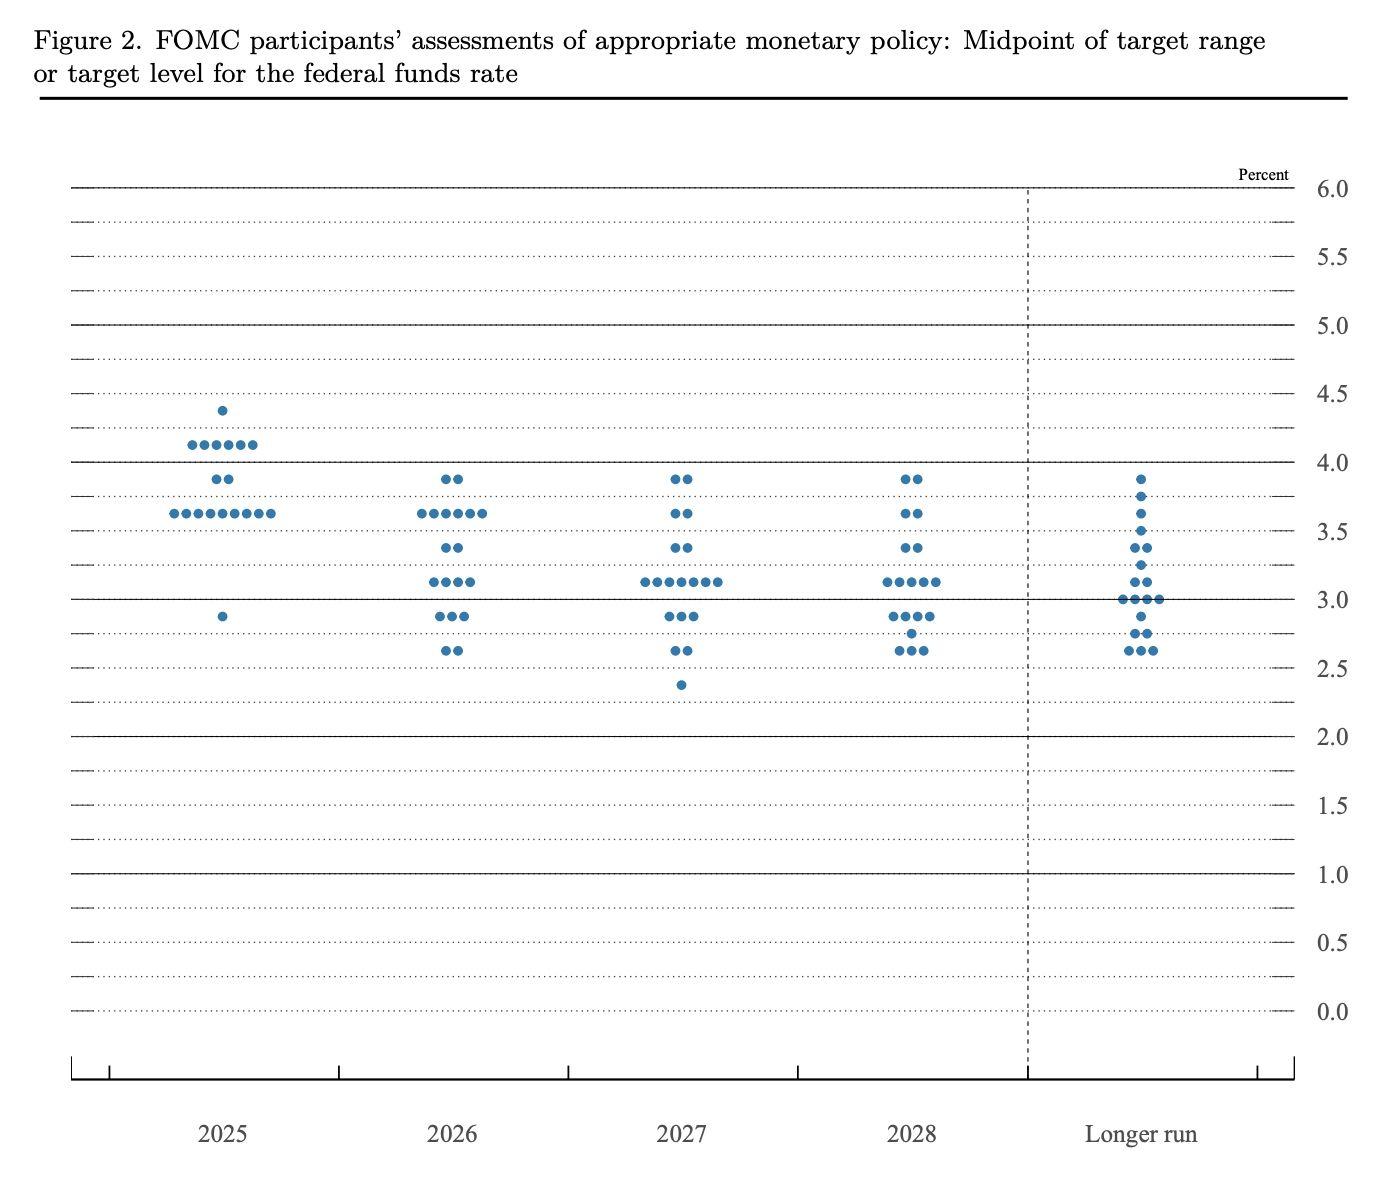
Updated economic projections released in the Fedʼs Summary of Economic Projections point to inflation ending 2025 at roughly 3 percent, well above the 2 percent target, with growth expected at 1.6 percent and unemployment at 4.5 percent. Looking further ahead, the central bank anticipates what some economists are calling a “stagflation-liteˮ environment: growth under 2 percent, inflation hovering between 2.5 and 3 percent, and unemployment edging slightly higher.
Theinternalcontradictionsarestriking.WhiletheFedprojectsinflationwillremain elevated, it is still preparing to reduce rates by another 50 basis points before year-end. This implies a willingness to tolerate above-target inflation in order to cushionthelabourmarketandpreventasharperslowdown.Thepracticaloutcome maybethatmarketsbegintreating3percentasthenewinflationbaseline.
Political drama has added to the complexity. President Donald Trump has repeatedlypressedtheFedfordeepercuts,evenattemptingtoremoveGovernor Lisa Cook. Last Thursday, September 27th, the Trump administration asked the Supreme Court for an emergency order to remove Cook from the Federal Reserveʼs board of governors . Although Powell defended the Fedʼs independence, the presence of Trumpʼs appointees, especially Miranʼs call for steepercuts,hasfueleddebateoverthecentralbankʼsautonomy.
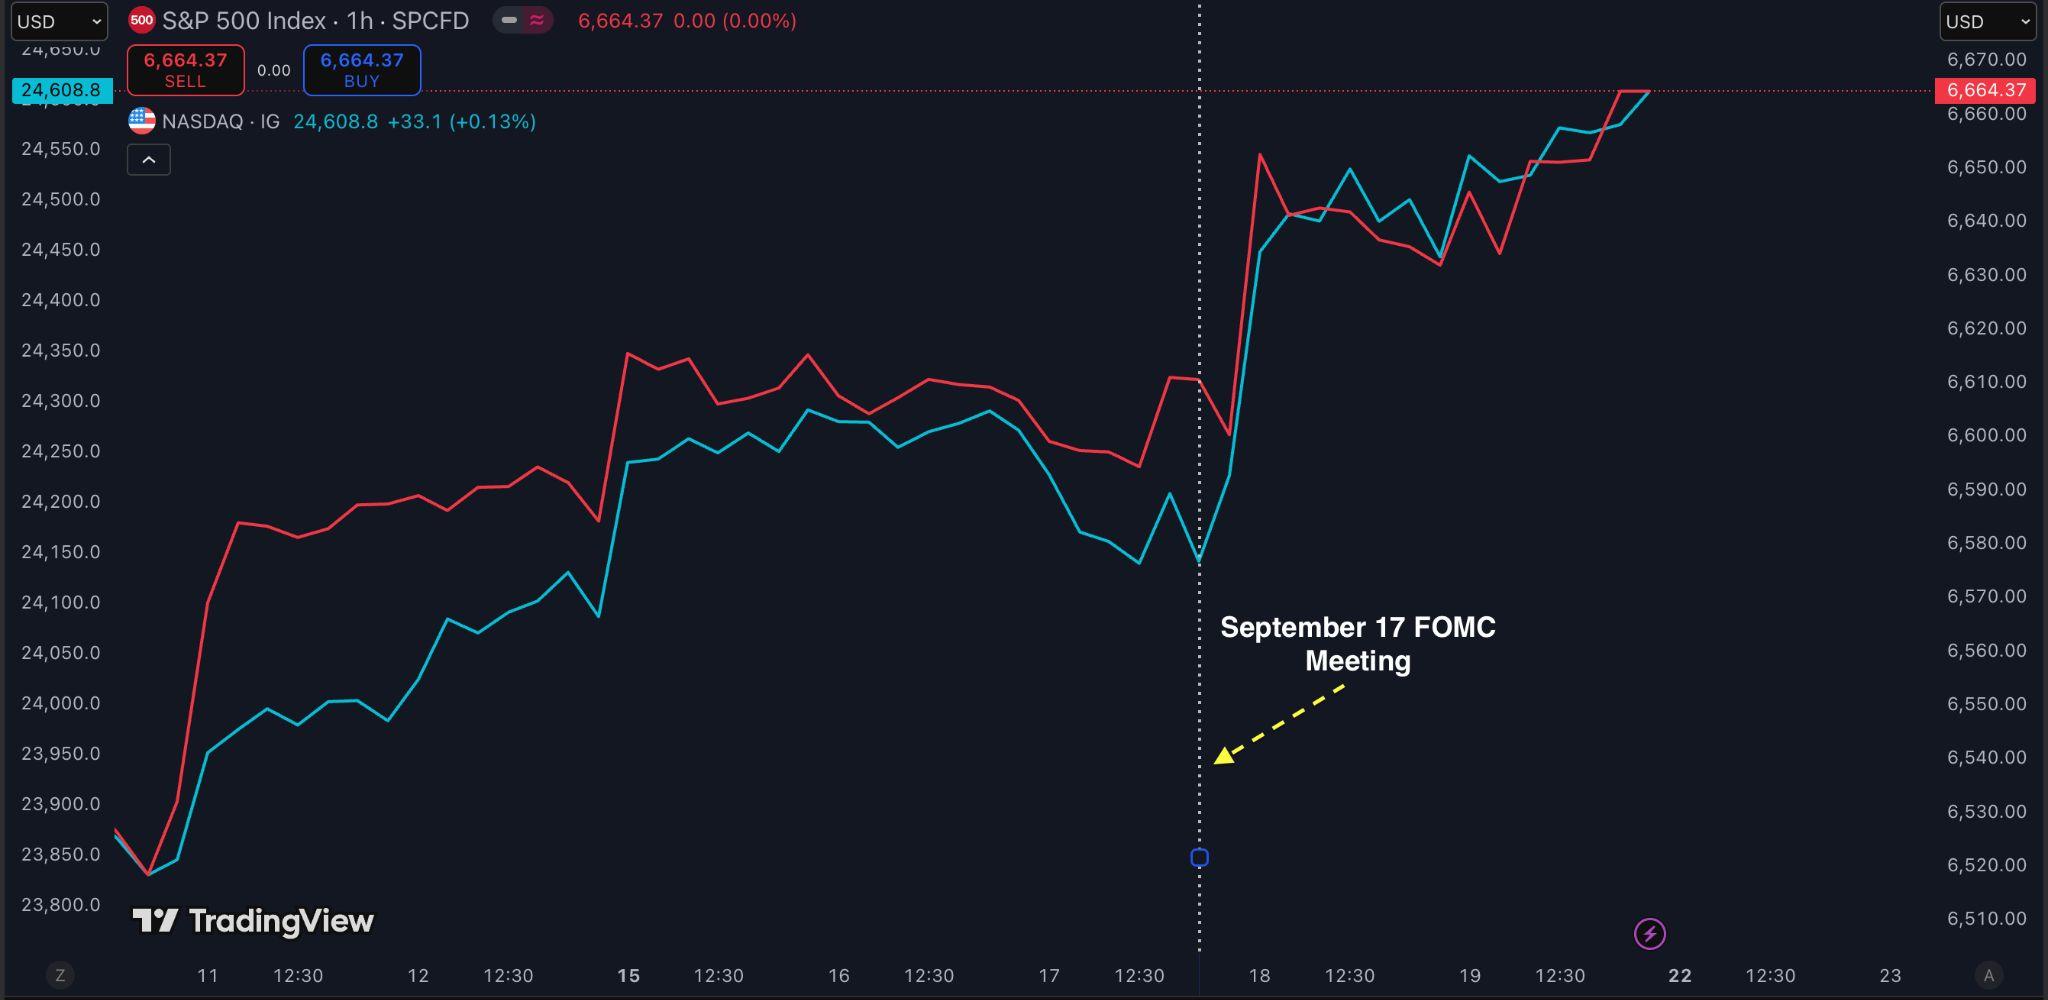
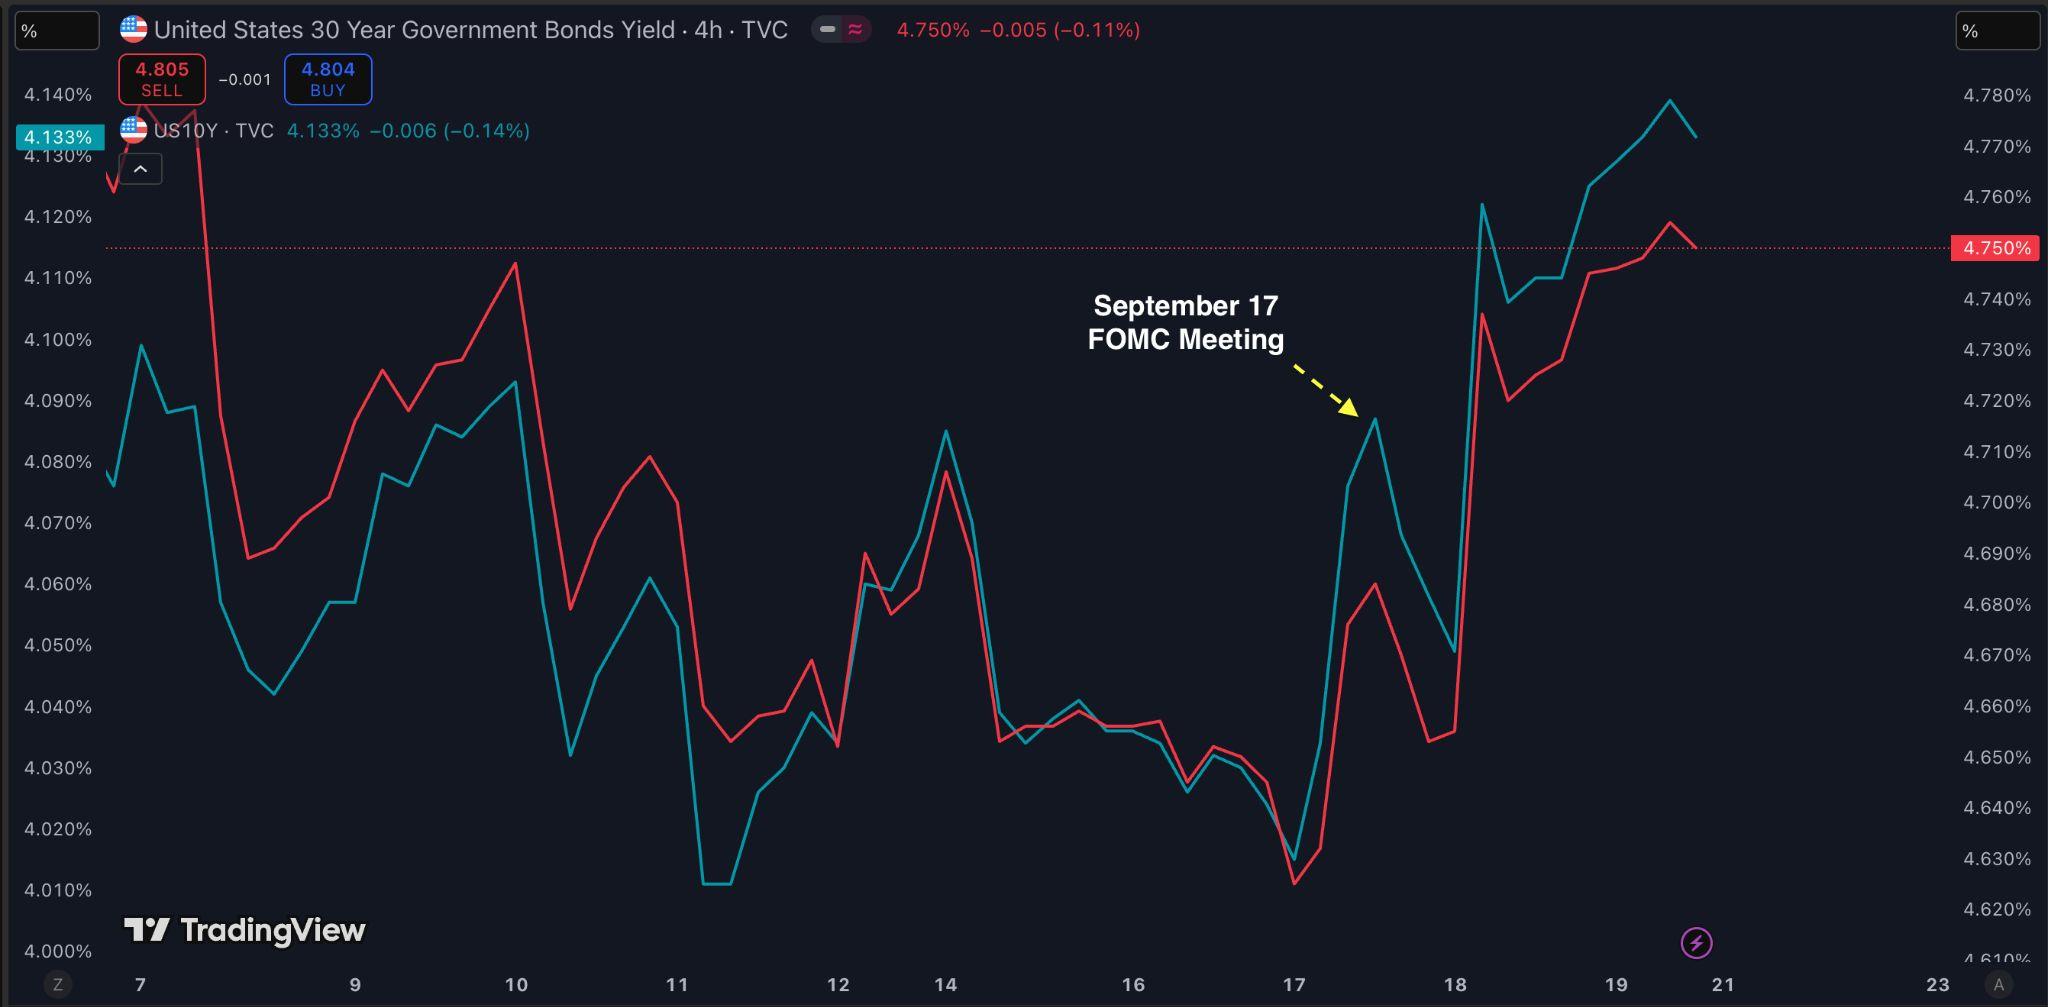
Markets reacted with volatility. US stocks, including the Nasdaq and S&P 500, closed lower after initially rising, while Treasury yields climbed as traders reassessedthepaceoffuturecuts.WhiletheFedhassignalledfurthereasing, likely in October and December, it has not committed to a clear rate-cutting cycle,leavinginvestorsuncertainaboutthepathahead.
The broader takeaway is that the Fed is navigating one of its most delicate moments in recent years. With inflation sticky and the labour market showing cracks, the central bank is betting that a gradual easing path can cushion employment without letting prices spiral further out of control. But as investors digest conflicting signals from policymakers, volatility may remain a hallmark of themonthsahead.
The Federal Reserveʼs 25 basis points rate cut came against a backdrop of risinggovernmentborrowingneeds,shiftinginvestorbehaviour,andrenewed concernsaboutlong-terminflation.
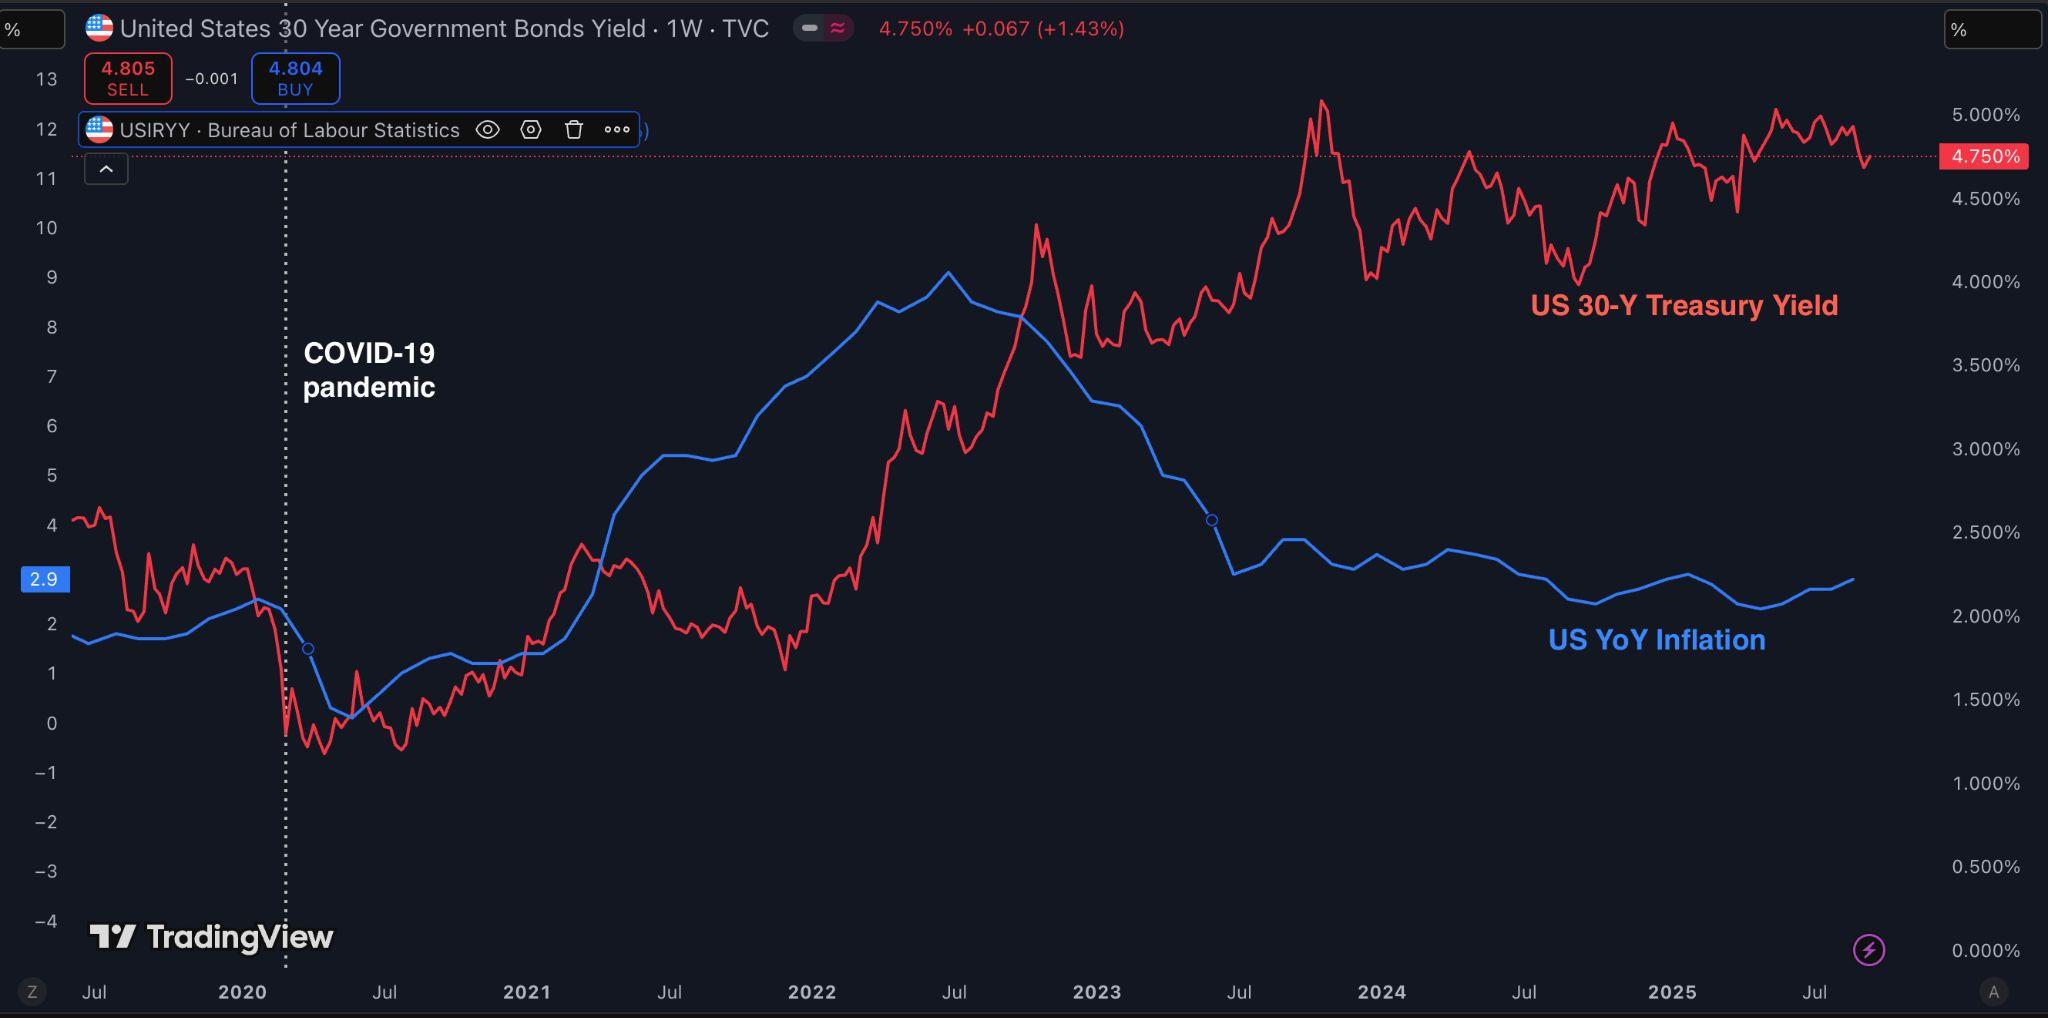
Even before the Fed meeting, long-term yields had been climbing as investors areincreasinglyquestioningwhethertheUSgovernmentcansustainaggressive fiscal spending while inflation remains elevated. In this environment, bondholders demand higher returns to hold government debt, pushing yields higherandreinforcingabearmarketforbonds.
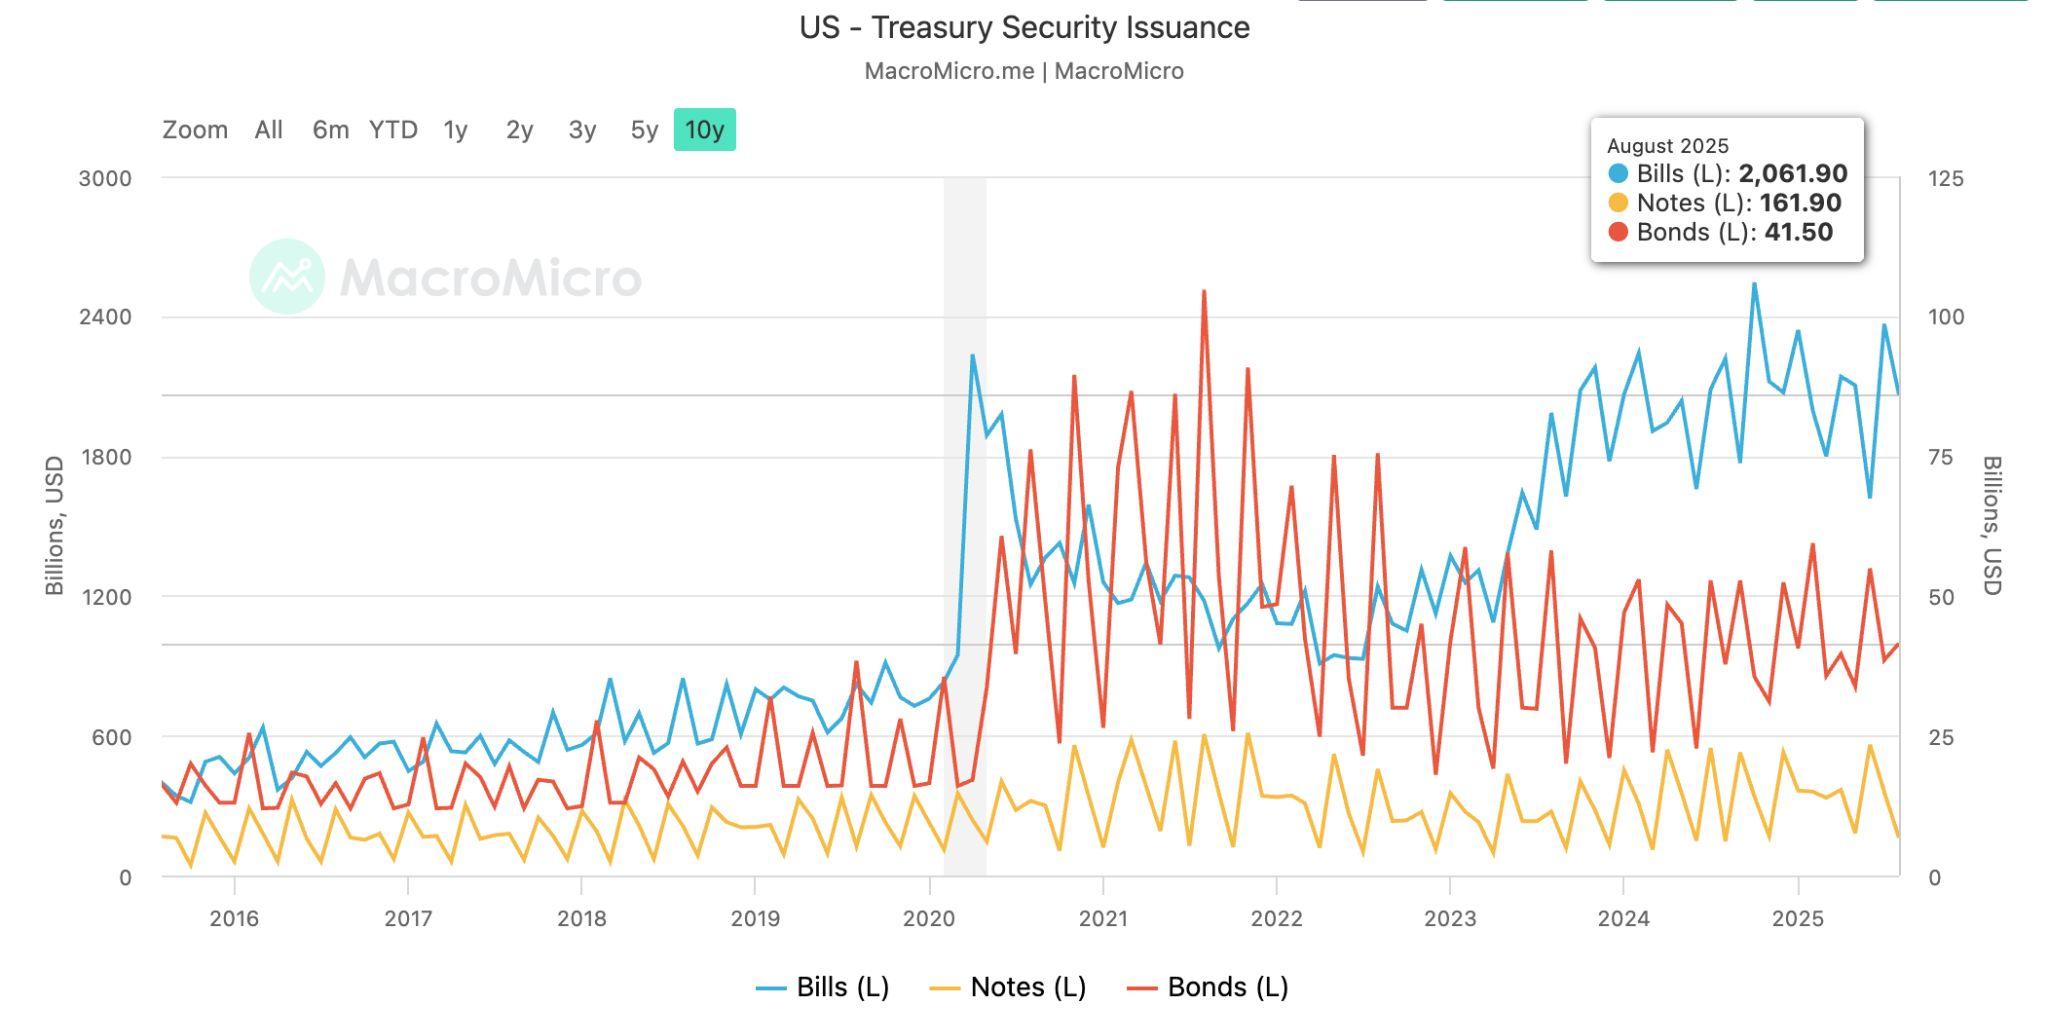
The US Treasuryʼs recent debt management strategy has leaned heavily on issuing short-term Treasury bills T-bills) rather than longer-term notes and bonds.Thiscanbeobservedinthegovernmentʼsauctioncalendarandquarterly refundingannouncements,wheretheshareofissuancehastiltedtowardT-bills.
Themotivationisstraightforward:
● Lower near-term interest costs – T-bills typically carry lower yields than long-dated bonds. By selling more short-term bills, the Treasury reduces itsimmediateinterestpaymentsonthegovernmentʼsswellingdebtload.
● Flexibility in volatile markets – Issuing bills allows the Treasury to avoid locking in higher borrowing costs for decades, giving policymakers breathingroomasratesfluctuate.
Butthiscomeswithtrade-offs.Byshorteningthematurityprofileofitsdebt,the governmentmustrefinancemoreoften.Ifinterestratesremainelevated,rollover costs could rise quickly. And by leaning too much on bills, the Treasury alters liquiditydynamicsinthemoneymarket.
Moneymarketsaretheshort-termfundingmarketswhereinstitutionsborrowand lendcash,oftenovernight.AtthecentreistheSecuredOvernightFinancingRate SOFR, the benchmark rate that reflects the cost of borrowing cash against US Treasuries. SOFR underpins trillions of dollars in loans and derivatives, including mortgages.
Hereʼs where the pivot matters. Money market funds, which manage trillions of dollars in short-term cash on behalf of investors, had been parking excess cash in the Federal Reserveʼs overnight reverse repurchase facility (reverse repo or RRP. In a reverse repo, the Fed borrows cash overnight from money funds and otherinstitutions,givingthemTreasurysecuritiesascollateral.Thefundsearna smallbutrisk-freereturn,setbytheFed,andcanalwaysgettheircashbackthe next day. This made the facility a safe parking lot for liquidity, especially when T-billyieldswerelower.
Nowthepicturehaschanged.WiththeTreasuryissuingmoreshort-termbillsat higher yields, money market funds see an opportunity to earn better returns without taking on much more risk. Instead of lending to the Fed overnight at 4 percent, they can buy T-bills yielding above that level, locking in slightly longer but still very safe returns. As funds redirect cash into T-bills, balances in the Fedʼsreverserepofacilityhavefallensharply.
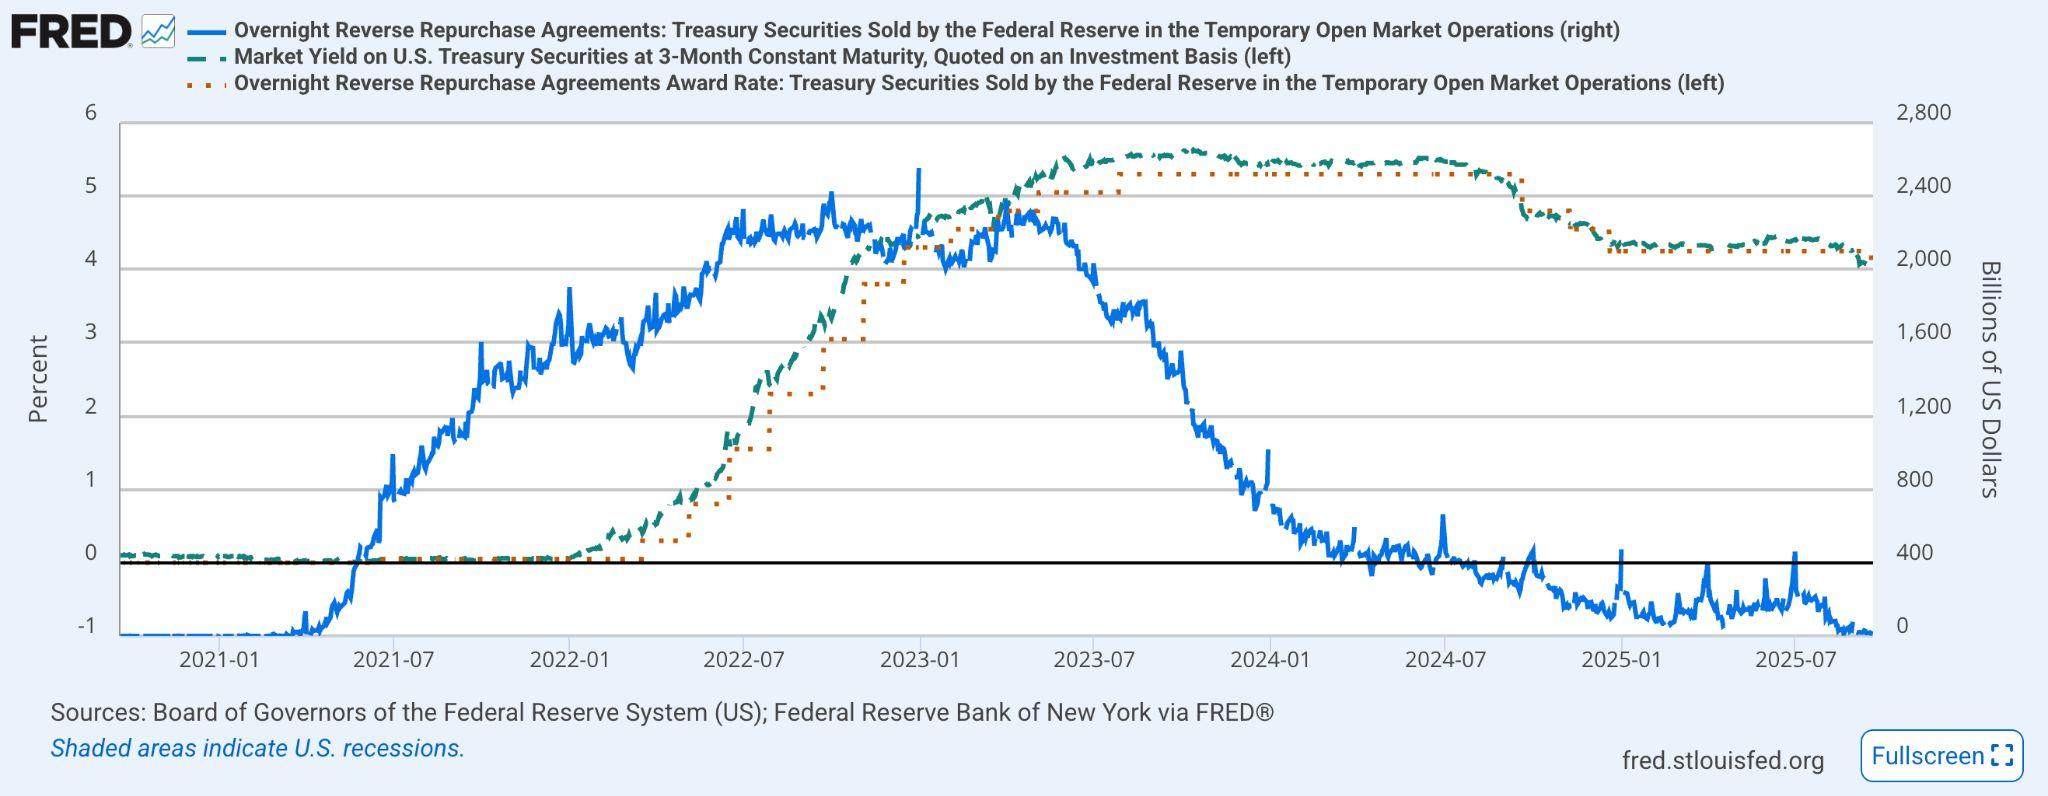
Figure12.OvernightReversePurchaseAgreements,MarketYieldon Short-TermTBills,OvernightReverseRepurchaseAgreementAwardRate, Source:FederalReserve)
Referring to figure 12, as 3-month Treasury bill yields (green) rose above the Federal Reserveʼs reverse repo rate (orange), balances in the Fedʼs overnight reverse repo facility (blue) collapsed. This dynamic shows how higher bill issuance siphoned liquidity out of the Fedʼs facility and into T-bills, tightening moneymarkets.
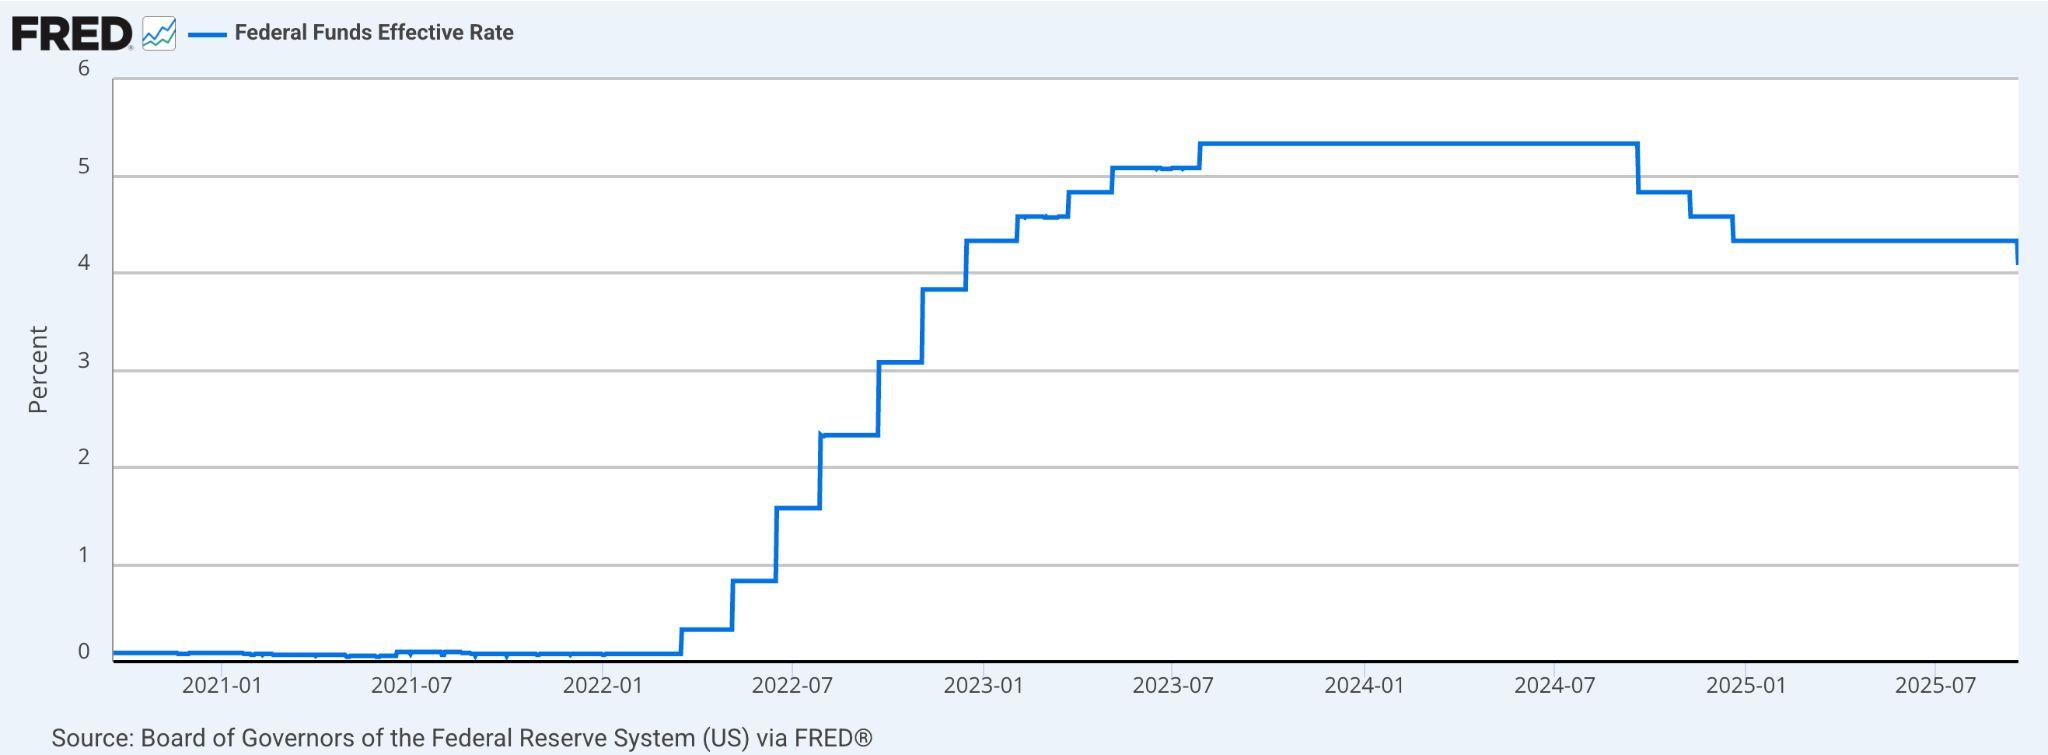
This shift effectively drains liquidity from the repo market and pushes up the SecuredOvernightFinancingRateSOFR,sincefewerdollarsareavailablefor overnightlending.Asaresult,SOFRhasbeenpressuredupward,spikingto4.51 percent in the days before the Fedʼs meeting, well above the federal funds effective rate of 4.33 percent. After the rate cut, SOFR eased slightly to 4.39 percentbutremainselevated,showingthatstresspersists.
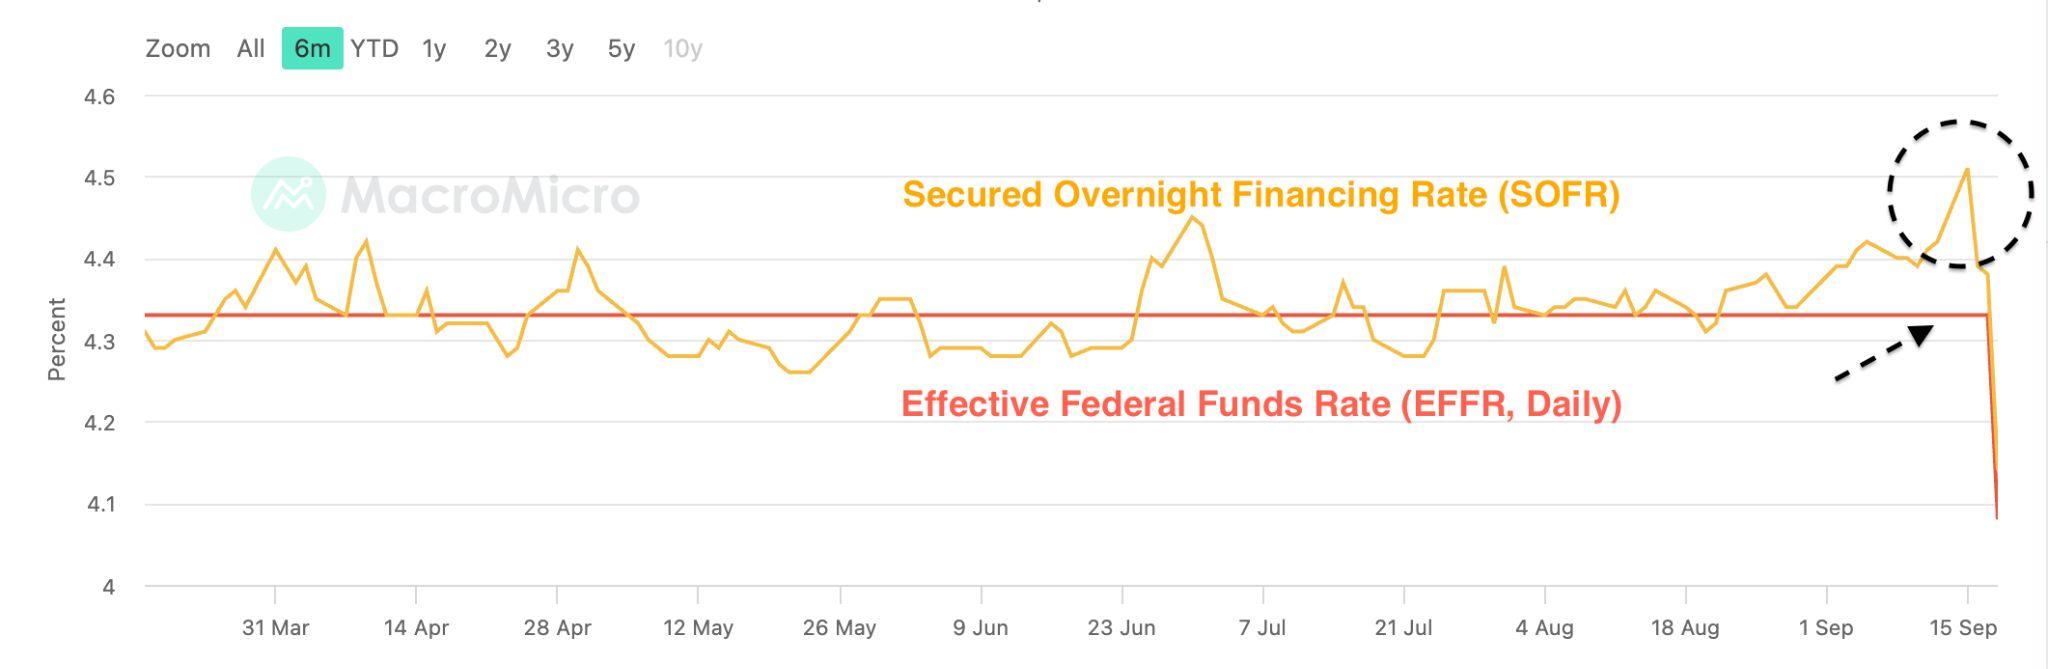
FederalFunds RateChartSource:Macromicro)
Thismovetowardshort-termdebtmayreduceTreasuryʼsnear-termcosts,butit introduces systemic risks. By draining liquidity from repo facilities, it tightens short-term funding markets, raising the potential for a squeeze that could limit broader investment. If longer-term issuance remains light, distortions could appear across the yield curve, complicating pricing for corporate debt, mortgages,andothersecurities.
Forthehousingmarket,thelinkisimmediate.Mortgageratestypicallytradeata spread above SOFR. At the peak of the real estate surge in 2023, that spread widenedtofourtofivepercentagepoints.Today,withSOFRhigherandhousing demand cooling, the margin has narrowed to under two percentage points, evidence of slowing mortgage activity. If liquidity pressures intensify, the Fed mayeventuallybeforcedtostepinwithtargetedpurchasesofmortgage-backed securitiesorotheryield-curveinterventions.
The Fedʼs quarter-point cut was intended to cushion the labour market, but for investors,themoreconsequentialstoryliesintheTreasuryʼsfundingstrategy.By leaning heavily on short-term bills, Washington is draining cash from the Fedʼs reverse repo facility and redirecting it into government securities. This shift effectively tightens liquidity in money markets, pushing SOFR higher and transmittingstressacrossthefinancialsystem.
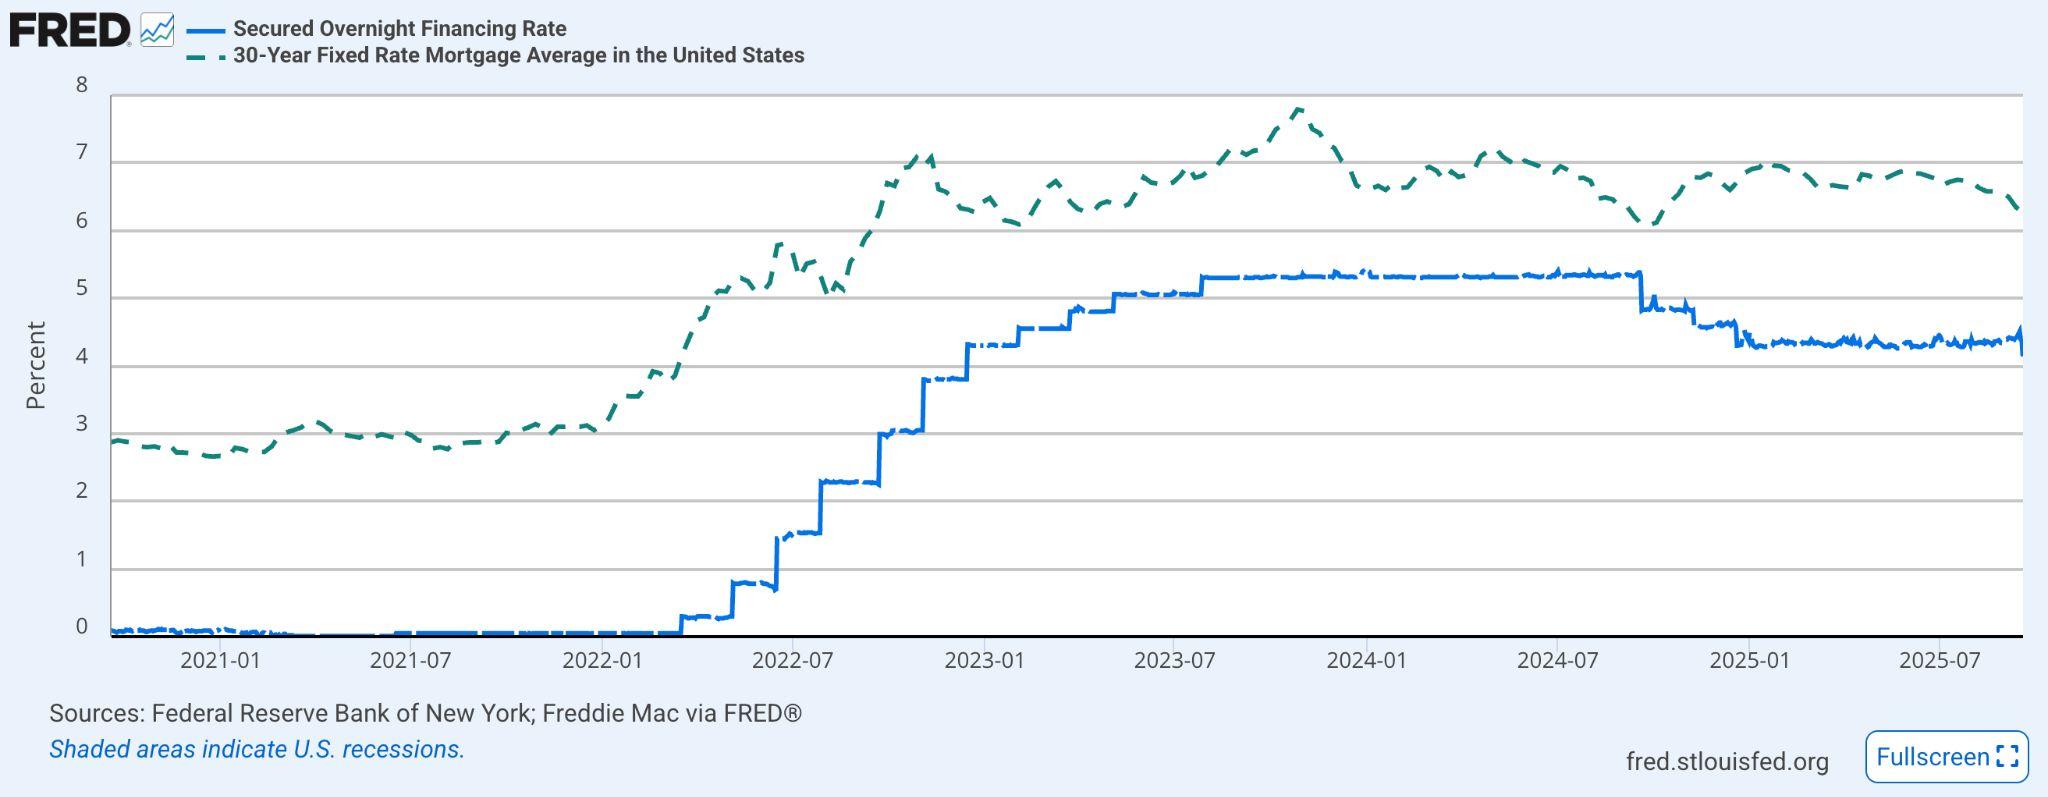
Figure14.US 30YearMortgageRates(green)TypicallyTradeataSpread above SOFR(blue).ThatSpreadHasNarrowedfromover400500bpsDuring the2023HousingSurgetounder200bpsToday
Aliquiditysqueezemattersbecauseitraisesthecostoffundingforbanks,hedge funds,andcorporationsthatrelyonshort-termborrowingtofinanceoperations. Higher SOFR feeds directly into mortgage rates, corporate debt costs, and derivativespricing.Ifthispersists,itcould:
● Slow housing further as mortgage spreads remain tight and affordability worsens.
● Pressure corporate credit by increasing refinancing costs, especially for companiesdependentonfloating-ratedebt.
● Weigh on equities as higher funding costs limit leverage, curb buybacks, andtightenfinancialconditions.
● Amplify volatility in Treasuries if demand for longer-dated debt weakens further.
In short, what looks like a cost-saving move for the Treasury today may set the stage for broader stress across asset markets. Investors now face a dual risk: higher long-term yields from inflation concerns, and tighter liquidity from short-termissuance.Howtheseforcesinteractwillbeakeydeterminantofbond, equity,andhousingperformanceinthemonthsahead.
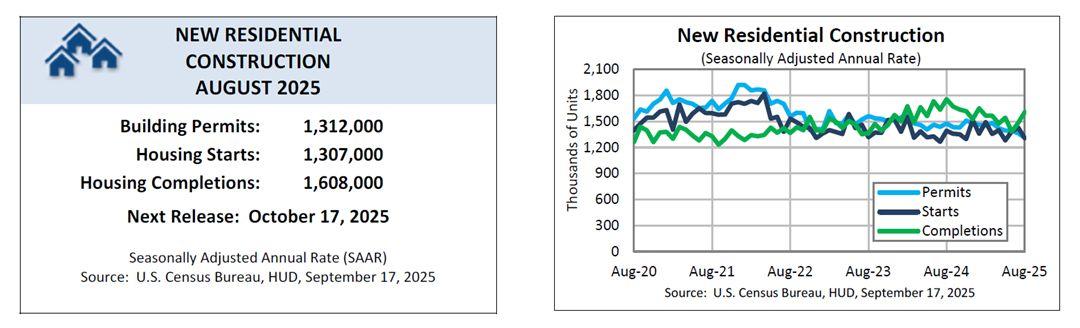
Figure15.SecuredOvernightFinancingRateSOFR,EffectiveFederalFunds RateChartSource:Macromicro)
The US housing market remains under pressure, with the new Residential Construction Report from the Commerce Departmentʼs Census Bureau releasedonWednesday,September17thshowingsingle-familyhomebuilding slumping to its lowest level in nearly two and a half years. The decline highlights how excessive inventories and weaker buyer demand continue to weigh on construction activity, even as mortgage rates ease following the FederalReserveʼslatestratecut.
Single-family housing starts dropped 7.0 percent in August to an annual rate of 890,000 units, the lowest since April 2023. Overall housing starts, including multifamilyprojects,fell8.5percenttoapaceof1.307millionunits.Muchofthe pullback was concentrated in the South, where prior overbuilding has collided withacoolinglabourmarket.
Permitsforfuturesingle-familyconstructionalsodeclined,slipping2.2percentto 856,000 units, the weakest level since March 2023.The slowdown may be necessarytoworkthroughunsoldinventory,whichhasbuiltuptolevelslastseen beforethe2008financialcrisis.
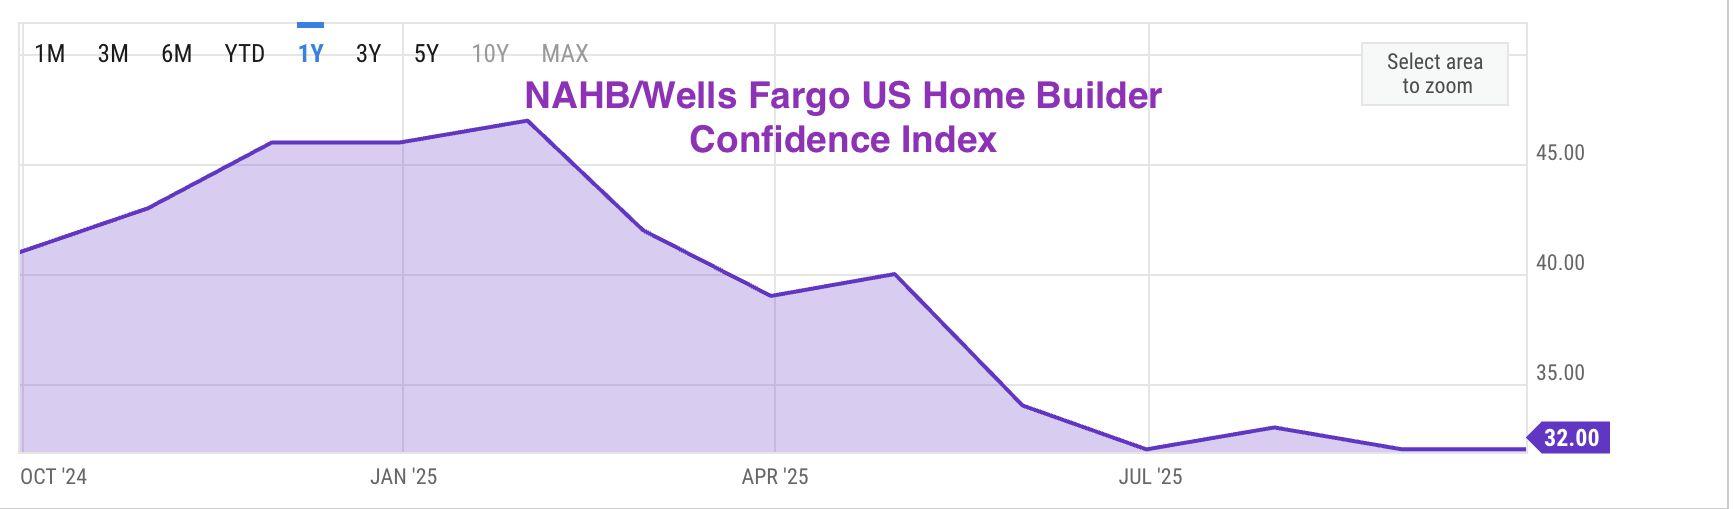
Survey data reinforce the picture of a fragile housing market. The National AssociationofHomeBuilders/WellsFargoHousingMarketIndexHMI,released last Tuesday, September 16th, held steady at 32 in September, well below the neutrallevelof50.Sentimenthasremainedinthelow30ssinceMay,reflecting persistentheadwindsfromhighconstructioncostsanduncertainbuyerdemand.
To clear excess supply, builders are increasingly turning to incentives. In September,39percentofbuildersreportedcuttingprices,upfrom37percentin Augustandthehighestsharesincethepandemic.Theaveragereductionheldat 5 percent, while 65 percent of builders said they offered other sales incentives suchasmortgageratebuydownsorupgradesatnoadditionalcost.
The recent declines in mortgage rates could support demand in the coming months, but builders are still grappling with elevated costs for labour and materials.
TheFedʼsdecisionlastweektocutitsbenchmarkinterestrateby25basispoints to a target range of 4.00 to 4.25 percent has helped lower borrowing costs. Freddie Mac data show the average 30-year fixed mortgage rate fell to 6.35 percent in mid-September, the lowest in nearly a year and down from above 7 percentinJanuary.
Whilethisdeclinemaydrawsomebuyersbackintothemarket,analystscaution thatbroadereconomicconditionscouldblunttheimpact.Risingunemployment, subdued job creation, and weak consumer confidence continue to weigh on housingdemand.
Beyond mortgage rates themselves, broader money market dynamics may add another layer of stress to housing. The Treasuryʼs pivot toward issuing more short-term bills has been draining cash from the Federal Reserveʼs overnight reverse repo facility, pushing the Secured Overnight Financing Rate SOFR higher.
A higher SOFR feeds directly into funding costs across the financial system, including mortgages, which are typically priced at a spread above short-term benchmarks. If liquidity tightens further, mortgage spreads could remain compressed, limiting affordability even if headline mortgage rates drift lower alongsideFedcuts.
In practical terms, this means builders and buyers may not benefit fully from easier monetary policy. Elevated funding costs for banks and lenders could translate into tighter credit conditions, slower mortgage approvals, and weaker housing demand. For a market already struggling with excess inventory, a liquidity squeeze would risk extending the downturn in residential construction anddelayingrecovery.
Residential construction has already contracted in the first half of 2025 and is expectedtosubtractfromGDPagaininthethirdquarter.Residentialinvestment is expected to remain a drag on growth, as the industry struggles to work throughhighinventoriesandslowingdemand.
The outlook is not without some upside: if rates continue to decline as the Fed signalsfurthercutsahead,buyeraffordabilitycouldgraduallyimprove.However, without stronger labour market conditions and renewed consumer confidence, anyrecoveryinhousingislikelytobemodest.
Bottom Line: The latest government data and builder surveys show a housing sector still mired in a prolonged slump. While falling mortgage rates offer some relief, the Treasuryʼs funding pivot and tighter liquidity conditions risk keeping affordability constrained. Together with job market uncertainty and persistent construction costs, these forces suggest housing will remain an economic headwindwellinto2026.


● UKborrowingsurgedto£18BinAugust2025,thehighestinfiveyears andwellaboveOBRforecasts
● ThefiscalstrainraisesrisksforUKmarkets,potentiallypressuringgilts, sterling, and limiting pre-election fiscal giveaways. For crypto, persistentborrowingconcernsmayfuelsafe-havenflowsintoUSD
InAugust2025,UKgovernmentborrowingreached£18billion,thehighesttotal for that month in five years — significantly outstripping forecasts made by economists and the Office for Budget Responsibility OBR. According to the Office for National Statistics, last Friday, September 19th, revenues from taxes andNationalInsurancedidincreasecomparedwiththepreviousyear,yetthese gains were more than offset by sharply higher spending on public services, welfarebenefits,andinterestpaymentsonthenationaldebt.
TheborrowingforthefinancialyeartodateAprilthroughAugust)nowstandsat about£83.8billion,asumthatsurpassesinitialOBRprojectionsby£11.4billion. Thisrepresentsnotonlygreaterborrowingthaninthesameperiodlastyear,but alsomarkstheworstperformanceinthatfive-monthspansincetheearlystages oftheCOVID19pandemicin2020.
Oneoftheprimarydriversofthisworseningfiscalpicturehasbeentherisein debt interest payments, which in August hit £8.4 billion, with inflation and index-linked liabilities contributing to their escalation. Additionally, VAT receiptsunderperformedexpectations,whilereviseddataincreasedestimates oflocalauthorityborrowing,furtherworseningthefiscalgap.
Above-forecastborrowingunderscoresthechallengesforUKfiscalpolicyata time when gilt yields remain sensitive to debt dynamics. For markets, persistentborrowingneedscouldputpressureonUKbondsandsterling,and constrainthegovernmentʼsabilitytodeliverpre-electiontaxcutsorspending pledges.
For crypto investors, this matters because higher borrowing costs and fiscal strain can spill into broader risk sentiment, driving volatility across assets. If UK debt concerns weaken sterling or push gilt yields higher, it could accelerate safe-haven flows into dollar assets — a dynamic that often ripples into Bitcoin and other digital assets. At the same time, persistent fiscal uncertainty reinforces the longer-term narrative that decentralised, non-sovereign assets like Bitcoin offer an alternative store of value when traditionalfiscalanchorslookfragile.

● EUfinanceministersagreedonpoliticalguidanceforthedigitaleuroʼs holdinglimitsandissuanceframework
● The move underscores the EUʼs push for financial sovereignty and paymentinfrastructureindependence
EuropeanUnionfinanceministers,meetinginCopenhagenonSeptember19th, 2025 as the Eurogroup, agreed on political guidance concerning the institutionalframeworkfortheproposeddigitaleuro.Thediscussiontookplace with the participation of European Central Bank ECB President Christine LagardeandEuropeanCommissionerValdisDombrovskis.
AccordingtotheofficialEurogroupcommuniqué,ministersreachedconsensus onprovidingguidancefortwokeyareas:
● Theframeworkfortheceilingonholdinglimits(themaximumamountof digitaleuroanindividualcouldhold).
● Theframeworkforthefinalissuanceofadigitaleuro.
The Eurogroup President, Paschal Donohoe, described the agreement as a “basis for discussionˮ to be taken forward in the Ecofin Council format, highlighting that there was broad consensus among ministers on these institutionalissues.
TheEuropeanCommissionfirsttableditslegislativeproposalforadigitaleuro inJune2023.ThisproposaloutlinestheframeworkwithinwhichtheECBcould issueacentralbankdigitalcurrency.TheECBitselfiscurrentlyinapreparation phase (running until October 2025, focusing on technical and design questions. A decision on whether to proceed with issuance will only be made onceEUlegislationisinplace.
Officialdocumentshighlightseveralareasstillunderdiscussion:
● Thepreciselevelofholdinglimitsremainsundecided.
● Privacyandanti-moneylaunderingrequirementsmustbebalanced.
● Thedigitaleuromustbedesignedsoasnottodisintermediatebanksor destabilisedeposits.
The Eurogroup stresses that the digital euro is not only a question of modernising payments but also one of financial sovereignty within the EU. Christine Lagarde has previously described the project as both a financial innovation and a political signal of Europeʼs capacity to provide its own paymentinfrastructure.
The Eurogroup emphasises that the digital euro is not just about payment modernisation but also about financial sovereignty within the EU. Christine Lagardehasdescribedtheprojectasbothafinancialinnovationandapolitical signalofEuropeʼscapacitytoprovideitsownpaymentinfrastructure.
For investors and traders, the development matters because a digital euro could reshape parts of the global payment infrastructure and intensify competitionwithdollar-dominatedcross-bordersettlementsystems.Forcrypto markets, it highlights that state-backed digital currencies are edging closer to operational reality, with direct implications for how stablecoins, CBDCs, and tokenised assets will be regulated and adopted. On a macro level, Europeʼs push for a sovereign digital currency underscores a broader shift in global monetary dynamics, one that may pressure other jurisdictions, including the UnitedStates,toacceleratetheirowndigitalmoneyinitiatives.

In a landmark move, the US Securities and Exchange Commission (SEC) voted last Wednesday, September 17th, to approve new rule changes that allow national securities exchanges, such as the NYSE, Nasdaq, and Cboe Global Markets, to use generic listing standards for spot cryptocurrency and commodity-based ETFs. Previously, each spot crypto ETF application was evaluated case-by-case, with both the exchange and the asset manager submitting separate filings to different SEC divisions; now, the streamlined rules aim to reduce the maximum time from filing to launch from 240days(orevenlonger)tojust75days.
The change is widely seen as a major shift in regulatory posture under the Trump administration, which has expressed a pro-crypto agenda. The new generic standards specify criteria that asset managers and exchanges must satisfy in order for spot crypto ETFs to be approved without the need for bespoke regulatory review, if certain conditions are met. One such pathway for expedited approval involves assets that already have regulated futures contracts in place with the Commodity Futures Trading Commission(CFTC)foratleastsixmonths.
With these rules in place, dozens of new spot crypto ETFs, tracking tokens beyond the long-approved Bitcoin and Ethereum, may be launched as early as October. Expected candidates include ETFs tied to Solana and XRP. At the same time, not all tokens will qualify under the new regime. Potential ETF issuers still have work to do around legal filings, services providers, marketing plans, and ensuring compliance with the listing standards.
Overall, the SEC’s decision removes what was arguably the last major regulatory friction preventing a wave of spot crypto ETFs. This reform could significantly lower barriers to entry for these investment products, possibly expanding crypto access for institutional and retail investors alike, while also introducing standardised oversight to balanceinnovationwithinvestorprotection.