2024 IMD Smart City Index
In part nership with

“I have never felt salvation in nature. I love cities above all.”
— Michelangelo
“The mark of a great city isn’t how it treats its special places – everybody does that right – but how it treats its ordinary ones.”
— Aaron M. Renn
(The Urban State of Mind: Meditations on the City)
2 IMD Smart City Index 2024
IMD Smart City Index 2024
Introduction
A stable and mature dataset
3 IMD Smart City Index 2024
IMD Smart City Index 2024
Introduction: a stable and mature dataset
Welcome to the 2024 edition of the IMD Smart City Index.
Following the methodological changes made last year, the IMD Smart City Index (SCI) has now reached what can be considered as its stable configuration – its cruising altitude. Analysts and users of the SCI can now use reliable time series (across five years) to make meaningful comparisons between the performance of specific cities across time. As we have often underlined before – and as is always true with any kind of complex composite index – one should be careful not to read too much into year-to-year comparisons. We are proud that the SCI has now reached the stage at which comparisons can be made on a moving average basis, which is much more meaningful from a number of perspectives, as will be illustrated below.
We are delighted to continue working in partnership with WeGO. In 2023, it allowed us to further our thinking about the composition, architecture, and methodology of the index. It also provided opportunities to heighten the index’s visibility and bring it closer to the concerns and strategies of city leaders around the world, a central part of this being the Seoul Smart City Prize meeting of September 2023.
This year’s ranking is characterized by a high degree of stability. The index’s coverage remains practically the same (142 cities are included, as opposed to 141 in the previous edition), and its list of leading cities (the top 20) remains very much the same as last year. The cities that continue to perform highly (i.e. that edge up the rankings or barely shift1) are also very much the same as last year’s. The SCI methodology has also entered its age of maturity, and as such the data used in 2024 is very much the same as that used in 2023. 2
The SCI was designed as a tool for action. Since it is based on people’s perceptions (captured via surveys), it is critical that the answers are calibrated to the specific context of the cities assessed. Until the 2021 edition of the report, we relied on country-level HDI data (provided by the UNDP, or United Nations Development Programme). In 2022, we explored the possibility of using city-level HDI data, which provides a more granular, and therefore realistic, vision of the socio-economic environment of specific cities. In 2023, we ‘built back’ the SCI time series based on this updated methodology to allow for meaningful time comparisons. The 2024 edition is the first ever in which moving averages – typically calculated over three consecutive editions of the SCI report – can be analyzed.
Against this background of stability and maturity of the SCI, several important messages emerge from this year’s data, as well as from the enhanced capabilities the index offers to compare them across time:
1
2
3
The global landscape of smart cities continues to change, but such changes are more spectacular among middle-ranking cities than among the top performers.
The experience of SCI champions (now enriched by the new analytical possibilities offered by a mature SCI3) continues to be a possible source of inspiration for all cities across the world.
Globally, as the world continues to change rapidly in the face of increased uncertainties, cities are places where new solutions and ways to be future-ready are emerging. In such a world, digital inequalities take on a new meaning.
1 Given the new possibility offered by SCI to use moving averages, this continuous level of high performance has been redefined on the basis of average ranking on three-year periods (2019-2021, 2020-2023, and 2021-2024), as explained later in this section.
2 For a complete description of the SCI methodology, please see the relevant section of the report’s website.
3 In particular, the way we can now look at the dynamic performance of such champions through three-year moving averages.
4 IMD Smart City Index 2024
IMD Smart City Index 2024
Introduction: a stable and mature dataset
The global landscape of smart cities continues to change but at a slower pace than in recent years. At the top, it is becoming even more of an Asia-Europe game.
One of the signs that the Smart City Index has reached maturity can be found in its ability to call on significant time series, spanning the 2019-2024 period. This new situation also allows observers and analysts to take a step back from ‘year-to-year’ comparisons, which can be both perilous and misleading.
Regarding 2024 data, the top 20 cities remain largely those seen in 2023.
Apart from the rather spectacular progression of Taipei City (which enters the top 20 for the first time), most other SCI leaders remain largely where they were in 2023. However, the absence of any North American city in the top 20 is conspicuous. Using threeyear moving averages (i.e. comparing a city’s average ranking for the period 2021-24 to that of the period 2020-23), a significant number of US cities have been losing ground. This is the case in particular for Washington DC, Denver, and Los Angeles (-12, -12, and -11 respectively), but also for San Francisco (-9), New York City (-7), and Chicago (-4).
Canadian cities seem to follow the same movement, with Ottawa moving down three positions and Montreal nine. A more detailed look into the data shows that several key areas of concern have grown in most Northern American cities, especially infrastructure and safety. On the contrary, overall quality of life has played a positive role in an increasing number of European cities.

IMD Smart City Index 2024
1 Zurich 11 Stockholm 2 Oslo 12 Dubai 3 Canberra 13 Beijing 4 Geneva 14 Hamburg 5 Singapore 15 Prague 6 Copenhagen 16 Taipei City 7 Lausanne 17 Seoul 8 London 18 Amsterdam 9 Helsinki 19 Shanghai 10 Abu Dhabi 20 Hong Kong
1
IMD Smart City Index 2024
Introduction: a stable and mature dataset
SCI super-champions continue to show the way by maintaining high performance levels. A few fast-moving contenders are on their heels.
Using a definition of ‘SCI champions’ as those cities that (since the creation of the SCI in 2019) have never dropped in terms of average rankings established for three years (moving average), twelve cities stand out.
Within that group of 12, we can further distinguish two subgroups, namely (1) that of the ‘super-champions’ (currently members of the SCI top 20), and (2) that of the ‘fast-moving contenders’ (currently ranked between 20 and 35).
Based on the period covered by all previous editions of the SCI Report, super-champions (ranked in the top 20) include six cities: Zurich, Oslo, Singapore, Abu Dhabi, Beijing, and Seoul.
SCI champions: the super champions

On the same basis, the group of fast-moving contenders (ranked between 20 and 40) is also composed of six cities: Sydney, Hong Kong, Shanghai, Tallinn4, Riyadh and Melbourne.
SCI champions: the contenders
Average 19-20-21

20-21-23
What do these champions have in common? With very few exceptions, cities in the top 20 are geographically located in areas where social and economic environments are relatively predictable, even against the overall climate of global uncertainties. They are also cities in which visible initiatives have been taken to facilitate the lives of citizens (e.g., by developing public transportation networks or eco-compatible mobilities), and to improve the overall ‘quality of life’ associated with their respective names.
Relative to specific local conditions, culture, and history, such initiatives have focused on developing green spaces and broadening opportunities for cultural events and social bonding, for example. In the majority of these leading cities, such efforts have been combined with innovative strategies to attract and retain talent, foster investment in a selective fashion (e.g. pro-sustainability), and tackle longstanding issues regarding geographical inequalities and inclusion.
4 Tallinn started to be included in the index in 2020. The first data point hence reflects only a two-editions moving average.
6 IMD Smart City Index 2024
2
Average
19-20-21 Average 20-21-23 Average 21-23-24
Average
Average 21-23-24
IMD Smart City Index 2024
Introduction: a stable and mature dataset
3
Faced with growing uncertainties, cities are on new paths toward future readiness. Addressing digital divides is a priority.
Like most other economic agents, cities have to design and adopt strategies that will resist the test of a future plagued with growing uncertainties. As was underlined in previous editions of the Smart City Index Report – as well as in the accompanying book ‘Cities in Times of Global Emergencies’ (2022) – it is vital that such strategies should increase the resilience of cities, without compromising their fundamental goals, aspirations, and principles. Health-related concerns remain high, while climate-related ones grow even larger. This combination is now compounded by the emergence of renewed international tensions, both economic and geopolitical.
What can cities do in such a context? In other words, how can they remain future-ready if they cannot link their efforts to any credible scenario? The examples set by SCI champions suggest a few possible innovative paths in this respect. Three major principles seem to emerge as effective ways to keep cities at the forefront of future readiness. They can be summarized as follows:
1
2
Identify and consolidate existing comparative advantages: geographical situation, natural environment, and particular strengths based on history and culture. Incidentally, such advantages and strengths can just as likely be linked to those of the country where a particular city happens to be, or – on the contrary – have a different branding strategy vis-à-vis that country.
Single out the particular strengths existing locally that match key emerging trends likely to shape the future. The existence of a high-quality education system (possibly with the presence of one or several first-tier universities or business schools) would be one key example, as assets allowing a city to be labeled as ‘globally connected’ (airports, road/ rail networks, for example).
3
Align (or re-align) resources to fit local strategies to emerging trends (sustainability, inclusion, digital).
A special note on the digital transformation of cities. It is clear that – whatever the level of surrounding uncertainties – the future of cities will be increasingly digital. The rapid spread of artificial intelligence across municipal services (traffic, surveillance, energy consumption, for instance) has raised both new hopes and new concerns. Trust and governance will be key ingredients in making cities both future-ready and human-centric. In other words, to make tomorrow’s cities green, digital, and humancentric we will need to give more attention to talent strategies, education, and openness (for instance, for trade, investment, and exchanges of experiences).
In that context, combining inclusion and digitalization will remain a challenge for all kinds of cities. It will be even more visible in those that claim to be (or become) smart cities: not leaving anyone behind (though design, infrastructure, education, and policies will remain a motto for those who want to be – or remain – at the top of SCI rankings. Giving special attention to vulnerable groups (aging people, people with disabilities, marginalized groups, but also small enterprises and startups) will require strategic approaches, and possibly a redefinition of ‘digital divides’.

IMD Smart City Index 2024
Introduction: a stable and mature dataset
Continuing to improve the SCI
As underlined earlier, and contrary to last year, this edition of the Smart City Index does not include any significant change in the index’s methodology or coverage. Reaching an age of maturity however should be no reason for complacency, and we continue to strive to uncover new data that may increase the value of SCI.
In parallel, we also try to improve the readability and usability of the index by developing new visual tools to help decision-makers and analysts make sense of the complex sets of data involved. This year, SCI users will find new displays and tools on the index’s website, thanks to new ways of presenting the data therefore enhancing its operational value.

We would also like to encourage our readers to use and disseminate the infographics that have been produced for this edition of the SCI report.
We hope that you enjoy reading and using this report and we look forward to your feedback.

8 IMD Smart City Index 2024
IMD Smart City Index 2024
9 IMD Smart City Index 2024
Table of Contents Introduction 03 Table of Contents 09 The IMD World Competitiveness Center 11 City Performance Overview 12 In 2024 City Ranking Order and 2023 Comparison 13 In Alphabetical Order by City and 2023 Comparison 17 In Alphabetical Order by Country with HDI Context and 2019-2024 Rankings 21 A User’s Guide 27 Methodology 30 City Profiles 32 Abu Dhabi 33 Abuja 34 Accra 35 Al-Khobar 36 Algiers 37 Amman 38 Amsterdam 39 Ankara 40 Athens 41 Auckland 42 Bangkok 43 Barcelona 44 Beijing 45 Beirut 46 Belfast 47 Bengaluru 48 Berlin 49 Bilbao 50 Birmingham 51 Bogota 52 Bologna 53 Bordeaux 54 Boston 55 Brasilia 56 Bratislava 57 Brisbane 58 Brussels 59 Bucharest 60 Budapest 61 Buenos Aires 62 Busan 63 Cairo 64 Canberra 65 Cape Town 66 Cardiff 67 Chengdu 68 Chicago 69 Chongqing 70 Copenhagen 71 Delhi 72 Denver 73 Doha 74 Dubai 75 Dublin 76 Dusseldorf 77 Geneva 78 Glasgow 79 Gothenburg 80 Guangzhou 81 Guatemala City 82 Hamburg 83 Hangzhou 84 Hanoi 85 Hanover 86 Helsinki 87 Ho Chi Minh City 88 Hong Kong 89 Hyderabad 90 Islamabad 91 Istanbul 92 Jakarta 93 Jeddah 94 Kiel 95 Krakow 96 Kuala Lumpur 97 Lagos 98 Lausanne 99 Leeds 100 Lille 101 Lima 102 Lisbon 103 Ljubljana 104 London 105 Los Angeles 106 Luxembourg 107 Lyon 108 Madrid 109 Makassar 110 Manchester 111
IMD Smart City Index 2024
10 IMD Smart City Index 2024
of Contents Manila 112 Marseille 113 Mecca 114 Medan 115 Medellin 116 Medina 117 Melbourne 118 Mexico City 119 Milan 120 Montreal 121 Mumbai 122 Munich 123 Muscat 124 Nairobi 125 Nanjing 126 New York 127 Newcastle 128 Nicosia 129 Osaka 130 Oslo 131 Ottawa 132 Paris 133 Philadelphia 134 Phoenix 135 Prague 136 Rabat 137 Reykjavik 138 Riga 139 Rio de Janeiro 140 Riyadh 141 Rome 142 Rotterdam 143 San Francisco 144 San José 145 Sana'a 146 Santiago 147 Sao Paulo 148 Seattle 149 Seoul 150 Shanghai 151 Shenzhen 152 Singapore 153 Sofia 154 Stockholm 155 Sydney 156 Taipei City 157 Tallinn 158 Tel Aviv 159 The Hague 160 Tianjin 161 Tokyo 162 Toronto 163 Tunis 164 Vancouver 165 Vienna 166 Vilnius 167 Warsaw 168 Washington D.C. 169 Wellington 170 Zagreb 171 Zaragoza 172 Zhuhai 173 Zurich 174
Table
IMD Smart City Index 2024
The IMD World Competitiveness Center
For over thirty years, the IMD World Competitiveness Center has pioneered research on how countries and companies compete to lay the foundations for sustainable value creation. The competitiveness of nations is probably one of the most significant developments in modern management and IMD is committed to leading the field.
The IMD World Competitiveness Center Team:
Professor Arturo Bris Director Christos Cabolis Chief Economist & Head of Operations
Bruno Lanvin President, Smart City Observatory
William Milner Associate Director
Odete Madureira WCC Coordinator
José Caballero Senior Economist
Maryam Zargari Research Associate
Chinar Sharma Projects Analyst
Fabian Grimm Research Specialist
Alice Tozer Content Manager
11 IMD Smart City Index 2024
IMD Smart City Index 2024
City Performance Overview: A Series of Tables Showcasing the Results
12 IMD Smart City Index 2024
IMD Smart City Index 2024: Results
In 2024 City Ranking Order and 2023 Comparison
13 IMD Smart City Index 2024
City Smart City Rank 2024 Smart City Rating 2024 Structure 2024 Technology 2024 Smart City Rank 2023 Change Zurich 1 AAA AAA AA 1 ▬ Oslo 2 AA AA A 2 ▬ Canberra 3 AA AAA A 3 ▬ Geneva 4 AAA AAA AA 9 +5▲ Singapore 5 A A A 7 +2▲ Copenhagen 6 AA AA A 4 -2▼ Lausanne 7 AA AA A 5 -2▼ London 8 A BBB AA 6 -2▼ Helsinki 9 AA AA A 8 -1▼ Abu Dhabi 10 BB BB BB 13 +3▲ Stockholm 11 A A A 10 -1▼ Dubai 12 BB BB BB 17 +5▲ Beijing 13 BB BB BB 12 -1▼ Hamburg 14 BBB BBB BBB 11 -3▼ Prague 15 A A A 14 -1▼ Taipei City 16 A BBB A 29 +13▲ Seoul 17 AA BBB AAA 16 -1▼ Amsterdam 18 A BBB A 15 -3▼ Shanghai 19 BB BB BB 25 +6▲ Hong Kong 20 A BBB AAA 19 -1▼ Munich 21 A A A 20 -1▼ Sydney 22 A BBB A 18 -4▼ Vienna 23 AA AA A 28 +5▲ Tallinn 24 BBB BBB BBB 32 +8▲ Riyadh 25 B B B 30 +5▲ Reykjavik 26 BBB A BBB 26 ▬ Luxembourg 27 BBB A BB 45 +18▲ Wellington 28 BBB A BBB 23 -5▼ Bilbao 29 BBB BBB BB 27 -2▼ Brisbane 30 A A A 24 -6▼ Auckland 31 BBB BBB A 22 -9▼ Ljubljana 32 BBB BBB A 47 +15▲ Melbourne 33 A BBB A 31 -2▼ New York 34 BB BB BB 21 -13▼ Madrid 35 BB BB BBB 37 +2▲ Boston 36 BBB BBB A 34 -2▼ Berlin 37 BBB BBB BBB 33 -4▼ Warsaw 38 BBB BBB BBB 44 +6▲ Gothenburg 39 A BBB A 36 -3▼ Brussels 40 BBB BB A 35 -5▼ Rotterdam 41 A BBB A 41 ▬ The Hague 42 A BBB A 43 +1▲ Vancouver 43 BBB BBB BBB 42 -1▼ Dusseldorf 44 BB BBB B 38 -6▼ City Smart City Rank 2024 Smart City Rating 2024 Structure 2024 Technology 2024 Smart City Rank 2023 Change
IMD Smart City Index 2024: Results
In 2024 City Ranking Order and 2023 Comparison
14 IMD Smart City Index 2024 Busan 45 BB BB BBB 49 +4▲ Ottawa 46 BBB A BBB 40 -6▼ Vilnius 47 BBB BBB BBB 65 +18▲ Doha 48 B BB B 59 +11▲ Paris 49 BBB BB A 46 -3▼ Washington D.C. 50 BB BB BB 39 -11▼ Toronto 51 BBB BBB A 48 -3▼ Mecca 52 B B B 52 ▬ Hanover 53 BB BBB B 57 +4▲ Tianjin 54 BB BB BB 67 +13▲ Jeddah 55 B B B 56 +1▲ Bratislava 56 BBB BB A 62 +6▲ Zaragoza 57 CCC B CC 54 -3▼ Zhuhai 58 CCC CCC CCC 60 +2▲ Riga 59 BB BB BB 83 +24▲ Shenzhen 60 CCC CCC CCC 66 +6▲ Lyon 61 BB BB BBB 64 +3▲ Nanjing 62 CCC CCC CCC 58 -4▼ Seattle 63 BB BB B 55 -8▼ Hangzhou 64 CCC CCC CCC 70 +6▲ Guangzhou 65 CCC CCC CCC 71 +6▲ Denver 66 BBB BBB BBB 53 -13▼ Chicago 67 BB BB BB 61 -6▼ Los Angeles 68 BB BB BB 50 -18▼ Dublin 69 BB BB BBB 63 -6▼ Bordeaux 70 CCC CCC CC 78 +8▲ Manchester 71 BB BB BB 73 +2▲ Leeds 72 CC CCC CC 76 +4▲ Kuala Lumpur 73 B B CCC 89 +16▲ Medina 74 CCC B CCC 85 +11▲ San Francisco 75 BB BB B 68 -7▼ Krakow 76 CCC CCC CC 79 +3▲ Newcastle 77 CC B CC 77 ▬ Bologna 78 BB BB B 51 -27▼ Kiel 79 BB BBB CCC 81 +2▲ Montreal 80 BB BB B 69 -11▼ Barcelona 81 BB BB BB 75 -6▼ Chongqing 82 CCC CCC CCC 86 +4▲ Birmingham 83 BB BB BB 74 -9▼ Bangkok 84 CCC CCC B 88 +4▲ Lille 85 CCC CCC CC 84 -1▼ Tokyo 86 BB BB BB 72 -14▼ Glasgow 87 B BB B 80 -7▼ Muscat 88 B B CCC 96 +8▲ City Smart City Rank 2024 Smart City Rating 2024 Structure 2024 Technology 2024 Smart City Rank 2023 Change City Smart City Rank 2024 Smart City Rating 2024 Structure 2024 Technology 2024 Smart City Rank 2023 Change
IMD Smart City Index 2024: Results
In 2024 City Ranking Order and 2023 Comparison
15 IMD Smart City Index 2024 Budapest 89 B B BB 87 -2▼ Philadelphia 90 B B B 92 +2▲ Milan 91 B B B 82 -9▼ Cardiff 92 CC CCC CC 94 +2▲ Chengdu 93 CCC CCC CCC 97 +4▲ Tel Aviv 94 B B B 91 -3▼ Osaka 95 B BB CCC 98 +3▲ Ankara 96 CCC CCC CCC 90 -6▼ Hanoi 97 CCC CCC CCC 100 +3▲ Phoenix 98 CC CCC C 93 -5▼ Al-Khobar 99 CCC CCC CC NEW Bucharest 100 B B B 104 +4▲ Belfast 101 CC CCC C 95 -6▼ Zagreb 102 B B B 106 +4▲ Jakarta 103 CC CC CCC 102 -1▼ Marseille 104 CC CC CC 101 -3▼ Ho Chi Minh City 105 CC CC CCC 103 -2▼ Delhi 106 CC CC CC 105 -1▼ Mumbai 107 CC CC CCC 109 +2▲ Lisbon 108 C CC CC 99 -9▼ Bengaluru 109 CCC CCC CCC 110 +1▲ Istanbul 110 CC C CC 107 -3▼ Hyderabad 111 CC CC CC 116 +5▲ Medan 112 CC CC CC 112 ▬ Sofia 113 C CC CC 111 -2▼ Cairo 114 C C CC 108 -6▼ Makassar 115 CC CC CC 114 -1▼ Islamabad 116 CC CC CC 120 +4▲ Santiago 117 C C C 119 +2▲ Nicosia 118 C CC C 117 -1▼ Medellin 119 C C C 118 -1▼ Athens 120 C C C 113 -7▼ Manila 121 C C C 115 -6▼ Mexico City 122 C D C 121 -1▼ Buenos Aires 123 C C C 124 +1▲ Algiers 124 C C C 123 -1▼ San José 125 C CC C 127 +2▲ Rabat 126 C C C 126 ▬ Bogota 127 D D D 129 +2▲ Amman 128 D D C 135 +7▲ Cape Town 129 D D D 125 -4▼ Brasilia 130 C C C 128 -2▼ City Smart City Rank 2024 Smart City Rating 2024 Structure 2024 Technology 2024 Smart City Rank 2023 Change City Smart City Rank 2024 Smart City Rating 2024 Structure 2024 Technology 2024 Smart City Rank 2023 Change
IMD Smart City Index 2024: Results
In 2024 City Ranking Order and 2023 Comparison
16 IMD Smart City Index 2024 Nairobi 131 C C C 131 ▬ Sao Paulo 132 D D C 130 -2▼ Rome 133 CCC CCC CCC 122 -11▼ Lima 134 C C C 134 ▬ Abuja 135 D C D 133 -2▼ Lagos 136 D D D 132 -4▼ Tunis 137 D D D 137 ▬ Accra 138 D D D 138 ▬ Rio de Janeiro 139 D D D 136 -3▼ Beirut 140 D D D 139 -1▼ Sana'a 141 D D D 140 -1▼ Guatemala City 142 D D D 141 -1▼ City Smart City Rank 2024 Smart City Rating 2024 Structure 2024 Technology 2024 Smart City Rank 2023 Change
IMD Smart City Index 2024: Results
In Alphabetical Order by City and 2023 Comparison
17 IMD Smart City Index 2024
City Smart City Rank 2024 Smart City Rating 2024 Structure 2024 Technology 2024 Smart City Rank 2023 Change Abu Dhabi 10 BB BB BB 13 +3▲ Abuja 135 D C D 133 -2▼ Accra 138 D D D 138 ▬ Algiers 124 C C C 123 -1▼ Al-Khobar 99 CCC CCC CC NEW NEW Amman 128 D D C 135 +7▲ Amsterdam 18 A BBB A 15 -3▼ Ankara 96 CCC CCC CCC 90 -6▼ Athens 120 C C C 113 -7▼ Auckland 31 BBB BBB A 22 -9▼ Bangkok 84 CCC CCC B 88 +4▲ Barcelona 81 BB BB BB 75 -6▼ Beijing 13 BB BB BB 12 -1▼ Beirut 140 D D D 139 -1▼ Belfast 101 CC CCC C 95 -6▼ Bengaluru 109 CCC CCC CCC 110 +1▲ Berlin 37 BBB BBB BBB 33 -4▼ Bilbao 29 BBB BBB BB 27 -2▼ Birmingham 83 BB BB BB 74 -9▼ Bogota 127 D D D 129 +2▲ Bologna 78 BB BB B 51 -27▼ Bordeaux 70 CCC CCC CC 78 +8▲ Boston 36 BBB BBB A 34 -2▼ Brasilia 130 C C C 128 -2▼ Bratislava 56 BBB BB A 62 +6▲ Brisbane 30 A A A 24 -6▼ Brussels 40 BBB BB A 35 -5▼ Bucharest 100 B B B 104 +4▲ Budapest 89 B B BB 87 -2▼ Buenos Aires 123 C C C 124 +1▲ Busan 45 BB BB BBB 49 +4▲ Cairo 114 C C CC 108 -6▼ Canberra 3 AA AAA A 3 ▬ Cape Town 129 D D D 125 -4▼ Cardiff 92 CC CCC CC 94 +2▲ Chengdu 93 CCC CCC CCC 97 +4▲ Chicago 67 BB BB BB 61 -6▼ Chongqing 82 CCC CCC CCC 86 +4▲ Copenhagen 6 AA AA A 4 -2▼ Delhi 106 CC CC CC 105 -1▼ Denver 66 BBB BBB BBB 53 -13▼ Doha 48 B BB B 59 +11▲ Dubai 12 BB BB BB 17 +5▲ Dublin 69 BB BB BBB 63 -6▼ City Smart City Rank 2024 Smart City Rating 2024 Structure 2024 Technology 2024 Smart City Rank 2023 Change
IMD Smart City Index 2024: Results
In Alphabetical Order by City and 2023 Comparison
18 IMD Smart City Index 2024 Dusseldorf 44 BB BBB B 38 -6▼ Geneva 4 AAA AAA AA 9 +5▲ Glasgow 87 B BB B 80 -7▼ Gothenburg 39 A BBB A 36 -3▼ Guangzhou 65 CCC CCC CCC 71 +6▲ Guatemala City 142 D D D 141 -1▼ Hamburg 14 BBB BBB BBB 11 -3▼ Hangzhou 64 CCC CCC CCC 70 +6▲ Hanoi 97 CCC CCC CCC 100 +3▲ Hanover 53 BB BBB B 57 +4▲ Helsinki 9 AA AA A 8 -1▼ Ho Chi Minh City 105 CC CC CCC 103 -2▼ Hong Kong 20 A BBB AAA 19 -1▼ Hyderabad 111 CC CC CC 116 +5▲ Islamabad 116 CC CC CC 120 +4▲ Istanbul 110 CC C CC 107 -3▼ Jakarta 103 CC CC CCC 102 -1▼ Jeddah 55 B B B 56 +1▲ Kiel 79 BB BBB CCC 81 +2▲ Krakow 76 CCC CCC CC 79 +3▲ Kuala Lumpur 73 B B CCC 89 +16▲ Lagos 136 D D D 132 -4▼ Lausanne 7 AA AA A 5 -2▼ Leeds 72 CC CCC CC 76 +4▲ Lille 85 CCC CCC CC 84 -1▼ Lima 134 C C C 134 ▬ Lisbon 108 C CC CC 99 -9▼ Ljubljana 32 BBB BBB A 47 +15▲ London 8 A BBB AA 6 -2▼ Los Angeles 68 BB BB BB 50 -18▼ Luxembourg 27 BBB A BB 45 +18▲ Lyon 61 BB BB BBB 64 +3▲ Madrid 35 BB BB BBB 37 +2▲ Makassar 115 CC CC CC 114 -1▼ Manchester 71 BB BB BB 73 +2▲ Manila 121 C C C 115 -6▼ Marseille 104 CC CC CC 101 -3▼ Mecca 52 B B B 52 ▬ Medan 112 CC CC CC 112 ▬ Medellin 119 C C C 118 -1▼ Medina 74 CCC B CCC 85 +11▲ Melbourne 33 A BBB A 31 -2▼ Mexico City 122 C D C 121 -1▼ Milan 91 B B B 82 -9▼ City Smart City Rank 2024 Smart City Rating 2024 Structure 2024 Technology 2024 Smart City Rank 2023 Change City Smart City Rank 2024 Smart City Rating 2024 Structure 2024 Technology 2024 Smart City Rank 2023 Change
IMD Smart City Index 2024: Results
In Alphabetical Order by City and 2023 Comparison
19 IMD Smart City Index 2024 Montreal 80 BB BB B 69 -11▼ Mumbai 107 CC CC CCC 109 +2▲ Munich 21 A A A 20 -1▼ Muscat 88 B B CCC 96 +8▲ Nairobi 131 C C C 131 ▬ Nanjing 62 CCC CCC CCC 58 -4▼ New York 34 BB BB BB 21 -13▼ Newcastle 77 CC B CC 77 ▬ Nicosia 118 C CC C 117 -1▼ Osaka 95 B BB CCC 98 +3▲ Oslo 2 AA AA A 2 ▬ Ottawa 46 BBB A BBB 40 -6▼ Paris 49 BBB BB A 46 -3▼ Philadelphia 90 B B B 92 +2▲ Phoenix 98 CC CCC C 93 -5▼ Prague 15 A A A 14 -1▼ Rabat 126 C C C 126 ▬ Reykjavik 26 BBB A BBB 26 ▬ Riga 59 BB BB BB 83 +24▲ Rio de Janeiro 139 D D D 136 -3▼ Riyadh 25 B B B 30 +5▲ Rome 133 CCC CCC CCC 122 -11▼ Rotterdam 41 A BBB A 41 ▬ San Francisco 75 BB BB B 68 -7▼ San José 125 C CC C 127 +2▲ Sana’a 141 D D D 140 -1▼ Santiago 117 C C C 119 +2▲ Sao Paulo 132 D D C 130 -2▼ Seattle 63 BB BB B 55 -8▼ Seoul 17 AA BBB AAA 16 -1▼ Shanghai 19 BB BB BB 25 +6▲ Shenzhen 60 CCC CCC CCC 66 +6▲ Singapore 5 A A A 7 +2▲ Sofia 113 C CC CC 111 -2▼ Stockholm 11 A A A 10 -1▼ Sydney 22 A BBB A 18 -4▼ Taipei City 16 A BBB A 29 +13▲ Tallinn 24 BBB BBB BBB 32 +8▲ Tel Aviv 94 B B B 91 -3▼ The Hague 42 A BBB A 43 +1▲ Tianjin 54 BB BB BB 67 +13▲ Tokyo 86 BB BB BB 72 -14▼ Toronto 51 BBB BBB A 48 -3▼ Tunis 137 D D D 137 ▬ City Smart City Rank 2024 Smart City Rating 2024 Structure 2024 Technology 2024 Smart City Rank 2023 Change City Smart City Rank 2024 Smart City Rating 2024 Structure 2024 Technology 2024 Smart City Rank 2023 Change
IMD Smart City Index 2024: Results
In Alphabetical Order by City and 2023 Comparison
20 IMD Smart City Index 2024 Vancouver 43 BBB BBB BBB 42 -1▼ Vienna 23 AA AA A 28 +5▲ Vilnius 47 BBB BBB BBB 65 +18▲ Warsaw 38 BBB BBB BBB 44 +6▲ Washington D.C. 50 BB BB BB 39 -11▼ Wellington 28 BBB A BBB 23 -5▼ Zagreb 102 B B B 106 +4▲ Zaragoza 57 CCC B CC 54 -3▼ Zhuhai 58 CCC CCC CCC 60 +2▲ Zurich 1 AAA AAA AA 1 ▬ City Smart City Rank 2024 Smart City Rating 2024 Structure 2024 Technology 2024 Smart City Rank 2023 Change
IMD Smart City Index 2024: Results
In Alphabetical Order by Country with HDI Context and 2019-2024 Rankings (2023 Methodology Applied)
21 IMD Smart City Index 2024 Country Country HDI City HDI city 2024 Smart City Ranking AVERAGE 19-20-21 AVERAGE 20-21-23 AVERAGE 21-23-24 Algeria 0.745 Algiers 0.767 124 - 123 124 Argentina 0.849 Buenos Aires 0.844 123 95 107 117 Australia 0.946 Brisbane 0.944 30 36 30 31 Australia 0.946 Canberra 0.980 3 - 3 3 Australia 0.946 Melbourne 0.948 33 35 33 33 Australia 0.946 Sydney 0.952 22 28 26 23 Austria 0.926 Vienna 0.942 23 17 22 24 Belgium 0.942 Brussels 0.953 40 37 32 40 Brazil 0.76 Brasilia 0.816 130 - 128 129 Brazil 0.76 Rio de Janeiro 0.783 139 110 121 131 Brazil 0.76 Sao Paulo 0.780 132 107 118 126 Bulgaria 0.799 Sofia 0.856 113 92 100 109 Canada 0.935 Montreal 0.923 80 52 59 68 Canada 0.935 Ottawa 0.943 46 - 40 43 Canada 0.935 Toronto 0.943 51 35 42 43 Canada 0.935 Vancouver 0.944 43 29 37 38 Chile 0.86 Santiago 0.886 117 96 109 114 China 0.788 Beijing 0.907 13 23 17 14 China 0.788 Chengdu 0.740 93 78 86 91 China 0.788 Chongqing 0.774 82 69 75 81 China 0.788 Guangzhou 0.799 65 66 67 67 China 0.788 Hangzhou 0.801 64 63 64 66 China 0.788 Nanjing 0.810 62 60 58 59 China 0.788 Shanghai 0.880 19 37 33 25
IMD Smart City Index 2024: Results
In Alphabetical Order by Country with HDI Context and 2019-2024 Rankings
22 IMD Smart City Index 2024 Country Country HDI City HDI city 2024 Smart City Ranking AVERAGE 19-20-21 AVERAGE 20-21-23 AVERAGE 21-23-24 China 0.788 Shenzhen 0.799 60 62 64 62 China 0.788 Tianjin 0.844 54 48 54 57 China 0.788 Zhuhai 0.799 58 54 56 57 Colombia 0.758 Bogota 0.797 127 103 115 123 Colombia 0.758 Medellin 0.757 119 90 102 112 Costa Rica 0.806 San José 0.826 125 112 120 121 Croatia 0.878 Zagreb 0.916 102 - 106 104 Cyprus 0.907 Nicosia 0.896 118 - 117 118 Czech Rep. 0.895 Prague 0.960 15 7 9 13 Denmark 0.952 Copenhagen 0.967 6 4 4 5 Egypt 0.728 Cairo 0.779 114 100 104 109 Estonia 0.899 Tallinn 0.932 24 32 32 27 Finland 0.942 Helsinki 0.960 9 7 7 9 France 0.91 Bordeaux 0.900 70 68 73 72 France 0.91 Lille 0.880 85 82 83 84 France 0.91 Lyon 0.914 61 59 62 62 France 0.91 Marseille 0.899 104 87 92 99 France 0.91 Paris 0.949 49 45 47 48 Germany 0.95 Berlin 0.959 37 20 25 30 Germany 0.95 Dusseldorf 0.939 44 27 34 36 Germany 0.95 Hamburg 0.972 14 7 8 11 Germany 0.95 Hanover 0.930 53 49 54 54 Germany 0.95 Kiel 0.921 79 72 77 77 Germany 0.95 Munich 0.950 21 16 17 19
IMD Smart City Index 2024: Results
In Alphabetical Order by Country with HDI Context and 2019-2024 Rankings
23 IMD Smart City Index 2024 Country Country HDI City HDI city 2024 Smart City Ranking AVERAGE 19-20-21 AVERAGE 20-21-23 AVERAGE 21-23-24 Ghana 0.602 Accra 0.707 138 - 138 138 Greece 0.893 Athens 0.909 120 100 106 114 Guatemala 0.629 Guatemala City 0.722 142 - 141 142 Hong Kong 0.956 Hong Kong 0.950 20 35 29 24 Hungary 0.851 Budapest 0.922 89 68 76 85 Iceland 0.959 Reykjavik 0.959 26 - 26 26 India 0.644 Bengaluru 0.667 109 93 101 105 India 0.644 Delhi 0.730 106 86 95 102 India 0.644 Hyderabad 0.647 111 91 103 109 India 0.644 Mumbai 0.688 107 89 98 104 Indonesia 0.713 Jakarta 0.759 103 84 92 99 Indonesia 0.713 Makassar 0.699 115 93 102 110 Indonesia 0.713 Medan 0.711 112 93 101 107 Ireland 0.95 Dublin 0.950 69 31 45 59 Israel 0.915 Tel Aviv 0.919 94 54 68 81 Italy 0.906 Bologna 0.924 78 46 50 59 Italy 0.906 Milan 0.915 91 64 74 81 Italy 0.906 Rome 0.917 133 102 110 122 Japan 0.92 Osaka 0.928 95 81 91 94 Japan 0.92 Tokyo 0.951 86 62 71 75 Jordan 0.736 Amman 0.737 128 - 135 132 Kenya 0.601 Nairobi 0.636 131 107 118 126 Korea, South 0.929 Busan 0.936 45 40 42 47 Korea, South 0.929 Seoul 0.952 17 20 18 17
IMD Smart City Index 2024: Results
In Alphabetical Order by Country with HDI Context and 2019-2024 Rankings
24 IMD Smart City Index 2024 Country Country HDI City HDI city 2024 Smart City Ranking AVERAGE 19-20-21 AVERAGE 20-21-23 AVERAGE 21-23-24 Latvia 0.879 Riga 0.929 59 - 83 71 Lebanon 0.723 Beirut 0.677 140 - 139 140 Lithuania 0.879 Vilnius 0.913 47 - 65 56 Luxembourg 0.927 Luxembourg 0.930 27 - 45 36 Malaysia 0.807 Kuala Lumpur 0.858 73 70 80 81 Mexico 0.781 Mexico City 0.815 122 101 111 118 Morocco 0.698 Rabat 0.702 126 103 112 120 Netherlands 0.946 Amsterdam 0.962 18 12 13 15 Netherlands 0.946 Rotterdam 0.941 41 39 40 42 Netherlands 0.946 The Hague 0.941 42 36 39 40 New Zealand 0.939 Auckland 0.951 31 12 18 23 New Zealand 0.939 Wellington 0.958 28 - 23 26 Nigeria 0.548 Abuja 0.646 135 106 118 127 Nigeria 0.548 Lagos 0.681 136 107 118 128 Norway 0.966 Oslo 0.980 2 2 2 2 Oman 0.819 Muscat 0.816 88 - 96 92 Pakistan 0.54 Islamabad 0.659 116 - 120 118 Peru 0.762 Lima 0.820 134 - 134 134 Philippines 0.71 Manila 0.760 121 96 103 112 Poland 0.881 Krakow 0.888 76 64 75 77 Poland 0.881 Warsaw 0.926 38 34 44 41 Portugal 0.874 Lisbon 0.900 108 73 85 96 Qatar 0.875 Doha 0.855 48 - 59 54 Romania 0.827 Bucharest 0.926 100 74 89 97
IMD Smart City Index 2024: Results
In Alphabetical Order by Country with HDI Context and 2019-2024 Rankings
25 IMD Smart City Index 2024 Country Country HDI City HDI city 2024 Smart City Ranking AVERAGE 19-20-21 AVERAGE 20-21-23 AVERAGE 21-23-24 Saudi Arabia 0.875 Al-Khobar 0.862 99 - -Saudi Arabia 0.875 Jeddah 0.871 55 - 56 56 Saudi Arabia 0.875 Mecca 0.871 52 - 52 52 Saudi Arabia 0.875 Medina 0.871 74 79 82 79 Saudi Arabia 0.875 Riyadh 0.900 25 46 38 31 Singapore 0.949 Singapore 0.939 5 8 7 6 Slovakia 0.855 Bratislava 0.944 56 33 43 53 Slovenia 0.926 Ljubljana 0.953 32 - 47 40 South Africa 0.717 Cape Town 0.751 129 99 110 120 Spain 0.911 Barcelona 0.916 81 61 68 75 Spain 0.911 Bilbao 0.932 29 22 25 26 Spain 0.911 Madrid 0.940 35 31 35 36 Spain 0.911 Zaragoza 0.912 57 54 53 54 Sweden 0.952 Gothenburg 0.944 39 41 42 40 Sweden 0.952 Stockholm 0.972 11 10 10 11 Switzerland 0.967 Geneva 0.966 4 7 8 6 Switzerland 0.967 Lausanne 0.966 7 4 5 5 Switzerland 0.967 Zurich 0.989 1 1 1 1 Taiwan 0.926 Taipei City 0.930 16 24 26 23 Thailand 0.803 Bangkok 0.839 84 80 84 86 Tunisia 0.732 Tunis 0.775 137 - 137 137 Turkey 0.855 Ankara 0.854 96 74 80 87 Turkey 0.855 Istanbul 0.867 110 88 98 102 United Arab Emirates 0.937 Abu Dhabi 0.911 10 14 13 12
IMD Smart City Index 2024: Results
In Alphabetical Order by Country with HDI Context and 2019-2024 Rankings
26 IMD Smart City Index 2024 Country Country HDI City HDI city 2024 Smart City Ranking AVERAGE 19-20-21 AVERAGE 20-21-23 AVERAGE 21-23-24 United Arab Emirates 0.937 Dubai 0.911 12 15 17 14 United Kingdom 0.94 Belfast 0.896 101 - 95 98 United Kingdom 0.94 Birmingham 0.913 83 68 72 77 United Kingdom 0.94 Glasgow 0.921 87 65 73 77 United Kingdom 0.94 Leeds 0.908 72 64 70 71 United Kingdom 0.94 London 0.973 8 5 6 6 United Kingdom 0.94 Manchester 0.915 71 58 63 67 United Kingdom 0.94 Newcastle 0.901 77 62 67 72 United Kingdom 0.94 Cardiff 0.898 92 - 94 93 USA 0.927 Boston 0.949 36 20 27 31 USA 0.927 Chicago 0.929 67 56 57 61 USA 0.927 Denver 0.942 66 31 39 51 USA 0.927 Los Angeles 0.931 68 37 39 49 USA 0.927 New York 0.938 34 22 17 25 USA 0.927 Philadelphia 0.923 90 78 85 89 USA 0.927 Phoenix 0.908 98 75 81 89 USA 0.927 San Francisco 0.931 75 44 57 66 USA 0.927 Seattle 0.940 63 37 45 52 USA 0.927 Washington D.C. 0.940 50 22 26 38 Vietnam 0.726 Hanoi 0.744 97 83 90 95 Vietnam 0.726 Ho Chi Minh City 0.714 105 85 94 100 Yemen 0.424 Sana'a 0.521 141 - 140 141
IMD Smart City Index 2024
27 IMD Smart City Index 2024
A User’s Guide
IMD Smart City Index 2024
A User’s Guide
Abu Dhabi
Smart City Ranking
Abu Dhabi
Smart City Ranking: The Ranking position of the city amongst the 142 cities measured, based upon the Rating and its components.
Group: Each city is assigned to one of four groups, based upon its HDI values.
Smart City Rating and Factor Ratings: The Ratings for each city are calculated from the city’s performance relative to the other cities within the group.
10

The Methodology section provides the exact procedure for these calculations.
The 2023 Ranking and Rating are also shown for the 141 cities included in the last edition’s index.
From a list of 15 indicators, survey respondents were asked to select 5 that they perceived as the most urgent for their city. The higher the percentage of responses per area, the greater the priority for the city.
Abu Dhabi
Health & Safety
Basic sanitation meets the needs of the poorest areas
Priority Areas
Recycling services are satisfactory
Public safety is not a problem
Air pollution is not a problem
Medical services provision is satisfactory
Finding housing with rent equal to 30% or less of a monthly salary is not a problem
Background Information
From a list of 15 indicators, survey respondents were asked to select 5 that they perceived as the most urgent for their city. The higher the percentage of responses per area, the greater the priority for the city.
This section presents the Human Development Index (HDI) at the city level taken from the Global Data Lab, and the population of the city as defined through the United Nations World Urbanization Prospects for the majority of cities, or Eurostat for some of European cities.
It also presents the United Nations HDI (country-level - for the parent economy of a given city) and its four components, as well as the city’s position on the map. Please note: for Taipei City only, the data is calculated using the same methodology and comparable data.
Health & Safety
Online reporting of city maintenance problems provides a speedy solution
A website or App allows residents to easily give away unwanted items
Free public wifi has improved access to city services
CCTV cameras has made residents feel safer
A website or App allows residents to effectively monitor air pollution
Arranging medical appointments online has improved access
Summarizes the areas that the respondents perceive as the priority area for their city. From a list of 15 indicators, survey respondents were asked to select 5 that they perceived as the most urgent for their city. The total bar indicates the percentage of the respondents that included a given area as one of their five choices. The higher the percentage of responses per area, the greater the priority for the city.
Mobility Mobility
Traffic congestion is not a problem
Public transport is satisfactory
Car-sharing Apps have reduced congestion
Apps that direct you to an available parking space have reduced journey time
Bicycle hiring has reduced congestion
Online scheduling and ticket sales has made public transport easier to use
The city provides information on traffic congestion through mobile phones
Activities
Green spaces are satisfactory
Cultural activities (shows, bars, and museums) are satisfactory
Opportunities (Work & School)
Employment finding services are readily available
Most children have access to a good school
Lifelong learning opportunities are provided by local institutions
Businesses are creating new jobs
From a list of 15 indicators, survey respondents were asked to select 5 that they perceived as the most urgent for their city. The higher the percentage of responses per area, the greater the priority for the city.
Activities
Online purchasing of tickets to shows and museums has made it easier to attend
Opportunities (Work & School)
Online access to job listings has made it easier to find work
IT skills are taught well in schools
Online services provided by the city has made it easier to start a new business
The
28 IMD Smart City Index 2024
BACKGROUND INFORMATION City Population HDI ATTITUDES Map tiles by Stamen Design CC BY 3.0 Map Data © OpenStreetMap Country United Arab Emirates HDI Life expectancy at birth Expected years of schooling Mean years of schooling GNI per capita (PPP $)
& Safety
& Safety Basic sanitation meets the needs of the poorest areas Online reporting of city maintenance problems provides a speedy solution Recycling services are satisfactory A website or App allows residents to easily give away unwanted items Public safety is not a problem Free public wifi has improved access to city services Air pollution is not a problem CCTV cameras has made residents feel safer Medical services provision is satisfactory A website or App allows residents to effectively monitor air pollution Finding housing with rent equal to 30% or less of a monthly salary is not a problem Arranging medical appointments online has improved access Mobility Mobility Traffic congestion is not a problem Car-sharing Apps have reduced congestion Public transport is satisfactory Apps that direct you to an available parking space have reduced journey time Bicycle hiring has reduced congestion Online scheduling and ticket sales has made public transport easier to use The city provides information on traffic congestion through mobile phones Activities Activities Green spaces are satisfactory Online purchasing of tickets to shows and museums has made it easier to attend Cultural activities (shows, bars, and museums) are satisfactory Opportunities (Work & School) Opportunities (Work & School) Employment finding services are readily available Online access to job listings has made it easier to find work Most children have access to a good school IT skills are taught well in schools Lifelong learning opportunities are provided by local institutions Online services provided by the city has made it easier to start a new business Businesses are creating new jobs The current internet speed and reliability meet connectivity needs Minorities feel welcome Governance Governance Information on local government decisions are easily accessible Online public access to city finances has reduced corruption Corruption of city officials is not an issue of concern Online voting has increased participation Residents contribute to decision making of local government An online platform where residents can propose ideas has improved city life Residents provide feedback on local government projects Processing Identification Documents online has reduced waiting times (UN World Urbanization Prospects) 1,480,000 0.911 (Global Data Lab)
PRIORITY AREAS
Health
Health
88.7 80.1 80.1 86.4 STRUCTURES TECHNOLOGIES 80.9 75.8 66.3 51.2 87.4 86.8 60.5 86.7 52.9 68.7 71.5 All ratings range from AAA to D 10 3 86.9 GROUP BB TECHNOLOGIES BB FACTOR RATINGS BB STRUCTURES 83.8 61.8 2020 78.7 +0.006 +0.5 +0.0 +0.0 65.9 65.4 85.3 49.6 84.7
74.0 1 yr change 12.7 67,353 12.8 74,104 2021 2022 0.937 79.2 17.2 17.2 2019 ▲ 13 in 2023 Out of 142 Out of 141 77.5 72.4 84.4 68.5 78.0 12.7 0.930 78.9 17.2 12.8 0.931 81.9 87.6 69,550 SMART CITY RANKING BB in 2023 84.1 71.9 63.7 70.8 74.9 77.7 73.9 76.6 SMART CITY RATING +4,553 72,131 0.933 79.7 16.8 72.3% 50.8% 47.4% 33.8% 30.2% 27.4% 0% 20% 40% 60% 80% 100% affordable housing unemployment fulfilling employment road congestion health services air pollution 70.0% 92.8% 92.7% 67.6% 60% 80% 100% 0 20 40 60 80 100 0 20 40 60 80 100 who agree or strongly agree with the statement Score % of respondents who chose the Priority Area Score GROUP MEAN CITY LEGEND: MIN GROUP MAX CITY MEAN LEGEND: You are willing to concede personal data in order to improve traffic congestion You are comfortable with face recognition technologies to lower crime You feel the availability of online information has increased your trust in authorities The proportion of your day-to-day payment transactions that are non-cash (% of transactions) PRIORITY AREAS BACKGROUND INFORMATION City Population HDI ATTITUDES Map tiles by Stamen Design CC BY 3.0 Map Data © OpenStreetMap
United
HDI
years
Mean
GNI
Country
Arab Emirates
Life expectancy at birth Expected
of schooling
years of schooling
per capita (PPP $)
Governance
Online
propose ideas has improved city life Residents provide feedback on local government projects Processing Identification Documents online has reduced waiting times (UN World Urbanization Prospects) 1,480,000 0.911 (Global Data Lab)
current internet speed and reliability meet connectivity needs Minorities feel welcome Governance
Information on local government decisions are easily accessible
public access to city finances has reduced corruption Corruption of city officials is not an issue of concern Online voting has increased participation Residents contribute to decision making of local government An online platform where residents can
STRUCTURES TECHNOLOGIES 51.2 86.8 52.9
All ratings range from AAA to D
86.9 GROUP BB TECHNOLOGIES BB FACTOR RATINGS BB STRUCTURES 83.8 61.8 2020 78.7 +0.006 +0.5 +0.0 +0.0 65.9 65.4 85.3 49.6 84.7
1 yr change 12.7 67,353 12.8 74,104 2021 2022 0.937 79.2 17.2 17.2 2019 ▲ 13 in 2023 Out of 142 Out of 141 72.4 68.5 12.7 0.930 78.9 17.2 12.8 0.931 81.9 87.6 69,550 SMART CITY RANKING BB in 2023 84.1 63.7 74.9 73.9 SMART CITY RATING +4,553 72,131 0.933 79.7 16.8 50.8% 47.4% 33.8% 30.2% 27.4% 25.9% 25.8% 25.6% 23.4% 22.7% 18.4% 17.1% 16.5% 10.0% 0% 20% 40% 60% affordable housing unemployment fulfilling employment road congestion health services air pollution school education Green spaces public transport basic amenities (water, waste) recycling security citizen engagement social mobility / inclusiveness corruption transparency 0% 20% 40% 0 20 40 0 20 40 60 80 100 % of respondents who agree or strongly Score % of respondents
chose the Score GROUP MEAN CITY LEGEND: MIN GROUP MAX CITY MEAN LEGEND: You are willing to concede personal data in order to improve traffic congestion You are comfortable with face recognition technologies to lower crime You feel the availability of online information has increased your trust in authorities
proportion of your day-to-day payment transactions that are non-cash (% of transactions)
who
The
City Population HDI ATTITUDES Map tiles by Stamen Design CC BY 3.0 Map Data © OpenStreetMap Country United Arab Emirates HDI Life expectancy at birth Expected years of schooling Mean years of schooling (UN World Urbanization Prospects) 1,480,000 0.911 (Global Data Lab)
PRIORITY AREAS BACKGROUND INFORMATION
10 2020 78.7 +0.006 +0.5 +0.0 +0.0
1 yr change 12.7 12.8 2021 2022 0.937 79.2 17.2 17.2 2019 ▲ 2023 of 142 of 141 12.7 0.930 78.9 17.2 12.8 0.931 SMART CITY RANKING SMART RATING 0.933 79.7 16.8 72.3% 50.8% 47.4% 33.8% 30.2% 27.4% 25.9% 25.8% 25.6% 23.4% 22.7% 18.4% 17.1% 16.5% 10.0% 0% 20% 40% 60% 80% 100% affordable housing unemployment fulfilling employment road congestion health services air pollution school education Green spaces public transport basic amenities (water, waste) recycling security citizen engagement social mobility inclusiveness corruption / transparency 70.0% 92.8% 92.7% 67.6% 0% 20% 40% 60% 80% 100% % of respondents who agree or strongly agree with the statement % of respondents who chose the Priority Area You are willing to concede personal data in order to improve traffic congestion You are comfortable with face recognition technologies to lower crime You feel the availability of online information has increased your trust in authorities The proportion of your day-to-day payment transactions that are non-cash (% of transactions)
Abu Dhabi
IMD Smart City Index 2024
Abu Dhabi
Attitudes
Country
United Arab Emirates
Life expectancy at birth
From a list of 15 indicators, survey respondents were asked to select 5 that they perceived as the most urgent for their city. The higher the percentage of responses per area, the greater the priority for the city.
Shows and compares the responses to three key privacy aspects (willingness to concede personal data, comfort vis-à-vis face recognition, and whether online information has increased trust in authorities) and the percentage of day-to-day transactions that are non-cash. The city is represented by the blue bar, while the group average is shown by the light red bar.
Expected years of schooling Mean years of schooling
From a list of 15 indicators, survey respondents were asked to select 5 that they perceived as the most urgent for their city. The higher the percentage of responses per area, the greater the priority for the city.
per capita (PPP $) Health & Safety Health & Safety Basic sanitation meets the needs of the poorest areas
Online reporting of city maintenance problems provides a speedy solution
Structures and Technologies
Key survey data collected on Structures (left side) and Technologies (right side), under five key areas: health and safety, mobility, activities, opportunities, and governance.
Each indicator presents the Score for the city and a comparison with its Group (1-4). Showing the Group’s Minimum, Mean, and Maximum Scores (light red bar) alongside with the city (blue circle) allows a clear comparison of the city’s performance in this indicator. The Methodology section provides the exact calculation of the Score.
This table can be read in two ways: down to examine all Structures or Technologies indicators, or across to examine a key area in both Structures and Technologies.
Recycling services are satisfactory
Public safety is not a problem
Air pollution is not a problem
Medical services provision is satisfactory
Finding housing with rent equal to 30% or less of a monthly salary is not a problem
A website or App allows residents to easily give away unwanted items
Free public wifi has improved access to city services
CCTV cameras has made residents feel safer
A website or App allows residents to effectively monitor air pollution
Arranging medical appointments online has improved access
Mobility Mobility
Traffic congestion is not a problem
Public transport is satisfactory
Public safety is not a problem
Air pollution is not a problem
Medical services provision is satisfactory
Finding housing with rent equal to 30% or less of a monthly salary is not a problem
Activities
Green spaces are satisfactory
Mobility
Cultural activities (shows, bars, and museums) are satisfactory
Traffic congestion is not a problem
Public transport is satisfactory
Opportunities (Work & School)
Employment finding services are readily available
Most children have access to a good school
Lifelong learning opportunities are provided by local institutions
Businesses are creating new jobs
Activities
Green spaces are satisfactory
Cultural activities (shows, bars, and museums) are satisfactory
Opportunities (Work & School)
Employment finding services are readily available
Car-sharing Apps have reduced congestion
Apps that direct you to an available parking space have reduced journey time
Bicycle hiring has reduced congestion
Free public wifi has improved access to city services
Online scheduling and ticket sales has made public transport easier to use
CCTV cameras has made residents feel safer
The city provides information on traffic congestion through mobile phones
A website or App allows residents to effectively monitor air pollution
Arranging medical appointments online has improved access
Activities
Online purchasing of tickets to shows and museums has made it easier to attend
Mobility
Car-sharing Apps have reduced congestion
Apps that direct you to an available parking space have reduced journey time
Opportunities (Work & School)
Bicycle hiring has reduced congestion
Online access to job listings has made it easier to find work
Online scheduling and ticket sales has made public transport easier to use
IT skills are taught well in schools
The city provides information on traffic congestion through mobile phones
Online services provided by the city has made it easier to start a new business
The current internet
Activities
Online purchasing of tickets to shows and museums has made it easier to attend
Opportunities (Work & School)
Online access to job listings has made it easier to find work
Most children have access to a good school IT skills are taught well in schools
Lifelong learning opportunities are provided by local institutions
Online services provided by the city has made it easier to start a new business Businesses are creating new jobs The current internet speed and reliability meet connectivity needs Minorities
29 IMD Smart City Index 2024
PRIORITY AREAS BACKGROUND INFORMATION City Population HDI ATTITUDES Map tiles by Stamen Design CC BY 3.0 Map Data © OpenStreetMap Country United
HDI Life
GNI per
Health &
sanitation meets the needs of the poorest areas Online reporting of city maintenance problems provides a speedy solution Recycling services are satisfactory A website or App allows residents to easily give away unwanted items
A User’s Guide
Arab Emirates
expectancy at birth Expected years of schooling Mean years of schooling
capita (PPP $) Health & Safety
Safety Basic
feel welcome Governance Governance Information on local government decisions are easily accessible Online public access to city finances has reduced corruption Corruption of city officials is not an issue of concern Online voting has increased participation Residents contribute to decision making of local government An online platform where residents can propose ideas has improved city life Residents provide feedback on local government projects Processing Identification Documents online has reduced waiting times (UN World Urbanization Prospects) 1,480,000 0.911 (Global Data Lab)
88.7 80.1 80.1 86.4 STRUCTURES TECHNOLOGIES 80.9 75.8 66.3 51.2 87.4 86.8 60.5 86.7 52.9 68.7 71.5 All ratings range from AAA to D 10 3 86.9 GROUP BB TECHNOLOGIES BB FACTOR RATINGS BB STRUCTURES 83.8 61.8 2020 78.7 +0.006 +0.5 +0.0 +0.0 65.9 65.4 85.3 49.6 84.7
74.0 1 yr change 12.7 67,353 12.8 74,104 2021 2022 0.937 79.2 17.2 17.2 2019 ▲ 13 in 2023 Out of 142 Out of 141 77.5 72.4 84.4 68.5 78.0 12.7 0.930 78.9 17.2 12.8 0.931 81.9 87.6 69,550 SMART CITY RANKING BB in 2023 84.1 71.9 63.7 70.8 74.9 77.7 73.9 76.6 SMART CITY RATING +4,553 72,131 0.933 79.7 16.8 72.3% 50.8% 47.4% 33.8% 30.2% 27.4% 25.9% 25.8% 25.6% 23.4% 22.7% 18.4% 17.1% 16.5% 10.0% 0% 20% 40% 60% 80% 100% affordable housing unemployment fulfilling employment road congestion health services air pollution school education Green spaces public transport basic amenities (water, waste) recycling security citizen engagement social mobility inclusiveness corruption / transparency 70.0% 92.8% 92.7% 67.6% 0% 20% 40% 60% 80% 100% 0 20 40 60 80 100 0 20 40 60 80 100 % of respondents who agree or strongly agree with the statement Score % of respondents who chose the Priority Area Score GROUP MEAN CITY LEGEND: MIN GROUP MAX CITY MEAN LEGEND: You are willing to concede personal data in order to improve traffic congestion You are comfortable with face recognition technologies to lower crime You feel the availability of online
your trust in authorities
proportion of your day-to-day payment transactions that are non-cash (% of transactions)
INFORMATION City Population HDI
Map tiles by Stamen Design CC BY 3.0 Map Data © OpenStreetMap
information has increased
The
PRIORITY AREAS BACKGROUND
ATTITUDES
HDI
GNI
speed and reliability meet connectivity needs Minorities feel welcome Governance Governance Information on local government decisions are easily accessible Online public access to city finances has reduced corruption Corruption of city officials is not an issue of concern Online voting has increased participation Residents contribute to decision making of local government An online platform where residents can propose ideas has improved city life Residents provide feedback on local government projects Processing Identification Documents online has reduced waiting times (UN World Urbanization Prospects) 1,480,000 0.911 (Global Data Lab)
88.7 80.1 80.1 86.4 STRUCTURES TECHNOLOGIES 80.9 75.8 66.3 51.2 87.4 86.8 60.5 86.7 52.9 68.7 71.5 All ratings range from AAA to D 10 3 86.9 GROUP BB TECHNOLOGIES BB FACTOR RATINGS BB STRUCTURES 83.8 61.8 2020 78.7 +0.006 +0.5 +0.0 +0.0 65.9 65.4 85.3 49.6 84.7
74.0 1 yr change 12.7 67,353 12.8 74,104 2021 2022 0.937 79.2 17.2 17.2 2019 ▲ 13 in 2023 Out of 142 Out of 141 77.5 72.4 84.4 68.5 78.0 12.7 0.930 78.9 17.2 12.8 0.931 81.9 87.6 69,550 SMART CITY RANKING BB in 2023 84.1 71.9 63.7 70.8 74.9 77.7 73.9 76.6 SMART CITY RATING +4,553 72,131 0.933 79.7 16.8 72.3% 50.8% 47.4% 33.8% 30.2% 27.4% 25.9% 25.8% 25.6% 23.4% 22.7% 18.4% 17.1% 16.5% 10.0% 0% 20% 40% 60% 80% 100% affordable housing unemployment fulfilling employment road congestion health services air pollution school education Green spaces public transport basic amenities (water, waste) recycling security citizen engagement social mobility / inclusiveness corruption / transparency 70.0% 92.8% 92.7% 67.6% 0% 20% 40% 60% 80% 100% 0 20 40 60 80 100 0 20 40 60 80 100 % of respondents who agree or strongly agree with the statement Score % of respondents who chose the Priority Area Score GROUP MEAN CITY LEGEND: MIN GROUP MAX CITY MEAN LEGEND: You are willing to concede personal data in order to improve traffic congestion
are comfortable with face recognition technologies to lower crime
feel the availability of online information has increased your trust in authorities
proportion of your day-to-day payment transactions that are non-cash (% of transactions)
You
You
The
IMD Smart City Index 2024
Methodology
30 IMD Smart City Index 2024
IMD Smart City Index 2024
Methodology
1
2
3
The IMD Smart City Index 2024 assesses the perceptions of residents on issues related to structures and technology applications available to them in their city.
This edition of the SCI ranks 142 cities worldwide by capturing the perceptions of 120 residents in each city. The final score for each city is computed by using the perceptions of the last three years of the survey, with the weight of 3:2:1 for 2024:2023:2021.
There are two pillars for which perceptions from residents are solicited: The Structures pillar referring to the existing infrastructure of the cities, and the Technology pillar describing the technological provisions and services available to the inhabitants.
4
Each pillar is evaluated over five key areas: health and safety, mobility, activities, opportunities, and governance.
5
6
The cities are distributed into four groups based on the Global Data Lab’s Human Development Index (HDI) score of the city they are part of.
Within each HDI group, cities are assigned a ‘rating scale’ (AAA to D) based on the perceptions-score of a given city compared to the scores of all other cities within the same group.
For group 1 (highest HDI quartile), scale
AAA–AA–A–BBB–BB
For group 2 (second HDI quartile), scale
A–BBB–BB–B–CCC
For group 3 (third HDI quartile), scale
BB–B–CCC–CC–C
For group 4 (lowest HDI quartile), scale
CCC–CC–C–D
7 Rankings are then presented in two formats:
• an overall ranking (1 to 142)
• a rating for each pillar and overall
31 IMD Smart City Index 2024
IMD Smart City Index 2024
City Profiles
32 IMD Smart City Index 2024
Abu Dhabi
of respondents who chose the
From a list of 15 indicators, survey respondents were asked to select 5 that they perceived as the most urgent for their city. The higher the percentage of responses per area, the greater the priority for the city.
% of respondents who agree or strongly agree with the statement
ATTITUDES
You are willing to concede personal data in order to improve traffic congestion
You are comfortable with face recognition technologies to lower crime
You feel the availability of online information has increased your trust in authorities
The proportion of your day-to-day payment transactions that are non-cash (% of transactions)
PRIORITY AREAS
City Population HDI
BACKGROUND INFORMATION
Map tiles by Stamen Design CC BY 3.0 Map Data © OpenStreetMap Country United Arab Emirates HDI Life expectancy at birth Expected years of schooling Mean years of schooling GNI per capita (PPP $)
Recycling services are satisfactory A website or App allows residents
items Public safety is not a problem Free public wifi has improved access to city services Air pollution is not a problem CCTV cameras has made residents feel safer Medical services provision is satisfactory A website or App allows residents to effectively monitor air pollution Finding housing with rent equal to 30% or less of a monthly salary is not a problem Arranging medical appointments online has improved access Mobility Mobility Traffic congestion is not a problem Car-sharing Apps have reduced congestion Public transport is satisfactory
that direct you
an available parking space have reduced journey time Bicycle hiring has reduced congestion Online scheduling and ticket sales has made public transport easier to use
city provides information on traffic congestion through mobile phones Activities Activities Green spaces are satisfactory Online purchasing of tickets to shows and museums has made it easier to attend Cultural activities (shows, bars, and museums) are satisfactory Opportunities (Work & School) Opportunities (Work & School) Employment finding services are readily available Online access
work
good
IT
schools Lifelong learning opportunities are provided
institutions
services provided by the city
business Businesses are creating new jobs The current internet speed and reliability meet connectivity needs Minorities feel welcome Governance Governance Information on local government decisions are easily accessible Online public access to city finances has reduced corruption Corruption of city officials is not an issue of concern Online voting has increased participation Residents contribute to decision making of local government An online platform where residents can propose ideas has improved city life Residents provide feedback on local government projects Processing Identification Documents online has reduced waiting times (UN World Urbanization Prospects) 1,480,000 0.911 (Global Data Lab)
Health & Safety Health & Safety Basic sanitation meets the needs of the poorest areas Online reporting of city maintenance problems provides a speedy solution
to easily give away unwanted
Apps
to
The
to job listings has made it easier to find
Most children have access to a
school
skills are taught well in
by local
Online
has made it easier to start a new
88.7 80.1 80.1 86.4 STRUCTURES TECHNOLOGIES 80.9 75.8 66.3 51.2 87.4 86.8 60.5 86.7 52.9 68.7 71.5 All ratings range from AAA to D 10 3 86.9 GROUP BB TECHNOLOGIES BB FACTOR RATINGS BB STRUCTURES 83.8 61.8 2020 78.7 +0.006 +0.5 +0.0 +0.0 65.9 65.4 85.3 49.6 84.7
74.0 1 yr change 12.7 67,353 12.8 74,104 2021 2022 0.937 79.2 17.2 17.2 2019 ▲ 13 in 2023 Out of 142 Out of 141 77.5 72.4 84.4 68.5 78.0 12.7 0.930 78.9 17.2 12.8 0.931 81.9 87.6 69,550 SMART CITY RANKING BB in 2023 84.1 71.9 63.7 70.8 74.9 77.7 73.9 76.6 SMART CITY RATING +4,553 72,131 0.933 79.7 16.8 72.3% 50.8% 47.4% 33.8% 30.2% 27.4% 25.9% 25.8% 25.6% 23.4% 22.7% 18.4% 17.1% 16.5% 10.0% 0% 20% 40% 60% 80% 100% affordable housing unemployment fulfilling employment road congestion health services air pollution school education Green spaces public transport basic amenities (water, waste) recycling security citizen engagement social mobility / inclusiveness corruption / transparency 70.0% 92.8% 92.7% 67.6% 0% 20% 40% 60% 80% 100% 0 20 40 60 80 100 0 20 40 60 80 100
Score
Area Score GROUP MEAN CITY LEGEND: MIN GROUP MAX CITY MEAN LEGEND:
%
Priority
Abuja
% of respondents who chose the Priority Area

From a list of 15 indicators, survey respondents were asked to select 5 that they perceived as the most urgent for their city. The higher the percentage of responses per area, the greater the priority for the city.
% of respondents who agree or strongly agree with the statement
ATTITUDES
You are willing to concede personal data in order to improve traffic congestion
You are comfortable with face recognition technologies to lower crime
You feel the availability of online information has increased your trust in authorities
The proportion of your day-to-day payment transactions that are non-cash (% of transactions)
listings has made it easier to find work
Most children have access to a good school IT skills are taught well in schools
Lifelong learning opportunities are provided by local institutions
Online services provided by the city has made it easier to start a new business Businesses are creating new jobs The current internet speed and reliability meet connectivity needs
PRIORITY AREAS
City Population HDI
BACKGROUND INFORMATION
Map tiles by Stamen Design CC BY 3.0 Map Data © OpenStreetMap Country Nigeria HDI Life expectancy at birth Expected years of schooling Mean years of schooling GNI per capita (PPP $)
Basic sanitation meets the needs of the poorest areas Online reporting of city maintenance problems provides a speedy solution Recycling services are satisfactory A website or App allows residents to easily give away unwanted items Public safety is not a problem Free public wifi has improved access to city services Air pollution is not a problem CCTV cameras has made residents feel safer Medical services provision is satisfactory A website or App allows residents to effectively monitor air pollution Finding housing with rent equal to 30% or less of a monthly salary is not a problem Arranging medical appointments online has improved access Mobility Mobility Traffic congestion is not a problem Car-sharing Apps have reduced congestion Public transport is satisfactory Apps that direct you to an available parking space have reduced journey time Bicycle hiring has reduced congestion Online scheduling and ticket sales has made public transport easier to use The city provides information on traffic congestion through mobile phones Activities Activities Green spaces are satisfactory Online purchasing of tickets to shows and museums has made it easier to attend Cultural activities (shows, bars, and museums) are satisfactory Opportunities (Work & School) Opportunities (Work & School) Employment finding services are readily available Online access to job
Health & Safety Health & Safety
Minorities feel welcome Governance Governance Information on local government decisions are easily accessible Online public access to city finances has reduced corruption Corruption of city officials is not an issue of concern Online voting has increased participation Residents contribute to decision making of local government An online platform where residents can propose ideas has improved city life Residents provide feedback on local government projects Processing Identification Documents online has reduced waiting times (UN World Urbanization Prospects) 3,280,000 0.646 (Global Data Lab)
66.5 41.4 57.0 60.9 STRUCTURES TECHNOLOGIES 39.0 34.4 24.9 37.5 38.8 50.5 22.8 51.7 41.5 54.0 35.6 All ratings range from AAA to D 135 4 46.5 GROUP D TECHNOLOGIES D FACTOR RATINGS C STRUCTURES 50.2 37.1 2020 52.7 +0.006 +1.0 +0.0 +0.0 33.4 66.5 73.6 21.0 61.4
28.5 1 yr change 7.4 4,685 7.6 4,755 2021 2022 0.548 53.6 10.5 10.5 2019
133 in 2023 Out of 142 Out of 141 64.6 35.2 57.3 26.8 34.3 7.2 0.539 52.9 10.3 7.6 0.542 51.8 44.0 4,716 SMART CITY RANKING D in 2023 42.0 26.1 15.1 28.0 51.9 52.3 46.4 53.7 SMART CITY RATING +39 4,914 0.537 52.9 10.1 77.9% 71.3% 65.3% 58.1% 49.4% 39.8% 28.8% 20.0% 19.0% 15.5% 15.0% 10.5% 7.5% 6.9% 5.0% 0% 20% 40% 60% 80% 100% security affordable housing unemployment corruption / transparency health services basic amenities (water, waste) fulfilling employment school education road congestion public transport citizen engagement recycling social mobility / inclusiveness air pollution Green spaces 76.8% 86.7% 60.5% 64.5% 0% 20% 40% 60% 80% 100% 0 20 40 60 80 100 0 20 40 60 80 100
▼
Score
Score GROUP MEAN CITY LEGEND: MIN GROUP MAX CITY MEAN LEGEND:
Accra
of respondents who chose the Priority Area

From a list of 15 indicators, survey respondents were asked to select 5 that they perceived as the most urgent for their city. The higher the percentage of responses per area, the greater the priority for the city.
% of respondents who agree or strongly agree with the statement
ATTITUDES
You are willing to concede personal data in order to improve traffic congestion
You are comfortable with face recognition technologies to lower crime
You feel the availability of online information has increased your trust in authorities
The proportion of your day-to-day payment transactions that are non-cash (% of transactions)
PRIORITY AREAS
City Population HDI
BACKGROUND INFORMATION
Map tiles by Stamen Design CC BY 3.0 Map Data © OpenStreetMap Country Ghana HDI Life expectancy at birth Expected years of schooling Mean years of schooling GNI per capita (PPP $)
Basic sanitation meets the needs of the poorest areas Online reporting of city maintenance problems provides a speedy solution Recycling services are satisfactory A website or App allows residents to easily give away unwanted items Public safety is not a problem Free public wifi has improved access to city services Air pollution is not a problem CCTV cameras has made residents feel safer Medical services provision is satisfactory A website or App allows residents to effectively monitor air pollution Finding housing with rent equal to 30% or less of a monthly salary is not a problem Arranging medical appointments online has improved access Mobility Mobility Traffic congestion is not a problem Car-sharing Apps have reduced congestion Public transport is satisfactory Apps that direct you to an available parking space have reduced journey time Bicycle hiring has reduced congestion Online scheduling and ticket sales has made public transport easier to use The city provides information on traffic congestion through mobile phones Activities Activities Green spaces are satisfactory Online purchasing of tickets to shows and museums has made it easier to attend Cultural activities (shows, bars, and museums) are satisfactory Opportunities (Work & School) Opportunities (Work & School) Employment finding services are readily available Online access to job
Health & Safety Health & Safety
listings has made it easier to find work
IT
opportunities
institutions
business Businesses are creating new jobs The current
speed and reliability meet connectivity needs Minorities feel welcome Governance Governance Information on local government decisions are easily accessible Online public access to city finances has reduced corruption Corruption of city officials is not an issue of concern Online voting has increased participation Residents contribute to decision making of local government An online platform where residents can propose ideas has improved city life Residents provide feedback on local government projects Processing Identification Documents online has reduced waiting times (UN World Urbanization Prospects) 2,610,000 0.707 (Global Data Lab)
Most children have access to a good school
skills are taught well in schools Lifelong learning
are provided by local
Online services provided by the city has made it easier to start a new
internet
65.4 27.2 48.5 51.8 STRUCTURES TECHNOLOGIES 33.5 25.4 20.0 22.3 50.3 49.5 15.8 45.3 19.1 48.4 26.5 All ratings range from AAA to D
4 39.3 GROUP D TECHNOLOGIES D FACTOR RATINGS D STRUCTURES 42.7 30.9 2020 63.8 +0.002 +0.1 +0.0 +0.0 41.8 42.6 67.9 24.2 42.8
138
18.9 1 yr change 6.4 5,305 6.4 5,380 2021 2022 0.602 63.9 11.6 11.6 2019 ▬ 138 in 2023 Out of 142 Out of 141 53.7 42.0 55.7 32.6 31.3 6.3 0.601 64.1 11.4 6.4 0.600 48.6 39.5 5,279 SMART CITY RANKING D in 2023 41.5 19.7 16.1 19.4 48.2 52.4 36.2 48.9 SMART CITY RATING +102 5,121 0.599 64.7 11.3 71.6% 61.0% 53.5% 52.5% 52.5% 38.5% 33.7% 33.4% 25.9% 24.0% 18.7% 12.3% 6.0% 6.0% 4.3% 0% 20% 40% 60% 80% 100% unemployment affordable housing basic amenities (water, waste) corruption / transparency health services security fulfilling employment road congestion air pollution school education recycling public transport citizen engagement social mobility / inclusiveness Green spaces 72.2% 83.6% 48.6% 56.2% 0% 20% 40% 60% 80% 100% 0 20 40 60 80 100 0 20 40 60 80 100
Score
Score GROUP MEAN CITY LEGEND: MIN GROUP MAX CITY MEAN LEGEND:
%
Algiers
% of respondents who chose the Priority Area

From a list of 15 indicators, survey respondents were asked to select 5 that they perceived as the most urgent for their city. The higher the percentage of responses per area, the greater the priority for the city.
% of respondents who agree or strongly agree with the statement
ATTITUDES
You are willing to concede personal data in order to improve traffic congestion
You are comfortable with face recognition technologies to lower crime
You feel the availability of online information has increased your trust in authorities
The proportion of your day-to-day payment transactions that are non-cash (% of transactions)
PRIORITY AREAS
City Population HDI
BACKGROUND INFORMATION
Map tiles by Stamen Design CC BY 3.0 Map Data © OpenStreetMap
Algeria HDI Life expectancy at birth Expected years of schooling Mean years of schooling GNI per capita (PPP $)
Basic sanitation meets the needs of the poorest areas Online reporting of city maintenance problems provides a speedy solution Recycling services are satisfactory A website or App allows residents to easily give away unwanted items Public safety is not a problem Free public wifi has improved access to city services Air pollution is not a problem CCTV cameras has made residents feel safer Medical services provision is satisfactory A website or App allows residents to effectively monitor air pollution Finding housing with rent equal to 30% or less of a monthly salary is not a problem Arranging medical appointments online has improved access Mobility Mobility Traffic congestion is not a problem Car-sharing Apps have reduced congestion Public transport is satisfactory Apps that direct you to an available parking space have reduced journey time Bicycle hiring has reduced congestion Online scheduling and ticket sales has made public transport easier to use The city provides information on traffic congestion through mobile phones Activities Activities Green spaces are satisfactory Online purchasing of tickets to shows and museums has made it easier to attend Cultural activities (shows, bars, and museums) are satisfactory Opportunities (Work & School) Opportunities (Work & School) Employment finding services are readily available Online access to job
Country
Health & Safety Health & Safety
listings has made it easier to find work
IT
jobs
needs Minorities feel welcome Governance Governance Information on local government decisions are easily accessible Online public access to city finances has reduced corruption Corruption of city officials is not an issue of concern Online voting has increased participation Residents contribute to decision making of local government An online platform where residents can propose ideas has improved city life Residents provide feedback on local government projects Processing Identification Documents online has reduced waiting times (UN World Urbanization Prospects) 2,850,000 0.767 (Global Data Lab)
Most children have access to a good school
skills are taught well in schools Lifelong learning opportunities are provided by local institutions Online services provided by the city has made it easier to start a new business Businesses are creating new
The current internet speed and reliability meet connectivity
51.6 44.2 54.3 54.9 STRUCTURES TECHNOLOGIES 46.3 42.2 37.3 32.1 60.3 54.3 38.2 53.0 19.6 50.5 49.8 All ratings range from AAA to D
4 56.6 GROUP C TECHNOLOGIES C FACTOR RATINGS C STRUCTURES 40.5 35.1 2020 76.4 +0.005 +0.8 +0.1 +0.0 51.5 39.9 53.6 35.8 55.1
124
41.4 1 yr change 7.0 10,635 7.0 10,978 2021 2022 0.745 77.1 15.5 15.4 2019
123 in 2023 Out of 142 Out of 141 56.7 46.6 65.9 39.9 47.9 7.0 0.730 74.5 15.3 7.0 0.740 56.0 45.5 10,823 SMART CITY RANKING C in 2023 52.5 38.2 30.6 40.1 63.6 58.7 62.0 50.1 SMART CITY RATING +155 11,354 0.742 76.5 15.2 59.3% 49.4% 49.4% 40.7% 40.2% 33.7% 32.7% 29.5% 29.3% 27.8% 26.6% 22.0% 16.9% 13.8% 7.2% 0% 20% 40% 60% 80% 100% unemployment affordable housing health services road congestion basic amenities (water, waste) corruption / transparency fulfilling employment security public transport air pollution Green spaces recycling school education citizen engagement social mobility / inclusiveness 61.0% 80.1% 73.1% 51.6% 0% 20% 40% 60% 80% 100% 0 20 40 60 80 100 0 20 40 60 80 100
▼
Score
Score GROUP MEAN CITY LEGEND: MIN GROUP MAX CITY MEAN LEGEND:
Al-Khobar
respondents who chose the

From a list of 15 indicators, survey respondents were asked to select 5 that they perceived as the most urgent for their city. The higher the percentage of responses per area, the greater the priority for the city.
of respondents who agree or strongly agree with the statement
ATTITUDES
You are willing to concede personal data in order to improve traffic congestion
You are comfortable with face recognition technologies to lower crime
You feel the availability of online information has increased your trust in authorities
The proportion of your day-to-day payment transactions that are non-cash
(% of transactions)
PRIORITY AREAS
City Population HDI
BACKGROUND INFORMATION
Map tiles by Stamen Design CC BY 3.0 Map Data © OpenStreetMap Country Saudi Arabia HDI Life expectancy at birth Expected years of schooling Mean years of schooling GNI per capita (PPP $)
Basic sanitation meets the needs of the poorest areas Online reporting of city maintenance problems provides a speedy solution Recycling services are satisfactory A website or App allows residents to easily give away unwanted items Public safety is not a problem Free public wifi has improved access to city services Air pollution is not a problem CCTV cameras has made residents feel safer Medical services provision is satisfactory A website or App allows residents to effectively monitor air pollution Finding housing with rent equal to 30% or less of a monthly salary is not a problem Arranging medical appointments online has improved access Mobility Mobility Traffic congestion is not a problem Car-sharing Apps have reduced congestion Public transport is satisfactory Apps that direct you to an available parking space have reduced journey time Bicycle hiring has reduced congestion Online scheduling and ticket sales has made public transport easier to use The city provides information on traffic congestion through mobile phones Activities Activities Green spaces are satisfactory Online purchasing of tickets to shows and museums has made it easier to attend Cultural activities (shows, bars, and museums) are satisfactory Opportunities (Work & School) Opportunities (Work & School) Employment finding services are readily available Online access to
work
children
a good school IT skills
in schools Lifelong learning opportunities are provided by local institutions
services provided
city
easier
business Businesses are creating new jobs The current internet speed and reliability meet connectivity needs Minorities feel welcome Governance Governance Information on local government decisions are easily accessible Online public access to city finances has reduced corruption Corruption of city officials is not an issue of concern Online voting has increased participation Residents contribute to decision making of local government An online platform where residents can propose ideas has improved city life Residents provide feedback on local government projects Processing Identification Documents online has reduced waiting times (Census) 410,000 0.862 (Global Data Lab)
Health & Safety Health & Safety
job listings has made it easier to find
Most
have access to
are taught well
Online
by the
has made it
to start a new
73.5 40.8 55.8 63.3 STRUCTURES TECHNOLOGIES 67.0 66.3 25.5 45.6 59.2 76.2 34.7 87.4 33.7 43.9 47.3 All ratings range from AAA to D 99 3 67.7 GROUP CCC TECHNOLOGIES CC FACTOR RATINGS CCC STRUCTURES 35.0 43.2 2020 76.9 +0.008 +1.0 +0.0 +0.0 54.1 57.1 47.3 54.4 49.7
40.5 1 yr change 11.3 45,563 11.3 50,620 2021 2022 0.875 77.9 15.2 15.2 2019 not in 2023 Out of 142 66.0 51.0 83.3 51.7 53.1 10.9 0.861 76.2 15.2 11.3 0.867 70.4 45.9 47,441 SMART CITY RANKING not in 2023 66.3 54.1 52.4 56.5 69.4 55.4 58.8 59.5 SMART CITY RATING +3,179 47,529 0.862 77.3 15.0 57.1% 53.1% 40.8% 38.8% 36.7% 32.7% 32.7% 30.6% 30.6% 26.5% 18.4% 14.3% 12.2% 12.2% 12.2% 0% 20% 40% 60% 80% 100% affordable housing road congestion public transport health services Green spaces citizen engagement fulfilling employment recycling unemployment basic amenities (water, waste) air pollution school education corruption / transparency social mobility / inclusiveness security 63.3% 81.6% 81.6% 83.7% 0% 20% 40% 60% 80% 100% 0 20 40 60 80 100 0 20 40 60 80 100
Score % of
Area Score GROUP MEAN CITY LEGEND: MIN GROUP MAX CITY MEAN LEGEND:
%
Priority
Amman
chose the Priority Area

From a list of 15 indicators, survey respondents were asked to select 5 that they perceived as the most urgent for their city. The higher the percentage of responses per area, the greater the priority for the city.
respondents who agree or strongly agree with the statement
ATTITUDES
You are willing to concede personal data in order to improve traffic congestion
You are comfortable with face recognition technologies to lower crime
You feel the availability of online information has increased your trust in authorities
The proportion of your day-to-day payment transactions that are non-cash (% of transactions)
PRIORITY AREAS
City Population HDI
BACKGROUND INFORMATION
Map tiles by Stamen Design CC BY 3.0 Map Data © OpenStreetMap Country Jordan HDI Life expectancy at birth Expected years of schooling Mean years of schooling GNI per capita (PPP $)
Basic sanitation meets the needs of the poorest areas Online reporting of city maintenance problems provides a speedy solution Recycling services are satisfactory A website or App allows residents to easily give away unwanted items Public safety is not a problem Free public wifi has improved access to city services Air pollution is not a problem CCTV cameras has made residents feel safer Medical services provision is satisfactory A website or App allows residents to effectively monitor air pollution Finding housing with rent equal to 30% or less of a monthly salary is not a problem Arranging medical appointments online has improved access Mobility Mobility Traffic congestion is not a problem Car-sharing Apps have reduced congestion Public transport is satisfactory Apps that direct you to an available parking space have reduced journey time Bicycle hiring has reduced congestion Online scheduling and ticket sales has made public transport easier to use The city provides information on traffic congestion through mobile phones Activities Activities Green spaces are satisfactory Online purchasing of tickets to shows and museums has made it easier to attend Cultural activities (shows, bars, and museums) are satisfactory Opportunities (Work & School) Opportunities (Work & School) Employment finding services are readily available Online access to job
Health & Safety Health & Safety
listings has made it easier to find work
IT
Businesses
creating new jobs
current
needs Minorities feel welcome Governance Governance Information on local government decisions are easily accessible Online public access to city finances has reduced corruption Corruption of city officials is not an issue of concern Online voting has increased participation Residents contribute to decision making of local government An online platform where residents can propose ideas has improved city life Residents provide feedback on local government projects Processing Identification Documents online has reduced waiting times (UN Data) 4,010,000 0.737 (Global Data Lab)
Most children have access to a good school
skills are taught well in schools Lifelong learning opportunities are provided by local institutions Online services provided by the city has made it easier to start a new business
are
The
internet speed and reliability meet connectivity
59.3 55.0 58.9 65.4 STRUCTURES TECHNOLOGIES 52.0 47.9 37.0 33.4 63.6 57.7 33.3 62.5 13.8 45.7 54.1 All ratings range from AAA to D 128 4 54.5 GROUP D TECHNOLOGIES C FACTOR RATINGS D STRUCTURES 39.2 24.4 2020 74.3 +0.000 -0.0 +0.0 +0.0 39.3 28.1 54.2 32.0 37.6
45.2 1 yr change 10.4 9,183 10.4 9,295 2021 2022 0.736 74.2 12.6 12.6 2019
135 in 2023 Out of 142 Out of 141 58.1 35.8 66.5 28.7 45.2 10.4 0.740 75.2 12.6 10.4 0.736 51.7 37.7 9,180 SMART CITY RANKING D in 2023 57.9 38.4 19.7 46.3 40.9 47.5 33.7 52.4 SMART CITY RATING +115 9,557 0.744 76.0 12.5 66.2% 63.4% 59.7% 48.0% 38.6% 32.7% 30.4% 27.9% 25.5% 24.3% 16.2% 15.0% 13.7% 8.2% 5.0% 0% 20% 40% 60% 80% 100% unemployment affordable housing road congestion corruption / transparency fulfilling employment Green spaces basic amenities (water, waste) health services public transport air pollution school education security recycling citizen engagement social mobility / inclusiveness 52.1% 82.9% 62.2% 54.4% 0% 20% 40% 60% 80% 100% 0 20 40 60 80 100 0 20 40 60 80 100
Score % of
Score GROUP MEAN CITY LEGEND: MIN GROUP MAX CITY MEAN LEGEND:
▲
% of
respondents who
of respondents who chose the Priority Area

From a list of 15 indicators, survey respondents were asked to select 5 that they perceived as the most urgent for their city. The higher the percentage of responses per area, the greater the priority for the city.
% of respondents who agree or strongly agree with the statement
ATTITUDES
You are willing to concede personal data in order to improve traffic congestion
You are comfortable with face recognition technologies to lower crime
You feel the availability of online information has increased your trust in authorities
The proportion of your day-to-day payment transactions that are non-cash (% of transactions)
Health & Safety Health & Safety
PRIORITY AREAS
City Population HDI
BACKGROUND INFORMATION
Map tiles by Stamen Design CC BY 3.0 Map Data © OpenStreetMap Country Netherlands HDI Life expectancy at birth Expected years of schooling Mean years of schooling GNI per capita (PPP $)
Basic sanitation meets the needs of the poorest areas Online reporting of city maintenance problems provides a speedy solution Recycling services are satisfactory A website or App allows residents to easily give away unwanted items Public safety is not a problem Free public wifi has improved access to city services Air pollution is not a problem CCTV cameras has made residents feel safer Medical services provision is satisfactory A website or App allows residents to effectively monitor air pollution Finding housing with rent equal to 30% or less of a monthly salary is not a problem Arranging medical appointments online has improved access Mobility Mobility Traffic congestion is not a problem Car-sharing Apps have reduced congestion Public transport is satisfactory Apps that direct you to an available parking space have reduced journey time Bicycle hiring has reduced congestion Online scheduling and ticket sales has made public transport easier to use The city provides information on traffic congestion through mobile phones Activities Activities Green spaces are satisfactory Online purchasing of tickets to shows and museums has made it easier to attend Cultural activities (shows, bars, and museums) are satisfactory Opportunities (Work & School) Opportunities (Work & School) Employment finding services are readily available Online access to job
listings has made it easier to find work
IT
jobs
needs Minorities feel welcome Governance Governance Information on local government decisions are easily accessible Online public access to city finances has reduced corruption Corruption of city officials is not an issue of concern Online voting has increased participation Residents contribute to decision making of local government An online platform where residents can propose ideas has improved city life Residents provide feedback on local government projects Processing Identification Documents online has reduced waiting times (Eurostat) 1,000,000 0.962 (Global Data Lab)
Most children have access to a good school
skills are taught well in schools Lifelong learning opportunities are provided by local institutions Online services provided by the city has made it easier to start a new business Businesses are creating new
The current internet speed and reliability meet connectivity
76.7 54.4 66.0 67.4 STRUCTURES TECHNOLOGIES 45.0 57.3 55.4 33.5 55.3 71.4 39.8 66.9 25.5 41.5 53.9 All ratings range from AAA to D 18 1 54.6 GROUP A TECHNOLOGIES A FACTOR RATINGS BBB STRUCTURES 60.5 71.2 2020 81.7 +0.005 +0.8 +0.0 +0.0 43.2 65.3 81.7 19.7 54.1
51.6 1 yr change 12.6 52,500 12.6 57,278 2021 2022 0.946 82.5 18.6 18.6 2019
15 in 2023 Out of 142 Out of 141 72.4 57.1 58.9 50.9 50.8 12.5 0.938 81.6 18.4 12.6 0.941 57.9 59.6 55,355 SMART CITY RANKING A in 2023 58.5 42.4 47.2 52.9 71.2 52.2 62.1 52.1 SMART CITY RATING +1,923 55,628 0.941 82.0 18.4 74.2% 61.5% 43.0% 35.3% 32.8% 30.2% 29.1% 28.1% 26.2% 23.5% 21.1% 16.7% 16.7% 11.8% 9.0% 0% 20% 40% 60% 80% 100% affordable housing security health services public transport road congestion basic amenities (water, waste) Green spaces school education air pollution unemployment citizen engagement recycling social mobility / inclusiveness fulfilling employment corruption / transparency 55.7% 57.0% 58.8% 73.5% 0% 20% 40% 60% 80% 100% 0 20 40 60 80 100 0 20 40 60 80 100
Amsterdam
▼
Score
Score GROUP MEAN CITY LEGEND: MIN GROUP MAX CITY MEAN LEGEND:
%
% of respondents who chose the

From a list of 15 indicators, survey respondents were asked to select 5 that they perceived as the most urgent for their city. The higher the percentage of responses per area, the greater the priority for the city.
% of respondents who agree or strongly agree with the statement
ATTITUDES
You are willing to concede personal data in order to improve traffic congestion
You are comfortable with face recognition technologies to lower crime
You feel the availability of online information has increased your trust in authorities
The proportion of your day-to-day payment transactions that are non-cash (% of transactions)
PRIORITY AREAS
City Population HDI
BACKGROUND INFORMATION
Map tiles by Stamen Design CC BY 3.0 Map Data © OpenStreetMap
Turkey HDI Life expectancy at birth Expected years of schooling Mean years of schooling GNI per capita (PPP $)
Basic sanitation meets the needs of the poorest areas Online reporting of city maintenance problems provides a speedy solution Recycling services are satisfactory A website or App allows residents to easily give away unwanted items Public safety is not a problem Free public wifi has improved access to city services Air pollution is not a problem CCTV cameras has made residents feel safer Medical services provision is satisfactory A website or App allows residents to effectively monitor air pollution Finding housing with rent equal to 30% or less of a monthly salary is not a problem Arranging medical appointments online has improved access Mobility Mobility Traffic congestion is not a problem Car-sharing Apps have reduced congestion Public transport is satisfactory Apps that direct you to an available parking space have reduced journey time Bicycle hiring has reduced congestion Online scheduling and ticket sales has made public transport easier to use The city provides information on traffic congestion through mobile phones Activities Activities Green spaces are satisfactory Online purchasing of tickets to shows and museums has made it easier to attend Cultural activities (shows, bars, and museums) are satisfactory Opportunities (Work & School) Opportunities (Work & School) Employment finding services are readily available Online access to job
Country
Health & Safety Health & Safety
listings has made it easier to find work
Minorities feel welcome Governance Governance Information on local government decisions are easily accessible Online public access to city finances has reduced corruption Corruption of city officials is not an issue of concern Online voting has increased participation Residents contribute to decision making of local government An online platform where residents can propose ideas has improved city life Residents provide feedback on local government projects Processing Identification Documents online has reduced waiting times (UN World Urbanization Prospects) 5,120,000 0.854 (Global Data Lab)
Most children have access to a good school IT skills are taught well in schools Lifelong learning opportunities are provided by local institutions Online services provided by the city has made it easier to start a new business Businesses are creating new jobs The current internet speed and reliability meet connectivity needs
74.1 75.2 66.2 68.9 STRUCTURES TECHNOLOGIES 59.5 57.4 44.8 41.1 67.8 59.2 50.0 70.9 32.8 41.7 45.0 All ratings range from AAA to D 96 3 71.3 GROUP CCC TECHNOLOGIES CCC FACTOR RATINGS CCC STRUCTURES 55.3 60.1 2020 76.0 +0.014 +2.4 +0.0 +0.0 63.6 53.7 62.4 29.2 52.6
62.4 1 yr change 8.8 28,381 8.8 32,834 2021 2022 0.855 78.5 19.7 19.7 2019 ▼ 90 in 2023 Out of 142 Out of 141 70.8 57.6 68.5 53.3 59.8 8.6 0.835 75.9 19.3 8.8 0.841 51.9 61.7 31,310 SMART CITY RANKING CCC in 2023 66.5 54.0 38.6 45.3 50.9 58.5 60.3 58.9 SMART CITY RATING +1,524 27,950 0.842 77.8 19.2 68.1% 49.8% 39.6% 39.4% 30.9% 29.0% 28.7% 27.8% 27.4% 26.8% 25.6% 25.2% 20.4% 7.7% 6.3% 0% 20% 40% 60% 80% 100% affordable housing unemployment road congestion Green spaces fulfilling employment health services basic amenities (water, waste) school education corruption / transparency air pollution public transport security recycling citizen engagement social mobility / inclusiveness 59.8% 71.3% 62.7% 68.3% 0% 20% 40% 60% 80% 100% 0 20 40 60 80 100 0 20 40 60 80 100
Ankara
Score
Score GROUP MEAN CITY LEGEND: MIN GROUP MAX CITY
LEGEND:
Priority Area
MEAN
Athens
of respondents who chose the Priority Area

From a list of 15 indicators, survey respondents were asked to select 5 that they perceived as the most urgent for their city. The higher the percentage of responses per area, the greater the priority for the city.
% of respondents who agree or strongly agree with the statement
ATTITUDES
You are willing to concede personal data in order to improve traffic congestion
You are comfortable with face recognition technologies to lower crime
You feel the availability of online information has increased your trust in authorities
The proportion of your day-to-day payment transactions that are non-cash (% of transactions)
listings has made it easier to find work
Most children have access to a good school IT skills are taught well in schools
Lifelong learning opportunities are provided by local institutions
PRIORITY AREAS
City Population HDI
BACKGROUND INFORMATION
Map tiles by Stamen Design CC BY 3.0 Map Data © OpenStreetMap Country Greece HDI Life expectancy at birth Expected years of schooling Mean years of schooling GNI per capita (PPP $)
Basic sanitation meets the needs of the poorest areas Online reporting of city maintenance problems provides a speedy solution Recycling services are satisfactory A website or App allows residents to easily give away unwanted items Public safety is not a problem Free public wifi has improved access to city services Air pollution is not a problem CCTV cameras has made residents feel safer Medical services provision is satisfactory A website or App allows residents to effectively monitor air pollution Finding housing with rent equal to 30% or less of a monthly salary is not a problem Arranging medical appointments online has improved access Mobility Mobility Traffic congestion is not a problem Car-sharing Apps have reduced congestion Public transport is satisfactory Apps that direct you to an available parking space have reduced journey time Bicycle hiring has reduced congestion Online scheduling and ticket sales has made public transport easier to use The city provides information on traffic congestion through mobile phones Activities Activities Green spaces are satisfactory Online purchasing of tickets to shows and museums has made it easier to attend Cultural activities (shows, bars, and museums) are satisfactory Opportunities (Work & School) Opportunities (Work & School) Employment finding services are readily available Online access to job
Health & Safety Health & Safety
Minorities feel welcome Governance Governance Information on local government decisions are easily accessible Online public access to city finances has reduced corruption Corruption of city officials is not an issue of concern Online voting has increased participation Residents contribute to decision making of local government An online platform where residents can propose ideas has improved city life Residents provide feedback on local government projects Processing Identification Documents online has reduced waiting times (UN World Urbanization Prospects) 3,150,000 0.909 (Global Data Lab)
Online services provided by the city has made it easier to start a new business Businesses are creating new jobs The current internet speed and reliability meet connectivity needs
76.8 54.4 60.6 51.9 STRUCTURES TECHNOLOGIES 46.2 62.3 36.6 18.4 37.8 33.9 37.0 64.0 13.2 35.7 44.2 All ratings range from AAA to D 120 3 51.1 GROUP C TECHNOLOGIES C FACTOR RATINGS C STRUCTURES 26.0 40.1 2020 80.1 +0.006 +0.5 +0.0 +0.0 24.8 39.4 69.5 18.0 31.9
43.2 1 yr change 11.4 26,973 11.4 31,382 2021 2022 0.893 80.6 20.0 20.0 2019
113 in 2023 Out of 142 Out of 141 66.0 39.4 73.1 23.7 37.1 11.1 0.887 80.9 19.7 11.4 0.887 35.9 41.0 29,421 SMART CITY RANKING C in 2023 39.4 31.8 22.8 41.0 39.2 44.2 39.4 51.5 SMART CITY RATING +1,960 29,457 0.890 81.2 19.7 59.0% 52.9% 47.6% 46.3% 44.2% 31.9% 30.8% 29.2% 28.8% 26.1% 21.4% 20.6% 16.9% 7.2% 7.1% 0% 20% 40% 60% 80% 100% security health services road congestion unemployment affordable housing corruption / transparency Green spaces air pollution basic amenities (water, waste) fulfilling employment school education public transport recycling citizen engagement social mobility / inclusiveness 54.7% 57.9% 49.7% 66.5% 0% 20% 40% 60% 80% 100% 0 20 40 60 80 100 0 20 40 60 80 100
▼
Score
Score GROUP MEAN CITY LEGEND: MIN GROUP MAX CITY MEAN LEGEND:
%
of respondents who chose the

From a list of 15 indicators, survey respondents were asked to select 5 that they perceived as the most urgent for their city. The higher the percentage of responses per area, the greater the priority for the city.
% of respondents who agree or strongly agree with the statement
ATTITUDES
You are willing to concede personal data in order to improve traffic congestion
You are comfortable with face recognition technologies to lower crime
You feel the availability of online information has increased your trust in authorities
The proportion of your day-to-day payment transactions that are non-cash (% of transactions)
Health & Safety Health & Safety
PRIORITY AREAS
City Population HDI
BACKGROUND INFORMATION
Map tiles by Stamen Design CC BY 3.0 Map Data © OpenStreetMap Country New Zealand HDI Life expectancy at birth Expected years of schooling Mean years of schooling GNI per capita (PPP $)
sanitation
reporting
Recycling services are satisfactory A website or App allows residents to easily give away unwanted items Public safety is not a problem Free public wifi has improved access to city services Air pollution is not a problem CCTV cameras has made residents feel safer Medical services provision is satisfactory A website or App allows residents to effectively monitor air pollution Finding housing with rent equal to 30% or less of a monthly salary is not a problem Arranging medical appointments online has improved access Mobility Mobility Traffic congestion is not a problem Car-sharing Apps have reduced congestion Public transport is satisfactory
that direct you to an available parking space have reduced journey time Bicycle hiring has reduced congestion Online scheduling and ticket sales has made public transport easier to use The city provides information on traffic congestion through mobile phones Activities Activities Green spaces are satisfactory Online purchasing of tickets to shows and museums has made it easier to attend Cultural activities (shows, bars, and museums) are satisfactory Opportunities (Work & School) Opportunities (Work & School) Employment finding services are readily available Online access to
Basic
meets the needs of the poorest areas Online
of city maintenance problems provides a speedy solution
Apps
job listings has made it easier to find work
Businesses
jobs
needs Minorities feel welcome Governance Governance Information on local government decisions are easily accessible Online public access to city finances has reduced corruption Corruption of city officials is not an issue of concern Online voting has increased participation Residents contribute to decision making of local government An online platform where residents can propose ideas has improved city life Residents provide feedback on local government projects Processing Identification Documents online has reduced waiting times (UN World Urbanization Prospects) 1,610,000 0.951 (Global Data Lab)
Most children have access to a good school IT skills are taught well in schools Lifelong learning opportunities are provided by local institutions Online services provided by the city has made it easier to start a new business
are creating new
The current internet speed and reliability meet connectivity
76.9 53.3 54.0 71.1 STRUCTURES TECHNOLOGIES 46.6 61.3 39.1 53.9 50.1 54.4 34.3 64.5 14.7 40.1 41.4 All ratings range from AAA to D 31 1 66.2 GROUP BBB TECHNOLOGIES A FACTOR RATINGS BBB STRUCTURES 38.4 65.1 2020 82.5 +0.003 +0.6 +0.0 +0.0 44.2 56.0 73.9 19.9 65.8
58.5 1 yr change 12.9 41,225 12.9 43,665 2021 2022 0.939 83.0 19.7 19.7 2019
22 in 2023 Out of 142 Out of 141 74.9 59.0 60.8 48.6 46.2 13.0 0.935 82.7 19.2 12.9 0.936 56.9 72.4 42,850 SMART CITY RANKING A in 2023 55.3 37.7 50.3 53.9 68.5 52.6 63.8 47.1 SMART CITY RATING +816 42,210 0.937 82.6 19.5 84.5% 64.4% 52.9% 42.8% 40.1% 38.7% 26.2% 22.5% 19.7% 14.9% 14.6% 13.5% 10.4% 9.0% 8.0% 0% 20% 40% 60% 80% 100% affordable housing road congestion health services security unemployment public transport fulfilling employment school education basic amenities (water, waste) recycling corruption / transparency air pollution Green spaces social mobility / inclusiveness citizen engagement 67.1% 69.8% 57.5% 78.4% 0% 20% 40% 60% 80% 100% 0 20 40 60 80 100 0 20 40 60 80 100
Auckland
▼
Score
Area Score GROUP MEAN CITY LEGEND: MIN GROUP MAX CITY MEAN LEGEND:
%
Priority
% of respondents who chose the Priority Area

From a list of 15 indicators, survey respondents were asked to select 5 that they perceived as the most urgent for their city. The higher the percentage of responses per area, the greater the priority for the city.
% of respondents who agree or strongly agree with the statement
ATTITUDES
You are willing to concede personal data in order to improve traffic congestion
You are comfortable with face recognition technologies to lower crime
You feel the availability of online information has increased your trust in authorities
The proportion of your day-to-day payment transactions that are non-cash (% of transactions)
Health & Safety Health & Safety
listings has made it easier to find work
Most children have access to a good school IT skills are taught well in schools
PRIORITY AREAS
City Population HDI
BACKGROUND INFORMATION
Map tiles by Stamen Design CC BY 3.0 Map Data © OpenStreetMap Country Thailand HDI Life expectancy at birth Expected years of schooling Mean years of schooling GNI per capita (PPP $)
sanitation
Recycling services are satisfactory A website or App allows residents to easily give away unwanted items Public safety is not a problem Free public wifi has improved access to city services Air pollution is not a problem CCTV cameras has made residents feel safer Medical services provision is satisfactory A website or App allows residents to effectively monitor air pollution Finding housing with rent equal to 30% or less of a monthly salary is not a problem Arranging medical appointments online has improved access
Traffic congestion is not a problem Car-sharing
congestion Public transport is satisfactory
that
available parking
have
journey time
hiring has
congestion
scheduling and ticket sales has made public transport easier to use
city provides information on traffic congestion through mobile phones Activities Activities Green spaces are satisfactory Online purchasing of tickets to shows and museums has made it easier to attend Cultural activities (shows, bars, and museums) are satisfactory Opportunities (Work & School) Opportunities (Work & School) Employment finding services are readily available Online access to job
Basic
meets the needs of the poorest areas Online reporting of city maintenance problems provides a speedy solution
Mobility Mobility
Apps have reduced
Apps
direct you to an
space
reduced
Bicycle
reduced
Online
The
Lifelong learning opportunities are provided by local institutions
Minorities feel welcome Governance Governance Information on local government decisions are easily accessible Online public access to city finances has reduced corruption Corruption of city officials is not an issue of concern Online voting has increased participation Residents contribute to decision making of local government An online platform where residents can propose ideas has improved city life Residents provide feedback on local government projects Processing Identification Documents online has reduced waiting times (UN World Urbanization Prospects) 10,540,000 0.839 (Global Data Lab)
Online services provided by the city has made it easier to start a new business Businesses are creating new jobs The current internet speed and reliability meet connectivity needs
80.5 71.5 73.6 78.7 STRUCTURES TECHNOLOGIES 60.2 63.3 60.4 32.9 75.1 63.3 71.5 74.7 27.1 61.8 64.4 All ratings range from AAA to D 84 3 70.4 GROUP CCC TECHNOLOGIES B FACTOR RATINGS CCC STRUCTURES 47.5 61.7 2020 78.7 +0.006 +1.0 +0.0 +0.0 50.0 64.9 67.3 51.0 61.6
60.0 1 yr change 8.8 16,444 8.8 16,887 2021 2022 0.803 79.7 15.6 15.6 2019 ▲ 88 in 2023 Out of 142 Out of 141 80.5 59.1 78.3 54.9 72.4 8.7 0.800 79.3 15.6 8.8 0.797 59.8 64.9 16,481 SMART CITY RANKING B in 2023 57.6 61.7 36.4 71.5 57.9 73.5 59.4 70.5 SMART CITY RATING +405 17,335 0.801 79.0 15.8 64.0% 54.3% 47.1% 45.0% 39.1% 34.5% 30.1% 24.8% 21.5% 21.2% 20.4% 20.2% 12.8% 12.2% 7.1% 0% 20% 40% 60% 80% 100% air pollution security corruption / transparency road congestion basic amenities (water, waste) public transport health services unemployment fulfilling employment affordable housing Green spaces social mobility / inclusiveness recycling school education citizen engagement 75.2% 69.3% 75.1% 72.1% 0% 20% 40% 60% 80% 100% 0 20 40 60 80 100 0 20 40 60 80 100
Bangkok
Score
Score GROUP MEAN CITY LEGEND: MIN GROUP MAX CITY MEAN LEGEND:
respondents who chose the Priority

From a list of 15 indicators, survey respondents were asked to select 5 that they perceived as the most urgent for their city. The higher the percentage of responses per area, the greater the priority for the city.
% of respondents who agree or strongly agree with the statement
ATTITUDES
You are willing to concede personal data in order to improve traffic congestion
You are comfortable with face recognition technologies to lower crime
You feel the availability of online information has increased your trust in authorities
The proportion of your day-to-day payment transactions that are non-cash (% of transactions)
PRIORITY AREAS
City Population HDI
BACKGROUND INFORMATION
Map tiles by Stamen Design CC BY 3.0 Map Data © OpenStreetMap Country Spain HDI Life expectancy at birth Expected years of schooling Mean years of schooling GNI per capita (PPP $)
Basic sanitation meets the needs of the poorest areas Online reporting of city maintenance problems provides a speedy solution Recycling services are satisfactory A website or App allows residents to easily give away unwanted items Public safety is not a problem Free public wifi has improved access to city services Air pollution is not a problem CCTV cameras has made residents feel safer Medical services provision is satisfactory A website or App allows residents to effectively monitor air pollution Finding housing with rent equal to 30% or less of a monthly salary is not a problem Arranging medical appointments online has improved access Mobility Mobility Traffic congestion is not a problem Car-sharing Apps have reduced congestion Public transport is satisfactory Apps that direct you to an available parking space have reduced journey time Bicycle hiring has reduced congestion Online scheduling and ticket sales has made public transport easier to use The city provides information on traffic congestion through mobile phones Activities Activities Green spaces are satisfactory Online purchasing of tickets to shows and museums has made it easier to attend Cultural activities (shows, bars, and museums) are satisfactory Opportunities (Work & School) Opportunities (Work & School) Employment finding services are readily available Online access to job
work
good
IT skills
schools Lifelong learning opportunities are provided
local institutions
services provided
the
easier
business Businesses are creating new jobs The current internet speed and reliability meet connectivity needs Minorities feel welcome Governance Governance Information on local government decisions are easily accessible Online public access to city finances has reduced corruption Corruption of city officials is not an issue of concern Online voting has increased participation Residents contribute to decision making of local government An online platform where residents can propose ideas has improved city life Residents provide feedback on local government projects Processing Identification Documents online has reduced waiting times (Eurostat) 1,640,000 0.916 (Global Data Lab)
Health & Safety Health & Safety
listings has made it easier to find
Most children have access to a
school
are taught well in
by
Online
by
city has made it
to start a new
79.0 61.4 67.4 71.1 STRUCTURES TECHNOLOGIES 49.1 57.8 56.5 26.3 41.2 52.6 40.7 66.8 26.1 45.9 48.2 All ratings range from AAA to D 81 2 63.2 GROUP BB TECHNOLOGIES BB FACTOR RATINGS BB STRUCTURES 59.3 73.8 2020 83.0 +0.007 +0.9 +0.0 +0.0 45.0 46.8 75.8 18.4 60.9
51.5 1 yr change 10.6 36,076 10.6 40,043 2021 2022 0.911 83.9 17.8 17.8 2019
75 in 2023 Out of 142 Out of 141 64.2 41.8 59.2 35.4 50.1 10.4 0.894 82.3 17.5 10.6 0.904 54.5 60.7 38,133 SMART CITY RANKING BB in 2023 46.9 37.7 32.7 50.8 57.9 56.4 62.6 51.6 SMART CITY RATING +1,911 40,854 0.904 83.5 17.5 77.4% 61.9% 52.9% 41.6% 34.1% 30.5% 26.7% 23.3% 22.9% 21.9% 20.5% 19.7% 15.9% 12.1% 11.8% 0% 20% 40% 60% 80% 100% affordable housing security fulfilling employment health services unemployment air pollution road congestion corruption / transparency basic amenities (water, waste) school education Green spaces public transport recycling citizen engagement social mobility / inclusiveness 56.9% 70.9% 52.2% 66.1% 0% 20% 40% 60% 80% 100% 0 20 40 60 80 100 0 20 40 60 80 100
Score
Score GROUP MEAN CITY LEGEND: MIN GROUP MAX CITY MEAN LEGEND:
Barcelona
▼
% of
Area
Beijing
respondents who chose the Priority Area

From a list of 15 indicators, survey respondents were asked to select 5 that they perceived as the most urgent for their city. The higher the percentage of responses per area, the greater the priority for the city.
% of respondents who agree or strongly agree with the statement
ATTITUDES
You are willing to concede personal data in order to improve traffic congestion
You are comfortable with face recognition technologies to lower crime
You feel the availability of online information has increased your trust in authorities
The proportion of your day-to-day payment transactions that are non-cash (% of transactions)
PRIORITY AREAS
City Population HDI
BACKGROUND INFORMATION
Map tiles by Stamen Design CC BY 3.0 Map Data © OpenStreetMap Country China HDI Life expectancy at birth Expected years of schooling Mean years of schooling GNI per capita (PPP $)
Basic sanitation meets the needs of the poorest areas Online reporting of city maintenance problems provides a speedy solution Recycling services are satisfactory A website or App allows residents to easily give away unwanted items Public safety is not a problem Free public wifi has improved access to city services Air pollution is not a problem CCTV cameras has made residents feel safer Medical services provision is satisfactory A website or App allows residents to effectively monitor air pollution Finding housing with rent equal to 30% or less of a monthly salary is not a problem Arranging medical appointments online has improved access Mobility Mobility Traffic congestion is not a problem Car-sharing Apps have reduced congestion Public transport is satisfactory Apps that direct you to an available parking space have reduced journey time Bicycle hiring has reduced congestion Online scheduling and ticket sales has made public transport easier to use The city provides information on traffic congestion through mobile phones Activities Activities Green spaces are satisfactory Online purchasing of tickets to shows and museums has made it easier to attend Cultural activities (shows, bars, and museums) are satisfactory Opportunities (Work & School) Opportunities (Work & School) Employment finding services are readily available Online access to job
work
good
IT skills
in schools Lifelong learning opportunities are provided by local institutions
services provided by the city
easier to
business Businesses are creating new jobs The current internet speed and reliability meet connectivity needs Minorities feel welcome Governance Governance Information on local government decisions are easily accessible Online public access to city finances has reduced corruption Corruption of city officials is not an issue of concern Online voting has increased participation Residents contribute to decision making of local government An online platform where residents can propose ideas has improved city life Residents provide feedback on local government projects Processing Identification Documents online has reduced waiting times (UN World Urbanization Prospects) 20,460,000 0.907 (Global Data Lab)
Health & Safety Health & Safety
listings has made it easier to find
Most children have access to a
school
are taught well
Online
has made it
start a new
88.4 83.7 85.3 86.3 STRUCTURES TECHNOLOGIES 79.6 77.6 79.5 50.1 79.1 75.7 75.5 86.5 34.3 63.4 77.2 All ratings range from AAA to D 13 3 82.5 GROUP BB TECHNOLOGIES BB FACTOR RATINGS BB STRUCTURES 66.6 78.8 2020 78.2 +0.003 +0.4 +0.0 +0.0 76.7 75.3 83.4 54.3 80.4
75.5 1 yr change 8.1 16,168 8.1 18,025 2021 2022 0.788 78.6 15.2 15.2 2019 ▼ 12 in 2023 Out of 142 Out of 141 80.0 70.5 82.0 63.8 78.4 8.0 0.781 78.1 15.2 8.1 0.785 81.5 79.0 17,499 SMART CITY RANKING BB in 2023 77.8 70.4 55.2 73.7 77.0 79.9 69.1 77.0 SMART CITY RATING +526 15,934 0.775 78.0 15.0 56.9% 56.3% 51.7% 38.3% 32.1% 30.4% 25.1% 24.1% 23.7% 19.3% 18.0% 17.7% 17.3% 15.4% 11.7% 0% 20% 40% 60% 80% 100% road congestion air pollution affordable housing fulfilling employment health services corruption / transparency basic amenities (water, waste) social mobility / inclusiveness unemployment school education public transport recycling security Green spaces citizen engagement 84.9% 86.3% 85.1% 85.8% 0% 20% 40% 60% 80% 100% 0 20 40 60 80 100 0 20 40 60 80 100
Score
Score GROUP MEAN CITY LEGEND: MIN GROUP MAX CITY MEAN LEGEND:
% of
Beirut
% of respondents who chose the Priority Area

From a list of 15 indicators, survey respondents were asked to select 5 that they perceived as the most urgent for their city. The higher the percentage of responses per area, the greater the priority for the city.
% of respondents who agree or strongly agree with the statement
ATTITUDES
You are willing to concede personal data in order to improve traffic congestion
You are comfortable with face recognition technologies to lower crime
You feel the availability of online information has increased your trust in authorities
The proportion of your day-to-day payment transactions that are non-cash (% of transactions)
listings has made it easier to find work
PRIORITY AREAS
City Population HDI
BACKGROUND INFORMATION
Map tiles by Stamen Design CC BY 3.0 Map Data © OpenStreetMap Country Lebanon HDI Life expectancy at birth Expected years of schooling Mean years of schooling GNI per capita (PPP $)
Basic sanitation meets the needs of the poorest areas Online reporting of city maintenance problems provides a speedy solution Recycling services are satisfactory A website or App allows residents to easily give away unwanted items Public safety is not a problem Free public wifi has improved access to city services Air pollution is not a problem CCTV cameras has made residents feel safer Medical services provision is satisfactory A website or App allows residents to effectively monitor air pollution Finding housing with rent equal to 30% or less of a monthly salary is not a problem Arranging medical appointments online has improved access Mobility Mobility Traffic congestion is not a problem Car-sharing Apps have reduced congestion Public transport is satisfactory Apps that direct you to an available parking space have reduced journey time Bicycle hiring has reduced congestion Online scheduling and ticket sales has made public transport easier to use The city provides information on traffic congestion through mobile phones Activities Activities Green spaces are satisfactory Online purchasing of tickets to shows and museums has made it easier to attend Cultural activities (shows, bars, and museums) are satisfactory Opportunities (Work & School) Opportunities (Work & School) Employment finding services are readily available Online access to job
Health & Safety Health & Safety
Minorities feel welcome Governance Governance Information on local government decisions are easily accessible Online public access to city finances has reduced corruption Corruption of city officials is not an issue of concern Online voting has increased participation Residents contribute to decision making of local government An online platform where residents can propose ideas has improved city life Residents provide feedback on local government projects Processing Identification Documents online has reduced waiting times (UN World Urbanization Prospects) 2,430,000 0.677 (Global Data Lab)
Most children have access to a good school IT skills are taught well in schools Lifelong learning opportunities are provided by local institutions Online services provided by the city has made it easier to start a new business Businesses are creating new jobs The current internet speed and reliability meet connectivity needs
60.7 51.4 44.3 42.8 STRUCTURES TECHNOLOGIES 35.0 43.0 41.9 18.1 46.1 38.8 29.7 54.9 14.3 34.1 40.2 All ratings range from AAA to D 140 4 40.5 GROUP D TECHNOLOGIES D FACTOR RATINGS D STRUCTURES 27.2 29.5 2020 75.0 -0.002 -0.6 +0.0 +0.0 27.6 35.1 58.2 26.3 36.5
33.9 1 yr change 8.6 13,311 8.6 12,313 2021 2022 0.723 74.4 12.1 12.1 2019 ▼ 139 in 2023 Out of 142 Out of 141 61.7 29.3 39.9 24.4 36.9 8.6 0.742 77.8 12.1 8.6 0.725 42.6 36.7 12,146 SMART CITY RANKING D in 2023 39.7 26.9 20.0 40.8 29.1 49.7 30.6 41.8 SMART CITY RATING +167 16,724 0.760 79.2 12.1 55.4% 53.3% 49.1% 49.1% 45.8% 45.3% 36.7% 34.1% 29.7% 22.0% 21.9% 21.0% 16.1% 7.9% 3.8% 0% 20% 40% 60% 80% 100% security affordable housing unemployment basic amenities (water, waste) corruption / transparency health services air pollution road congestion public transport school education fulfilling employment recycling Green spaces citizen engagement social mobility / inclusiveness 56.1% 77.3% 48.8% 42.3% 0% 20% 40% 60% 80% 100% 0 20 40 60 80 100 0 20 40 60 80 100
Score
Score GROUP MEAN CITY LEGEND: MIN GROUP MAX CITY MEAN LEGEND:
Belfast
of respondents who chose the Priority

From a list of 15 indicators, survey respondents were asked to select 5 that they perceived as the most urgent for their city. The higher the percentage of responses per area, the greater the priority for the city.
% of respondents who agree or strongly agree with the statement
ATTITUDES
You are willing to concede personal data in order to improve traffic congestion
You are comfortable with face recognition technologies to lower crime
You feel the availability of online information has increased your trust in authorities
The proportion of your day-to-day payment transactions that are non-cash (% of transactions)
PRIORITY AREAS
City Population HDI
BACKGROUND INFORMATION
Map tiles by Stamen Design CC BY 3.0 Map Data © OpenStreetMap Country United Kingdom HDI Life expectancy at birth Expected years of schooling Mean years of schooling GNI per capita (PPP $)
Basic sanitation meets the needs of the poorest areas Online reporting of city maintenance problems provides a speedy solution Recycling services are satisfactory A website or App allows residents to easily give away unwanted items Public safety is not a problem Free public wifi has improved access to city services Air pollution is not a problem CCTV cameras has made residents feel safer Medical services provision is satisfactory A website or App allows residents to effectively monitor air pollution Finding housing with rent equal to 30% or less of a monthly salary is not a problem Arranging medical appointments online has improved access Mobility Mobility Traffic congestion is not a problem Car-sharing Apps have reduced congestion Public transport is satisfactory Apps that direct you to an available parking space have reduced journey time Bicycle hiring has reduced congestion Online scheduling and ticket sales has made public transport easier to use The city provides information on traffic congestion through mobile phones Activities Activities Green spaces are satisfactory Online purchasing of tickets to shows and museums has made it easier to attend Cultural activities (shows, bars, and museums) are satisfactory Opportunities (Work & School) Opportunities (Work & School) Employment finding services are readily available Online access to job listings
easier to find work
children have access to a good school IT skills are taught well in schools Lifelong learning opportunities are provided by local institutions Online services provided by the city has made it easier to start a new business Businesses are creating new jobs The current internet speed and reliability meet connectivity needs Minorities feel welcome Governance Governance Information on local government decisions are easily accessible Online public access to city finances has reduced corruption Corruption of city officials is not an issue of concern Online voting has increased participation Residents contribute to decision making of local government An online platform where residents can propose ideas has improved city life Residents provide feedback on local government projects Processing Identification Documents online has reduced waiting times (Eurostat) 340,000 0.896 (Global Data Lab)
Health & Safety Health & Safety
has made it
Most
74.3 44.7 68.3 66.9 STRUCTURES TECHNOLOGIES 34.4 65.2 43.6 39.5 54.2 39.5 28.0 37.2 30.0 29.5 32.4 All ratings range from AAA to D
3 60.4 GROUP CC TECHNOLOGIES C FACTOR RATINGS CCC STRUCTURES 51.3 69.8 2020 80.7 +0.009 +1.4 +0.0 +0.0 44.2 62.3 75.6 23.7 61.0
101
61.7 1 yr change 13.4 40,799 13.4 46,624 2021 2022 0.940 82.2 17.6 17.6
95 in 2023 Out of 142 Out of 141 73.4 47.1 52.5 37.5 35.3 13.3 0.920 80.4 17.2 13.4 0.931 50.4 61.9 44,750 SMART CITY RANKING CC in 2023 50.8 33.5 37.8 39.1 74.8 64.5 65.5 49.4 SMART CITY RATING +1,874 47,066 0.933 81.7 17.2 80.4% 78.7% 47.8% 36.3% 32.4% 28.9% 26.7% 23.3% 21.6% 19.6% 19.4% 15.0% 14.7% 9.1% 6.6% 0% 20% 40% 60% 80% 100% health services affordable housing unemployment security public transport road congestion school education fulfilling employment recycling corruption / transparency Green spaces social mobility / inclusiveness air pollution basic amenities (water, waste) citizen engagement 60.5% 72.5% 49.3% 77.9% 0% 20% 40% 60% 80% 100% 0 20 40 60 80 100 0 20 40 60 80 100
2019 ▼
Score
Score GROUP MEAN CITY LEGEND: MIN GROUP MAX CITY MEAN LEGEND:
%
Area
Bengaluru
%
respondents who chose the

From a list of 15 indicators, survey respondents were asked to select 5 that they perceived as the most urgent for their city. The higher the percentage of responses per area, the greater the priority for the city.
% of respondents who agree or strongly agree with the statement
ATTITUDES
You are willing to concede personal data in order to improve traffic congestion
You are comfortable with face recognition technologies to lower crime
You feel the availability of online information has increased your trust in authorities
The proportion of your day-to-day payment transactions that are non-cash (% of transactions)
PRIORITY AREAS
INFORMATION City Population HDI
BACKGROUND
Map tiles by Stamen Design CC BY 3.0 Map Data © OpenStreetMap Country India HDI Life expectancy at birth Expected years of schooling Mean years of schooling GNI per capita (PPP $)
Basic sanitation meets the needs of the poorest areas Online reporting of city maintenance problems provides a speedy solution Recycling services are satisfactory A website or App allows residents to easily give away unwanted items Public safety is not a problem Free public wifi has improved access to city services Air pollution is not a problem CCTV cameras has made residents feel safer Medical services provision is satisfactory A website or App allows residents to effectively monitor air pollution Finding housing with rent equal to 30% or less of a monthly salary is not a problem Arranging medical appointments online has improved access Mobility Mobility Traffic congestion is not a problem Car-sharing Apps have reduced congestion Public transport is satisfactory Apps that direct you to an available parking space have reduced journey time Bicycle hiring has reduced congestion Online scheduling and ticket sales has made public transport easier to use The city provides information on traffic congestion through mobile phones Activities Activities Green spaces are satisfactory Online purchasing of tickets to shows and museums has made it easier to attend Cultural activities (shows, bars, and museums) are satisfactory Opportunities (Work & School) Opportunities (Work & School) Employment finding services are readily available Online access to job
work
IT
schools Lifelong learning opportunities are provided
local institutions
services provided
business Businesses are creating new jobs The current internet speed and reliability meet connectivity needs Minorities feel welcome Governance Governance Information on local government decisions are easily accessible Online public access to city finances has reduced corruption Corruption of city officials is not an issue of concern Online voting has increased participation Residents contribute to decision making of local government An online platform where residents can propose ideas has improved city life Residents provide feedback on local government projects Processing Identification Documents online has reduced waiting times (UN World Urbanization Prospects) 12,330,000 0.667 (Global Data Lab)
Health & Safety Health & Safety
listings has made it easier to find
Most children have access to a good school
skills are taught well in
by
Online
by the city has made it easier to start a new
85.6 71.3 79.3 83.9 STRUCTURES TECHNOLOGIES 66.3 64.7 64.6 35.4 74.4 73.9 60.2 82.3 28.7 67.2 61.5 All ratings range from AAA to D
4 71.3 GROUP CCC TECHNOLOGIES CCC FACTOR RATINGS CCC STRUCTURES 70.6 76.9 2020 67.2 +0.011 +0.5 +0.6 +0.0 51.3 81.8 79.5 53.2 74.3
109
60.0 1 yr change 6.5 6,090 6.6 6,951 2021 2022 0.644 67.7 12.6 12.0 2019 ▲ 110 in 2023 Out of 142 Out of 141 79.3 66.4 81.1 63.1 70.0 6.3 0.638 70.2 11.7 6.5 0.633 73.5 70.3 6,542 SMART CITY RANKING CC in 2023 72.2 60.4 42.9 65.6 78.4 72.6 70.2 78.7 SMART CITY RATING +408 6,554 0.638 70.9 11.4 54.9% 46.5% 44.8% 40.2% 37.6% 34.4% 33.9% 30.3% 29.0% 27.8% 27.5% 25.9% 16.4% 14.1% 13.3% 0% 20% 40% 60% 80% 100% air pollution road congestion affordable housing basic amenities (water, waste) corruption / transparency security fulfilling employment recycling health services Green spaces public transport unemployment social mobility / inclusiveness school education citizen engagement 78.5% 81.3% 80.4% 78.0% 0% 20% 40% 60% 80% 100% 0 20 40 60 80 100 0 20 40 60 80 100
Score
Priority Area Score GROUP MEAN CITY LEGEND: MIN GROUP MAX CITY MEAN LEGEND:
of
Berlin
% of respondents who chose the Priority Area

From a list of 15 indicators, survey respondents were asked to select 5 that they perceived as the most urgent for their city. The higher the percentage of responses per area, the greater the priority for the city.
% of respondents who agree or strongly agree with the statement
ATTITUDES
You are willing to concede personal data in order to improve traffic congestion
You are comfortable with face recognition technologies to lower crime
You feel the availability of online information has increased your trust in authorities
The proportion of your day-to-day payment transactions that are non-cash (% of transactions)
PRIORITY AREAS
City Population HDI
BACKGROUND INFORMATION
Map tiles by Stamen Design CC BY 3.0 Map Data © OpenStreetMap Country Germany HDI Life expectancy at birth Expected years of schooling Mean years of schooling GNI per capita (PPP $)
Basic sanitation meets the needs of the poorest areas Online reporting of city maintenance problems provides a speedy solution Recycling services are satisfactory A website or App allows residents to easily give away unwanted items Public safety is not a problem Free public wifi has improved access to city services Air pollution is not a problem CCTV cameras has made residents feel safer Medical services provision is satisfactory A website or App allows residents to effectively monitor air pollution Finding housing with rent equal to 30% or less of a monthly salary is not a problem Arranging medical appointments online has improved access Mobility Mobility Traffic congestion is not a problem Car-sharing Apps have reduced congestion Public transport is satisfactory Apps that direct you to an available parking space have reduced journey time Bicycle hiring has reduced congestion Online scheduling and ticket sales has made public transport easier to use The city provides information on traffic congestion through mobile phones Activities Activities Green spaces are satisfactory Online purchasing of tickets to shows and museums has made it easier to attend Cultural activities (shows, bars, and museums) are satisfactory Opportunities (Work & School) Opportunities (Work & School) Employment finding services are readily available Online access to job
Health & Safety Health & Safety
listings has made it easier to find work
IT
Businesses
creating new jobs The current
needs Minorities feel welcome Governance Governance Information on local government decisions are easily accessible Online public access to city finances has reduced corruption Corruption of city officials is not an issue of concern Online voting has increased participation Residents contribute to decision making of local government An online platform where residents can propose ideas has improved city life Residents provide feedback on local government projects Processing Identification Documents online has reduced waiting times (Eurostat) 3,670,000 0.959 (Global Data Lab)
Most children have access to a good school
skills are taught well in schools Lifelong learning opportunities are provided by local institutions Online services provided by the city has made it easier to start a new business
are
internet speed and reliability meet connectivity
72.6 53.7 67.0 58.2 STRUCTURES TECHNOLOGIES 37.0 61.1 44.7 35.6 43.3 63.9 36.8 55.9 34.6 39.8 44.4 All ratings range from AAA to D
1 60.5 GROUP BBB TECHNOLOGIES BBB FACTOR RATINGS BBB STRUCTURES 60.7 60.7 2020 80.6 +0.002 +0.4 +0.0 +0.0 39.5 58.8 74.7 24.3 59.7
37
48.7 1 yr change 14.3 53,375 14.3 55,340 2021 2022 0.950 81.0 17.3 17.3 2019
33 in 2023 Out of 142 Out of 141 67.2 49.8 50.7 42.8 43.1 14.2 0.948 81.1 17.2 14.3 0.948 54.2 66.5 55,057 SMART CITY RANKING BBB in 2023 49.4 34.6 46.7 53.6 52.5 42.7 56.6 43.2 SMART CITY RATING +284 55,685 0.951 81.6 17.2 79.1% 58.5% 40.9% 39.2% 35.6% 27.1% 25.0% 23.3% 21.8% 19.8% 18.3% 15.9% 15.4% 14.8% 11.5% 0% 20% 40% 60% 80% 100% affordable housing security road congestion unemployment school education air pollution health services public transport basic amenities (water, waste) Green spaces corruption / transparency recycling citizen engagement social mobility / inclusiveness fulfilling employment 55.6% 63.8% 48.2% 64.3% 0% 20% 40% 60% 80% 100% 0 20 40 60 80 100 0 20 40 60 80 100
▼
Score
Score GROUP MEAN CITY LEGEND: MIN GROUP MAX CITY MEAN LEGEND:
Bilbao
respondents who chose the

From a list of 15 indicators, survey respondents were asked to select 5 that they perceived as the most urgent for their city. The higher the percentage of responses per area, the greater the priority for the city.
% of respondents who agree or strongly agree with the statement
ATTITUDES
You are willing to concede personal data in order to improve traffic congestion
You are comfortable with face recognition technologies to lower crime
You feel the availability of online information has increased your trust in authorities
The proportion of your day-to-day payment transactions that are non-cash (% of transactions)
PRIORITY AREAS
City Population HDI
BACKGROUND INFORMATION
Map tiles by Stamen Design CC BY 3.0 Map Data © OpenStreetMap Country Spain HDI Life expectancy at birth Expected years of schooling Mean years of schooling GNI per capita (PPP $)
Basic sanitation meets the needs of the poorest areas Online reporting of city maintenance problems provides a speedy solution Recycling services are satisfactory A website or App allows residents to easily give away unwanted items Public safety is not a problem Free public wifi has improved access to city services Air pollution is not a problem CCTV cameras has made residents feel safer Medical services provision is satisfactory A website or App allows residents to effectively monitor air pollution Finding housing with rent equal to 30% or less of a monthly salary is not a problem Arranging medical appointments online has improved access Mobility Mobility Traffic congestion is not a problem Car-sharing Apps have reduced congestion Public transport is satisfactory Apps that direct you to an available parking space have reduced journey time Bicycle hiring has reduced congestion Online scheduling and ticket sales has made public transport easier to use The city provides information on traffic congestion through mobile phones Activities Activities Green spaces are satisfactory Online purchasing of tickets to shows and museums has made it easier to attend Cultural activities (shows, bars, and museums) are satisfactory Opportunities (Work & School) Opportunities (Work & School) Employment finding services are readily available Online access to job
IT
Businesses are creating new jobs The current
speed
reliability
connectivity needs Minorities feel welcome Governance Governance Information on local government decisions are easily accessible Online public access to city finances has reduced corruption Corruption of city officials is not an issue of concern Online voting has increased participation Residents contribute to decision making of local government An online platform where residents can propose ideas has improved city life Residents provide feedback on local government projects Processing Identification Documents online has reduced waiting times (Eurostat) 350,000 0.932 (Global Data Lab)
Health & Safety Health & Safety
listings has made it easier to find work Most children have access to a good school
skills are taught well in schools Lifelong learning opportunities are provided by local institutions Online services provided by the city has made it easier to start a new business
internet
and
meet
79.7 59.3 69.3 76.0 STRUCTURES TECHNOLOGIES 52.6 54.2 57.4 44.8 46.2 61.5 40.5 64.1 43.0 45.0 44.4 All ratings range from AAA to D
2 70.9 GROUP BBB TECHNOLOGIES BB FACTOR RATINGS BBB STRUCTURES 80.0 75.5 2020 83.0 +0.007 +0.9 +0.0 +0.0 55.9 52.9 84.1 23.1 80.6
29
56.9 1 yr change 10.6 36,076 10.6 40,043 2021 2022 0.911 83.9 17.8 17.8 2019 ▼ 27 in 2023 Out of 142 Out of 141 64.2 54.1 64.2 49.4 52.8 10.4 0.894 82.3 17.5 10.6 0.904 63.3 75.2 38,133 SMART CITY RANKING BBB in 2023 59.3 38.6 46.7 45.1 72.6 58.1 75.5 47.5 SMART CITY RATING +1,911 40,854 0.904 83.5 17.5 72.1% 67.9% 47.9% 46.6% 45.5% 23.1% 22.0% 21.7% 18.9% 18.5% 17.7% 16.3% 13.1% 13.1% 12.4% 0% 20% 40% 60% 80% 100% affordable housing fulfilling employment unemployment security health services citizen engagement corruption / transparency school education public transport road congestion Green spaces social mobility / inclusiveness recycling air pollution basic amenities (water, waste) 57.3% 66.8% 57.5% 63.7% 0% 20% 40% 60% 80% 100% 0 20 40 60 80 100 0 20 40 60 80 100
Score
of
Priority Area Score GROUP MEAN CITY LEGEND: MIN GROUP MAX CITY MEAN LEGEND:
%
respondents who chose the Priority Area

From a list of 15 indicators, survey respondents were asked to select 5 that they perceived as the most urgent for their city. The higher the percentage of responses per area, the greater the priority for the city.
% of respondents who agree or strongly agree with the statement
ATTITUDES
You are willing to concede personal data in order to improve traffic congestion
You are comfortable with face recognition technologies to lower crime
You feel the availability of online information has increased your trust in authorities
The proportion of your day-to-day payment transactions that are non-cash (% of transactions)
PRIORITY AREAS
City Population HDI
BACKGROUND INFORMATION
Map tiles by Stamen Design CC BY 3.0 Map Data © OpenStreetMap Country United Kingdom HDI Life expectancy at birth Expected years of schooling Mean years of schooling GNI per capita (PPP $)
Basic sanitation meets the needs of the poorest areas Online reporting of city maintenance problems provides a speedy solution Recycling services are satisfactory A website or App allows residents to easily give away unwanted items Public safety is not a problem Free public wifi has improved access to city services Air pollution is not a problem CCTV cameras has made residents feel safer Medical services provision is satisfactory A website or App allows residents to effectively monitor air pollution Finding housing with rent equal to 30% or less of a monthly salary is not a problem Arranging medical appointments online has improved access Mobility Mobility Traffic congestion is not a problem Car-sharing Apps have reduced congestion Public transport is satisfactory Apps that direct you to an available parking space have reduced journey time Bicycle hiring has reduced congestion Online scheduling and ticket sales has made public transport easier to use The city provides information on traffic congestion through mobile phones Activities Activities Green spaces are satisfactory Online purchasing of tickets to shows and museums has made it easier to attend Cultural activities (shows, bars, and museums) are satisfactory Opportunities (Work & School) Opportunities (Work & School) Employment finding services are readily available Online access to
work
good school IT skills
schools Lifelong learning opportunities are provided
institutions
services provided
city
business Businesses are creating new jobs The current internet speed and reliability meet connectivity needs Minorities feel welcome Governance Governance Information on local government decisions are easily accessible Online public access to city finances has reduced corruption Corruption of city officials is not an issue of concern Online voting has increased participation Residents contribute to decision making of local government An online platform where residents can propose ideas has improved city life Residents provide feedback on local government projects Processing Identification Documents online has reduced waiting times (Eurostat) 1,140,000 0.913 (Global Data Lab)
Health & Safety Health & Safety
job listings has made it easier to find
Most children have access to a
are taught well in
by local
Online
by the
has made it easier to start a new
72.3 51.2 60.3 62.9 STRUCTURES TECHNOLOGIES 43.3 60.3 50.5 34.2 57.8 51.1 37.9 50.1 27.5 41.9 46.8 All ratings range from AAA to D 83 2 55.4 GROUP BB TECHNOLOGIES BB FACTOR RATINGS BB STRUCTURES 48.9 59.2 2020 80.7 +0.009 +1.4 +0.0 +0.0 34.3 57.1 71.1 32.1 57.8
58.2 1 yr change 13.4 40,799 13.4 46,624 2021 2022 0.940 82.2 17.6 17.6 2019
74 in 2023 Out of 142 Out of 141 64.5 51.6 55.4 44.4 45.1 13.3 0.920 80.4 17.2 13.4 0.931 61.6 61.9 44,750 SMART CITY RANKING BB in 2023 54.8 45.0 40.6 56.9 57.2 60.0 54.4 49.3 SMART CITY RATING +1,874 47,066 0.933 81.7 17.2 72.4% 51.8% 47.6% 43.1% 41.1% 31.5% 30.2% 24.6% 21.6% 21.6% 20.3% 19.5% 13.6% 13.4% 6.6% 0% 20% 40% 60% 80% 100% affordable housing health services security road congestion unemployment fulfilling employment air pollution recycling Green spaces basic amenities (water, waste) public transport school education social mobility / inclusiveness corruption / transparency citizen engagement 58.5% 71.0% 51.2% 73.1% 0% 20% 40% 60% 80% 100% 0 20 40 60 80 100 0 20 40 60 80 100
Score %
Score GROUP MEAN CITY LEGEND: MIN GROUP MAX CITY MEAN LEGEND:
Birmingham
▼
of
Bogota
chose

From a list of 15 indicators, survey respondents were asked to select 5 that they perceived as the most urgent for their city. The higher the percentage of responses per area, the greater the priority for the city.
respondents who agree or strongly agree with the statement
ATTITUDES
You are willing to concede personal data in order to improve traffic congestion
You are comfortable with face recognition technologies to lower crime
You feel the availability of online information has increased your trust in authorities
The proportion of your day-to-day payment transactions that are non-cash (% of transactions)
PRIORITY AREAS
City Population HDI
BACKGROUND INFORMATION
Map tiles by Stamen Design CC BY 3.0 Map Data © OpenStreetMap Country Colombia HDI Life expectancy at birth Expected years of schooling Mean years of schooling GNI per capita (PPP $)
Basic sanitation meets the needs of the poorest areas Online reporting of city maintenance problems provides a speedy solution Recycling services are satisfactory A website or App allows residents to easily give away unwanted items Public safety is not a problem Free public wifi has improved access to city services Air pollution is not a problem CCTV cameras has made residents feel safer Medical services provision is satisfactory A website or App allows residents to effectively monitor air pollution Finding housing with rent equal to 30% or less of a monthly salary is not a problem Arranging medical appointments online has improved access Mobility Mobility Traffic congestion is not a problem Car-sharing Apps have reduced congestion Public transport is satisfactory Apps that direct you to an available parking space have reduced journey time Bicycle hiring has reduced congestion Online scheduling and ticket sales has made public transport easier to use The city provides information on traffic congestion through mobile phones Activities Activities Green spaces are satisfactory Online purchasing of tickets to shows and museums has made it easier to attend Cultural activities (shows, bars, and museums) are satisfactory Opportunities (Work & School) Opportunities (Work & School) Employment finding services are readily available Online access to job
work
Health & Safety Health & Safety
listings has made it easier to find
IT
Lifelong learning
provided
institutions
business Businesses are creating new jobs The current internet speed and reliability meet connectivity needs Minorities feel welcome Governance Governance Information on local government decisions are easily accessible Online public access to city finances has reduced corruption Corruption of city officials is not an issue of concern Online voting has increased participation Residents contribute to decision making of local government An online platform where residents can propose ideas has improved city life Residents provide feedback on local government projects Processing Identification Documents online has reduced waiting times (UN Data) 7,180,000 0.797 (Global Data Lab)
Most children have access to a good school
skills are taught well in schools
opportunities are
by local
Online services provided by the city has made it easier to start a new
76.4 58.7 48.8 59.2 STRUCTURES TECHNOLOGIES 38.3 43.5 46.5 15.7 43.5 39.3 45.7 59.5 16.1 36.4 39.4 All ratings range from AAA to D 127 4 37.9 GROUP D TECHNOLOGIES D FACTOR RATINGS D STRUCTURES 22.9 57.1 2020 72.8 +0.006 +0.8 +0.0 +0.0 18.4 40.4 74.6 29.9 66.0
52.0 1 yr change 8.9 13,220 8.9 15,014 2021 2022 0.758 73.7 14.4 14.4 2019 ▲ 129 in 2023 Out of 142 Out of 141 60.4 34.4 61.1 25.6 35.8 8.6 0.756 74.8 14.4 8.9 0.752 36.7 46.2 14,403 SMART CITY RANKING D in 2023 42.9 24.4 16.2 34.0 41.0 47.3 46.1 49.3 SMART CITY RATING +611 14,294 0.768 76.8 14.5 85.3% 48.9% 45.4% 43.0% 42.3% 38.2% 37.7% 34.0% 28.9% 23.4% 17.6% 15.2% 13.8% 9.0% 4.7% 0% 20% 40% 60% 80% 100% security corruption / transparency health services public transport road congestion unemployment air pollution fulfilling employment affordable housing basic amenities (water, waste) social mobility / inclusiveness recycling school education Green spaces citizen engagement 67.6% 73.8% 51.5% 59.8% 0% 20% 40% 60% 80% 100% 0 20 40 60 80 100 0 20 40 60 80 100
Score % of
Score GROUP MEAN CITY LEGEND: MIN GROUP MAX CITY MEAN LEGEND:
% of
respondents who
the Priority Area
Bologna
respondents who chose the Priority Area

From a list of 15 indicators, survey respondents were asked to select 5 that they perceived as the most urgent for their city. The higher the percentage of responses per area, the greater the priority for the city.
% of respondents who agree or strongly agree with the statement
ATTITUDES
You are willing to concede personal data in order to improve traffic congestion
You are comfortable with face recognition technologies to lower crime
You feel the availability of online information has increased your trust in authorities
The proportion of your day-to-day payment transactions that are non-cash (% of transactions)
PRIORITY AREAS
City Population HDI
BACKGROUND INFORMATION
Map tiles by Stamen Design CC BY 3.0 Map Data © OpenStreetMap
Italy HDI Life expectancy at birth Expected years of schooling Mean years of schooling GNI per capita (PPP $)
Country
sanitation meets the needs of the poorest areas
reporting of city maintenance problems provides a speedy solution Recycling services are satisfactory A website or App allows residents to easily give away unwanted items Public safety is not a problem Free public wifi has improved access to city services Air pollution is not a problem CCTV cameras has made residents feel safer Medical services provision is satisfactory A website or App allows residents to effectively monitor air pollution Finding housing with rent equal to 30% or less of a monthly salary is not a problem Arranging medical appointments online has improved access Mobility Mobility Traffic congestion is not a problem Car-sharing Apps have reduced congestion Public transport is satisfactory Apps that direct you to an available parking space have reduced journey time Bicycle hiring has reduced congestion Online scheduling and ticket sales has made public transport easier to use The city provides information on traffic congestion through mobile phones Activities Activities Green spaces are satisfactory Online purchasing of tickets to shows and museums has made it easier to attend Cultural activities (shows, bars, and museums) are satisfactory Opportunities (Work & School) Opportunities (Work & School) Employment finding services are readily available Online access to job
Health & Safety Health & Safety Basic
Online
listings has made it easier to find work
IT
Businesses are creating new jobs The current
speed and reliability meet connectivity needs Minorities feel welcome Governance Governance Information on local government decisions are easily accessible Online public access to city finances has reduced corruption Corruption of city officials is not an issue of concern Online voting has increased participation Residents contribute to decision making of local government An online platform where residents can propose ideas has improved city life Residents provide feedback on local government projects Processing Identification Documents online has reduced waiting times (Eurostat) 400,000 0.924 (Global Data Lab)
Most children have access to a good school
skills are taught well in schools Lifelong learning opportunities are provided by local institutions Online services provided by the city has made it easier to start a new business
internet
82.6 46.1 65.4 55.3 STRUCTURES TECHNOLOGIES 50.5 54.5 46.6 22.1 50.8 64.3 47.0 71.4 22.7 34.1 38.9 All ratings range from AAA to D
2 64.9 GROUP BB TECHNOLOGIES B FACTOR RATINGS BB STRUCTURES 52.9 38.9 2020 82.9 +0.007 +1.2 +0.0 +0.0 35.6 45.9 75.8 62.2 66.3
78
49.2 1 yr change 10.7 39,587 10.7 44,284 2021 2022 0.906 84.1 16.7 16.7 2019
51 in 2023 Out of 142 Out of 141 64.4 47.8 59.1 39.0 45.3 10.7 0.892 82.4 16.5 10.7 0.899 51.9 64.0 42,856 SMART CITY RANKING BB in 2023 53.0 39.9 40.6 40.6 62.7 45.6 58.8 45.2 SMART CITY RATING +1,428 43,102 0.899 83.6 16.4 60.0% 58.4% 57.0% 53.9% 40.4% 35.4% 28.1% 21.3% 17.7% 17.5% 17.4% 16.0% 15.6% 15.0% 12.0% 0% 20% 40% 60% 80% 100% affordable housing security air pollution road congestion fulfilling employment unemployment public transport recycling social mobility / inclusiveness Green spaces health services corruption / transparency basic amenities (water, waste) citizen engagement school education 58.6% 63.8% 48.3% 61.3% 0% 20% 40% 60% 80% 100% 0 20 40 60 80 100 0 20 40 60 80 100
Score
Score GROUP MEAN CITY LEGEND: MIN GROUP MAX CITY MEAN LEGEND:
▼
% of
% of respondents who chose the Priority Area

From a list of 15 indicators, survey respondents were asked to select 5 that they perceived as the most urgent for their city. The higher the percentage of responses per area, the greater the priority for the city.
% of respondents who agree or strongly agree with the statement
ATTITUDES
You are willing to concede personal data in order to improve traffic congestion
You are comfortable with face recognition technologies to lower crime
You feel the availability of online information has increased your trust in authorities
The proportion of your day-to-day payment transactions that are non-cash
(% of transactions)
PRIORITY AREAS
City Population HDI
BACKGROUND INFORMATION
Map tiles by Stamen Design CC BY 3.0 Map Data © OpenStreetMap Country France HDI Life expectancy at birth Expected years of schooling Mean years of schooling GNI per capita (PPP $)
Basic sanitation meets the needs of the poorest areas Online reporting of city maintenance problems provides a speedy solution Recycling services are satisfactory A website or App allows residents to easily give away unwanted items Public safety is not a problem Free public wifi has improved access to city services Air pollution is not a problem CCTV cameras has made residents feel safer Medical services provision is satisfactory A website or App allows residents to effectively monitor air pollution Finding housing with rent equal to 30% or less of a monthly salary is not a problem Arranging medical appointments online has improved access Mobility Mobility Traffic congestion is not a problem Car-sharing Apps have reduced congestion Public transport is satisfactory Apps that direct you to an available parking space have reduced journey time Bicycle hiring has reduced congestion Online scheduling and ticket sales has made public transport easier to use The city provides information on traffic congestion through mobile phones Activities Activities Green spaces are satisfactory Online purchasing of tickets to shows and museums has made it easier to attend Cultural activities (shows, bars, and museums) are satisfactory Opportunities (Work & School) Opportunities (Work & School) Employment finding services are readily available Online access to job
work
Health & Safety Health & Safety
listings has made it easier to find
IT
Businesses are creating new jobs The current
speed and reliability meet connectivity needs Minorities feel welcome Governance Governance Information on local government decisions are easily accessible Online public access to city finances has reduced corruption Corruption of city officials is not an issue of concern Online voting has increased participation Residents contribute to decision making of local government An online platform where residents can propose ideas has improved city life Residents provide feedback on local government projects Processing Identification Documents online has reduced waiting times (Eurostat) 650,000 0.900 (Global Data Lab)
Most children have access to a good school
skills are taught well in schools Lifelong learning opportunities are provided by local institutions Online services provided by the city has made it easier to start a new business
internet
77.6 58.2 69.7 70.1 STRUCTURES TECHNOLOGIES 49.2 56.1 59.6 31.0 54.5 63.5 48.1 70.7 24.4 44.4 48.0 All ratings range from AAA to D 70 3 58.4 GROUP CCC TECHNOLOGIES CC FACTOR RATINGS CCC STRUCTURES 63.2 63.3 2020 82.5 +0.004 +0.7 +0.0 +0.0 44.8 60.5 85.5 26.3 82.4
60.2 1 yr change 11.7 42,891 11.7 47,379 2021 2022 0.910 83.2 16.0 16.0 2019 ▲ 78 in 2023 Out of 142 Out of 141 63.6 54.3 58.5 47.2 53.2 11.6 0.900 82.2 15.9 11.7 0.906 55.0 65.3 46,322 SMART CITY RANKING CCC in 2023 60.6 43.4 48.7 51.6 71.4 59.8 64.3 51.5 SMART CITY RATING +1,057 46,907 0.905 82.7 15.9 72.0% 61.2% 50.1% 44.6% 31.6% 29.5% 23.5% 20.7% 18.8% 18.1% 16.3% 15.1% 13.8% 13.4% 11.7% 0% 20% 40% 60% 80% 100% affordable housing road congestion security air pollution unemployment health services recycling public transport basic amenities (water, waste) fulfilling employment school education corruption / transparency Green spaces citizen engagement social mobility / inclusiveness 56.7% 67.8% 53.9% 67.3% 0% 20% 40% 60% 80% 100% 0 20 40 60 80 100 0 20 40 60 80 100
Bordeaux
Score
Score GROUP MEAN CITY LEGEND: MIN GROUP MAX CITY MEAN LEGEND:
Boston
of respondents who chose the Priority Area

From a list of 15 indicators, survey respondents were asked to select 5 that they perceived as the most urgent for their city. The higher the percentage of responses per area, the greater the priority for the city.
% of respondents who agree or strongly agree with the statement
ATTITUDES
You are willing to concede personal data in order to improve traffic congestion
You are comfortable with face recognition technologies to lower crime
You feel the availability of online information has increased your trust in authorities
The proportion of your day-to-day payment transactions that are non-cash (% of transactions)
PRIORITY AREAS
City Population HDI
BACKGROUND INFORMATION
Map tiles by Stamen Design CC BY 3.0 Map Data © OpenStreetMap Country USA HDI Life expectancy at birth Expected years of schooling Mean years of schooling GNI per capita (PPP $)
Safety
Basic sanitation meets the needs of the poorest areas Online reporting of city maintenance problems provides a speedy solution Recycling services are satisfactory A website or App allows residents to easily give away unwanted items Public safety is not a problem Free public wifi has improved access to city services Air pollution is not a problem CCTV cameras has made residents feel safer Medical services provision is satisfactory A website or App allows residents to effectively monitor air pollution Finding housing with rent equal to 30% or less of a monthly salary is not a problem Arranging medical appointments online has improved access Mobility Mobility Traffic congestion is not a problem Car-sharing Apps have reduced congestion Public transport is satisfactory Apps that direct you to an available parking space have reduced journey time Bicycle hiring has reduced congestion Online scheduling and ticket sales has made public transport easier to use The city provides information on traffic congestion through mobile phones Activities Activities Green spaces are satisfactory Online purchasing of tickets to shows and museums has made it easier to attend Cultural activities (shows, bars, and museums) are satisfactory Opportunities (Work & School) Opportunities (Work & School) Employment finding services are readily available Online access to job
work
children
good school IT skills
taught
in schools Lifelong learning opportunities are provided by local institutions Online services provided by the city
easier
business Businesses are creating new jobs The current internet speed and reliability meet connectivity needs Minorities feel welcome Governance Governance Information on local government decisions are easily accessible Online public access to city finances has reduced corruption Corruption of city officials is not an issue of concern Online voting has increased participation Residents contribute to decision making of local government An online platform where residents can propose ideas has improved city life Residents provide feedback on local government projects Processing Identification Documents online has reduced waiting times (UN Data) 680,000 0.949 (Global Data Lab)
Health &
Health & Safety
listings has made it easier to find
Most
have access to a
are
well
has made it
to start a new
76.3 55.1 54.3 65.4 STRUCTURES TECHNOLOGIES 40.6 57.7 43.0 45.7 45.7 72.2 34.4 62.8 17.9 40.0 44.7 All ratings range from AAA to D
1 57.3 GROUP BBB TECHNOLOGIES A FACTOR RATINGS BBB STRUCTURES 40.6 67.7 2020 77.2 +0.006 +1.0 +0.0 +0.0 40.7 67.3 81.1 26.4 67.5
36
52.1 1 yr change 13.7 61,077 13.6 65,565 2021 2022 0.927 78.2 16.4 16.4 2019
34 in 2023 Out of 142 Out of 141 68.5 63.7 54.0 51.7 44.3 13.6 0.923 77.4 16.6 13.6 0.921 61.5 66.7 64,484 SMART CITY RANKING A in 2023 67.7 37.6 40.0 52.0 58.5 51.5 66.9 48.0 SMART CITY RATING +1,081 63,654 0.933 79.1 16.6 81.8% 59.0% 44.3% 43.9% 30.6% 30.5% 28.4% 25.5% 25.4% 21.9% 16.1% 14.5% 14.0% 13.3% 9.7% 0% 20% 40% 60% 80% 100% affordable housing road congestion public transport security unemployment school education health services fulfilling employment corruption / transparency air pollution basic amenities (water, waste) social mobility / inclusiveness recycling Green spaces citizen engagement 47.0% 55.1% 45.7% 73.7% 0% 20% 40% 60% 80% 100% 0 20 40 60 80 100 0 20 40 60 80 100
Score
Score GROUP MEAN CITY LEGEND: MIN GROUP MAX CITY MEAN LEGEND:
▼
%
Brasilia
% of respondents who chose the Priority Area

From a list of 15 indicators, survey respondents were asked to select 5 that they perceived as the most urgent for their city. The higher the percentage of responses per area, the greater the priority for the city.
% of respondents who agree or strongly agree with the statement
ATTITUDES
You are willing to concede personal data in order to improve traffic congestion
You are comfortable with face recognition technologies to lower crime
You feel the availability of online information has increased your trust in authorities
The proportion of your day-to-day payment transactions that are non-cash (% of transactions)
listings has made it easier to find work
Most children have access to a good school IT skills are taught well in schools
Lifelong learning opportunities are provided by local institutions
Online services provided by the city has made it easier to start a new business Businesses are creating new jobs The current internet speed and reliability meet connectivity needs
PRIORITY AREAS
City Population HDI
BACKGROUND INFORMATION
Map tiles by Stamen Design CC BY 3.0 Map Data © OpenStreetMap Country Brazil HDI Life expectancy at birth Expected years of schooling Mean years of schooling GNI per capita (PPP $)
sanitation meets the needs of the poorest areas
reporting of city maintenance problems provides a speedy solution Recycling services are satisfactory A website or App allows residents to easily give away unwanted items Public safety is not a problem Free public wifi has improved access to city services Air pollution is not a problem CCTV cameras has made residents feel safer Medical services provision is satisfactory A website or App allows residents to effectively monitor air pollution Finding housing with rent equal to 30% or less of a monthly salary is not a problem Arranging medical appointments online has improved access Mobility Mobility Traffic congestion is not a problem Car-sharing Apps have reduced congestion Public transport is satisfactory
that direct you to an available parking space have reduced journey time Bicycle hiring has reduced congestion Online scheduling and ticket sales has made public transport easier to use The city provides information on traffic congestion through mobile phones Activities Activities Green spaces are satisfactory Online purchasing of tickets to shows and museums has made it easier to attend Cultural activities (shows, bars, and museums) are satisfactory Opportunities (Work & School) Opportunities (Work & School) Employment finding services are readily available Online access to job
Health & Safety Health & Safety Basic
Online
Apps
Minorities feel welcome Governance Governance Information on local government decisions are easily accessible Online public access to city finances has reduced corruption Corruption of city officials is not an issue of concern Online voting has increased participation Residents contribute to decision making of local government An online platform where residents can propose ideas has improved city life Residents provide feedback on local government projects Processing Identification Documents online has reduced waiting times (UN World Urbanization Prospects) 4,800,000 0.816 (Global Data Lab)
75.3 47.9 46.4 58.5 STRUCTURES TECHNOLOGIES 35.0 35.8 37.5 40.2 42.9 31.1 22.8 35.5 25.8 38.5 40.1 All ratings range from AAA to D 130 3 49.1 GROUP C TECHNOLOGIES C FACTOR RATINGS C STRUCTURES 22.7 49.8 2020 72.8 +0.004 +0.7 +0.0 +0.0 30.9 46.0 69.7 20.9 74.7
33.2 1 yr change 8.3 13,815 8.3 14,616 2021 2022 0.760 73.4 15.6 15.6 2019 ▼ 128 in 2023 Out of 142 Out of 141 56.7 32.4 58.4 25.4 38.6 8.1 0.758 74.0 15.4 8.3 0.756 28.3 54.2 14,342 SMART CITY RANKING C in 2023 43.3 26.0 20.6 42.8 43.1 25.7 51.7 49.5 SMART CITY RATING +274 14,291 0.764 75.3 15.4 79.0% 72.6% 59.0% 46.3% 44.8% 29.7% 26.2% 26.0% 21.7% 21.5% 19.0% 10.9% 10.6% 9.1% 6.7% 0% 20% 40% 60% 80% 100% health services security public transport unemployment school education corruption / transparency affordable housing fulfilling employment road congestion social mobility / inclusiveness basic amenities (water, waste) recycling Green spaces air pollution citizen engagement 67.7% 76.6% 47.7% 67.3% 0% 20% 40% 60% 80% 100% 0 20 40 60 80 100 0 20 40 60 80 100
Score
Score GROUP MEAN CITY LEGEND: MIN GROUP MAX CITY MEAN LEGEND:
Bratislava
respondents who chose the Priority

From a list of 15 indicators, survey respondents were asked to select 5 that they perceived as the most urgent for their city. The higher the percentage of responses per area, the greater the priority for the city.
% of respondents who agree or strongly agree with the statement
ATTITUDES
You are willing to concede personal data in order to improve traffic congestion
You are comfortable with face recognition technologies to lower crime
You feel the availability of online information has increased your trust in authorities
The proportion of your day-to-day payment transactions that are non-cash (% of transactions)
PRIORITY AREAS
City Population HDI
BACKGROUND INFORMATION
Map tiles by Stamen Design CC BY 3.0 Map Data © OpenStreetMap Country Slovakia HDI Life expectancy at birth Expected years of schooling Mean years of schooling GNI per capita (PPP $)
sanitation meets the needs of the poorest areas
reporting of city maintenance problems provides a speedy solution Recycling services are satisfactory A website or App allows residents to easily give away unwanted items Public safety is not a problem Free public wifi has improved access to city services Air pollution is not a problem CCTV cameras has made residents feel safer Medical services provision is satisfactory A website or App allows residents to effectively monitor air pollution Finding housing with rent equal to 30% or less of a monthly salary is not a problem Arranging medical appointments online has improved access Mobility Mobility Traffic congestion is not a problem Car-sharing Apps have reduced congestion Public transport is satisfactory Apps that direct you to an available parking space have reduced journey time Bicycle hiring has reduced congestion Online scheduling and ticket sales has made public transport easier to use The city provides information on traffic congestion through mobile phones Activities Activities Green spaces are satisfactory Online purchasing of tickets to shows and museums has made it easier to attend Cultural activities (shows, bars, and museums) are satisfactory Opportunities (Work & School) Opportunities (Work & School) Employment finding services are readily available Online access to job
work
IT
institutions
Businesses are creating new jobs The current
speed and reliability meet connectivity needs Minorities feel welcome Governance Governance Information on local government decisions are easily accessible Online public access to city finances has reduced corruption Corruption of city officials is not an issue of concern Online voting has increased participation Residents contribute to decision making of local government An online platform where residents can propose ideas has improved city life Residents provide feedback on local government projects Processing Identification Documents online has reduced waiting times (Eurostat) 440,000 0.944 (Global Data Lab)
Health & Safety Health & Safety Basic
Online
listings has made it easier to find
Most children have access to a good school
skills are taught well in schools Lifelong learning opportunities are provided by local
Online services provided by the city has made it easier to start a new business
internet
74.6 45.2 67.7 67.8 STRUCTURES TECHNOLOGIES 45.8 54.2 51.1 38.9 54.3 44.2 43.6 61.3 28.5 39.9 44.1 All ratings range from AAA to D
1 56.0 GROUP BBB TECHNOLOGIES A FACTOR RATINGS BB STRUCTURES 48.8 63.9 2020 74.9 +0.003 +0.4 +0.0 +0.0 55.6 63.1 66.1 29.3 41.6
56
57.7 1 yr change 13.0 30,589 13.0 32,171 2021 2022 0.855 75.3 14.7 14.7 2019 ▲ 62 in 2023 Out of 142 Out of 141 68.4 50.2 55.7 45.2 45.8 12.9 0.860 77.0 14.6 13.0 0.852 48.4 57.3 31,553 SMART CITY RANKING BB in 2023 59.7 37.3 35.5 45.8 62.9 53.5 61.6 44.0 SMART CITY RATING +618 31,292 0.863 77.7 14.5 67.0% 55.4% 44.8% 42.0% 41.6% 31.4% 28.5% 25.9% 25.6% 22.1% 21.0% 18.6% 17.9% 11.0% 10.7% 0% 20% 40% 60% 80% 100% affordable housing health services road congestion security Green spaces corruption / transparency public transport air pollution school education recycling fulfilling employment basic amenities (water, waste) unemployment citizen engagement social mobility / inclusiveness 61.4% 72.0% 54.1% 71.4% 0% 20% 40% 60% 80% 100% 0 20 40 60 80 100 0 20 40 60 80 100
Score % of
Score GROUP MEAN CITY LEGEND: MIN GROUP MAX CITY MEAN LEGEND:
Area
Brisbane
% of respondents who chose the Priority Area

From a list of 15 indicators, survey respondents were asked to select 5 that they perceived as the most urgent for their city. The higher the percentage of responses per area, the greater the priority for the city.
% of respondents who agree or strongly agree with the statement
ATTITUDES
You are willing to concede personal data in order to improve traffic congestion
You are comfortable with face recognition technologies to lower crime
You feel the availability of online information has increased your trust in authorities
The proportion of your day-to-day payment transactions that are non-cash (% of transactions)
PRIORITY AREAS
City Population HDI
BACKGROUND INFORMATION
Map tiles by Stamen Design CC BY 3.0 Map Data © OpenStreetMap Country Australia HDI Life expectancy at birth Expected years of schooling Mean years of schooling GNI per capita (PPP $)
Basic sanitation meets the needs of the poorest areas Online reporting of city maintenance problems provides a speedy solution Recycling services are satisfactory A website or App allows residents to easily give away unwanted items Public safety is not a problem Free public wifi has improved access to city services Air pollution is not a problem CCTV cameras has made residents feel safer Medical services provision is satisfactory A website or App allows residents to effectively monitor air pollution Finding housing with rent equal to 30% or less of a monthly salary is not a problem Arranging medical appointments online has improved access Mobility Mobility Traffic congestion is not a problem Car-sharing Apps have reduced congestion Public transport is satisfactory Apps that direct you to an available parking space have reduced journey time Bicycle hiring has reduced congestion Online scheduling and ticket sales has made public transport easier to use The city provides information on traffic congestion through mobile phones Activities Activities Green spaces are satisfactory Online purchasing of tickets to shows and museums has made it easier to attend Cultural activities (shows, bars, and museums) are satisfactory Opportunities (Work & School) Opportunities (Work & School) Employment finding services are readily available Online access to job
Health & Safety Health & Safety
listings has made it easier to find work
IT
Businesses are creating new jobs The current
needs Minorities feel welcome Governance Governance Information on local government decisions are easily accessible Online public access to city finances has reduced corruption Corruption of city officials is not an issue of concern Online voting has increased participation Residents contribute to decision making of local government An online platform where residents can propose ideas has improved city life Residents provide feedback on local government projects Processing Identification Documents online has reduced waiting times (UN Data) 2,050,000 0.944 (Global Data Lab)
Most children have access to a good school
skills are taught well in schools Lifelong learning opportunities are provided by local institutions Online services provided by the city has made it easier to start a new business
internet speed and reliability meet connectivity
73.5 56.2 59.8 62.4 STRUCTURES TECHNOLOGIES 52.0 60.0 42.8 53.5 57.7 63.4 32.9 72.9 22.9 35.6 39.8 All ratings range from AAA to D
1 70.9 GROUP A TECHNOLOGIES A FACTOR RATINGS A STRUCTURES 55.1 68.7 2020 84.5 -0.003 -0.9 +0.0 +0.0 46.1 61.0 76.1 21.0 66.5
30
62.7 1 yr change 12.7 48,075 12.7 49,257 2021 2022 0.946 83.6 21.1 21.1 2019
24 in 2023 Out of 142 Out of 141 70.4 62.5 61.9 49.2 45.0 12.7 0.948 84.3 20.9 12.7 0.949 63.3 72.4 48,076 SMART CITY RANKING AA in 2023 57.1 36.9 45.6 47.7 74.5 54.5 68.5 48.2 SMART CITY RATING +1,181 47,054 0.941 83.1 21.4 84.7% 59.6% 52.7% 43.2% 41.1% 33.0% 29.2% 19.5% 18.6% 18.3% 18.0% 15.4% 14.3% 11.3% 9.8% 0% 20% 40% 60% 80% 100% affordable housing road congestion health services security unemployment public transport fulfilling employment school education basic amenities (water, waste) recycling corruption / transparency social mobility / inclusiveness air pollution Green spaces citizen engagement 57.1% 69.3% 51.1% 76.5% 0% 20% 40% 60% 80% 100% 0 20 40 60 80 100 0 20 40 60 80 100
▼
Score
Score GROUP MEAN CITY LEGEND: MIN GROUP MAX CITY MEAN LEGEND:
of respondents who chose the Priority Area

From a list of 15 indicators, survey respondents were asked to select 5 that they perceived as the most urgent for their city. The higher the percentage of responses per area, the greater the priority for the city.
% of respondents who agree or strongly agree with the statement
ATTITUDES
You are willing to concede personal data in order to improve traffic congestion
You are comfortable with face recognition technologies to lower crime
You feel the availability of online information has increased your trust in authorities
The proportion of your day-to-day payment transactions that are non-cash (% of transactions)
PRIORITY AREAS
City Population HDI
BACKGROUND INFORMATION
Map tiles by Stamen Design CC BY 3.0 Map Data © OpenStreetMap Country Belgium HDI Life expectancy at birth Expected years of schooling Mean years of schooling GNI per capita (PPP $)
Basic sanitation meets the needs of the poorest areas Online reporting of city maintenance problems provides a speedy solution Recycling services are satisfactory A website or App allows residents to easily give away unwanted items Public safety is not a problem Free public wifi has improved access to city services Air pollution is not a problem CCTV cameras has made residents feel safer Medical services provision is satisfactory A website or App allows residents to effectively monitor air pollution Finding housing with rent equal to 30% or less of a monthly salary is not a problem Arranging medical appointments online has improved access Mobility Mobility Traffic congestion is not a problem Car-sharing Apps have reduced congestion Public transport is satisfactory Apps that direct you to an available parking space have reduced journey time Bicycle hiring has reduced congestion Online scheduling and ticket sales has made public transport easier to use The city provides information on traffic congestion through mobile phones Activities Activities Green spaces are satisfactory Online purchasing of tickets to shows and museums has made it easier to attend Cultural activities (shows, bars, and museums) are satisfactory Opportunities (Work & School) Opportunities (Work & School) Employment finding services are readily available Online access to job
work
IT
Lifelong learning opportunities
provided
institutions
business Businesses are creating new jobs The current internet speed and reliability meet connectivity needs Minorities feel welcome Governance Governance Information on local government decisions are easily accessible Online public access to city finances has reduced corruption Corruption of city officials is not an issue of concern Online voting has increased participation Residents contribute to decision making of local government An online platform where residents can propose ideas has improved city life Residents provide feedback on local government projects Processing Identification Documents online has reduced waiting times (Eurostat) 1,230,000 0.953 (Global Data Lab)
Health & Safety Health & Safety
listings has made it easier to find
Most children have access to a good school
skills are taught well in schools
are
by local
Online services provided by the city has made it easier to start a new
74.4 51.6 61.3 65.7 STRUCTURES TECHNOLOGIES 46.5 59.8 50.6 29.9 48.5 65.7 47.9 59.4 28.2 37.8 43.5 All ratings range from AAA to D 40 1 54.0 GROUP BBB TECHNOLOGIES A FACTOR RATINGS BB STRUCTURES 53.7 63.9 2020 81.9 +0.004 +0.4 +0.0 +0.0 39.1 50.7 74.0 28.1 67.3
51.8 1 yr change 12.5 49,491 12.5 53,644 2021 2022 0.942 82.3 18.9 18.9 2019 ▼ 35 in 2023 Out of 142 Out of 141 59.2 48.2 63.0 37.5 48.3 12.4 0.930 80.8 19.3 12.5 0.938 50.6 61.0 52,299 SMART CITY RANKING BBB in 2023 54.8 40.1 40.5 47.9 54.6 54.7 62.1 50.0 SMART CITY RATING +1,345 52,490 0.936 81.8 19.6 63.4% 57.5% 45.5% 35.4% 34.8% 30.8% 29.0% 27.1% 26.1% 20.7% 20.2% 19.3% 16.9% 16.8% 13.8% 0% 20% 40% 60% 80% 100% affordable housing security road congestion air pollution unemployment public transport health services corruption / transparency school education Green spaces fulfilling employment basic amenities (water, waste) recycling social mobility / inclusiveness citizen engagement 52.6% 55.8% 52.8% 67.6% 0% 20% 40% 60% 80% 100% 0 20 40 60 80 100 0 20 40 60 80 100
Score
Score GROUP MEAN CITY LEGEND: MIN GROUP MAX CITY MEAN LEGEND:
Brussels
%
Bucharest
of respondents who chose the Priority Area

From a list of 15 indicators, survey respondents were asked to select 5 that they perceived as the most urgent for their city. The higher the percentage of responses per area, the greater the priority for the city.
% of respondents who agree or strongly agree with the statement
ATTITUDES
You are willing to concede personal data in order to improve traffic congestion
You are comfortable with face recognition technologies to lower crime
You feel the availability of online information has increased your trust in authorities
The proportion of your day-to-day payment transactions that are non-cash (% of transactions)
PRIORITY AREAS
City Population HDI
BACKGROUND INFORMATION
Map tiles by Stamen Design CC BY 3.0 Map Data © OpenStreetMap Country Romania HDI Life expectancy at birth Expected years of schooling Mean years of schooling GNI per capita (PPP $)
Basic sanitation meets the needs of the poorest areas Online reporting of city maintenance problems provides a speedy solution Recycling services are satisfactory A website or App allows residents to easily give away unwanted items Public safety is not a problem Free public wifi has improved access to city services Air pollution is not a problem CCTV cameras has made residents feel safer Medical services provision is satisfactory A website or App allows residents to effectively monitor air pollution Finding housing with rent equal to 30% or less of a monthly salary is not a problem Arranging medical appointments online has improved access Mobility Mobility Traffic congestion is not a problem Car-sharing Apps have reduced congestion Public transport is satisfactory Apps that direct you to an available parking space have reduced journey time Bicycle hiring has reduced congestion Online scheduling and ticket sales has made public transport easier to use The city provides information on traffic congestion through mobile phones Activities Activities Green spaces are satisfactory Online purchasing of tickets to shows and museums has made it easier to attend Cultural activities (shows, bars, and museums) are satisfactory Opportunities (Work & School) Opportunities (Work & School) Employment finding services are readily available Online access to job
Health & Safety Health & Safety
listings has made it easier to find work
IT
Businesses are creating new jobs The current
and
needs Minorities feel welcome Governance Governance Information on local government decisions are easily accessible Online public access to city finances has reduced corruption Corruption of city officials is not an issue of concern Online voting has increased participation Residents contribute to decision making of local government An online platform where residents can propose ideas has improved city life Residents provide feedback on local government projects Processing Identification Documents online has reduced waiting times (UN Data) 1,820,000 0.926 (Global Data Lab)
Most children have access to a good school
skills are taught well in schools Lifelong learning opportunities are provided by local institutions Online services provided by the city has made it easier to start a new business
internet speed
reliability meet connectivity
77.1 52.2 59.7 76.1 STRUCTURES TECHNOLOGIES 47.3 54.1 47.2 21.6 50.6 48.5 51.7 61.0 16.2 41.5 47.7 All ratings range from AAA to D
2 48.5 GROUP B TECHNOLOGIES B FACTOR RATINGS B STRUCTURES 37.2 55.4 2020 74.2 +0.002 -0.1 +0.0 +0.0 46.6 51.4 67.7 30.5 50.2
100
52.8 1 yr change 11.4 28,603 11.4 31,641 2021 2022 0.827 74.1 14.5 14.5 2019 ▲ 104 in 2023 Out of 142 Out of 141 67.3 37.2 56.9 25.2 43.6 11.3 0.828 75.3 14.5 11.4 0.825 54.7 40.9 30,312 SMART CITY RANKING CCC in 2023 41.0 28.6 21.4 35.4 52.0 45.9 51.4 43.9 SMART CITY RATING +1,329 29,569 0.834 76.5 14.4 65.3% 58.5% 50.4% 47.8% 41.1% 31.7% 29.1% 27.7% 26.4% 24.8% 23.2% 21.8% 13.1% 12.8% 7.1% 0% 20% 40% 60% 80% 100% air pollution road congestion corruption / transparency health services basic amenities (water, waste) Green spaces recycling security fulfilling employment public transport school education affordable housing citizen engagement unemployment social mobility / inclusiveness 63.7% 75.8% 53.3% 68.9% 0% 20% 40% 60% 80% 100% 0 20 40 60 80 100 0 20 40 60 80 100
Score %
Score GROUP MEAN CITY LEGEND: MIN GROUP MAX CITY MEAN LEGEND:
of respondents who chose the Priority Area

From a list of 15 indicators, survey respondents were asked to select 5 that they perceived as the most urgent for their city. The higher the percentage of responses per area, the greater the priority for the city.
% of respondents who agree or strongly agree with the statement
ATTITUDES
You are willing to concede personal data in order to improve traffic congestion
You are comfortable with face recognition technologies to lower crime
You feel the availability of online information has increased your trust in authorities
The proportion of your day-to-day payment transactions that are non-cash (% of transactions)
PRIORITY AREAS
City Population HDI
BACKGROUND INFORMATION
Map tiles by Stamen Design CC BY 3.0 Map Data © OpenStreetMap
Hungary HDI Life expectancy at birth Expected years of schooling Mean years of schooling GNI per capita (PPP $)
Basic sanitation meets the needs of the poorest areas Online reporting of city maintenance problems provides a speedy solution Recycling services are satisfactory A website or App allows residents to easily give away unwanted items Public safety is not a problem Free public wifi has improved access to city services Air pollution is not a problem CCTV cameras has made residents feel safer Medical services provision is satisfactory A website or App allows residents to effectively monitor air pollution Finding housing with rent equal to 30% or less of a monthly salary is not a problem Arranging medical appointments online has improved access Mobility Mobility Traffic congestion is not a problem Car-sharing Apps have reduced congestion Public transport is satisfactory Apps that direct you to an available parking space have reduced journey time Bicycle hiring has reduced congestion Online scheduling and ticket sales has made public transport easier to use The city provides information on traffic congestion through mobile phones Activities Activities Green spaces are satisfactory Online purchasing of tickets to shows and museums has made it easier to attend Cultural activities (shows, bars, and museums) are satisfactory Opportunities (Work & School) Opportunities (Work & School) Employment finding services are readily available Online access to job
Country
Health & Safety Health & Safety
listings has made it easier to find work
IT
Businesses are creating new jobs The current
needs Minorities feel welcome Governance Governance Information on local government decisions are easily accessible Online public access to city finances has reduced corruption Corruption of city officials is not an issue of concern Online voting has increased participation Residents contribute to decision making of local government An online platform where residents can propose ideas has improved city life Residents provide feedback on local government projects Processing Identification Documents online has reduced waiting times (Eurostat) 1,750,000 0.922 (Global Data Lab)
Most children have access to a good school
skills are taught well in schools Lifelong learning opportunities are provided by local institutions Online services provided by the city has made it easier to start a new business
internet speed and reliability meet connectivity
79.1 57.8 71.3 66.8 STRUCTURES TECHNOLOGIES 38.2 52.7 49.5 26.7 53.8 32.4 43.4 47.9 25.9 39.6 45.4 All ratings range from AAA to D 89 2 45.1 GROUP B TECHNOLOGIES BB FACTOR RATINGS B STRUCTURES 51.7 61.3 2020 74.5 +0.005 +0.4 +0.0 +0.0 46.2 63.6 73.8 19.0 46.8
52.1 1 yr change 12.2 30,483 12.2 34,196 2021 2022 0.851 75.0 15.1 15.1 2019
87 in 2023 Out of 142 Out of 141 72.0 45.6 67.2 38.0 46.6 12.2 0.849 75.7 15.1 12.2 0.846 35.3 53.7 32,610 SMART CITY RANKING B in 2023 47.2 33.0 32.3 53.6 53.9 54.1 60.0 51.9 SMART CITY RATING +1,586 31,790 0.854 76.5 15.0 67.6% 63.2% 49.0% 44.3% 39.1% 34.0% 33.3% 26.8% 25.4% 23.7% 22.5% 17.8% 15.9% 10.9% 7.8% 0% 20% 40% 60% 80% 100% affordable housing health services security fulfilling employment corruption / transparency air pollution road congestion Green spaces basic amenities (water, waste) unemployment school education public transport recycling social mobility / inclusiveness citizen engagement 48.3% 68.0% 54.1% 68.3% 0% 20% 40% 60% 80% 100% 0 20 40 60 80 100 0 20 40 60 80 100
Budapest
▼
Score
Score GROUP MEAN CITY LEGEND: MIN GROUP MAX CITY MEAN LEGEND:
%
Buenos Aires
respondents who chose the Priority

From a list of 15 indicators, survey respondents were asked to select 5 that they perceived as the most urgent for their city. The higher the percentage of responses per area, the greater the priority for the city.
% of respondents who agree or strongly agree with the statement
ATTITUDES
You are willing to concede personal data in order to improve traffic congestion
You are comfortable with face recognition technologies to lower crime
You feel the availability of online information has increased your trust in authorities
The proportion of your day-to-day payment transactions that are non-cash (% of transactions)
PRIORITY AREAS
City Population HDI
BACKGROUND INFORMATION
Map tiles by Stamen Design CC BY 3.0 Map Data © OpenStreetMap Country Argentina HDI Life expectancy at birth Expected years of schooling Mean years of schooling GNI per capita (PPP $)
Basic sanitation meets the needs of the poorest areas Online reporting of city maintenance problems provides a speedy solution Recycling services are satisfactory A website or App allows residents to easily give away unwanted items Public safety is not a problem Free public wifi has improved access to city services Air pollution is not a problem CCTV cameras has made residents feel safer Medical services provision is satisfactory A website or App allows residents to effectively monitor air pollution Finding housing with rent equal to 30% or less of a monthly salary is not a problem Arranging medical appointments online has improved access Mobility Mobility Traffic congestion is not a problem Car-sharing Apps have reduced congestion Public transport is satisfactory Apps that direct you to an available parking space have reduced journey time Bicycle hiring has reduced congestion Online scheduling and ticket sales has made public transport easier to use The city provides information on traffic congestion through mobile phones Activities Activities Green spaces are satisfactory Online purchasing of tickets to shows and museums has made it easier to attend Cultural activities (shows, bars, and museums) are satisfactory Opportunities (Work & School) Opportunities (Work & School) Employment finding services are readily available Online access to job
Health & Safety Health & Safety
listings has made it easier to find work
IT
institutions
Businesses are creating new jobs The current
reliability meet connectivity needs Minorities feel welcome Governance Governance Information on local government decisions are easily accessible Online public access to city finances has reduced corruption Corruption of city officials is not an issue of concern Online voting has increased participation Residents contribute to decision making of local government An online platform where residents can propose ideas has improved city life Residents provide feedback on local government projects Processing Identification Documents online has reduced waiting times (UN World Urbanization Prospects) 15,150,000 0.812 (Global Data Lab)
Most children have access to a good school
skills are taught well in schools Lifelong learning opportunities are provided by local
Online services provided by the city has made it easier to start a new business
internet speed and
77.3 63.8 52.2 61.1 STRUCTURES TECHNOLOGIES 43.2 46.2 50.9 28.5 46.3 39.0 26.7 54.5 21.9 39.0 43.0 All ratings range from AAA to D 123 3 40.4 GROUP C TECHNOLOGIES C FACTOR RATINGS C STRUCTURES 44.5 45.8 2020 75.4 +0.005 +0.7 +0.0 +0.0 19.6 31.0 76.9 21.6 72.1
48.6 1 yr change 11.1 19,183 11.1 22,048 2021 2022 0.849 76.1 19.0 19.0 2019 ▲ 124 in 2023 Out of 142 Out of 141 56.5 43.9 61.5 29.5 42.5 11.1 0.841 75.9 18.4 11.1 0.844 41.2 44.1 21,093 SMART CITY RANKING C in 2023 46.4 29.4 19.6 33.1 32.0 37.6 48.5 43.8 SMART CITY RATING +954 21,205 0.853 77.3 18.1 77.7% 54.6% 54.5% 48.9% 44.3% 37.6% 37.0% 29.2% 20.4% 20.3% 13.8% 11.9% 11.3% 7.7% 7.3% 0% 20% 40% 60% 80% 100% security health services unemployment corruption / transparency affordable housing fulfilling employment school education basic amenities (water, waste) public transport road congestion air pollution social mobility / inclusiveness recycling Green spaces citizen engagement 55.7% 76.5% 46.8% 67.6% 0% 20% 40% 60% 80% 100% 0 20 40 60 80 100 0 20 40 60 80 100
Score
of
Score GROUP MEAN CITY LEGEND: MIN GROUP MAX CITY MEAN LEGEND:
%
Area
Busan
% of respondents who chose the Priority Area

From a list of 15 indicators, survey respondents were asked to select 5 that they perceived as the most urgent for their city. The higher the percentage of responses per area, the greater the priority for the city.
% of respondents who agree or strongly agree with the statement
ATTITUDES
You are willing to concede personal data in order to improve traffic congestion
You are comfortable with face recognition technologies to lower crime
You feel the availability of online information has increased your trust in authorities
The proportion of your day-to-day payment transactions that are non-cash (% of transactions)
Health & Safety Health & Safety
Basic sanitation meets the needs of the poorest areas Online reporting of city maintenance problems provides a speedy solution
PRIORITY AREAS
City Population HDI
BACKGROUND INFORMATION
Map tiles by Stamen Design CC BY 3.0 Map Data © OpenStreetMap Country
HDI Life
Korea, South
expectancy at birth Expected years of schooling Mean years of schooling GNI per capita (PPP $)
A website
Public safety is not a problem Free public wifi
services Air pollution is not a problem CCTV cameras has
residents feel safer Medical services provision is satisfactory A website or App allows residents to effectively monitor air pollution Finding housing with rent
or less of a monthly salary is not a problem Arranging medical
online has improved access
Traffic
Public
satisfactory
use
phones Activities Activities Green spaces are satisfactory Online purchasing of tickets to shows and museums has made it easier to attend Cultural activities (shows, bars, and museums) are satisfactory Opportunities (Work & School) Opportunities (Work & School) Employment finding services are readily available Online access
Recycling services are satisfactory
or App allows residents to easily give away unwanted items
has improved access to city
made
equal to 30%
appointments
Mobility Mobility
congestion is not a problem Car-sharing Apps have reduced congestion
transport is
Apps that direct you to an available parking space have reduced journey time Bicycle hiring has reduced congestion Online scheduling and ticket sales has made public transport easier to
The city provides information on traffic congestion through mobile
to job listings has made it easier to find work
Most children have access to a good school IT skills are taught well in schools Lifelong learning opportunities are provided by local institutions
connectivity needs Minorities feel welcome Governance Governance Information on local government decisions are easily accessible Online public access to city finances has reduced corruption Corruption of city officials is not an issue of concern Online voting has increased participation Residents contribute to decision making of local government An online platform where residents can propose ideas has improved city life Residents provide feedback on local government projects Processing Identification Documents online has reduced waiting times (UN World Urbanization Prospects) 3,470,000 0.936 (Global Data Lab)
Online services provided by the city has made it easier to start a new business Businesses are creating new jobs The current internet speed and reliability meet
72.7 72.8 71.2 77.9 STRUCTURES TECHNOLOGIES 53.5 61.1 35.0 27.0 79.8 67.3 63.9 67.9 27.2 38.5 41.6 All ratings range from AAA to D 45 2 74.9 GROUP BB TECHNOLOGIES BBB FACTOR RATINGS BB STRUCTURES 66.3 57.3 2020 83.7 +0.003 +0.3 +0.0 +0.0 69.6 31.7 48.3 42.5 53.4
77.2 1 yr change 12.6 42,757 12.6 46,026 2021 2022 0.929 84.0 16.5 16.5 2019 ▲ 49 in 2023 Out of 142 Out of 141 63.0 44.6 76.0 45.5 52.0 12.5 0.922 83.6 16.4 12.6 0.926 25.1 70.9 44,710 SMART CITY RANKING BB in 2023 54.3 38.7 27.8 47.4 59.2 60.9 63.6 45.5 SMART CITY RATING +1,317 43,117 0.922 83.7 16.4 71.1% 60.6% 48.8% 45.0% 38.7% 35.0% 25.5% 23.8% 21.1% 20.6% 15.9% 15.6% 13.8% 12.8% 12.5% 0% 20% 40% 60% 80% 100% fulfilling employment unemployment road congestion affordable housing air pollution corruption / transparency Green spaces security basic amenities (water, waste) health services public transport citizen engagement school education recycling social mobility / inclusiveness 52.9% 76.9% 52.1% 75.7% 0% 20% 40% 60% 80% 100% 0 20 40 60 80 100 0 20 40 60 80 100
Score
Score GROUP MEAN CITY LEGEND: MIN GROUP MAX CITY
LEGEND:
MEAN
Cairo
respondents who chose the Priority

From a list of 15 indicators, survey respondents were asked to select 5 that they perceived as the most urgent for their city. The higher the percentage of responses per area, the greater the priority for the city.
% of respondents who agree or strongly agree with the statement
ATTITUDES
You are willing to concede personal data in order to improve traffic congestion
You are comfortable with face recognition technologies to lower crime
You feel the availability of online information has increased your trust in authorities
The proportion of your day-to-day payment transactions that are non-cash (% of transactions)
PRIORITY AREAS
City Population HDI
BACKGROUND INFORMATION
Map tiles by Stamen Design CC BY 3.0 Map Data © OpenStreetMap Country Egypt HDI Life expectancy at birth Expected years of schooling Mean years of schooling GNI per capita (PPP $)
Basic sanitation meets the needs of the poorest areas Online reporting of city maintenance problems provides a speedy solution Recycling services are satisfactory A website or App allows residents to easily give away unwanted items Public safety is not a problem Free public wifi has improved access to city services Air pollution is not a problem CCTV cameras has made residents feel safer Medical services provision is satisfactory A website or App allows residents to effectively monitor air pollution Finding housing with rent equal to 30% or less of a monthly salary is not a problem Arranging medical appointments online has improved access Mobility Mobility Traffic congestion is not a problem Car-sharing Apps have reduced congestion Public transport is satisfactory Apps that direct you to an available parking space have reduced journey time Bicycle hiring has reduced congestion Online scheduling and ticket sales has made public transport easier to use The city provides information on traffic congestion through mobile phones Activities Activities Green spaces are satisfactory Online purchasing of tickets to shows and museums has made it easier to attend Cultural activities (shows, bars, and museums) are satisfactory Opportunities (Work & School) Opportunities (Work & School) Employment finding services are readily available Online access to job
Health & Safety Health & Safety
listings has made it easier to find work
IT
new jobs The current
needs Minorities feel welcome Governance Governance Information on local government decisions are easily accessible Online public access to city finances has reduced corruption Corruption of city officials is not an issue of concern Online voting has increased participation Residents contribute to decision making of local government An online platform where residents can propose ideas has improved city life Residents provide feedback on local government projects Processing Identification Documents online has reduced waiting times (UN Data) 9,540,000 0.779 (Global Data Lab)
Most children have access to a good school
skills are taught well in schools Lifelong learning opportunities are provided by local institutions Online services provided by the city has made it easier to start a new business Businesses are creating
internet speed and reliability meet connectivity
78.1 63.4 65.2 61.8 STRUCTURES TECHNOLOGIES 57.8 56.8 50.8 19.0 71.5 54.2 41.3 75.3 20.6 58.9 61.0 All ratings range from AAA to D
4 60.0 GROUP C TECHNOLOGIES CC FACTOR RATINGS C STRUCTURES 49.4 41.6 2020 70.2 +0.002 -0.1 +0.0 +0.0 37.5 44.9 64.1 39.1 48.4
114
48.8 1 yr change 9.8 11,637 9.8 12,361 2021 2022 0.728 70.2 12.9 12.9 2019
108 in 2023 Out of 142 Out of 141 71.3 45.1 67.7 39.2 57.0 9.6 0.729 71.0 12.9 9.8 0.726 58.8 53.3 11,827 SMART CITY RANKING CC in 2023 59.2 47.4 26.3 55.1 45.9 55.4 45.2 61.3 SMART CITY RATING +534 11,376 0.724 71.4 12.7 52.4% 49.4% 45.5% 41.6% 39.1% 38.3% 36.6% 31.3% 26.6% 26.0% 25.6% 25.3% 22.5% 9.0% 5.0% 0% 20% 40% 60% 80% 100% affordable housing health services unemployment corruption / transparency road congestion basic amenities (water, waste) air pollution school education security fulfilling employment public transport Green spaces recycling citizen engagement social mobility / inclusiveness 54.8% 80.3% 69.0% 57.3% 0% 20% 40% 60% 80% 100% 0 20 40 60 80 100 0 20 40 60 80 100
Score % of
Area Score GROUP MEAN CITY LEGEND: MIN GROUP MAX CITY MEAN LEGEND:
▼
Canberra
respondents who chose the Priority

From a list of 15 indicators, survey respondents were asked to select 5 that they perceived as the most urgent for their city. The higher the percentage of responses per area, the greater the priority for the city.
% of respondents who agree or strongly agree with the statement
ATTITUDES
You are willing to concede personal data in order to improve traffic congestion
You are comfortable with face recognition technologies to lower crime
You feel the availability of online information has increased your trust in authorities
The proportion of your day-to-day payment transactions that are non-cash
(% of transactions)
PRIORITY AREAS
City Population HDI
BACKGROUND INFORMATION
Map tiles by Stamen Design CC BY 3.0 Map Data © OpenStreetMap Country Australia HDI Life expectancy at birth Expected years of schooling Mean years of schooling GNI per capita (PPP $)
Basic sanitation meets the needs of the poorest areas Online reporting of city maintenance problems provides a speedy solution Recycling services are satisfactory A website or App allows residents to easily give away unwanted items Public safety is not a problem Free public wifi has improved access to city services Air pollution is not a problem CCTV cameras has made residents feel safer Medical services provision is satisfactory A website or App allows residents to effectively monitor air pollution Finding housing with rent equal to 30% or less of a monthly salary is not a problem Arranging medical appointments online has improved access Mobility Mobility Traffic congestion is not a problem Car-sharing Apps have reduced congestion Public transport is satisfactory Apps that direct you to an available parking space have reduced journey time Bicycle hiring has reduced congestion Online scheduling and ticket sales has made public transport easier to use The city provides information on traffic congestion through mobile phones Activities Activities Green spaces are satisfactory Online purchasing of tickets to shows and museums has made it easier to attend Cultural activities (shows, bars, and museums) are satisfactory Opportunities (Work & School) Opportunities (Work & School) Employment finding services are readily available Online access to job listings has made
easier to find work
children have access to a good school IT skills are taught well in schools Lifelong learning opportunities are provided by local institutions Online services provided by the city has made it easier to start a new business Businesses are creating new jobs The current internet speed and reliability meet connectivity needs Minorities feel welcome Governance Governance Information on local government decisions are easily accessible Online public access to city finances has reduced corruption Corruption of city officials is not an issue of concern Online voting has increased participation Residents contribute to decision making of local government An online platform where residents can propose ideas has improved city life Residents provide feedback on local government projects Processing Identification Documents online has reduced waiting times (UN Data) 400,000 0.980 (Global Data Lab)
Health & Safety Health & Safety
it
Most
77.7 41.3 47.7 66.9 STRUCTURES TECHNOLOGIES 49.9 65.5 37.4 75.3 53.8 61.5 43.3 74.6 63.8 37.9 32.6 All ratings range from AAA to D 3 1 79.6 GROUP AA TECHNOLOGIES A FACTOR RATINGS AAA STRUCTURES 55.7 72.7 2020 84.5 -0.003 -0.9 +0.0 +0.0 64.4 66.8 80.3 25.0 81.3
61.4 1 yr change 12.7 48,075 12.7 49,257 2021 2022 0.946 83.6 21.1 21.1 2019 ▬ 3 in 2023 Out of 142 Out of 141 73.9 64.4 57.1 50.2 42.4 12.7 0.948 84.3 20.9 12.7 0.949 76.6 78.0 48,076 SMART CITY RANKING AA in 2023 64.4 33.5 58.3 37.4 80.6 55.8 77.7 44.7 SMART CITY RATING +1,181 47,054 0.941 83.1 21.4 84.9% 70.1% 49.1% 29.3% 27.7% 27.7% 27.0% 26.0% 17.9% 17.0% 16.5% 13.9% 13.3% 10.5% 8.4% 0% 20% 40% 60% 80% 100% affordable housing health services public transport school education recycling road congestion security unemployment fulfilling employment social mobility / inclusiveness citizen engagement corruption / transparency basic amenities (water, waste) Green spaces air pollution 64.2% 68.7% 57.0% 84.9% 0% 20% 40% 60% 80% 100% 0 20 40 60 80 100 0 20 40 60 80 100
Score % of
Score GROUP MEAN CITY LEGEND: MIN GROUP MAX CITY MEAN LEGEND:
Area
Cape Town
% of respondents who chose the Priority Area

From a list of 15 indicators, survey respondents were asked to select 5 that they perceived as the most urgent for their city. The higher the percentage of responses per area, the greater the priority for the city.
% of respondents who agree or strongly agree with the statement
ATTITUDES
You are willing to concede personal data in order to improve traffic congestion
You are comfortable with face recognition technologies to lower crime
You feel the availability of online information has increased your trust in authorities
The proportion of your day-to-day payment transactions that are non-cash (% of transactions)
Health & Safety Health & Safety
PRIORITY AREAS
City Population HDI
BACKGROUND INFORMATION
Map tiles by Stamen Design CC BY 3.0 Map Data © OpenStreetMap
HDI Life expectancy at birth Expected years of schooling Mean years of schooling GNI per capita (PPP $)
Country South Africa
sanitation
Recycling services are satisfactory A website or App allows residents to easily give away unwanted items Public safety is not a problem Free public wifi has improved access to city services Air pollution is not a problem CCTV cameras has made residents feel safer Medical services provision is satisfactory A website or App allows residents to effectively monitor air pollution Finding housing with rent equal to 30% or less of a monthly salary is not a problem Arranging medical appointments online has improved access
Traffic congestion is not a problem Car-sharing Apps have reduced congestion Public transport is satisfactory
that direct you to an available parking space have reduced journey time Bicycle hiring has reduced congestion Online scheduling and ticket sales has made public transport easier to use The city provides information on traffic congestion through mobile phones Activities Activities Green spaces are satisfactory Online purchasing of tickets to shows and museums has made it easier to attend Cultural activities (shows, bars, and museums) are satisfactory Opportunities (Work & School) Opportunities (Work & School) Employment finding services are readily available Online access to
Basic
meets the needs of the poorest areas Online reporting of city maintenance problems provides a speedy solution
Mobility Mobility
Apps
job listings has made it easier to find work
IT
Businesses
new jobs
needs Minorities feel welcome Governance Governance Information on local government decisions are easily accessible Online public access to city finances has reduced corruption Corruption of city officials is not an issue of concern Online voting has increased participation Residents contribute to decision making of local government An online platform where residents can propose ideas has improved city life Residents provide feedback on local government projects Processing Identification Documents online has reduced waiting times (UN World Urbanization Prospects) 4,620,000 0.751 (Global Data Lab)
Most children have access to a good school
skills are taught well in schools Lifelong learning opportunities are provided by local institutions Online services provided by the city has made it easier to start a new business
are creating
The current internet speed and reliability meet connectivity
77.8 53.4 53.7 62.0 STRUCTURES TECHNOLOGIES 48.7 49.5 32.4 29.4 46.5 46.2 27.9 55.5 25.4 42.7 36.1 All ratings range from AAA to D 129 4 39.6 GROUP D TECHNOLOGIES D FACTOR RATINGS D STRUCTURES 37.9 40.4 2020 62.3 -0.004 -0.9 +0.0 +0.0 19.8 43.2 72.7 22.5 56.4
53.0 1 yr change 10.6 12,598 11.6 13,186 2021 2022 0.717 61.5 14.3 14.3 2019 ▼ 125 in 2023 Out of 142 Out of 141 61.1 42.0 56.6 32.0 42.9 11.4 0.722 65.3 14.0 11.6 0.721 42.2 50.5 13,048 SMART CITY RANKING C in 2023 50.8 29.4 19.9 40.4 41.5 47.6 42.7 48.1 SMART CITY RATING +138 13,506 0.741 66.2 14.2 73.8% 67.0% 52.0% 45.5% 45.2% 43.5% 38.6% 30.1% 23.9% 21.3% 14.4% 11.5% 8.6% 7.7% 6.6% 0% 20% 40% 60% 80% 100% unemployment affordable housing security corruption / transparency basic amenities (water, waste) health services fulfilling employment school education public transport road congestion recycling air pollution Green spaces citizen engagement social mobility / inclusiveness 68.9% 79.4% 51.5% 69.3% 0% 20% 40% 60% 80% 100% 0 20 40 60 80 100 0 20 40 60 80 100
Score
Score GROUP MEAN CITY LEGEND: MIN GROUP MAX CITY MEAN LEGEND:
% of respondents who chose the Priority Area

From a list of 15 indicators, survey respondents were asked to select 5 that they perceived as the most urgent for their city. The higher the percentage of responses per area, the greater the priority for the city.
% of respondents who agree or strongly agree with the statement
ATTITUDES
You are willing to concede personal data in order to improve traffic congestion
You are comfortable with face recognition technologies to lower crime
You feel the availability of online information has increased your trust in authorities
The proportion of your day-to-day payment transactions that are non-cash (% of transactions)
PRIORITY AREAS
City Population HDI
BACKGROUND INFORMATION
Map tiles by Stamen Design CC BY 3.0 Map Data © OpenStreetMap Country United Kingdom HDI Life expectancy at birth Expected years of schooling Mean years of schooling GNI per capita (PPP $)
Basic sanitation meets the needs of the poorest areas Online reporting of city maintenance problems provides a speedy solution Recycling services are satisfactory A website or App allows residents to easily give away unwanted items Public safety is not a problem Free public wifi has improved access to city services Air pollution is not a problem CCTV cameras has made residents feel safer Medical services provision is satisfactory A website or App allows residents to effectively monitor air pollution Finding housing with rent equal to 30% or less of a monthly salary is not a problem Arranging medical appointments online has improved access Mobility Mobility Traffic congestion is not a problem Car-sharing Apps have reduced congestion Public transport is satisfactory Apps that direct you to an available parking space have reduced journey time Bicycle hiring has reduced congestion Online scheduling and ticket sales has made public transport easier to use The city provides information on traffic congestion through mobile phones Activities Activities Green spaces are satisfactory Online purchasing of tickets to shows and museums has made it easier to attend Cultural activities (shows, bars, and museums) are satisfactory Opportunities (Work & School) Opportunities (Work & School) Employment finding services are readily available Online access to
find work
children
a good school IT skills
taught well in schools Lifelong learning opportunities are provided by local institutions Online services provided by the city
easier
business Businesses are creating new jobs The current internet speed and reliability meet connectivity needs Minorities feel welcome Governance Governance Information on local government decisions are easily accessible Online public access to city finances has reduced corruption Corruption of city officials is not an issue of concern Online voting has increased participation Residents contribute to decision making of local government An online platform where residents can propose ideas has improved city life Residents provide feedback on local government projects Processing Identification Documents online has reduced waiting times (Eurostat) 360,000 0.898 (Global Data Lab)
Health & Safety Health & Safety
job listings has made it easier to
Most
have access to
are
has made it
to start a new
75.3 45.3 62.2 64.1 STRUCTURES TECHNOLOGIES 40.4 63.5 44.8 37.4 56.8 50.6 30.6 45.6 22.8 33.5 33.0 All ratings range from AAA to D 92 3 59.3 GROUP CC TECHNOLOGIES CC FACTOR RATINGS CCC STRUCTURES 47.7 61.8 2020 80.7 +0.009 +1.4 +0.0 +0.0 39.7 58.7 77.2 23.5 67.7
60.4 1 yr change 13.4 40,799 13.4 46,624 2021 2022 0.940 82.2 17.6 17.6 2019 ▲ 94 in 2023 Out of 142 Out of 141 71.1 54.9 49.2 43.4 42.3 13.3 0.920 80.4 17.2 13.4 0.931 66.8 64.7 44,750 SMART CITY RANKING CC in 2023 58.2 38.3 46.5 55.9 67.4 54.7 64.2 47.5 SMART CITY RATING +1,874 47,066 0.933 81.7 17.2 81.1% 51.8% 45.7% 40.6% 36.0% 28.9% 28.3% 28.2% 24.4% 22.8% 15.4% 15.4% 15.0% 13.4% 13.0% 0% 20% 40% 60% 80% 100% affordable housing health services unemployment public transport road congestion fulfilling employment security school education recycling air pollution Green spaces basic amenities (water, waste) social mobility / inclusiveness corruption / transparency citizen engagement 57.5% 68.3% 56.5% 73.7% 0% 20% 40% 60% 80% 100% 0 20 40 60 80 100 0 20 40 60 80 100
Cardiff
Score
Score GROUP MEAN CITY LEGEND: MIN GROUP MAX CITY MEAN LEGEND:
Chengdu
%
respondents who chose the

From a list of 15 indicators, survey respondents were asked to select 5 that they perceived as the most urgent for their city. The higher the percentage of responses per area, the greater the priority for the city.
% of respondents who agree or strongly agree with the statement
ATTITUDES
You are willing to concede personal data in order to improve traffic congestion
You are comfortable with face recognition technologies to lower crime
You feel the availability of online information has increased your trust in authorities
The proportion of your day-to-day payment transactions that are non-cash (% of transactions)
PRIORITY AREAS
City Population HDI
BACKGROUND INFORMATION
Map tiles by Stamen Design CC BY 3.0 Map Data © OpenStreetMap Country China HDI Life expectancy at birth Expected years of schooling Mean years of schooling GNI per capita (PPP $)
Basic sanitation meets the needs of the poorest areas Online reporting of city maintenance problems provides a speedy solution Recycling services are satisfactory A website or App allows residents to easily give away unwanted items Public safety is not a problem Free public wifi has improved access to city services Air pollution is not a problem CCTV cameras has made residents feel safer Medical services provision is satisfactory A website or App allows residents to effectively monitor air pollution Finding housing with rent equal to 30% or less of a monthly salary is not a problem Arranging medical appointments online has improved access Mobility Mobility Traffic congestion is not a problem Car-sharing Apps have reduced congestion Public transport is satisfactory Apps that direct you to an available parking space have reduced journey time Bicycle hiring has reduced congestion Online scheduling and ticket sales has made public transport easier to use The city provides information on traffic congestion through mobile phones Activities Activities Green spaces are satisfactory Online purchasing of tickets to shows and museums has made it easier to attend Cultural activities (shows, bars, and museums) are satisfactory Opportunities (Work & School) Opportunities (Work & School) Employment finding services are readily available Online access to job
Health & Safety Health & Safety
listings has made it easier to find work
IT
Businesses
new jobs
connectivity needs Minorities feel welcome Governance Governance Information on local government decisions are easily accessible Online public access to city finances has reduced corruption Corruption of city officials is not an issue of concern Online voting has increased participation Residents contribute to decision making of local government An online platform where residents can propose ideas has improved city life Residents provide feedback on local government projects Processing Identification Documents online has reduced waiting times (UN World Urbanization Prospects) 9,140,000 0.740 (Global Data Lab)
Most children have access to a good school
skills are taught well in schools Lifelong learning opportunities are provided by local institutions Online services provided by the city has made it easier to start a new business
are creating
The current internet speed and reliability meet
90.1 83.3 87.0 86.7 STRUCTURES TECHNOLOGIES 79.8 71.5 78.3 51.1 76.8 75.1 71.3 87.4 41.3 66.0 75.2 All ratings range from AAA to D
4 79.4 GROUP CCC TECHNOLOGIES CCC FACTOR RATINGS CCC STRUCTURES 67.3 78.6 2020 78.2 +0.003 +0.4 +0.0 +0.0 68.5 73.3 82.0 62.1 83.0
93
75.1 1 yr change 8.1 16,168 8.1 18,025 2021 2022 0.788 78.6 15.2 15.2 2019 ▲ 97 in 2023 Out of 142 Out of 141 84.7 67.9 79.0 57.2 76.5 8.0 0.781 78.1 15.2 8.1 0.785 78.1 73.8 17,499 SMART CITY RANKING CCC in 2023 73.2 65.5 47.4 68.2 74.3 73.1 64.3 75.5 SMART CITY RATING +526 15,934 0.775 78.0 15.0 51.5% 51.4% 41.6% 40.5% 38.5% 37.4% 29.8% 25.8% 24.0% 22.2% 19.7% 19.0% 17.6% 16.0% 15.3% 0% 20% 40% 60% 80% 100% air pollution road congestion corruption / transparency fulfilling employment affordable housing health services basic amenities (water, waste) unemployment school education social mobility / inclusiveness public transport recycling security citizen engagement Green spaces 85.1% 83.7% 81.9% 86.6% 0% 20% 40% 60% 80% 100% 0 20 40 60 80 100 0 20 40 60 80 100
Score
Priority
Score GROUP MEAN CITY LEGEND: MIN GROUP MAX CITY MEAN LEGEND:
of
Area
respondents who chose the

From a list of 15 indicators, survey respondents were asked to select 5 that they perceived as the most urgent for their city. The higher the percentage of responses per area, the greater the priority for the city.
% of respondents who agree or strongly agree with the statement
ATTITUDES
You are willing to concede personal data in order to improve traffic congestion
You are comfortable with face recognition technologies to lower crime
You feel the availability of online information has increased your trust in authorities
The proportion of your day-to-day payment transactions that are non-cash (% of transactions)
PRIORITY AREAS
City Population HDI
BACKGROUND INFORMATION
Map tiles by Stamen Design CC BY 3.0 Map Data © OpenStreetMap Country USA HDI Life expectancy at birth Expected years of schooling Mean years of schooling GNI per capita (PPP $)
Basic sanitation meets the needs of the poorest areas Online reporting of city maintenance problems provides a speedy solution Recycling services are satisfactory A website or App allows residents to easily give away unwanted items Public safety is not a problem Free public wifi has improved access to city services Air pollution is not a problem CCTV cameras has made residents feel safer Medical services provision is satisfactory A website or App allows residents to effectively monitor air pollution Finding housing with rent equal to 30% or less of a monthly salary is not a problem Arranging medical appointments online has improved access Mobility Mobility Traffic congestion is not a problem Car-sharing Apps have reduced congestion Public transport is satisfactory Apps that direct you to an available parking space have reduced journey time Bicycle hiring has reduced congestion Online scheduling and ticket sales has made public transport easier to use The city provides information on traffic congestion through mobile phones Activities Activities Green spaces are satisfactory Online purchasing of tickets to shows and museums has made it easier to attend Cultural activities (shows, bars, and museums) are satisfactory Opportunities (Work & School) Opportunities (Work & School) Employment finding services are readily available Online access to job
Health & Safety Health & Safety
listings has made it easier to find work
IT
Businesses are creating new jobs The current
connectivity needs Minorities feel welcome Governance Governance Information on local government decisions are easily accessible Online public access to city finances has reduced corruption Corruption of city officials is not an issue of concern Online voting has increased participation Residents contribute to decision making of local government An online platform where residents can propose ideas has improved city life Residents provide feedback on local government projects Processing Identification Documents online has reduced waiting times (UN Data) 2,750,000 0.929 (Global Data Lab)
Most children have access to a good school
skills are taught well in schools Lifelong learning opportunities are provided by local institutions Online services provided by the city has made it easier to start a new business
internet speed and reliability meet
72.6 63.4 60.6 66.0 STRUCTURES TECHNOLOGIES 44.1 54.2 46.3 34.0 48.5 58.8 40.4 65.5 24.3 44.7 53.3 All ratings range from AAA to D 67 2 54.3 GROUP BB TECHNOLOGIES BB FACTOR RATINGS BB STRUCTURES 51.8 64.0 2020 77.2 +0.006 +1.0 +0.0 +0.0 26.5 61.9 77.8 35.4 61.7
54.9 1 yr change 13.7 61,077 13.6 65,565 2021 2022 0.927 78.2 16.4 16.4 2019 ▼ 61 in 2023 Out of 142 Out of 141 65.6 54.8 59.1 45.6 49.5 13.6 0.923 77.4 16.6 13.6 0.921 59.1 61.7 64,484 SMART CITY RANKING BB in 2023 58.8 34.9 26.5 57.9 49.8 49.6 53.4 48.7 SMART CITY RATING +1,081 63,654 0.933 79.1 16.6 70.3% 62.9% 43.2% 41.9% 38.8% 37.4% 35.0% 29.9% 21.7% 19.6% 16.7% 12.2% 11.8% 11.2% 9.0% 0% 20% 40% 60% 80% 100% affordable housing security health services corruption / transparency unemployment school education road congestion fulfilling employment public transport air pollution basic amenities (water, waste) citizen engagement social mobility / inclusiveness Green spaces recycling 51.9% 62.5% 48.5% 74.7% 0% 20% 40% 60% 80% 100% 0 20 40 60 80 100 0 20 40 60 80 100
Chicago
Score
of
Score GROUP MEAN CITY LEGEND: MIN GROUP MAX CITY MEAN LEGEND:
%
Priority Area
Chongqing
%
respondents who chose the

From a list of 15 indicators, survey respondents were asked to select 5 that they perceived as the most urgent for their city. The higher the percentage of responses per area, the greater the priority for the city.
% of respondents who agree or strongly agree with the statement
ATTITUDES
You are willing to concede personal data in order to improve traffic congestion
You are comfortable with face recognition technologies to lower crime
You feel the availability of online information has increased your trust in authorities
The proportion of your day-to-day payment transactions that are non-cash (% of transactions)
PRIORITY AREAS
City Population HDI
BACKGROUND INFORMATION
Map tiles by Stamen Design CC BY 3.0 Map Data © OpenStreetMap Country China HDI Life expectancy at birth Expected years of schooling Mean years of schooling GNI per capita (PPP $)
Basic sanitation meets the needs of the poorest areas Online reporting of city maintenance problems provides a speedy solution Recycling services are satisfactory A website or App allows residents to easily give away unwanted items Public safety is not a problem Free public wifi has improved access to city services Air pollution is not a problem CCTV cameras has made residents feel safer Medical services provision is satisfactory A website or App allows residents to effectively monitor air pollution Finding housing with rent equal to 30% or less of a monthly salary is not a problem Arranging medical appointments online has improved access Mobility Mobility Traffic congestion is not a problem Car-sharing Apps have reduced congestion Public transport is satisfactory Apps that direct you to an available parking space have reduced journey time Bicycle hiring has reduced congestion Online scheduling and ticket sales has made public transport easier to use The city provides information on traffic congestion through mobile phones Activities Activities Green spaces are satisfactory Online purchasing of tickets to shows and museums has made it easier to attend Cultural activities (shows, bars, and museums) are satisfactory Opportunities (Work & School) Opportunities (Work & School) Employment finding services are readily available Online access to job
work
good
IT skills
schools Lifelong learning opportunities are provided
local institutions Online services provided
the city
easier
business Businesses are creating new jobs The current internet speed and reliability meet connectivity needs Minorities feel welcome Governance Governance Information on local government decisions are easily accessible Online public access to city finances has reduced corruption Corruption of city officials is not an issue of concern Online voting has increased participation Residents contribute to decision making of local government An online platform where residents can propose ideas has improved city life Residents provide feedback on local government projects Processing Identification Documents online has reduced waiting times (UN World Urbanization Prospects) 15,870,000 0.774 (Global Data Lab)
Health & Safety Health & Safety
listings has made it easier to find
Most children have access to a
school
are taught well in
by
by
has made it
to start a new
88.3 83.4 87.3 87.2 STRUCTURES TECHNOLOGIES 78.0 71.5 72.4 61.0 80.2 77.3 73.1 87.5 40.8 62.2 78.4 All ratings range from AAA to D 82 4 82.9 GROUP CCC TECHNOLOGIES CCC FACTOR RATINGS CCC STRUCTURES 69.3 76.9 2020 78.2 +0.003 +0.4 +0.0 +0.0 73.3 72.3 79.2 68.4 81.6
76.4 1 yr change 8.1 16,168 8.1 18,025 2021 2022 0.788 78.6 15.2 15.2 2019 ▲ 86 in 2023 Out of 142 Out of 141 80.7 68.5 78.5 59.3 78.4 8.0 0.781 78.1 15.2 8.1 0.785 82.4 74.6 17,499 SMART CITY RANKING CCC in 2023 74.8 70.4 58.1 72.0 74.5 75.0 65.1 73.6 SMART CITY RATING +526 15,934 0.775 78.0 15.0 55.4% 49.3% 41.4% 35.2% 33.0% 32.0% 28.5% 27.0% 26.6% 24.4% 22.8% 20.1% 17.6% 16.3% 14.8% 0% 20% 40% 60% 80% 100% road congestion fulfilling employment affordable housing air pollution corruption / transparency health services unemployment social mobility / inclusiveness basic amenities (water, waste) school education recycling Green spaces citizen engagement public transport security 87.8% 88.8% 90.2% 85.2% 0% 20% 40% 60% 80% 100% 0 20 40 60 80 100 0 20 40 60 80 100
Score
Priority Area Score GROUP MEAN CITY LEGEND: MIN GROUP MAX CITY MEAN LEGEND:
of
respondents who chose the Priority Area

From a list of 15 indicators, survey respondents were asked to select 5 that they perceived as the most urgent for their city. The higher the percentage of responses per area, the greater the priority for the city.
% of respondents who agree or strongly agree with the statement
ATTITUDES
You are willing to concede personal data in order to improve traffic congestion
You are comfortable with face recognition technologies to lower crime
You feel the availability of online information has increased your trust in authorities
The proportion of your day-to-day payment transactions that are non-cash (% of transactions)
PRIORITY AREAS
City Population HDI
BACKGROUND INFORMATION
Map tiles by Stamen Design CC BY 3.0 Map Data © OpenStreetMap Country Denmark HDI Life expectancy at birth Expected years of schooling Mean years of schooling GNI per capita (PPP $)
Basic sanitation meets the needs of the poorest areas Online reporting of city maintenance problems provides a speedy solution Recycling services are satisfactory A website or App allows residents to easily give away unwanted items Public safety is not a problem Free public wifi has improved access to city services Air pollution is not a problem CCTV cameras has made residents feel safer Medical services provision is satisfactory A website or App allows residents to effectively monitor air pollution Finding housing with rent equal to 30% or less of a monthly salary is not a problem Arranging medical appointments online has improved access Mobility Mobility Traffic congestion is not a problem Car-sharing Apps have reduced congestion Public transport is satisfactory Apps that direct you to an available parking space have reduced journey time Bicycle hiring has reduced congestion Online scheduling and ticket sales has made public transport easier to use The city provides information on traffic congestion through mobile phones Activities Activities Green spaces are satisfactory Online purchasing of tickets to shows and museums has made it easier to attend Cultural activities (shows, bars, and museums) are satisfactory Opportunities (Work & School) Opportunities (Work & School) Employment finding services are readily available Online access to job
Health & Safety Health & Safety
listings has made it easier to find work
IT
Businesses are creating new jobs The current
reliability meet connectivity needs Minorities feel welcome Governance Governance Information on local government decisions are easily accessible Online public access to city finances has reduced corruption Corruption of city officials is not an issue of concern Online voting has increased participation Residents contribute to decision making of local government An online platform where residents can propose ideas has improved city life Residents provide feedback on local government projects Processing Identification Documents online has reduced waiting times (UN World Urbanization Prospects) 1,350,000 0.967 (Global Data Lab)
Most children have access to a good school
skills are taught well in schools Lifelong learning opportunities are provided by local institutions Online services provided by the city has made it easier to start a new business
internet speed and
78.9 43.6 62.9 67.9 STRUCTURES TECHNOLOGIES 47.3 66.5 46.8 50.4 46.5 74.3 43.6 71.2 32.3 37.8 41.3 All ratings range from AAA to D 6 1 76.9 GROUP AA TECHNOLOGIES A FACTOR RATINGS AA STRUCTURES 65.9 77.7 2020 81.4 +0.005 +0.5 +0.0 +0.0 71.8 70.7 83.1 22.9 72.2
49.4 1 yr change 13.0 57,324 13.0 62,019 2021 2022 0.952 81.9 18.8 18.8 2019 ▼ 4 in 2023 Out of 142 Out of 141 70.8 67.9 52.7 58.1 49.1 12.9 0.946 81.5 18.6 13.0 0.947 59.7 78.8 59,993 SMART CITY RANKING AA in 2023 63.8 44.5 62.9 46.3 78.5 61.4 73.1 46.9 SMART CITY RATING +2,026 58,454 0.946 81.4 18.6 80.4% 44.6% 37.1% 30.3% 29.8% 29.2% 25.7% 24.1% 21.7% 20.0% 19.6% 18.4% 17.4% 17.1% 17.1% 0% 20% 40% 60% 80% 100% affordable housing road congestion air pollution unemployment public transport health services Green spaces security school education citizen engagement fulfilling employment recycling corruption / transparency social mobility / inclusiveness basic amenities (water, waste) 55.6% 66.3% 56.2% 80.2% 0% 20% 40% 60% 80% 100% 0 20 40 60 80 100 0 20 40 60 80 100
Copenhagen
Score
Score GROUP MEAN CITY LEGEND: MIN GROUP MAX CITY MEAN LEGEND:
% of
% of respondents who chose the Priority Area

From a list of 15 indicators, survey respondents were asked to select 5 that they perceived as the most urgent for their city. The higher the percentage of responses per area, the greater the priority for the city.
% of respondents who agree or strongly agree with the statement
ATTITUDES
You are willing to concede personal data in order to improve traffic congestion
You are comfortable with face recognition technologies to lower crime
You feel the availability of online information has increased your trust in authorities
The proportion of your day-to-day payment transactions that are non-cash (% of transactions)
PRIORITY AREAS
City Population HDI
BACKGROUND INFORMATION
Map tiles by Stamen Design CC BY 3.0 Map Data © OpenStreetMap Country India HDI Life expectancy at birth Expected years of schooling Mean years of schooling GNI per capita (PPP $)
Basic sanitation meets the needs of the poorest areas Online reporting of city maintenance problems provides a speedy solution Recycling services are satisfactory A website or App allows residents to easily give away unwanted items Public safety is not a problem Free public wifi has improved access to city services Air pollution is not a problem CCTV cameras has made residents feel safer Medical services provision is satisfactory A website or App allows residents to effectively monitor air pollution Finding housing with rent equal to 30% or less of a monthly salary is not a problem Arranging medical appointments online has improved access Mobility Mobility Traffic congestion is not a problem Car-sharing Apps have reduced congestion Public transport is satisfactory Apps that direct you to an available parking space have reduced journey time Bicycle hiring has reduced congestion Online scheduling and ticket sales has made public transport easier to use The city provides information on traffic congestion through mobile phones Activities Activities Green spaces are satisfactory Online purchasing of tickets to shows and museums has made it easier to attend Cultural activities (shows, bars, and museums) are satisfactory Opportunities (Work & School) Opportunities (Work & School) Employment finding services are readily available Online access to job
Health & Safety Health & Safety
listings has made it easier to find work
IT
Businesses
creating new jobs The current
needs Minorities feel welcome Governance Governance Information on local government decisions are easily accessible Online public access to city finances has reduced corruption Corruption of city officials is not an issue of concern Online voting has increased participation Residents contribute to decision making of local government An online platform where residents can propose ideas has improved city life Residents provide feedback on local government projects Processing Identification Documents online has reduced waiting times (UN World Urbanization Prospects) 30,290,000 0.730 (Global Data Lab)
Most children have access to a good school
skills are taught well in schools Lifelong learning opportunities are provided by local institutions Online services provided by the city has made it easier to start a new business
are
internet speed and reliability meet connectivity
80.5 71.7 78.2 75.9 STRUCTURES TECHNOLOGIES 63.4 58.7 69.0 21.4 75.4 69.9 64.3 77.4 25.3 64.9 65.5 All ratings range from AAA to D
4 69.3 GROUP CC TECHNOLOGIES CC FACTOR RATINGS CC STRUCTURES 67.5 65.1 2020 67.2 +0.011 +0.5 +0.6 +0.0 37.1 75.0 73.8 49.0 63.1
68.1 1 yr change 6.5 6,090 6.6 6,951 2021 2022 0.644 67.7 12.6 12.0 2019 ▼ 105 in 2023 Out of 142 Out of 141 74.5 65.9 77.3 64.2 70.8 6.3 0.638 70.2 11.7 6.5 0.633 68.7 66.3 6,542 SMART CITY RANKING CC in 2023 70.5 62.9 38.7 70.6 67.4 68.7 65.2 75.3 SMART CITY RATING +408 6,554 0.638 70.9 11.4 69.8% 48.8% 44.7% 38.3% 36.9% 36.6% 32.7% 31.1% 29.6% 29.5% 22.1% 20.3% 13.1% 11.3% 8.1% 0% 20% 40% 60% 80% 100% air pollution security basic amenities (water, waste) health services unemployment road congestion Green spaces fulfilling employment corruption / transparency affordable housing recycling public transport school education social mobility / inclusiveness citizen engagement 77.8% 77.4% 81.1% 73.5% 0% 20% 40% 60% 80% 100% 0 20 40 60 80 100 0 20 40 60 80 100
106
Delhi
Score
Score GROUP MEAN CITY LEGEND: MIN GROUP MAX CITY MEAN LEGEND:
Denver
respondents who chose the

From a list of 15 indicators, survey respondents were asked to select 5 that they perceived as the most urgent for their city. The higher the percentage of responses per area, the greater the priority for the city.
% of respondents who agree or strongly agree with the statement
ATTITUDES
You are willing to concede personal data in order to improve traffic congestion
You are comfortable with face recognition technologies to lower crime
You feel the availability of online information has increased your trust in authorities
The proportion of your day-to-day payment transactions that are non-cash (% of transactions)
PRIORITY AREAS
City Population HDI
BACKGROUND INFORMATION
Map tiles by Stamen Design CC BY 3.0 Map Data © OpenStreetMap Country USA HDI Life expectancy at birth Expected years of schooling Mean years of schooling GNI per capita (PPP $)
Basic sanitation meets the needs of the poorest areas Online reporting of city maintenance problems provides a speedy solution Recycling services are satisfactory A website or App allows residents to easily give away unwanted items Public safety is not a problem Free public wifi has improved access to city services Air pollution is not a problem CCTV cameras has made residents feel safer Medical services provision is satisfactory A website or App allows residents to effectively monitor air pollution Finding housing with rent equal to 30% or less of a monthly salary is not a problem Arranging medical appointments online has improved access Mobility Mobility Traffic congestion is not a problem Car-sharing Apps have reduced congestion Public transport is satisfactory Apps that direct you to an available parking space have reduced journey time Bicycle hiring has reduced congestion Online scheduling and ticket sales has made public transport easier to use The city provides information on traffic congestion through mobile phones Activities Activities Green spaces are satisfactory Online purchasing of tickets to shows and museums has made it easier to attend Cultural activities (shows, bars, and museums) are satisfactory Opportunities (Work & School) Opportunities (Work & School) Employment finding services are readily available Online access to job
easier to find work
children
a good school IT skills are taught well in schools Lifelong learning opportunities are provided by local institutions Online services provided by the city
easier
start
business Businesses are creating new jobs The current internet speed and reliability meet connectivity needs Minorities feel welcome Governance Governance Information on local government decisions are easily accessible Online public access to city finances has reduced corruption Corruption of city officials is not an issue of concern Online voting has increased participation Residents contribute to decision making of local government An online platform where residents can propose ideas has improved city life Residents provide feedback on local government projects Processing Identification Documents online has reduced waiting times (UN Data) 720,000 0.942 (Global Data Lab)
Health & Safety Health & Safety
listings has made it
Most
have access to
has made it
to
a new
72.5 54.1 52.6 66.4 STRUCTURES TECHNOLOGIES 36.5 56.8 37.1 29.0 39.0 62.7 40.2 63.7 19.5 40.1 36.7 All ratings range from AAA to D
1 53.7 GROUP BBB TECHNOLOGIES BBB FACTOR RATINGS BBB STRUCTURES 49.3 68.0 2020 77.2 +0.006 +1.0 +0.0 +0.0 30.8 64.8 78.1 17.7 67.4
66
42.2 1 yr change 13.7 61,077 13.6 65,565 2021 2022 0.927 78.2 16.4 16.4 2019 ▼ 53 in 2023 Out of 142 Out of 141 66.8 61.3 53.7 50.4 39.8 13.6 0.923 77.4 16.6 13.6 0.921 61.3 62.9 64,484 SMART CITY RANKING BBB in 2023 57.4 38.4 43.1 51.7 59.8 45.1 65.2 43.3 SMART CITY RATING +1,081 63,654 0.933 79.1 16.6 83.2% 60.3% 46.0% 42.7% 31.3% 31.2% 27.2% 23.1% 20.0% 19.4% 17.4% 14.5% 11.6% 11.4% 7.2% 0% 20% 40% 60% 80% 100% affordable housing road congestion security air pollution school education unemployment health services corruption / transparency public transport fulfilling employment basic amenities (water, waste) recycling Green spaces social mobility / inclusiveness citizen engagement 55.9% 61.2% 43.8% 79.7% 0% 20% 40% 60% 80% 100% 0 20 40 60 80 100 0 20 40 60 80 100
Score % of
Priority Area Score GROUP MEAN CITY LEGEND: MIN GROUP MAX CITY MEAN LEGEND:
Doha
% of respondents who chose the Priority Area

From a list of 15 indicators, survey respondents were asked to select 5 that they perceived as the most urgent for their city. The higher the percentage of responses per area, the greater the priority for the city.
% of respondents who agree or strongly agree with the statement
ATTITUDES
You are willing to concede personal data in order to improve traffic congestion
You are comfortable with face recognition technologies to lower crime
You feel the availability of online information has increased your trust in authorities
The proportion of your day-to-day payment transactions that are non-cash (% of transactions)
PRIORITY AREAS
City Population HDI
BACKGROUND INFORMATION
Map tiles by Stamen Design CC BY 3.0 Map Data © OpenStreetMap Country Qatar HDI Life expectancy at birth Expected years of schooling Mean years of schooling GNI per capita (PPP $)
Basic sanitation meets the needs of the poorest areas
reporting of city maintenance problems provides a speedy solution Recycling services are satisfactory A website or App allows residents to easily give away unwanted items Public safety is not a problem Free public wifi has improved access to city services Air pollution is not a problem CCTV cameras has made residents feel safer Medical services provision is satisfactory A website or App allows residents to effectively monitor air pollution Finding housing with rent equal to 30% or less of a monthly salary is not a problem Arranging medical appointments online has improved access Mobility Mobility Traffic congestion is not a problem Car-sharing Apps have reduced congestion Public transport is satisfactory Apps that direct you to an available parking space have reduced journey time Bicycle hiring has reduced congestion Online scheduling and ticket sales has made public transport easier to use The city provides information on traffic congestion through mobile phones Activities Activities Green spaces are satisfactory Online purchasing of tickets to shows and museums has made it easier to attend Cultural activities (shows, bars, and museums) are satisfactory Opportunities (Work & School) Opportunities (Work & School) Employment finding services are readily available Online access to job
Health & Safety Health & Safety
Online
listings has made it easier to find work
IT
Businesses are creating new jobs The current
needs Minorities feel welcome Governance Governance Information on local government decisions are easily accessible Online public access to city finances has reduced corruption Corruption of city officials is not an issue of concern Online voting has increased participation Residents contribute to decision making of local government An online platform where residents can propose ideas has improved city life Residents provide feedback on local government projects Processing Identification Documents online has reduced waiting times (UN Data) 1,190,000 0.855 (Global Data Lab)
Most children have access to a good school
skills are taught well in schools Lifelong learning opportunities are provided by local institutions Online services provided by the city has made it easier to start a new business
internet speed and reliability meet connectivity
87.3 69.9 78.7 85.4 STRUCTURES TECHNOLOGIES 77.5 72.0 63.7 53.9 83.8 83.4 54.5 77.8 56.7 71.6 66.7 All ratings range from AAA to D
3 85.0 GROUP B TECHNOLOGIES B FACTOR RATINGS BB STRUCTURES 80.9 55.2 2020 79.3 +0.011 +2.3 +0.0 +0.0 71.5 64.0 79.1 46.5 78.2
48
70.0 1 yr change 10.1 87,385 10.1 95,944 2021 2022 0.875 81.6 13.3 13.3 2019 ▲ 59 in 2023 Out of 142 Out of 141 72.4 55.7 81.5 53.3 63.0 10.0 0.863 79.1 13.3 10.1 0.864 73.2 76.8 91,760 SMART CITY RANKING BB in 2023 77.7 66.3 64.8 62.6 74.3 74.1 66.6 72.6 SMART CITY RATING +4,184 88,647 0.869 81.0 13.2 73.6% 47.1% 46.4% 36.6% 29.6% 28.2% 27.9% 26.3% 25.4% 23.6% 23.4% 20.0% 16.8% 15.0% 14.3% 0% 20% 40% 60% 80% 100% affordable housing fulfilling employment unemployment road congestion Green spaces health services air pollution public transport recycling citizen engagement school education basic amenities (water, waste) social mobility / inclusiveness corruption / transparency security 67.1% 84.1% 85.0% 67.4% 0% 20% 40% 60% 80% 100% 0 20 40 60 80 100 0 20 40 60 80 100
Score
Score GROUP MEAN CITY LEGEND: MIN GROUP MAX CITY MEAN LEGEND:
Dubai
respondents who chose the

From a list of 15 indicators, survey respondents were asked to select 5 that they perceived as the most urgent for their city. The higher the percentage of responses per area, the greater the priority for the city.
% of respondents who agree or strongly agree with the statement
ATTITUDES
You are willing to concede personal data in order to improve traffic congestion
You are comfortable with face recognition technologies to lower crime
You feel the availability of online information has increased your trust in authorities
The proportion of your day-to-day payment transactions that are non-cash (% of transactions)
Health & Safety Health & Safety
PRIORITY AREAS
City Population HDI
BACKGROUND INFORMATION
Map tiles by Stamen Design CC BY 3.0 Map Data © OpenStreetMap Country United Arab Emirates HDI Life expectancy at birth Expected years of schooling Mean years of schooling GNI per capita (PPP $)
Basic sanitation meets the needs of the poorest areas Online reporting of city maintenance problems provides a speedy solution Recycling services are satisfactory A website or App allows residents to easily give away unwanted items Public safety is not a problem Free public wifi has improved access to city services Air pollution is not a problem CCTV cameras has made residents feel safer Medical services provision is satisfactory A website or App allows residents to effectively monitor air pollution Finding housing with rent equal to 30% or less of a monthly salary is not a problem Arranging medical appointments online has improved access Mobility Mobility Traffic congestion is not a problem Car-sharing Apps have reduced congestion Public transport is satisfactory Apps that direct you to an available parking space have reduced journey time Bicycle hiring has reduced congestion Online scheduling and ticket sales has made public transport easier to use The city provides information on traffic congestion through mobile phones Activities Activities Green spaces are satisfactory Online purchasing of tickets to shows and museums has made it easier to attend Cultural activities (shows, bars, and museums) are satisfactory Opportunities (Work & School) Opportunities (Work & School) Employment finding services are readily available Online access
to job listings has made it easier to find work
IT
Lifelong learning opportunities
provided
institutions
provided
business Businesses are creating new jobs The current
speed and reliability meet connectivity needs Minorities feel welcome Governance Governance Information on local government decisions are easily accessible Online public access to city finances has reduced corruption Corruption of city officials is not an issue of concern Online voting has increased participation Residents contribute to decision making of local government An online platform where residents can propose ideas has improved city life Residents provide feedback on local government projects Processing Identification Documents online has reduced waiting times (UN World Urbanization Prospects) 2,880,000 0.911 (Global Data Lab)
Most children have access to a good school
skills are taught well in schools
are
by local
Online services
by the city has made it easier to start a new
internet
89.5 79.7 78.2 85.3 STRUCTURES TECHNOLOGIES 77.8 76.0 65.9 52.1 88.5 82.2 59.7 84.3 40.8 65.5 71.4 All ratings range from AAA to D 12 3 81.3 GROUP BB TECHNOLOGIES BB FACTOR RATINGS BB STRUCTURES 79.7 68.7 2020 78.7 +0.006 +0.5 +0.0 +0.0 67.1 70.5 85.8 52.1 81.9
79.8 1 yr change 12.7 67,353 12.8 74,104 2021 2022 0.937 79.2 17.2 17.2 2019 ▲ 17 in 2023 Out of 142 Out of 141 76.7 72.1 85.2 63.0 73.0 12.7 0.930 78.9 17.2 12.8 0.931 81.3 83.8 69,550 SMART CITY RANKING BB in 2023 86.9 70.8 68.7 63.5 76.7 76.5 69.8 80.7 SMART CITY RATING +4,553 72,131 0.933 79.7 16.8 78.8% 52.4% 48.9% 47.1% 32.9% 27.5% 26.7% 22.7% 20.6% 20.6% 19.2% 18.5% 12.9% 12.6% 11.4% 0% 20% 40% 60% 80% 100% affordable housing unemployment road congestion fulfilling employment air pollution health services Green spaces recycling citizen engagement school education public transport social mobility / inclusiveness basic amenities (water, waste) corruption / transparency security 73.7% 88.3% 92.3% 72.1% 0% 20% 40% 60% 80% 100% 0 20 40 60 80 100 0 20 40 60 80 100
Score
of
Priority Area Score GROUP MEAN CITY LEGEND: MIN GROUP MAX CITY MEAN LEGEND:
%
Dublin
respondents who chose the

From a list of 15 indicators, survey respondents were asked to select 5 that they perceived as the most urgent for their city. The higher the percentage of responses per area, the greater the priority for the city.
% of respondents who agree or strongly agree with the statement
ATTITUDES
You are willing to concede personal data in order to improve traffic congestion
You are comfortable with face recognition technologies to lower crime
You feel the availability of online information has increased your trust in authorities
The proportion of your day-to-day payment transactions that are non-cash (% of transactions)
PRIORITY AREAS
City Population HDI
BACKGROUND INFORMATION
Map tiles by Stamen Design CC BY 3.0 Map Data © OpenStreetMap
Ireland HDI Life expectancy at birth Expected years of schooling Mean years of schooling GNI per capita (PPP $)
Basic sanitation meets the needs of the poorest areas Online reporting of city maintenance problems provides a speedy solution Recycling services are satisfactory A website or App allows residents to easily give away unwanted items Public safety is not a problem Free public wifi has improved access to city services Air pollution is not a problem CCTV cameras has made residents feel safer Medical services provision is satisfactory A website or App allows residents to effectively monitor air pollution Finding housing with rent equal to 30% or less of a monthly salary is not a problem Arranging medical appointments online has improved access Mobility Mobility Traffic congestion is not a problem Car-sharing Apps have reduced congestion Public transport is satisfactory Apps that direct you to an available parking space have reduced journey time Bicycle hiring has reduced congestion Online scheduling and ticket sales has made public transport easier to use The city provides information on traffic congestion through mobile phones Activities Activities Green spaces are satisfactory Online purchasing of tickets to shows and museums has made it easier to attend Cultural activities (shows, bars, and museums) are satisfactory Opportunities (Work & School) Opportunities (Work & School) Employment finding services are readily available Online access to job
Country
Health & Safety Health & Safety
listings has made it easier to find work
IT
Lifelong
opportunities
institutions
business Businesses are creating new jobs The current
reliability meet connectivity needs Minorities feel welcome Governance Governance Information on local government decisions are easily accessible Online public access to city finances has reduced corruption Corruption of city officials is not an issue of concern Online voting has increased participation Residents contribute to decision making of local government An online platform where residents can propose ideas has improved city life Residents provide feedback on local government projects Processing Identification Documents online has reduced waiting times (UN World Urbanization Prospects) 1,230,000 0.950 (Global Data Lab)
Most children have access to a good school
skills are taught well in schools
learning
are provided by local
Online services provided by the city has made it easier to start a new
internet speed and
79.2 52.8 62.1 67.4 STRUCTURES TECHNOLOGIES 36.5 65.2 51.6 37.5 48.6 34.7 29.0 46.4 20.3 30.9 35.7 All ratings range from AAA to D 69 1 56.6 GROUP BB TECHNOLOGIES BBB FACTOR RATINGS BB STRUCTURES 41.9 68.1 2020 82.0 +0.004 +0.7 +0.0 +0.0 26.1 61.9 68.2 10.9 54.7
54.7 1 yr change 11.7 69,109 11.7 87,468 2021 2022 0.950 82.7 19.1 19.1 2019 ▼ 63 in 2023 Out of 142 Out of 141 71.8 49.1 64.0 36.4 39.4 11.6 0.945 82.5 18.8 11.7 0.946 50.5 64.5 78,953 SMART CITY RANKING BB in 2023 48.1 33.3 30.2 41.3 63.9 50.4 62.4 46.8 SMART CITY RATING +8,515 67,652 0.942 82.3 18.9 91.0% 73.9% 48.6% 37.2% 35.8% 31.6% 27.1% 22.1% 20.9% 15.2% 14.1% 13.7% 13.0% 12.8% 9.7% 0% 20% 40% 60% 80% 100% affordable housing health services security public transport road congestion unemployment corruption / transparency school education fulfilling employment Green spaces social mobility / inclusiveness recycling basic amenities (water, waste) air pollution citizen engagement 59.8% 69.2% 51.1% 74.8% 0% 20% 40% 60% 80% 100% 0 20 40 60 80 100 0 20 40 60 80 100
Score % of
Priority Area Score GROUP MEAN CITY LEGEND: MIN GROUP MAX CITY MEAN LEGEND:
Dusseldorf
respondents who chose the

From a list of 15 indicators, survey respondents were asked to select 5 that they perceived as the most urgent for their city. The higher the percentage of responses per area, the greater the priority for the city.
% of respondents who agree or strongly agree with the statement
ATTITUDES
You are willing to concede personal data in order to improve traffic congestion
You are comfortable with face recognition technologies to lower crime
You feel the availability of online information has increased your trust in authorities
The proportion of your day-to-day payment transactions that are non-cash (% of transactions)
PRIORITY AREAS
City Population HDI
BACKGROUND INFORMATION
Map tiles by Stamen Design CC BY 3.0 Map Data © OpenStreetMap Country Germany HDI Life expectancy at birth Expected years of schooling Mean years of schooling GNI per capita (PPP $)
Basic sanitation meets the needs of the poorest areas Online reporting of city maintenance problems provides a speedy solution Recycling services are satisfactory A website or App allows residents to easily give away unwanted items Public safety is not a problem Free public wifi has improved access to city services Air pollution is not a problem CCTV cameras has made residents feel safer Medical services provision is satisfactory A website or App allows residents to effectively monitor air pollution Finding housing with rent equal to 30% or less of a monthly salary is not a problem Arranging medical appointments online has improved access Mobility Mobility Traffic congestion is not a problem Car-sharing Apps have reduced congestion Public transport is satisfactory Apps that direct you to an available parking space have reduced journey time Bicycle hiring has reduced congestion Online scheduling and ticket sales has made public transport easier to use The city provides information on traffic congestion through mobile phones Activities Activities Green spaces are satisfactory Online purchasing of tickets to shows and museums has made it easier to attend Cultural activities (shows, bars, and museums) are satisfactory Opportunities (Work & School) Opportunities (Work & School) Employment finding services are readily available Online access to job
Health & Safety Health & Safety
listings has made it easier to find work
IT
Businesses
creating new jobs The current
needs Minorities feel welcome Governance Governance Information on local government decisions are easily accessible Online public access to city finances has reduced corruption Corruption of city officials is not an issue of concern Online voting has increased participation Residents contribute to decision making of local government An online platform where residents can propose ideas has improved city life Residents provide feedback on local government projects Processing Identification Documents online has reduced waiting times (UN World Urbanization Prospects) 630,000 0.939 (Global Data Lab)
Most children have access to a good school
skills are taught well in schools Lifelong learning opportunities are provided by local institutions Online services provided by the city has made it easier to start a new business
are
internet speed and reliability meet connectivity
76.2 52.3 65.9 60.2 STRUCTURES TECHNOLOGIES 45.2 55.4 48.3 41.6 45.9 75.3 37.5 56.7 34.8 40.3 46.2 All ratings range from AAA to D
2 64.4 GROUP BB TECHNOLOGIES B FACTOR RATINGS BBB STRUCTURES 58.9 60.4 2020 80.6 +0.002 +0.4 +0.0 +0.0 56.9 60.2 78.2 25.1 64.4
44
54.4 1 yr change 14.3 53,375 14.3 55,340 2021 2022 0.950 81.0 17.3 17.3 2019
38 in 2023 Out of 142 Out of 141 69.1 54.7 51.9 48.8 46.4 14.2 0.948 81.1 17.2 14.3 0.948 58.1 72.3 55,057 SMART CITY RANKING BB in 2023 54.4 38.6 52.7 54.5 65.2 49.2 55.5 47.4 SMART CITY RATING +284 55,685 0.951 81.6 17.2 70.1% 53.8% 51.6% 41.4% 35.0% 32.2% 23.4% 20.5% 19.7% 18.7% 18.6% 16.1% 14.6% 13.5% 10.8% 0% 20% 40% 60% 80% 100% affordable housing road congestion security unemployment public transport air pollution basic amenities (water, waste) Green spaces recycling school education health services social mobility / inclusiveness fulfilling employment citizen engagement corruption / transparency 59.5% 65.0% 53.1% 63.0% 0% 20% 40% 60% 80% 100% 0 20 40 60 80 100 0 20 40 60 80 100
▼
Score % of
Priority Area Score GROUP MEAN CITY LEGEND: MIN GROUP MAX CITY MEAN LEGEND:
Geneva
chose

From a list of 15 indicators, survey respondents were asked to select 5 that they perceived as the most urgent for their city. The higher the percentage of responses per area, the greater the priority for the city.
respondents who agree or strongly agree with the statement
ATTITUDES
You are willing to concede personal data in order to improve traffic congestion
You are comfortable with face recognition technologies to lower crime
You feel the availability of online information has increased your trust in authorities
The proportion of your day-to-day payment transactions that are non-cash (% of transactions)
PRIORITY AREAS
City Population HDI
BACKGROUND INFORMATION
Map tiles by Stamen Design CC BY 3.0 Map Data © OpenStreetMap Country Switzerland HDI Life expectancy at birth Expected years of schooling Mean years of schooling GNI per capita (PPP $)
sanitation meets the needs of the poorest areas
reporting of city maintenance problems provides a speedy solution Recycling services are satisfactory A website or App allows residents to easily give away unwanted items Public safety is not a problem Free public wifi has improved access to city services Air pollution is not a problem CCTV cameras has made residents feel safer Medical services provision is satisfactory A website or App allows residents to effectively monitor air pollution Finding housing with rent equal to 30% or less of a monthly salary is not a problem Arranging medical appointments online has improved access Mobility Mobility Traffic congestion is not a problem Car-sharing Apps have reduced congestion Public transport is satisfactory Apps that direct you to an available parking space have reduced journey time Bicycle hiring has reduced congestion Online scheduling and ticket sales has made public transport easier to use The city provides information on traffic congestion through mobile phones Activities Activities Green spaces are satisfactory Online purchasing of tickets to shows and museums has made it easier to attend Cultural activities (shows, bars, and museums) are satisfactory Opportunities (Work & School) Opportunities (Work & School) Employment finding services are readily available Online access to job
Health & Safety Health & Safety Basic
Online
listings has made it easier to find work
IT
Businesses are creating new jobs The current
speed
reliability
connectivity needs Minorities feel welcome Governance Governance Information on local government decisions are easily accessible Online public access to city finances has reduced corruption Corruption of city officials is not an issue of concern Online voting has increased participation Residents contribute to decision making of local government An online platform where residents can propose ideas has improved city life Residents provide feedback on local government projects Processing Identification Documents online has reduced waiting times (Eurostat) 200,000 0.966 (Global Data Lab)
Most children have access to a good school
skills are taught well in schools Lifelong learning opportunities are provided by local institutions Online services provided by the city has made it easier to start a new business
internet
and
meet
81.1 59.1 77.8 77.9 STRUCTURES TECHNOLOGIES 54.0 64.5 53.2 55.4 53.6 78.2 51.0 70.6 39.1 41.3 44.0 All ratings range from AAA to D 4 1 74.0 GROUP AAA TECHNOLOGIES AA FACTOR RATINGS AAA STRUCTURES 72.8 67.9 2020 84.0 +0.002 +0.3 +0.0 +0.0 70.8 56.8 81.2 32.2 82.2
61.8 1 yr change 13.9 66,267 13.9 69,433 2021 2022 0.967 84.3 16.6 16.6 2019
9 in 2023 Out of 142 Out of 141 62.4 70.0 68.8 69.3 51.7 13.9 0.957 83.1 16.4 13.9 0.965 67.5 76.0 68,550 SMART CITY RANKING AA in 2023 70.3 47.8 56.3 53.0 82.9 62.5 71.7 53.1 SMART CITY RATING +882 67,531 0.960 83.8 16.3 74.4% 51.7% 43.2% 37.9% 34.1% 26.2% 25.7% 24.9% 24.1% 23.9% 19.4% 17.5% 16.5% 13.8% 12.6% 0% 20% 40% 60% 80% 100% affordable housing road congestion unemployment security air pollution fulfilling employment health services Green spaces recycling public transport corruption / transparency social mobility / inclusiveness basic amenities (water, waste) school education citizen engagement 63.2% 63.8% 59.6% 73.6% 0% 20% 40% 60% 80% 100% 0 20 40 60 80 100 0 20 40 60 80 100 % of
Score % of
Priority Area Score GROUP MEAN CITY LEGEND: MIN GROUP MAX CITY MEAN LEGEND:
▲
respondents who
the
Glasgow
respondents who chose the Priority Area

From a list of 15 indicators, survey respondents were asked to select 5 that they perceived as the most urgent for their city. The higher the percentage of responses per area, the greater the priority for the city.
% of respondents who agree or strongly agree with the statement
ATTITUDES
You are willing to concede personal data in order to improve traffic congestion
You are comfortable with face recognition technologies to lower crime
You feel the availability of online information has increased your trust in authorities
The proportion of your day-to-day payment transactions that are non-cash (% of transactions)
PRIORITY AREAS
City Population HDI
BACKGROUND INFORMATION
Map tiles by Stamen Design CC BY 3.0 Map Data © OpenStreetMap Country United Kingdom HDI Life expectancy at birth Expected years of schooling Mean years of schooling GNI per capita (PPP $)
Basic sanitation meets the needs of the poorest areas Online reporting of city maintenance problems provides a speedy solution Recycling services are satisfactory A website or App allows residents to easily give away unwanted items Public safety is not a problem Free public wifi has improved access to city services Air pollution is not a problem CCTV cameras has made residents feel safer Medical services provision is satisfactory A website or App allows residents to effectively monitor air pollution Finding housing with rent equal to 30% or less of a monthly salary is not a problem Arranging medical appointments online has improved access Mobility Mobility Traffic congestion is not a problem Car-sharing Apps have reduced congestion Public transport is satisfactory Apps that direct you to an available parking space have reduced journey time Bicycle hiring has reduced congestion Online scheduling and ticket sales has made public transport easier to use The city provides information on traffic congestion through mobile phones Activities Activities Green spaces are satisfactory Online purchasing of tickets to shows and museums has made it easier to attend Cultural activities (shows, bars, and museums) are satisfactory Opportunities (Work & School) Opportunities (Work & School) Employment finding services are readily available Online access to
work
good
IT
schools Lifelong learning opportunities are provided
institutions
services
business Businesses are creating new jobs The current internet speed and reliability meet connectivity needs Minorities feel welcome Governance Governance Information on local government decisions are easily accessible Online public access to city finances has reduced corruption Corruption of city officials is not an issue of concern Online voting has increased participation Residents contribute to decision making of local government An online platform where residents can propose ideas has improved city life Residents provide feedback on local government projects Processing Identification Documents online has reduced waiting times (Eurostat) 620,000 0.921 (Global Data Lab)
Health & Safety Health & Safety
job listings has made it easier to find
Most children have access to a
school
skills are taught well in
by local
Online
provided by the city has made it easier to start a new
73.5 49.0 60.8 66.9 STRUCTURES TECHNOLOGIES 40.9 65.7 43.2 35.0 55.1 47.8 28.8 39.5 24.3 33.8 37.7 All ratings range from AAA to D
2 52.2 GROUP B TECHNOLOGIES B FACTOR RATINGS BB STRUCTURES 52.5 61.9 2020 80.7 +0.009 +1.4 +0.0 +0.0 38.6 53.4 76.4 25.6 63.9
87
60.3 1 yr change 13.4 40,799 13.4 46,624 2021 2022 0.940 82.2 17.6 17.6 2019
80 in 2023 Out of 142 Out of 141 64.7 48.0 48.3 40.2 40.6 13.3 0.920 80.4 17.2 13.4 0.931 61.0 52.4 44,750 SMART CITY RANKING BB in 2023 52.1 34.8 38.2 55.1 60.0 56.1 57.5 47.0 SMART CITY RATING +1,874 47,066 0.933 81.7 17.2 75.7% 63.1% 50.0% 39.6% 32.7% 29.9% 29.3% 26.7% 24.6% 23.7% 16.3% 15.3% 15.1% 13.0% 10.4% 0% 20% 40% 60% 80% 100% affordable housing health services unemployment fulfilling employment road congestion school education public transport security recycling air pollution social mobility / inclusiveness Green spaces basic amenities (water, waste) corruption / transparency citizen engagement 49.7% 66.1% 46.4% 74.1% 0% 20% 40% 60% 80% 100% 0 20 40 60 80 100 0 20 40 60 80 100
Score
Score GROUP MEAN CITY LEGEND: MIN GROUP MAX CITY MEAN LEGEND:
▼
% of
Gothenburg
% of respondents who chose the Priority Area

From a list of 15 indicators, survey respondents were asked to select 5 that they perceived as the most urgent for their city. The higher the percentage of responses per area, the greater the priority for the city.
% of respondents who agree or strongly agree with the statement
ATTITUDES
You are willing to concede personal data in order to improve traffic congestion
You are comfortable with face recognition technologies to lower crime
You feel the availability of online information has increased your trust in authorities
The proportion of your day-to-day payment transactions that are non-cash (% of transactions)
PRIORITY AREAS
City Population HDI
BACKGROUND INFORMATION
Map tiles by Stamen Design CC BY 3.0 Map Data © OpenStreetMap Country Sweden HDI Life expectancy at birth Expected years of schooling Mean years of schooling GNI per capita (PPP $)
Basic sanitation meets the needs of the poorest areas Online reporting of city maintenance problems provides a speedy solution Recycling services are satisfactory A website or App allows residents to easily give away unwanted items Public safety is not a problem Free public wifi has improved access to city services Air pollution is not a problem CCTV cameras has made residents feel safer Medical services provision is satisfactory A website or App allows residents to effectively monitor air pollution Finding housing with rent equal to 30% or less of a monthly salary is not a problem Arranging medical appointments online has improved access Mobility Mobility Traffic congestion is not a problem Car-sharing Apps have reduced congestion Public transport is satisfactory Apps that direct you to an available parking space have reduced journey time Bicycle hiring has reduced congestion Online scheduling and ticket sales has made public transport easier to use The city provides information on traffic congestion through mobile phones Activities Activities Green spaces are satisfactory Online purchasing of tickets to shows and museums has made it easier to attend Cultural activities (shows, bars, and museums) are satisfactory Opportunities (Work & School) Opportunities (Work & School) Employment finding services are readily available Online access to job
Health & Safety Health & Safety
listings has made it easier to find work
IT
Businesses are creating new jobs The current
connectivity needs Minorities feel welcome Governance Governance Information on local government decisions are easily accessible Online public access to city finances has reduced corruption Corruption of city officials is not an issue of concern Online voting has increased participation Residents contribute to decision making of local government An online platform where residents can propose ideas has improved city life Residents provide feedback on local government projects Processing Identification Documents online has reduced waiting times (Eurostat) 560,000 0.944 (Global Data Lab)
Most children have access to a good school
skills are taught well in schools Lifelong learning opportunities are provided by local institutions Online services provided by the city has made it easier to start a new business
internet speed and reliability meet
76.5 55.2 71.1 67.6 STRUCTURES TECHNOLOGIES 46.0 60.2 46.2 50.2 47.7 57.1 35.9 57.4 30.5 32.0 42.3 All ratings range from AAA to D
1 63.2 GROUP A TECHNOLOGIES A FACTOR RATINGS BBB STRUCTURES 50.9 64.0 2020 83.0 +0.003 +0.5 +0.0 +0.0 42.9 65.7 75.1 28.0 76.5
39
58.5 1 yr change 12.7 53,195 12.7 56,996 2021 2022 0.952 83.5 19.0 19.0 2019 ▼ 36 in 2023 Out of 142 Out of 141 63.4 50.4 53.0 43.4 45.3 12.6 0.944 82.4 18.7 12.7 0.949 56.4 67.8 55,908 SMART CITY RANKING A in 2023 59.4 38.0 49.8 43.2 66.1 55.6 64.5 47.7 SMART CITY RATING +1,088 54,441 0.947 83.1 18.5 68.6% 63.5% 63.2% 38.2% 35.3% 34.8% 25.8% 24.5% 20.8% 17.7% 16.9% 15.7% 13.0% 10.2% 8.5% 0% 20% 40% 60% 80% 100% affordable housing security health services public transport school education unemployment road congestion fulfilling employment Green spaces social mobility / inclusiveness corruption / transparency air pollution recycling basic amenities (water, waste) citizen engagement 50.6% 62.0% 57.2% 83.0% 0% 20% 40% 60% 80% 100% 0 20 40 60 80 100 0 20 40 60 80 100
Score
Score GROUP MEAN CITY LEGEND: MIN GROUP MAX CITY MEAN LEGEND:
Guangzhou
respondents who chose the

From a list of 15 indicators, survey respondents were asked to select 5 that they perceived as the most urgent for their city. The higher the percentage of responses per area, the greater the priority for the city.
% of respondents who agree or strongly agree with the statement
ATTITUDES
You are willing to concede personal data in order to improve traffic congestion
You are comfortable with face recognition technologies to lower crime
You feel the availability of online information has increased your trust in authorities
The proportion of your day-to-day payment transactions that are non-cash (% of transactions)
PRIORITY AREAS
INFORMATION City Population HDI
BACKGROUND
Map tiles by Stamen Design CC BY 3.0 Map Data © OpenStreetMap Country China HDI Life expectancy at birth Expected years of schooling Mean years of schooling GNI per capita (PPP $)
& Safety Health
Safety Basic sanitation meets the needs of the poorest areas Online reporting of city maintenance problems provides a speedy solution Recycling services are satisfactory A website or App allows residents to easily give away unwanted items Public safety is not a problem Free public wifi has improved access to city services Air pollution is not a problem CCTV cameras has made residents feel safer Medical services provision is satisfactory A website or App allows residents to effectively monitor air pollution Finding housing with rent equal to 30% or less of a monthly salary is not a problem Arranging medical appointments online has improved access Mobility Mobility Traffic congestion is not a problem Car-sharing Apps have reduced congestion Public transport is satisfactory Apps that direct you to an available parking space have reduced journey time Bicycle hiring has reduced congestion Online scheduling and ticket sales has made public transport easier to use The city provides information on traffic congestion through mobile phones Activities Activities Green spaces are satisfactory Online purchasing of tickets to shows and museums has made it easier to attend Cultural activities (shows, bars, and museums) are satisfactory Opportunities (Work & School) Opportunities (Work & School) Employment finding services are readily available Online access to job
work
good
IT skills
schools Lifelong learning opportunities are provided
local institutions
services provided by the city
easier
business Businesses are creating new jobs The current internet speed and reliability meet connectivity needs Minorities feel welcome Governance Governance Information on local government decisions are easily accessible Online public access to city finances has reduced corruption Corruption of city officials is not an issue of concern Online voting has increased participation Residents contribute to decision making of local government An online platform where residents can propose ideas has improved city life Residents provide feedback on local government projects Processing Identification Documents online has reduced waiting times (UN World Urbanization Prospects) 13,300,000 0.799 (Global Data Lab)
Health
&
listings has made it easier to find
Most children have access to a
school
are taught well in
by
Online
has made it
to start a new
89.5 87.7 84.6 87.9 STRUCTURES TECHNOLOGIES 82.5 77.7 78.3 59.8 82.6 80.5 78.9 88.7 46.6 69.4 81.5 All ratings range from AAA to D 65 4 85.0 GROUP CCC TECHNOLOGIES CCC FACTOR RATINGS CCC STRUCTURES 64.5 80.4 2020 78.2 +0.003 +0.4 +0.0 +0.0 68.7 77.3 81.6 64.5 78.3
80.8 1 yr change 8.1 16,168 8.1 18,025 2021 2022 0.788 78.6 15.2 15.2 2019 ▲ 71 in 2023 Out of 142 Out of 141 83.9 76.6 86.6 69.6 81.5 8.0 0.781 78.1 15.2 8.1 0.785 82.4 73.9 17,499 SMART CITY RANKING CCC in 2023 79.1 75.3 60.6 76.0 76.8 80.9 67.7 80.9 SMART CITY RATING +526 15,934 0.775 78.0 15.0 60.5% 44.4% 43.2% 40.8% 38.5% 28.9% 28.0% 24.8% 24.3% 23.6% 21.8% 21.3% 20.1% 17.8% 11.8% 0% 20% 40% 60% 80% 100% road congestion air pollution fulfilling employment affordable housing health services basic amenities (water, waste) social mobility / inclusiveness school education unemployment corruption / transparency public transport Green spaces security recycling citizen engagement 87.3% 83.9% 85.1% 84.9% 0% 20% 40% 60% 80% 100% 0 20 40 60 80 100 0 20 40 60 80 100
Score
of
Priority Area Score GROUP MEAN CITY LEGEND: MIN GROUP MAX CITY MEAN LEGEND:
%
Guatemala City
% of respondents who chose the Priority Area

From a list of 15 indicators, survey respondents were asked to select 5 that they perceived as the most urgent for their city. The higher the percentage of responses per area, the greater the priority for the city.
% of respondents who agree or strongly agree with the statement
ATTITUDES
You are willing to concede personal data in order to improve traffic congestion
You are comfortable with face recognition technologies to lower crime
You feel the availability of online information has increased your trust in authorities
The proportion of your day-to-day payment transactions that are non-cash (% of transactions)
Health & Safety Health & Safety
PRIORITY AREAS
City Population HDI
BACKGROUND INFORMATION
Map tiles by Stamen Design CC BY 3.0 Map Data © OpenStreetMap Country Guatemala HDI Life expectancy at birth Expected years of schooling Mean years of schooling GNI per capita (PPP $)
sanitation meets the needs of the poorest areas
reporting of city maintenance problems provides a speedy solution Recycling services are satisfactory A website or App allows residents to easily give away unwanted items Public safety is not a problem Free public wifi has improved access to city services Air pollution is not a problem CCTV cameras has made residents feel safer Medical services provision is satisfactory A website or App allows residents to effectively monitor air pollution Finding housing with rent equal to 30% or less of a monthly salary is not a problem Arranging medical appointments online has improved access Mobility Mobility Traffic congestion is not a problem Car-sharing Apps have reduced congestion Public transport is satisfactory Apps that direct you to an available parking space have reduced journey time Bicycle hiring has reduced congestion Online scheduling and ticket sales has made public transport easier to use The city provides information on traffic congestion through mobile phones Activities Activities Green spaces are satisfactory Online purchasing of tickets to shows and museums has made it easier to attend Cultural activities (shows, bars, and museums) are satisfactory Opportunities (Work & School) Opportunities (Work & School) Employment finding services are readily available Online access to job
work
Basic
Online
listings has made it easier to find
IT
learning opportunities
provided
institutions
business Businesses are creating new jobs The current internet speed and reliability meet connectivity needs Minorities feel welcome Governance Governance Information on local government decisions are easily accessible Online public access to city finances has reduced corruption Corruption of city officials is not an issue of concern Online voting has increased participation Residents contribute to decision making of local government An online platform where residents can propose ideas has improved city life Residents provide feedback on local government projects Processing Identification Documents online has reduced waiting times (UN World Urbanization Prospects) 3,040,000 0.722 (Global Data Lab)
Most children have access to a good school
skills are taught well in schools Lifelong
are
by local
Online services provided by the city has made it easier to start a new
66.7 49.1 38.5 55.0 STRUCTURES TECHNOLOGIES 28.9 30.8 23.1 28.7 40.3 25.6 20.0 46.2 17.8 28.3 36.4 All ratings range from AAA to D
4 26.2 GROUP D TECHNOLOGIES D FACTOR RATINGS D STRUCTURES 23.8 49.1 2020 69.2 -0.001 -0.6 +0.0 +0.0 18.3 39.0 58.3 27.8 57.5
142
28.7 1 yr change 5.7 8,240 5.7 8,996 2021 2022 0.629 68.7 10.8 10.8 2019 ▼ 141 in 2023 Out of 142 Out of 141 58.5 24.5 56.2 19.8 21.0 5.7 0.638 71.8 10.8 5.7 0.630 30.0 27.1 8,716 SMART CITY RANKING D in 2023 33.5 19.2 10.0 25.3 15.8 32.1 33.8 42.9 SMART CITY RATING +280 8,514 0.645 73.1 10.8 81.2% 64.5% 62.2% 50.2% 40.2% 39.9% 38.9% 33.5% 22.1% 19.2% 14.8% 10.6% 7.8% 5.8% 4.4% 0% 20% 40% 60% 80% 100% security health services corruption / transparency basic amenities (water, waste) unemployment school education road congestion fulfilling employment public transport affordable housing recycling air pollution Green spaces citizen engagement social mobility / inclusiveness 55.6% 75.8% 36.4% 60.6% 0% 20% 40% 60% 80% 100% 0 20 40 60 80 100 0 20 40 60 80 100
Score
Score GROUP MEAN CITY LEGEND: MIN GROUP MAX CITY MEAN LEGEND:
Hamburg
of respondents who chose the Priority Area

From a list of 15 indicators, survey respondents were asked to select 5 that they perceived as the most urgent for their city. The higher the percentage of responses per area, the greater the priority for the city.
% of respondents who agree or strongly agree with the statement
ATTITUDES
You are willing to concede personal data in order to improve traffic congestion
You are comfortable with face recognition technologies to lower crime
You feel the availability of online information has increased your trust in authorities
The proportion of your day-to-day payment transactions that are non-cash (% of transactions)
PRIORITY AREAS
City Population HDI
BACKGROUND INFORMATION
Map tiles by Stamen Design CC BY 3.0 Map Data © OpenStreetMap Country Germany HDI Life expectancy at birth Expected years of schooling Mean years of schooling GNI per capita (PPP $)
Basic sanitation meets the needs of the poorest areas Online reporting of city maintenance problems provides a speedy solution Recycling services are satisfactory A website or App allows residents to easily give away unwanted items Public safety is not a problem Free public wifi has improved access to city services Air pollution is not a problem CCTV cameras has made residents feel safer Medical services provision is satisfactory A website or App allows residents to effectively monitor air pollution Finding housing with rent equal to 30% or less of a monthly salary is not a problem Arranging medical appointments online has improved access Mobility Mobility Traffic congestion is not a problem Car-sharing Apps have reduced congestion Public transport is satisfactory Apps that direct you to an available parking space have reduced journey time Bicycle hiring has reduced congestion Online scheduling and ticket sales has made public transport easier to use The city provides information on traffic congestion through mobile phones Activities Activities Green spaces are satisfactory Online purchasing of tickets to shows and museums has made it easier to attend Cultural activities (shows, bars, and museums) are satisfactory Opportunities (Work & School) Opportunities (Work & School) Employment finding services are readily available Online access to job
work
Health & Safety Health & Safety
listings has made it easier to find
IT
Lifelong learning opportunities
institutions
business Businesses are creating new jobs The current
speed and reliability meet connectivity needs Minorities feel welcome Governance Governance Information on local government decisions are easily accessible Online public access to city finances has reduced corruption Corruption of city officials is not an issue of concern Online voting has increased participation Residents contribute to decision making of local government An online platform where residents can propose ideas has improved city life Residents provide feedback on local government projects Processing Identification Documents online has reduced waiting times (Eurostat) 1,850,000 0.972 (Global Data Lab)
Most children have access to a good school
skills are taught well in schools
are provided by local
Online services provided by the city has made it easier to start a new
internet
76.8 52.9 67.9 59.7 STRUCTURES TECHNOLOGIES 45.4 58.5 46.1 43.5 42.2 67.6 34.3 57.1 26.5 38.0 42.7 All ratings range from AAA to D 14 1 67.4 GROUP BBB TECHNOLOGIES BBB FACTOR RATINGS BBB STRUCTURES 59.3 66.4 2020 80.6 +0.002 +0.4 +0.0 +0.0 53.7 61.8 80.8 19.0 65.0
55.0 1 yr change 14.3 53,375 14.3 55,340 2021 2022 0.950 81.0 17.3 17.3 2019
11 in 2023 Out of 142 Out of 141 71.6 54.7 53.9 50.1 44.5 14.2 0.948 81.1 17.2 14.3 0.948 59.3 70.3 55,057 SMART CITY RANKING A in 2023 53.1 35.0 53.8 47.9 63.3 43.6 58.5 43.8 SMART CITY RATING +284 55,685 0.951 81.6 17.2 78.6% 52.0% 42.6% 36.5% 32.9% 29.9% 28.8% 25.8% 22.0% 19.4% 18.4% 16.6% 15.5% 13.1% 12.5% 0% 20% 40% 60% 80% 100% affordable housing road congestion security unemployment public transport school education air pollution health services Green spaces recycling social mobility / inclusiveness citizen engagement basic amenities (water, waste) corruption / transparency fulfilling employment 59.3% 66.9% 51.4% 65.4% 0% 20% 40% 60% 80% 100% 0 20 40 60 80 100 0 20 40 60 80 100
Score %
Score GROUP MEAN CITY LEGEND: MIN GROUP MAX CITY MEAN LEGEND:
▼
Hangzhou
respondents who chose the

From a list of 15 indicators, survey respondents were asked to select 5 that they perceived as the most urgent for their city. The higher the percentage of responses per area, the greater the priority for the city.
% of respondents who agree or strongly agree with the statement
ATTITUDES
You are willing to concede personal data in order to improve traffic congestion
You are comfortable with face recognition technologies to lower crime
You feel the availability of online information has increased your trust in authorities
The proportion of your day-to-day payment transactions that are non-cash (% of transactions)
PRIORITY AREAS
INFORMATION City Population HDI
BACKGROUND
Map tiles by Stamen Design CC BY 3.0 Map Data © OpenStreetMap Country China HDI Life expectancy at birth Expected years of schooling Mean years of schooling GNI per capita (PPP $)
& Safety Health & Safety Basic sanitation meets the needs of the poorest areas Online reporting of city maintenance problems provides a speedy solution Recycling services are satisfactory A website or App allows residents to easily give away unwanted items Public safety is not a problem Free public wifi has improved access to city services Air pollution is not a problem CCTV cameras has made residents feel safer Medical services provision is satisfactory A website or App allows residents to effectively monitor air pollution Finding housing with rent equal to 30% or less of a monthly salary is not a problem Arranging medical appointments online has improved access Mobility Mobility Traffic congestion is not a problem Car-sharing Apps have reduced congestion Public transport is satisfactory Apps that direct you to an available parking space have reduced journey time Bicycle hiring has reduced congestion Online scheduling and ticket sales has made public transport easier to use The city provides information on traffic congestion through mobile phones Activities Activities Green spaces are satisfactory Online purchasing of tickets to shows and museums has made it easier to attend Cultural activities (shows, bars, and museums) are satisfactory Opportunities (Work & School) Opportunities (Work & School) Employment finding services are readily available Online access to job
work
Health
listings has made it easier to find
IT
Lifelong learning opportunities
provided
institutions
business Businesses are creating new jobs The current
speed and reliability meet connectivity needs Minorities feel welcome Governance Governance Information on local government decisions are easily accessible Online public access to city finances has reduced corruption Corruption of city officials is not an issue of concern Online voting has increased participation Residents contribute to decision making of local government An online platform where residents can propose ideas has improved city life Residents provide feedback on local government projects Processing Identification Documents online has reduced waiting times (UN World Urbanization Prospects) 7,640,000 0.801 (Global Data Lab)
Most children have access to a good school
skills are taught well in schools
are
by local
Online services provided by the city has made it easier to start a new
internet
90.8 86.2 89.1 89.4 STRUCTURES TECHNOLOGIES 82.2 75.6 83.3 63.1 81.3 82.6 74.3 88.8 41.9 69.7 77.5 All ratings range from AAA to D 64 4 84.5 GROUP CCC TECHNOLOGIES CCC FACTOR RATINGS CCC STRUCTURES 67.8 80.4 2020 78.2 +0.003 +0.4 +0.0 +0.0 80.8 75.7 81.4 63.3 84.3
78.6 1 yr change 8.1 16,168 8.1 18,025 2021 2022 0.788 78.6 15.2 15.2 2019 ▲ 70 in 2023 Out of 142 Out of 141 85.4 70.1 85.0 60.7 80.5 8.0 0.781 78.1 15.2 8.1 0.785 82.0 77.3 17,499 SMART CITY RANKING CCC in 2023 77.3 71.9 53.9 73.5 77.4 79.9 70.1 80.5 SMART CITY RATING +526 15,934 0.775 78.0 15.0 59.0% 46.5% 44.2% 38.5% 35.2% 34.9% 28.9% 26.5% 24.6% 22.2% 22.2% 18.5% 18.2% 16.9% 14.4% 0% 20% 40% 60% 80% 100% road congestion fulfilling employment affordable housing air pollution health services corruption / transparency social mobility / inclusiveness unemployment school education public transport basic amenities (water, waste) recycling security citizen engagement Green spaces 88.7% 84.2% 87.6% 89.3% 0% 20% 40% 60% 80% 100% 0 20 40 60 80 100 0 20 40 60 80 100
Score
of
Priority Area Score GROUP MEAN CITY LEGEND: MIN GROUP MAX CITY MEAN LEGEND:
%
Hanoi
% of respondents who chose the Priority Area

From a list of 15 indicators, survey respondents were asked to select 5 that they perceived as the most urgent for their city. The higher the percentage of responses per area, the greater the priority for the city.
% of respondents who agree or strongly agree with the statement
ATTITUDES
You are willing to concede personal data in order to improve traffic congestion
You are comfortable with face recognition technologies to lower crime
You feel the availability of online information has increased your trust in authorities
The proportion of your day-to-day payment transactions that are non-cash (% of transactions)
PRIORITY AREAS
City Population HDI
BACKGROUND INFORMATION
Map tiles by Stamen Design CC BY 3.0 Map Data © OpenStreetMap Country Vietnam HDI Life expectancy at birth Expected years of schooling Mean years of schooling GNI per capita (PPP $)
sanitation meets the needs of the poorest areas
reporting of city maintenance problems provides a speedy solution Recycling services are satisfactory A website or App allows residents to easily give away unwanted items Public safety is not a problem Free public wifi has improved access to city services Air pollution is not a problem CCTV cameras has made residents feel safer Medical services provision is satisfactory A website or App allows residents to effectively monitor air pollution Finding housing with rent equal to 30% or less of a monthly salary is not a problem Arranging medical appointments online has improved access Mobility Mobility Traffic congestion is not a problem Car-sharing Apps have reduced congestion Public transport is satisfactory Apps that direct you to an available parking space have reduced journey time Bicycle hiring has reduced congestion Online scheduling and ticket sales has made public transport easier to use The city provides information on traffic congestion through mobile phones Activities Activities Green spaces are satisfactory Online purchasing of tickets to shows and museums has made it easier to attend Cultural activities (shows, bars, and museums) are satisfactory Opportunities (Work & School) Opportunities (Work & School) Employment finding services are readily available Online access to job
Health & Safety Health & Safety Basic
Online
listings has made it easier to find work
IT
Businesses are
new jobs
current
connectivity needs Minorities feel welcome Governance Governance Information on local government decisions are easily accessible Online public access to city finances has reduced corruption Corruption of city officials is not an issue of concern Online voting has increased participation Residents contribute to decision making of local government An online platform where residents can propose ideas has improved city life Residents provide feedback on local government projects Processing Identification Documents online has reduced waiting times (UN World Urbanization Prospects) 4,680,000 0.744 (Global Data Lab)
Most children have access to a good school
skills are taught well in schools Lifelong learning opportunities are provided by local institutions Online services provided by the city has made it easier to start a new business
creating
The
internet speed and reliability meet
83.8 69.8 79.2 86.0 STRUCTURES TECHNOLOGIES 73.8 69.3 65.8 27.9 80.2 75.1 67.4 84.0 25.3 72.1 74.2 All ratings range from AAA to D
4 73.9 GROUP CCC TECHNOLOGIES CCC FACTOR RATINGS CCC STRUCTURES 55.4 79.8 2020 73.6 +0.008 +1.0 +0.0 +0.0 84.5 83.6 79.1 54.8 66.6
97
68.5 1 yr change 8.5 10,005 8.5 10,814 2021 2022 0.726 74.6 13.1 13.1 2019 ▲ 100 in 2023 Out of 142 Out of 141 83.1 72.7 81.5 69.2 74.8 8.4 0.726 75.4 13.1 8.5 0.718 76.0 66.1 10,085 SMART CITY RANKING CCC in 2023 78.3 64.3 38.3 70.8 81.7 79.5 70.2 79.7 SMART CITY RATING +729 9,734 0.717 74.1 13.0 74.5% 66.8% 47.7% 42.8% 38.1% 34.2% 33.7% 28.7% 24.8% 18.8% 18.1% 17.5% 14.8% 10.2% 5.7% 0% 20% 40% 60% 80% 100% air pollution road congestion corruption / transparency basic amenities (water, waste) affordable housing public transport Green spaces health services security recycling unemployment fulfilling employment school education social mobility / inclusiveness citizen engagement 90.7% 93.7% 91.8% 73.5% 0% 20% 40% 60% 80% 100% 0 20 40 60 80 100 0 20 40 60 80 100
Score
Score GROUP MEAN CITY LEGEND: MIN GROUP MAX CITY MEAN LEGEND:
Hanover
chose

From a list of 15 indicators, survey respondents were asked to select 5 that they perceived as the most urgent for their city. The higher the percentage of responses per area, the greater the priority for the city.
respondents who agree or strongly agree with the statement
ATTITUDES
You are willing to concede personal data in order to improve traffic congestion
You are comfortable with face recognition technologies to lower crime
You feel the availability of online information has increased your trust in authorities
The proportion of your day-to-day payment transactions that are non-cash (% of transactions)
PRIORITY AREAS
City Population HDI
BACKGROUND INFORMATION
Map tiles by Stamen Design CC BY 3.0 Map Data © OpenStreetMap Country Germany HDI Life expectancy at birth Expected years of schooling Mean years of schooling GNI per capita (PPP $)
Basic sanitation meets the needs of the poorest areas Online reporting of city maintenance problems provides a speedy solution Recycling services are satisfactory A website or App allows residents to easily give away unwanted items Public safety is not a problem Free public wifi has improved access to city services Air pollution is not a problem CCTV cameras has made residents feel safer Medical services provision is satisfactory A website or App allows residents to effectively monitor air pollution Finding housing with rent equal to 30% or less of a monthly salary is not a problem Arranging medical appointments online has improved access Mobility Mobility Traffic congestion is not a problem Car-sharing Apps have reduced congestion Public transport is satisfactory Apps that direct you to an available parking space have reduced journey time Bicycle hiring has reduced congestion Online scheduling and ticket sales has made public transport easier to use The city provides information on traffic congestion through mobile phones Activities Activities Green spaces are satisfactory Online purchasing of tickets to shows and museums has made it easier to attend Cultural activities (shows, bars, and museums) are satisfactory Opportunities (Work & School) Opportunities (Work & School) Employment finding services are readily available Online access to job
work
IT
Lifelong learning opportunities
institutions
Businesses are creating new jobs The current internet speed and reliability meet connectivity needs Minorities feel welcome Governance Governance Information on local government decisions are easily accessible Online public access to city finances has reduced corruption Corruption of city officials is not an issue of concern Online voting has increased participation Residents contribute to decision making of local government An online platform where residents can propose ideas has improved city life Residents provide feedback on local government projects Processing Identification Documents online has reduced waiting times (Eurostat) 540,000 0.930 (Global Data Lab)
Health & Safety Health & Safety
listings has made it easier to find
Most children have access to a good school
skills are taught well in schools
are provided by local
Online services provided by the city has made it easier to start a new business
73.7 48.7 68.0 63.0 STRUCTURES TECHNOLOGIES 42.1 55.2 43.0 53.2 42.2 74.9 34.3 58.6 41.5 39.1 40.1 All ratings range from AAA to D
71.2 GROUP BB TECHNOLOGIES
FACTOR RATINGS BBB STRUCTURES 67.3 65.9 2020 80.6 +0.002 +0.4 +0.0 +0.0 50.8 59.3 79.0 27.0 73.0
53 2
B
51.8 1 yr change 14.3 53,375 14.3 55,340 2021 2022 0.950 81.0 17.3 17.3 2019 ▲ 57 in 2023 Out of 142 Out of 141 68.1 54.2 49.8 50.7 41.6 14.2 0.948 81.1 17.2 14.3 0.948 56.7 75.3 55,057 SMART CITY RANKING BB in 2023 56.0 35.6 55.7 47.4 66.5 46.5 57.7 41.8 SMART CITY RATING +284 55,685 0.951 81.6 17.2 72.4% 52.9% 45.0% 39.4% 28.7% 25.9% 21.8% 21.3% 20.8% 20.7% 19.7% 18.5% 17.8% 15.5% 10.6% 0% 20% 40% 60% 80% 100% affordable housing security road congestion unemployment school education public transport citizen engagement social mobility / inclusiveness air pollution recycling health services basic amenities (water, waste) fulfilling employment Green spaces corruption / transparency 52.6% 59.6% 52.3% 65.2% 0% 20% 40% 60% 80% 100% 0 20 40 60 80 100 0 20 40 60 80 100 % of
Score % of respondents
Priority Area Score GROUP MEAN CITY LEGEND: MIN GROUP MAX CITY MEAN LEGEND:
who
the
Helsinki
who chose the

From a list of 15 indicators, survey respondents were asked to select 5 that they perceived as the most urgent for their city. The higher the percentage of responses per area, the greater the priority for the city.
respondents who agree or strongly agree with the statement
ATTITUDES
You are willing to concede personal data in order to improve traffic congestion
You are comfortable with face recognition technologies to lower crime
You feel the availability of online information has increased your trust in authorities
The proportion of your day-to-day payment transactions that are non-cash (% of transactions)
PRIORITY AREAS
City Population HDI
BACKGROUND INFORMATION
Map tiles by Stamen Design CC BY 3.0 Map Data © OpenStreetMap Country Finland HDI Life expectancy at birth Expected years of schooling Mean years of schooling GNI per capita (PPP $)
Basic sanitation meets the needs of the poorest areas Online reporting of city maintenance problems provides a speedy solution Recycling services are satisfactory A website or App allows residents to easily give away unwanted items Public safety is not a problem Free public wifi has improved access to city services Air pollution is not a problem CCTV cameras has made residents feel safer Medical services provision is satisfactory A website or App allows residents to effectively monitor air pollution Finding housing with rent equal to 30% or less of a monthly salary is not a problem Arranging medical appointments online has improved access Mobility Mobility Traffic congestion is not a problem Car-sharing Apps have reduced congestion Public transport is satisfactory Apps that direct you to an available parking space have reduced journey time Bicycle hiring has reduced congestion Online scheduling and ticket sales has made public transport easier to use The city provides information on traffic congestion through mobile phones Activities Activities Green spaces are satisfactory Online purchasing of tickets to shows and museums has made it easier to attend Cultural activities (shows, bars, and museums) are satisfactory Opportunities (Work & School) Opportunities (Work & School) Employment finding services are readily available Online access to job
work
IT
schools Lifelong learning opportunities
provided
institutions
services
business Businesses are creating new jobs The current internet speed and reliability meet connectivity needs Minorities feel welcome Governance Governance Information on local government decisions are easily accessible Online public access to city finances has reduced corruption Corruption of city officials is not an issue of concern Online voting has increased participation Residents contribute to decision making of local government An online platform where residents can propose ideas has improved city life Residents provide feedback on local government projects Processing Identification Documents online has reduced waiting times (Eurostat) 650,000 0.960 (Global Data Lab)
Health & Safety Health & Safety
listings has made it easier to find
Most children have access to a good school
skills are taught well in
are
by local
Online
provided by the city has made it easier to start a new
73.1 45.3 73.7 71.9 STRUCTURES TECHNOLOGIES 49.8 68.3 53.0 59.4 47.5 58.6 49.8 54.9 42.2 36.1 43.2 All ratings range from AAA to D 9 1 66.5 GROUP AA TECHNOLOGIES A FACTOR RATINGS AA STRUCTURES 74.8 64.8 2020 82.0 +0.001 +0.3 +0.0 +0.0 52.4 69.0 80.0 31.5 75.2
55.2 1 yr change 12.9 48,176 12.9 49,522 2021 2022 0.942 82.4 19.2 19.2 2019
8 in 2023 Out of 142 Out of 141 65.2 64.0 60.8 49.3 51.9 12.9 0.939 81.9 19.0 12.9 0.941 53.7 75.9 49,481 SMART CITY RANKING AAA in 2023 62.4 43.6 56.6 43.7 78.2 63.6 72.0 49.6 SMART CITY RATING +42 48,829 0.939 81.9 19.0 63.6% 56.7% 53.3% 42.7% 40.2% 27.6% 26.3% 24.8% 23.8% 23.5% 18.8% 17.4% 13.9% 13.2% 9.8% 0% 20% 40% 60% 80% 100% health services affordable housing security unemployment public transport road congestion fulfilling employment basic amenities (water, waste) school education recycling Green spaces social mobility / inclusiveness citizen engagement air pollution corruption / transparency 50.8% 64.4% 61.1% 83.0% 0% 20% 40% 60% 80% 100% 0 20 40 60 80 100 0 20 40 60 80 100
of
Score % of
Area Score GROUP MEAN CITY LEGEND: MIN GROUP MAX CITY MEAN LEGEND:
▼
%
respondents
Priority
Ho Chi Minh City
% of respondents who chose the Priority Area

From a list of 15 indicators, survey respondents were asked to select 5 that they perceived as the most urgent for their city. The higher the percentage of responses per area, the greater the priority for the city.
% of respondents who agree or strongly agree with the statement
ATTITUDES
You are willing to concede personal data in order to improve traffic congestion
You are comfortable with face recognition technologies to lower crime
You feel the availability of online information has increased your trust in authorities
The proportion of your day-to-day payment transactions that are non-cash (% of transactions)
PRIORITY AREAS
City Population HDI
BACKGROUND INFORMATION
Map tiles by Stamen Design CC BY 3.0 Map Data © OpenStreetMap Country Vietnam HDI Life expectancy at birth Expected years of schooling Mean years of schooling GNI per capita (PPP $)
Basic sanitation meets the needs of the poorest areas Online reporting of city maintenance problems provides a speedy solution Recycling services are satisfactory A website or App allows residents to easily give away unwanted items Public safety is not a problem Free public wifi has improved access to city services Air pollution is not a problem CCTV cameras has made residents feel safer Medical services provision is satisfactory A website or App allows residents to effectively monitor air pollution Finding housing with rent equal to 30% or less of a monthly salary is not a problem Arranging medical appointments online has improved access Mobility Mobility Traffic congestion is not a problem Car-sharing Apps have reduced congestion Public transport is satisfactory Apps that direct you to an available parking space have reduced journey time Bicycle hiring has reduced congestion Online scheduling and ticket sales has made public transport easier to use The city provides information on traffic congestion through mobile phones Activities Activities Green spaces are satisfactory Online purchasing of tickets to shows and museums has made it easier to attend Cultural activities (shows, bars, and museums) are satisfactory Opportunities (Work & School) Opportunities (Work & School) Employment finding services are readily available Online access to job
Health & Safety Health & Safety
listings has made it easier to find work
IT
Businesses
new jobs
needs Minorities feel welcome Governance Governance Information on local government decisions are easily accessible Online public access to city finances has reduced corruption Corruption of city officials is not an issue of concern Online voting has increased participation Residents contribute to decision making of local government An online platform where residents can propose ideas has improved city life Residents provide feedback on local government projects Processing Identification Documents online has reduced waiting times (UN World Urbanization Prospects) 8,600,000 0.714 (Global Data Lab)
Most children have access to a good school
skills are taught well in schools Lifelong learning opportunities are provided by local institutions Online services provided by the city has made it easier to start a new business
are creating
The current internet speed and reliability meet connectivity
84.4 67.6 78.7 83.5 STRUCTURES TECHNOLOGIES 72.3 63.5 55.8 34.0 78.4 71.7 59.6 80.6 25.6 70.6 74.5 All ratings range from AAA to D
4 71.9 GROUP CC TECHNOLOGIES CCC FACTOR RATINGS CC STRUCTURES 52.6 80.6 2020 73.6 +0.008 +1.0 +0.0 +0.0 71.7 74.2 72.6 53.3 63.7
105
64.6 1 yr change 8.5 10,005 8.5 10,814 2021 2022 0.726 74.6 13.1 13.1 2019
103 in 2023 Out of 142 Out of 141 85.3 69.4 78.5 61.3 70.3 8.4 0.726 75.4 13.1 8.5 0.718 69.9 63.6 10,085 SMART CITY RANKING CCC in 2023 73.6 57.7 37.3 64.1 80.2 78.5 66.2 75.4 SMART CITY RATING +729 9,734 0.717 74.1 13.0 55.0% 53.5% 45.9% 40.8% 39.5% 35.5% 35.0% 34.3% 33.8% 29.2% 24.0% 19.0% 17.7% 9.2% 5.0% 0% 20% 40% 60% 80% 100% road congestion air pollution affordable housing basic amenities (water, waste) unemployment security corruption / transparency health services Green spaces public transport fulfilling employment recycling school education citizen engagement social mobility / inclusiveness 86.5% 88.4% 84.6% 68.1% 0% 20% 40% 60% 80% 100% 0 20 40 60 80 100 0 20 40 60 80 100
▼
Score
Score GROUP MEAN CITY LEGEND: MIN GROUP MAX CITY MEAN LEGEND:
Hong Kong
respondents who chose the

From a list of 15 indicators, survey respondents were asked to select 5 that they perceived as the most urgent for their city. The higher the percentage of responses per area, the greater the priority for the city.
% of respondents who agree or strongly agree with the statement
ATTITUDES
You are willing to concede personal data in order to improve traffic congestion
You are comfortable with face recognition technologies to lower crime
You feel the availability of online information has increased your trust in authorities
The proportion of your day-to-day payment transactions that are non-cash (% of transactions)
Health & Safety Health & Safety
PRIORITY AREAS
City Population HDI
BACKGROUND INFORMATION
Map tiles by Stamen Design CC BY 3.0 Map Data © OpenStreetMap Country Hong Kong HDI Life expectancy at birth Expected years of schooling Mean years of schooling GNI per capita (PPP $)
Basic sanitation meets the needs of the poorest areas Online reporting of city maintenance problems provides a speedy solution Recycling services are satisfactory A website or App allows residents to easily give away unwanted items Public safety is not a problem Free public wifi has improved access to city services Air pollution is not a problem CCTV cameras has made residents feel safer Medical services provision is satisfactory A website or App allows residents to effectively monitor air pollution Finding housing with rent equal to 30% or less of a monthly salary is not a problem Arranging medical appointments online has improved access Mobility Mobility Traffic congestion is not a problem Car-sharing Apps have reduced congestion Public transport is satisfactory Apps that direct you to an available parking space have reduced journey time Bicycle hiring has reduced congestion Online scheduling and ticket sales has made public transport easier to use The city provides information on traffic congestion through mobile phones Activities Activities Green spaces are satisfactory Online purchasing of tickets to shows and museums has made it easier to attend Cultural activities (shows, bars, and museums) are satisfactory Opportunities (Work & School) Opportunities (Work & School) Employment finding services are readily available Online access to
easier to find work
children
a good school IT skills
taught well in schools Lifelong learning opportunities are provided by local institutions Online services provided by the city
made it easier to start a new business Businesses are creating new jobs The current internet speed and reliability meet connectivity needs Minorities feel welcome Governance Governance Information on local government decisions are easily accessible Online public access to city finances has reduced corruption Corruption of city officials is not an issue of concern Online voting has increased participation Residents contribute to decision making of local government An online platform where residents can propose ideas has improved city life Residents provide feedback on local government projects Processing Identification Documents online has reduced waiting times (UN World Urbanization Prospects) 7,550,000 0.949 (Global Data Lab)
job listings has made it
Most
have access to
are
has
76.3 69.2 63.7 80.1 STRUCTURES TECHNOLOGIES 52.6 56.7 43.1 32.5 58.9 58.8 57.1 67.7 30.3 46.2 53.7 All ratings range from AAA to D 20 1 69.4 GROUP A TECHNOLOGIES AAA FACTOR RATINGS BBB STRUCTURES 63.6 66.2 2020 85.5 -0.003 -1.2 +0.1 +0.0 57.5 58.6 57.1 27.6 53.6
67.9 1 yr change 12.3 59,537 12.3 62,486 2021 2022 0.956 84.3 17.8 17.7 2019
19 in 2023 Out of 142 Out of 141 73.5 53.8 72.1 45.0 52.6 12.2 0.955 85.2 17.8 12.3 0.959 52.0 47.4 64,151 SMART CITY RANKING AA in 2023 58.8 57.7 44.3 48.9 61.9 60.4 66.9 61.9 SMART CITY RATING -1,665 63,277 0.953 85.3 17.3 71.2% 44.0% 33.0% 31.6% 31.6% 31.1% 31.0% 30.9% 28.5% 27.0% 24.2% 23.2% 23.0% 17.3% 16.5% 0% 20% 40% 60% 80% 100% affordable housing health services fulfilling employment recycling air pollution citizen engagement corruption / transparency road congestion unemployment security basic amenities (water, waste) social mobility / inclusiveness school education public transport Green spaces 58.7% 52.0% 56.8% 71.3% 0% 20% 40% 60% 80% 100% 0 20 40 60 80 100 0 20 40 60 80 100
▼
Score
Priority Area Score GROUP MEAN CITY LEGEND: MIN GROUP MAX CITY MEAN LEGEND:
% of
Hyderabad
% of respondents who chose the Priority Area

From a list of 15 indicators, survey respondents were asked to select 5 that they perceived as the most urgent for their city. The higher the percentage of responses per area, the greater the priority for the city.
% of respondents who agree or strongly agree with the statement
ATTITUDES
You are willing to concede personal data in order to improve traffic congestion
You are comfortable with face recognition technologies to lower crime
You feel the availability of online information has increased your trust in authorities
The proportion of your day-to-day payment transactions that are non-cash
transactions)
PRIORITY AREAS
City Population HDI
BACKGROUND INFORMATION
Map tiles by Stamen Design CC BY 3.0 Map Data © OpenStreetMap Country India HDI Life expectancy at birth Expected years of schooling Mean years of schooling GNI per capita (PPP $)
Basic sanitation meets the needs of the poorest areas Online reporting of city maintenance problems provides a speedy solution Recycling services are satisfactory A website or App allows residents to easily give away unwanted items Public safety is not a problem Free public wifi has improved access to city services Air pollution is not a problem CCTV cameras has made residents feel safer Medical services provision is satisfactory A website or App allows residents to effectively monitor air pollution Finding housing with rent equal to 30% or less of a monthly salary is not a problem Arranging medical appointments online has improved access Mobility Mobility Traffic congestion is not a problem Car-sharing Apps have reduced congestion Public transport is satisfactory Apps that direct you to an available parking space have reduced journey time Bicycle hiring has reduced congestion Online scheduling and ticket sales has made public transport easier to use The city provides information on traffic congestion through mobile phones Activities Activities Green spaces are satisfactory Online purchasing of tickets to shows and museums has made it easier to attend Cultural activities (shows, bars, and museums) are satisfactory Opportunities (Work & School) Opportunities (Work & School) Employment finding services are readily available Online access to job
Health & Safety Health & Safety
listings has made it easier to find work
IT
Businesses
new jobs
needs Minorities feel welcome Governance Governance Information on local government decisions are easily accessible Online public access to city finances has reduced corruption Corruption of city officials is not an issue of concern Online voting has increased participation Residents contribute to decision making of local government An online platform where residents can propose ideas has improved city life Residents provide feedback on local government projects Processing Identification Documents online has reduced waiting times (UN World Urbanization Prospects) 10,000,000 0.647 (Global Data Lab)
Most children have access to a good school
skills are taught well in schools Lifelong learning opportunities are provided by local institutions Online services provided by the city has made it easier to start a new business
are creating
The current internet speed and reliability meet connectivity
80.6 69.5 81.4 78.3 STRUCTURES TECHNOLOGIES 66.6 57.9 56.9 30.1 79.6 73.7 51.6 78.2 30.8 64.9 59.8 All ratings range from AAA to D
4 71.2 GROUP CC TECHNOLOGIES CC FACTOR RATINGS CC STRUCTURES 71.7 72.6 2020 67.2 +0.011 +0.5 +0.6 +0.0 49.9 79.2 77.3 53.3 70.8
111
59.4 1 yr change 6.5 6,090 6.6 6,951 2021 2022 0.644 67.7 12.6 12.0 2019 ▲ 116 in 2023 Out of 142 Out of 141 76.5 64.0 78.7 60.7 69.6 6.3 0.638 70.2 11.7 6.5 0.633 74.5 67.4 6,542 SMART CITY RANKING CC in 2023 73.4 55.7 40.3 62.2 76.2 66.2 65.5 78.8 SMART CITY RATING +408 6,554 0.638 70.9 11.4 52.6% 43.3% 39.8% 39.5% 39.5% 37.8% 35.7% 35.1% 31.5% 31.5% 25.8% 25.7% 16.6% 12.4% 12.2% 0% 20% 40% 60% 80% 100% air pollution unemployment fulfilling employment health services basic amenities (water, waste) corruption / transparency road congestion affordable housing Green spaces security recycling public transport school education social mobility / inclusiveness citizen engagement 77.7% 78.4% 79.4% 77.5% 0% 20% 40% 60% 80% 100% 0 20 40 60 80 100 0 20 40 60 80 100
Score
Score GROUP MEAN CITY LEGEND: MIN GROUP MAX CITY MEAN LEGEND:
(% of
respondents who chose the

From a list of 15 indicators, survey respondents were asked to select 5 that they perceived as the most urgent for their city. The higher the percentage of responses per area, the greater the priority for the city.
respondents who agree or strongly agree with the statement
ATTITUDES
You are willing to concede personal data in order to improve traffic congestion
You are comfortable with face recognition technologies to lower crime
You feel the availability of online information has increased your trust in authorities
The proportion of your day-to-day payment transactions that are non-cash (% of transactions)
PRIORITY AREAS
City Population HDI
BACKGROUND INFORMATION
Map tiles by Stamen Design CC BY 3.0 Map Data © OpenStreetMap
Pakistan HDI Life expectancy at birth Expected years of schooling Mean years of schooling GNI per capita (PPP $)
Country
sanitation meets the needs of the poorest areas
reporting of city maintenance problems provides a speedy solution Recycling services are satisfactory A website or App allows residents to easily give away unwanted items Public safety is not a problem Free public wifi has improved access to city services Air pollution is not a problem CCTV cameras has made residents feel safer Medical services provision is satisfactory A website or App allows residents to effectively monitor air pollution Finding housing with rent equal to 30% or less of a monthly salary is not a problem Arranging medical appointments online has improved access Mobility Mobility Traffic congestion is not a problem Car-sharing Apps have reduced congestion Public transport is satisfactory Apps that direct you to an available parking space have reduced journey time Bicycle hiring has reduced congestion Online scheduling and ticket sales has made public transport easier to use The city provides information on traffic congestion through mobile phones Activities Activities Green spaces are satisfactory Online purchasing of tickets to shows and museums has made it easier to attend Cultural activities (shows, bars, and museums) are satisfactory Opportunities (Work & School) Opportunities (Work & School) Employment finding services are readily available Online access to job
Health & Safety Health & Safety Basic
Online
listings has made it easier to find work
IT
Minorities feel welcome Governance Governance Information on local government decisions are easily accessible Online public access to city finances has reduced corruption Corruption of city officials is not an issue of concern Online voting has increased participation Residents contribute to decision making of local government An online platform where residents can propose ideas has improved city life Residents provide feedback on local government projects Processing Identification Documents online has reduced waiting times (UN Data) 1,010,000 0.659 (Global Data Lab)
Most children have access to a good school
skills are taught well in schools Lifelong learning opportunities are provided by local institutions Online services provided by the city has made it easier to start a new business Businesses are creating new jobs The current internet speed and reliability meet connectivity needs
69.0 69.6 75.4 74.1 STRUCTURES TECHNOLOGIES 61.4 51.4 51.7 40.5 71.5 62.5 52.9 70.7 43.6 63.6 60.2 All ratings range from AAA to D 116 4 61.1 GROUP CC TECHNOLOGIES CC FACTOR RATINGS CC STRUCTURES 62.6 54.5 2020 66.1 +0.003 +0.3 +0.0 +0.0 39.9 65.8 74.1 37.3 79.1
49.0 1 yr change 4.4 4,912 4.4 5,374 2021 2022 0.540 66.4 7.9 7.9 2019 ▲ 120 in 2023 Out of 142 Out of 141 72.9 49.3 77.0 45.4 61.7 4.5 0.536 66.3 7.9 4.4 0.537 65.6 57.8 5,165 SMART CITY RANKING CC in 2023 58.1 55.0 36.1 55.7 65.2 64.0 57.0 65.6 SMART CITY RATING +209 5,067 0.537 66.8 7.6 58.6% 46.7% 40.9% 40.3% 37.9% 35.4% 31.8% 29.2% 29.1% 25.5% 23.9% 22.2% 21.5% 18.5% 17.8% 0% 20% 40% 60% 80% 100% affordable housing unemployment basic amenities (water, waste) corruption / transparency security health services public transport fulfilling employment air pollution recycling school education road congestion Green spaces citizen engagement social mobility / inclusiveness 73.2% 71.5% 70.3% 60.4% 0% 20% 40% 60% 80% 100% 0 20 40 60 80 100 0 20 40 60 80 100
Score % of
Priority Area Score GROUP MEAN CITY LEGEND: MIN GROUP MAX CITY MEAN LEGEND:
Islamabad
% of
% of respondents who chose the Priority Area

From a list of 15 indicators, survey respondents were asked to select 5 that they perceived as the most urgent for their city. The higher the percentage of responses per area, the greater the priority for the city.
% of respondents who agree or strongly agree with the statement
ATTITUDES
You are willing to concede personal data in order to improve traffic congestion
You are comfortable with face recognition technologies to lower crime
You feel the availability of online information has increased your trust in authorities
The proportion of your day-to-day payment transactions that are non-cash (% of transactions)
PRIORITY AREAS
City Population HDI
BACKGROUND INFORMATION
Map tiles by Stamen Design CC BY 3.0 Map Data © OpenStreetMap
Turkey HDI Life expectancy at birth Expected years of schooling Mean years of schooling GNI per capita (PPP $)
Country
sanitation meets the needs of the poorest areas
reporting of city maintenance problems provides a speedy solution Recycling services are satisfactory A website or App allows residents to easily give away unwanted items Public safety is not a problem Free public wifi has improved access to city services Air pollution is not a problem CCTV cameras has made residents feel safer Medical services provision is satisfactory A website or App allows residents to effectively monitor air pollution Finding housing with rent equal to 30% or less of a monthly salary is not a problem Arranging medical appointments online has improved access Mobility Mobility Traffic congestion is not a problem Car-sharing Apps have reduced congestion Public transport is satisfactory Apps that direct you to an available parking space have reduced journey time Bicycle hiring has reduced congestion Online scheduling and ticket sales has made public transport easier to use The city provides information on traffic congestion through mobile phones Activities Activities Green spaces are satisfactory Online purchasing of tickets to shows and museums has made it easier to attend Cultural activities (shows, bars, and museums) are satisfactory Opportunities (Work & School) Opportunities (Work & School) Employment finding services are readily available Online access to job
Health & Safety Health & Safety Basic
Online
listings has made it easier to find work
IT
Businesses
creating new jobs The current
connectivity needs Minorities feel welcome Governance Governance Information on local government decisions are easily accessible Online public access to city finances has reduced corruption Corruption of city officials is not an issue of concern Online voting has increased participation Residents contribute to decision making of local government An online platform where residents can propose ideas has improved city life Residents provide feedback on local government projects Processing Identification Documents online has reduced waiting times (UN World Urbanization Prospects) 15,190,000 0.867 (Global Data Lab)
Most children have access to a good school
skills are taught well in schools Lifelong learning opportunities are provided by local institutions Online services provided by the city has made it easier to start a new business
are
internet speed and reliability meet
73.3 74.0 62.4 57.9 STRUCTURES TECHNOLOGIES 50.9 55.8 48.7 23.0 61.2 49.1 47.4 70.4 12.0 43.2 43.6 All ratings range from AAA to D
3 64.9 GROUP CC TECHNOLOGIES CC FACTOR RATINGS C STRUCTURES 30.8 55.2 2020 76.0 +0.014 +2.4 +0.0 +0.0 40.8 46.5 55.0 21.7 24.9
54.3 1 yr change 8.8 28,381 8.8 32,834 2021 2022 0.855 78.5 19.7 19.7 2019 ▼ 107 in 2023 Out of 142 Out of 141 66.2 42.9 67.9 35.9 50.7 8.6 0.835 75.9 19.3 8.8 0.841 46.4 49.7 31,310 SMART CITY RANKING CC in 2023 51.9 45.2 28.3 43.1 35.5 50.9 49.0 52.6 SMART CITY RATING +1,524 27,950 0.842 77.8 19.2 74.6% 69.3% 41.4% 40.6% 37.9% 34.0% 33.3% 30.4% 27.4% 25.4% 25.1% 14.4% 14.0% 5.9% 4.0% 0% 20% 40% 60% 80% 100% affordable housing road congestion Green spaces security unemployment air pollution corruption / transparency public transport health services basic amenities (water, waste) fulfilling employment school education recycling social mobility / inclusiveness citizen engagement 59.4% 66.0% 60.4% 68.0% 0% 20% 40% 60% 80% 100% 0 20 40 60 80 100 0 20 40 60 80 100
110
Istanbul
Score
Score GROUP MEAN CITY LEGEND: MIN GROUP MAX
MEAN LEGEND:
CITY
Jakarta
% of respondents who chose the Priority Area

From a list of 15 indicators, survey respondents were asked to select 5 that they perceived as the most urgent for their city. The higher the percentage of responses per area, the greater the priority for the city.
% of respondents who agree or strongly agree with the statement
ATTITUDES
You are willing to concede personal data in order to improve traffic congestion
You are comfortable with face recognition technologies to lower crime
You feel the availability of online information has increased your trust in authorities
The proportion of your day-to-day payment transactions that are non-cash (% of transactions)
PRIORITY AREAS
City Population HDI
BACKGROUND INFORMATION
Map tiles by Stamen Design CC BY 3.0 Map Data © OpenStreetMap Country Indonesia HDI Life expectancy at birth Expected years of schooling Mean years of schooling GNI per capita (PPP $)
Basic sanitation meets the needs of the poorest areas Online reporting of city maintenance problems provides a speedy solution Recycling services are satisfactory A website or App allows residents to easily give away unwanted items Public safety is not a problem Free public wifi has improved access to city services Air pollution is not a problem CCTV cameras has made residents feel safer Medical services provision is satisfactory A website or App allows residents to effectively monitor air pollution Finding housing with rent equal to 30% or less of a monthly salary is not a problem Arranging medical appointments online has improved access Mobility Mobility Traffic congestion is not a problem Car-sharing Apps have reduced congestion Public transport is satisfactory Apps that direct you to an available parking space have reduced journey time Bicycle hiring has reduced congestion Online scheduling and ticket sales has made public transport easier to use The city provides information on traffic congestion through mobile phones Activities Activities Green spaces are satisfactory Online purchasing of tickets to shows and museums has made it easier to attend Cultural activities (shows, bars, and museums) are satisfactory Opportunities (Work & School) Opportunities (Work & School) Employment finding services are readily available Online access to job
work
Health & Safety Health & Safety
listings has made it easier to find
IT
Lifelong
opportunities
institutions
Businesses are creating new jobs The current
meet connectivity needs Minorities feel welcome Governance Governance Information on local government decisions are easily accessible Online public access to city finances has reduced corruption Corruption of city officials is not an issue of concern Online voting has increased participation Residents contribute to decision making of local government An online platform where residents can propose ideas has improved city life Residents provide feedback on local government projects Processing Identification Documents online has reduced waiting times (UN World Urbanization Prospects) 10,770,000 0.759 (Global Data Lab)
Most children have access to a good school
skills are taught well in schools
learning
are provided by local
Online services provided by the city has made it easier to start a new business
internet speed and reliability
84.9 75.8 83.2 76.3 STRUCTURES TECHNOLOGIES 67.8 65.6 63.6 21.9 77.7 69.8 66.8 81.1 16.9 63.7 65.3 All ratings range from AAA to D
4 60.7 GROUP CC TECHNOLOGIES CCC FACTOR RATINGS CC STRUCTURES 66.1 64.5 2020 67.6 +0.006 +0.7 +0.0 +0.0 47.1 80.5 76.6 52.3 66.4
103
72.4 1 yr change 8.6 11,206 8.6 12,046 2021 2022 0.713 68.3 14.0 14.0 2019 ▼ 102 in 2023 Out of 142 Out of 141 81.0 62.6 79.1 62.4 69.4 8.4 0.712 68.8 14.0 8.6 0.707 70.9 58.7 11,531 SMART CITY RANKING CC in 2023 72.6 52.9 19.9 67.2 68.0 68.1 58.6 78.6 SMART CITY RATING +514 11,498 0.718 70.5 13.9 68.4% 66.0% 51.7% 50.7% 46.0% 37.0% 31.9% 28.9% 24.4% 23.6% 18.2% 13.4% 12.7% 5.8% 5.8% 0% 20% 40% 60% 80% 100% air pollution road congestion corruption / transparency unemployment basic amenities (water, waste) security health services fulfilling employment affordable housing Green spaces public transport recycling school education citizen engagement social mobility / inclusiveness 69.4% 88.9% 79.6% 66.7% 0% 20% 40% 60% 80% 100% 0 20 40 60 80 100 0 20 40 60 80 100
Score
Score GROUP MEAN CITY LEGEND: MIN GROUP MAX CITY MEAN LEGEND:
Jeddah
% of respondents who chose the Priority Area

From a list of 15 indicators, survey respondents were asked to select 5 that they perceived as the most urgent for their city. The higher the percentage of responses per area, the greater the priority for the city.
% of respondents who agree or strongly agree with the statement
ATTITUDES
You are willing to concede personal data in order to improve traffic congestion
You are comfortable with face recognition technologies to lower crime
You feel the availability of online information has increased your trust in authorities
The proportion of your day-to-day payment transactions that are non-cash (% of transactions)
PRIORITY AREAS
City Population HDI
BACKGROUND INFORMATION
Map tiles by Stamen Design CC BY 3.0 Map Data © OpenStreetMap Country Saudi Arabia HDI Life expectancy at birth Expected years of schooling Mean years of schooling GNI
per capita (PPP $)
Recycling services are satisfactory A website or App
Public safety is not a problem Free public wifi has improved access to city services Air pollution is not a problem CCTV cameras has made residents feel safer Medical services provision is satisfactory A website or App allows residents to effectively monitor air pollution Finding housing with rent
to 30% or less of a monthly salary is not a problem Arranging medical appointments online has improved access
Traffic congestion
not
problem
Public
satisfactory
sales
to use
traffic
through mobile phones Activities Activities Green spaces are satisfactory Online purchasing of tickets to shows and museums has made it easier to attend Cultural activities (shows, bars, and museums) are satisfactory Opportunities (Work & School) Opportunities (Work & School) Employment finding services are readily available Online access to
Health & Safety Health & Safety Basic sanitation meets the needs of the poorest areas Online reporting of city maintenance problems provides a speedy solution
allows residents to easily give away unwanted items
equal
Mobility Mobility
is
a
Car-sharing Apps have reduced congestion
transport is
Apps that direct you to an available parking space have reduced journey time Bicycle hiring has reduced congestion Online scheduling and ticket
has made public transport easier
The city provides information on
congestion
job listings has made it easier to find work
IT
new jobs
needs Minorities feel welcome Governance Governance Information on local government decisions are easily accessible Online public access to city finances has reduced corruption Corruption of city officials is not an issue of concern Online voting has increased participation Residents contribute to decision making of local government An online platform where residents can propose ideas has improved city life Residents provide feedback on local government projects Processing Identification Documents online has reduced waiting times (UN World Urbanization Prospects) 4,780,000 0.871 (Global Data Lab)
Most children have access to a good school
skills are taught well in schools Lifelong learning opportunities are provided by local institutions Online services provided by the city has made it easier to start a new business Businesses are creating
The current internet speed and reliability meet connectivity
84.6 71.9 73.7 77.4 STRUCTURES TECHNOLOGIES 75.3 67.2 55.0 34.5 75.3 77.0 57.8 85.7 23.2 59.0 68.7 All ratings range from AAA to D
3 79.2 GROUP B TECHNOLOGIES B FACTOR RATINGS B STRUCTURES 58.1 54.8 2020 76.9 +0.008 +1.0 +0.0 +0.0 54.2 61.3 76.1 51.8 64.8
55
62.4 1 yr change 11.3 45,563 11.3 50,620 2021 2022 0.875 77.9 15.2 15.2 2019 ▲ 56 in 2023 Out of 142 Out of 141 73.2 60.4 81.5 54.6 71.2 10.9 0.861 76.2 15.2 11.3 0.867 69.0 71.2 47,441 SMART CITY RANKING B in 2023 78.6 66.5 51.1 66.9 77.6 68.2 68.8 75.0 SMART CITY RATING +3,179 47,529 0.862 77.3 15.0 68.4% 61.6% 44.4% 37.5% 34.8% 30.9% 25.8% 25.0% 23.4% 21.8% 19.2% 19.0% 15.6% 8.5% 7.5% 0% 20% 40% 60% 80% 100% affordable housing road congestion unemployment basic amenities (water, waste) Green spaces air pollution recycling fulfilling employment public transport health services corruption / transparency security school education social mobility / inclusiveness citizen engagement 57.7% 89.2% 83.8% 68.1% 0% 20% 40% 60% 80% 100% 0 20 40 60 80 100 0 20 40 60 80 100
Score
Score GROUP MEAN CITY LEGEND: MIN GROUP MAX CITY
LEGEND:
MEAN
respondents who chose the

From a list of 15 indicators, survey respondents were asked to select 5 that they perceived as the most urgent for their city. The higher the percentage of responses per area, the greater the priority for the city.
respondents who agree or strongly agree with the statement
ATTITUDES
You are willing to concede personal data in order to improve traffic congestion
You are comfortable with face recognition technologies to lower crime
You feel the availability of online information has increased your trust in authorities
The proportion of your day-to-day payment transactions that are non-cash (% of transactions)
PRIORITY AREAS
City Population HDI
BACKGROUND INFORMATION
Map tiles by Stamen Design CC BY 3.0 Map Data © OpenStreetMap Country Germany HDI Life expectancy at birth Expected years of schooling Mean years of schooling GNI per capita (PPP $)
Basic sanitation meets the needs of the poorest areas Online reporting of city maintenance problems provides a speedy solution Recycling services are satisfactory A website or App allows residents to easily give away unwanted items Public safety is not a problem Free public wifi has improved access to city services Air pollution is not a problem CCTV cameras has made residents feel safer Medical services provision is satisfactory A website or App allows residents to effectively monitor air pollution Finding housing with rent equal to 30% or less of a monthly salary is not a problem Arranging medical appointments online has improved access Mobility Mobility Traffic congestion is not a problem Car-sharing Apps have reduced congestion Public transport is satisfactory Apps that direct you to an available parking space have reduced journey time Bicycle hiring has reduced congestion Online scheduling and ticket sales has made public transport easier to use The city provides information on traffic congestion through mobile phones Activities Activities Green spaces are satisfactory Online purchasing of tickets to shows and museums has made it easier to attend Cultural activities (shows, bars, and museums) are satisfactory Opportunities (Work & School) Opportunities (Work & School) Employment finding services are readily available Online access to job
IT
Businesses are creating new jobs The current
speed and reliability meet connectivity needs Minorities feel welcome Governance Governance Information on local government decisions are easily accessible Online public access to city finances has reduced corruption Corruption of city officials is not an issue of concern Online voting has increased participation Residents contribute to decision making of local government An online platform where residents can propose ideas has improved city life Residents provide feedback on local government projects Processing Identification Documents online has reduced waiting times (Eurostat) 250,000 0.921 (Global Data Lab)
Health & Safety Health & Safety
listings has made it easier to find work Most children have access to a good school
skills are taught well in schools Lifelong learning opportunities are provided by local institutions Online services provided by the city has made it easier to start a new business
internet
66.3 43.1 65.2 59.7 STRUCTURES TECHNOLOGIES 44.7 55.6 47.0 48.9 32.0 75.8 30.7 49.0 36.3 32.0 33.5 All ratings range from AAA to D
67.2 GROUP BB TECHNOLOGIES CCC FACTOR RATINGS BBB STRUCTURES 63.9 61.3 2020 80.6 +0.002 +0.4 +0.0 +0.0 55.6 58.9 70.8 22.6 64.9
53.9 1 yr change 14.3 53,375 14.3 55,340 2021 2022 0.950 81.0 17.3 17.3 2019 ▲ 81 in 2023 Out of 142 Out of 141 65.3 53.4 47.7 50.1 38.1 14.2 0.948 81.1 17.2 14.3 0.948 58.7 71.3 55,057 SMART CITY RANKING BB in 2023 55.3 32.7 60.6 41.3 64.6 37.6 58.0 36.2 SMART CITY RATING +284 55,685 0.951 81.6 17.2 78.6% 47.2% 42.9% 38.5% 32.6% 31.1% 27.9% 24.8% 21.1% 20.2% 18.2% 15.4% 14.6% 13.0% 7.8% 0% 20% 40% 60% 80% 100% affordable housing road congestion security unemployment school education public transport air pollution citizen engagement Green spaces social mobility / inclusiveness health services basic amenities (water, waste) recycling fulfilling employment corruption / transparency 54.6% 56.3% 53.6% 66.4% 0% 20% 40% 60% 80% 100% 0 20 40 60 80 100 0 20 40 60 80 100 % of
Score % of
Priority Area Score GROUP MEAN CITY LEGEND: MIN GROUP MAX CITY MEAN LEGEND:
79 2
Kiel
Krakow
respondents who chose the

From a list of 15 indicators, survey respondents were asked to select 5 that they perceived as the most urgent for their city. The higher the percentage of responses per area, the greater the priority for the city.
% of respondents who agree or strongly agree with the statement
ATTITUDES
You are willing to concede personal data in order to improve traffic congestion
You are comfortable with face recognition technologies to lower crime
You feel the availability of online information has increased your trust in authorities
The proportion of your day-to-day payment transactions that are non-cash (% of transactions)
PRIORITY AREAS
City Population HDI
BACKGROUND INFORMATION
Map tiles by Stamen Design CC BY 3.0 Map Data © OpenStreetMap Country Poland HDI Life expectancy at birth Expected years of schooling Mean years of schooling GNI per capita (PPP $)
sanitation
reporting
Recycling services are satisfactory A website or App allows residents to easily give away unwanted items Public safety is not a problem Free public wifi has improved access to city services Air pollution is not a problem CCTV cameras has made residents feel safer Medical services provision is satisfactory A website or App allows residents to effectively monitor air pollution Finding housing with rent equal to 30% or less of a monthly salary is not a problem Arranging medical appointments online has improved access Mobility Mobility Traffic congestion is not a problem Car-sharing Apps have reduced congestion Public transport is satisfactory
that direct you to an available parking space have reduced journey time Bicycle hiring has reduced congestion
scheduling and ticket sales has made public transport easier to use
city provides information on traffic congestion through mobile phones Activities Activities Green spaces are satisfactory Online purchasing of tickets to shows and museums has made it easier to attend Cultural activities (shows, bars, and museums) are satisfactory Opportunities (Work & School) Opportunities (Work & School) Employment finding services are readily available Online access to job
Health & Safety Health & Safety Basic
meets the needs of the poorest areas Online
of city maintenance problems provides a speedy solution
Apps
Online
The
listings has made it easier to find work
IT
Businesses are creating new jobs The current
meet connectivity needs Minorities feel welcome Governance Governance Information on local government decisions are easily accessible Online public access to city finances has reduced corruption Corruption of city officials is not an issue of concern Online voting has increased participation Residents contribute to decision making of local government An online platform where residents can propose ideas has improved city life Residents provide feedback on local government projects Processing Identification Documents online has reduced waiting times (UN World Urbanization Prospects) 770,000 0.888 (Global Data Lab)
Most children have access to a good school
skills are taught well in schools Lifelong learning opportunities are provided by local institutions Online services provided by the city has made it easier to start a new business
internet speed and reliability
79.1 45.0 71.2 70.2 STRUCTURES TECHNOLOGIES 50.2 56.5 51.8 24.6 57.7 52.0 69.0 63.1 28.7 40.9 48.6 All ratings range from AAA to D
3 62.6 GROUP CCC TECHNOLOGIES CC FACTOR RATINGS CCC STRUCTURES 61.6 61.7 2020 76.5 +0.005 +0.5 +0.0 +0.0 64.8 64.6 82.7 24.9 62.9
76
53.6 1 yr change 13.2 31,293 13.2 35,151 2021 2022 0.881 77.0 15.9 15.9 2019
79 in 2023 Out of 142 Out of 141 73.6 66.5 65.0 53.1 58.9 13.1 0.874 76.9 15.8 13.2 0.876 60.8 65.5 33,264 SMART CITY RANKING CCC in 2023 64.2 42.6 41.6 51.9 68.2 53.6 70.1 57.8 SMART CITY RATING +1,887 31,772 0.880 77.9 15.9 65.4% 63.9% 48.9% 41.0% 37.0% 35.7% 33.9% 29.1% 27.2% 23.8% 15.0% 15.0% 14.7% 10.8% 10.2% 0% 20% 40% 60% 80% 100% affordable housing air pollution road congestion security health services Green spaces fulfilling employment basic amenities (water, waste) public transport recycling corruption / transparency unemployment school education social mobility / inclusiveness citizen engagement 42.3% 54.5% 55.3% 74.6% 0% 20% 40% 60% 80% 100% 0 20 40 60 80 100 0 20 40 60 80 100
Score
of
Priority Area Score GROUP MEAN CITY LEGEND: MIN GROUP MAX CITY MEAN LEGEND:
▲
%
Kuala Lumpur
of respondents who chose the Priority Area

From a list of 15 indicators, survey respondents were asked to select 5 that they perceived as the most urgent for their city. The higher the percentage of responses per area, the greater the priority for the city.
% of respondents who agree or strongly agree with the statement
ATTITUDES
You are willing to concede personal data in order to improve traffic congestion
You are comfortable with face recognition technologies to lower crime
You feel the availability of online information has increased your trust in authorities
The proportion of your day-to-day payment transactions that are non-cash (% of transactions)
PRIORITY AREAS
City Population HDI
BACKGROUND INFORMATION
Map tiles by Stamen Design CC BY 3.0 Map Data © OpenStreetMap Country Malaysia HDI Life expectancy at birth Expected years of schooling Mean years of schooling GNI per capita (PPP $)
sanitation meets the needs of the poorest areas
reporting of city maintenance problems provides a speedy solution Recycling services are satisfactory A website or App allows residents to easily give away unwanted items Public safety is not a problem Free public wifi has improved access to city services Air pollution is not a problem CCTV cameras has made residents feel safer Medical services provision is satisfactory A website or App allows residents to effectively monitor air pollution Finding housing with rent equal to 30% or less of a monthly salary is not a problem Arranging medical appointments online has improved access Mobility Mobility Traffic congestion is not a problem Car-sharing Apps have reduced congestion Public transport is satisfactory Apps that direct you to an available parking space have reduced journey time Bicycle hiring has reduced congestion Online scheduling and ticket sales has made public transport easier to use The city provides information on traffic congestion through mobile phones Activities Activities Green spaces are satisfactory Online purchasing of tickets to shows and museums has made it easier to attend Cultural activities (shows, bars, and museums) are satisfactory Opportunities (Work & School) Opportunities (Work & School) Employment finding services are readily available Online access to job
Health & Safety Health & Safety Basic
Online
listings has made it easier to find work
IT
Minorities feel welcome Governance Governance Information on local government decisions are easily accessible Online public access to city finances has reduced corruption Corruption of city officials is not an issue of concern Online voting has increased participation Residents contribute to decision making of local government An online platform where residents can propose ideas has improved city life Residents provide feedback on local government projects Processing Identification Documents online has reduced waiting times (UN Data) 1,850,000 0.858 (Global Data Lab)
Most children have access to a good school
skills are taught well in schools Lifelong learning opportunities are provided by local institutions Online services provided by the city has made it easier to start a new business Businesses are creating new jobs The current internet speed and reliability meet connectivity needs
84.3 72.8 75.4 72.0 STRUCTURES TECHNOLOGIES 61.0 57.9 54.4 37.6 72.5 76.4 57.6 76.2 23.1 61.2 53.4 All ratings range from AAA to D
70.0 GROUP B TECHNOLOGIES CCC FACTOR RATINGS B STRUCTURES 62.6 71.1 2020 74.9 +0.009 +1.4 +0.0 +0.0 50.0 76.4 71.2 44.5 61.5
73 3
61.8 1 yr change 10.7 25,314 10.7 27,295 2021 2022 0.807 76.3 12.9 12.9 2019 ▲ 89 in 2023 Out of 142 Out of 141 81.7 64.7 69.7 57.5 64.4 10.6 0.802 75.9 13.0 10.7 0.798 67.3 61.9 25,619 SMART CITY RANKING CCC in 2023 69.3 51.7 27.8 57.9 75.3 62.6 71.8 74.0 SMART CITY RATING +1,676 26,951 0.805 75.8 13.1 57.3% 53.9% 51.2% 41.2% 39.7% 33.2% 32.4% 30.2% 29.8% 26.5% 22.5% 20.7% 16.8% 12.5% 9.4% 0% 20% 40% 60% 80% 100% affordable housing road congestion corruption / transparency security unemployment air pollution basic amenities (water, waste) health services public transport fulfilling employment recycling Green spaces school education social mobility / inclusiveness citizen engagement 76.6% 81.1% 77.5% 71.0% 0% 20% 40% 60% 80% 100% 0 20 40 60 80 100 0 20 40 60 80 100
Score
Score GROUP MEAN CITY LEGEND: MIN GROUP MAX CITY MEAN LEGEND:
%
Lagos
% of respondents who chose the Priority Area

From a list of 15 indicators, survey respondents were asked to select 5 that they perceived as the most urgent for their city. The higher the percentage of responses per area, the greater the priority for the city.
% of respondents who agree or strongly agree with the statement
ATTITUDES
You are willing to concede personal data in order to improve traffic congestion
You are comfortable with face recognition technologies to lower crime
You feel the availability of online information has increased your trust in authorities
The proportion of your day-to-day payment transactions that are non-cash (% of transactions)
PRIORITY AREAS
City Population HDI
BACKGROUND INFORMATION
Map tiles by Stamen Design CC BY 3.0 Map Data © OpenStreetMap Country Nigeria HDI Life expectancy at birth Expected years of schooling Mean years of schooling GNI per capita (PPP $)
Basic sanitation meets the needs of the poorest areas
reporting of city maintenance problems provides a speedy solution Recycling services are satisfactory A website or App allows residents to easily give away unwanted items Public safety is not a problem Free public wifi has improved access to city services Air pollution is not a problem CCTV cameras has made residents feel safer Medical services provision is satisfactory A website or App allows residents to effectively monitor air pollution Finding housing with rent equal to 30% or less of a monthly salary is not a problem Arranging medical appointments online has improved access Mobility Mobility Traffic congestion is not a problem Car-sharing Apps have reduced congestion Public transport is satisfactory Apps that direct you to an available parking space have reduced journey time Bicycle hiring has reduced congestion Online scheduling and ticket sales has made public transport easier to use The city provides information on traffic congestion through mobile phones Activities Activities Green spaces are satisfactory Online purchasing of tickets to shows and museums has made it easier to attend Cultural activities (shows, bars, and museums) are satisfactory Opportunities (Work & School) Opportunities (Work & School) Employment finding services are readily available Online access to job
Health & Safety Health & Safety
Online
listings has made it easier to find work
Minorities feel welcome Governance Governance Information on local government decisions are easily accessible Online public access to city finances has reduced corruption Corruption of city officials is not an issue of concern Online voting has increased participation Residents contribute to decision making of local government An online platform where residents can propose ideas has improved city life Residents provide feedback on local government projects Processing Identification Documents online has reduced waiting times (UN World Urbanization Prospects) 14,370,000 0.681 (Global Data Lab)
Most children have access to a good school IT skills are taught well in schools Lifelong learning opportunities are provided by local institutions Online services provided by the city has made it easier to start a new business Businesses are creating new jobs The current internet speed and reliability meet connectivity needs
73.0 49.3 57.0 58.8 STRUCTURES TECHNOLOGIES 43.5 40.0 24.3 18.8 44.0 45.0 23.2 51.7 11.3 42.0 36.8 All ratings range from AAA to D 136 4 42.1 GROUP D TECHNOLOGIES D FACTOR RATINGS D STRUCTURES 30.7 38.0 2020 52.7 +0.006 +1.0 +0.0 +0.0 30.2 59.3 70.8 21.4 43.3
32.9 1 yr change 7.4 4,685 7.6 4,755 2021 2022 0.548 53.6 10.5 10.5 2019
132 in 2023 Out of 142 Out of 141 67.8 32.2 56.3 20.8 37.3 7.2 0.539 52.9 10.3 7.6 0.542 44.9 48.3 4,716 SMART CITY RANKING D in 2023 39.7 24.0 13.8 28.0 39.5 50.0 32.8 51.5 SMART CITY RATING +39 4,914 0.537 52.9 10.1 70.5% 67.2% 55.1% 54.4% 52.0% 47.3% 38.7% 23.9% 22.1% 21.4% 15.7% 8.1% 6.1% 5.7% 3.8% 0% 20% 40% 60% 80% 100% security affordable housing unemployment health services corruption / transparency road congestion basic amenities (water, waste) fulfilling employment air pollution school education public transport citizen engagement recycling Green spaces social mobility / inclusiveness 73.2% 84.2% 48.6% 63.4% 0% 20% 40% 60% 80% 100% 0 20 40 60 80 100 0 20 40 60 80 100
▼
Score
Score GROUP MEAN CITY LEGEND: MIN GROUP MAX CITY MEAN LEGEND:
Lausanne
respondents who chose the

From a list of 15 indicators, survey respondents were asked to select 5 that they perceived as the most urgent for their city. The higher the percentage of responses per area, the greater the priority for the city.
of respondents who agree or strongly agree with the statement
ATTITUDES
You are willing to concede personal data in order to improve traffic congestion
You are comfortable with face recognition technologies to lower crime
You feel the availability of online information has increased your trust in authorities
The proportion of your day-to-day payment transactions that are non-cash (% of transactions)
Health & Safety Health & Safety
PRIORITY AREAS
City Population HDI
BACKGROUND INFORMATION
Map tiles by Stamen Design CC BY 3.0 Map Data © OpenStreetMap Country Switzerland HDI Life expectancy at birth Expected years of schooling Mean years of schooling GNI per capita (PPP $)
sanitation
reporting
Recycling services are satisfactory A website or App allows residents to easily give away unwanted items Public safety is not a problem Free public wifi has improved access to city services Air pollution is not a problem CCTV cameras has made residents feel safer Medical services provision is satisfactory A website or App allows residents to effectively monitor air pollution Finding housing with rent equal to 30% or less of a monthly salary is not a problem Arranging medical appointments online has improved access Mobility Mobility Traffic congestion is not a problem Car-sharing Apps have reduced congestion Public transport is satisfactory
that direct you to an available parking space have reduced journey time Bicycle hiring has reduced congestion Online scheduling and ticket sales has made public transport easier to use The city provides information on traffic congestion through mobile phones Activities Activities Green spaces are satisfactory Online purchasing of tickets to shows and museums has made it easier to attend Cultural activities (shows, bars, and museums) are satisfactory Opportunities (Work & School) Opportunities (Work & School) Employment finding services are readily available Online access to job
Basic
meets the needs of the poorest areas Online
of city maintenance problems provides a speedy solution
Apps
listings has made it easier to find work
IT
Businesses are creating new jobs The current
speed and reliability meet connectivity needs Minorities feel welcome Governance Governance Information on local government decisions are easily accessible Online public access to city finances has reduced corruption Corruption of city officials is not an issue of concern Online voting has increased participation Residents contribute to decision making of local government An online platform where residents can propose ideas has improved city life Residents provide feedback on local government projects Processing Identification Documents online has reduced waiting times (Eurostat) 140,000 0.966 (Global Data Lab)
Most children have access to a good school
skills are taught well in schools Lifelong learning opportunities are provided by local institutions Online services provided by the city has made it easier to start a new business
internet
77.9 48.4 74.3 70.9 STRUCTURES TECHNOLOGIES 49.6 55.3 48.4 50.7 52.4 76.0 43.0 63.2 28.7 40.5 45.7 All ratings range from AAA to D 7 1 68.1 GROUP AA TECHNOLOGIES A FACTOR RATINGS AA STRUCTURES 68.5 69.9 2020 84.0 +0.002 +0.3 +0.0 +0.0 61.0 60.9 82.7 31.6 76.6
53.0 1 yr change 13.9 66,267 13.9 69,433 2021 2022 0.967 84.3 16.6 16.6 2019
5 in 2023 Out of 142 Out of 141 65.1 64.7 61.0 63.9 47.3 13.9 0.957 83.1 16.4 13.9 0.965 61.7 74.0 68,550 SMART CITY RANKING AA in 2023 66.0 41.6 54.2 49.9 83.0 65.3 73.4 49.2 SMART CITY RATING +882 67,531 0.960 83.8 16.3 81.2% 58.2% 44.7% 33.1% 27.9% 27.7% 25.8% 20.8% 20.5% 19.3% 18.1% 17.9% 15.2% 13.3% 11.0% 0% 20% 40% 60% 80% 100% affordable housing road congestion security air pollution fulfilling employment unemployment health services corruption / transparency public transport recycling Green spaces social mobility / inclusiveness citizen engagement basic amenities (water, waste) school education 57.9% 53.0% 50.7% 73.1% 0% 20% 40% 60% 80% 100% 0 20 40 60 80 100 0 20 40 60 80 100
Score % of
Area Score GROUP MEAN CITY LEGEND: MIN GROUP MAX CITY MEAN LEGEND:
▼
%
Priority
respondents who chose the

From a list of 15 indicators, survey respondents were asked to select 5 that they perceived as the most urgent for their city. The higher the percentage of responses per area, the greater the priority for the city.
% of respondents who agree or strongly agree with the statement
ATTITUDES
You are willing to concede personal data in order to improve traffic congestion
You are comfortable with face recognition technologies to lower crime
You feel the availability of online information has increased your trust in authorities
The proportion of your day-to-day payment transactions that are non-cash (% of transactions)
PRIORITY AREAS
City Population HDI
BACKGROUND INFORMATION
Map tiles by Stamen Design CC BY 3.0 Map Data © OpenStreetMap Country United Kingdom HDI Life expectancy at birth Expected years of schooling Mean years of schooling GNI per capita (PPP $)
Basic sanitation meets the needs of the poorest areas Online reporting of city maintenance problems provides a speedy solution Recycling services are satisfactory A website or App allows residents to easily give away unwanted items Public safety is not a problem Free public wifi has improved access to city services Air pollution is not a problem CCTV cameras has made residents feel safer Medical services provision is satisfactory A website or App allows residents to effectively monitor air pollution Finding housing with rent equal to 30% or less of a monthly salary is not a problem Arranging medical appointments online has improved access Mobility Mobility Traffic congestion is not a problem Car-sharing Apps have reduced congestion Public transport is satisfactory Apps that direct you to an available parking space have reduced journey time Bicycle hiring has reduced congestion Online scheduling and ticket sales has made public transport easier to use The city provides information on traffic congestion through mobile phones Activities Activities Green spaces are satisfactory Online purchasing of tickets to shows and museums has made it easier to attend Cultural activities (shows, bars, and museums) are satisfactory Opportunities (Work & School) Opportunities (Work & School) Employment finding services are readily available Online access to
IT
Lifelong learning opportunities
provided
institutions
business Businesses are creating new jobs The current
speed and reliability meet connectivity needs Minorities feel welcome Governance Governance Information on local government decisions are easily accessible Online public access to city finances has reduced corruption Corruption of city officials is not an issue of concern Online voting has increased participation Residents contribute to decision making of local government An online platform where residents can propose ideas has improved city life Residents provide feedback on local government projects Processing Identification Documents online has reduced waiting times (Eurostat) 790,000 0.908 (Global Data Lab)
Health & Safety Health & Safety
job listings has made it easier to find work Most children have access to a good school
skills are taught well in schools
are
by local
Online services provided by the city has made it easier to start a new
internet
76.1 50.8 61.5 70.4 STRUCTURES TECHNOLOGIES 46.4 64.5 41.7 39.3 58.9 58.2 35.6 52.8 26.1 40.6 44.1 All ratings range from AAA to D 72 3 63.3 GROUP CC TECHNOLOGIES CC FACTOR RATINGS CCC STRUCTURES 51.2 64.4 2020 80.7 +0.009 +1.4 +0.0 +0.0 43.7 61.5 74.7 33.9 60.2
61.6 1 yr change 13.4 40,799 13.4 46,624 2021 2022 0.940 82.2 17.6 17.6 2019
76 in 2023 Out of 142 Out of 141 68.1 52.3 57.6 45.6 52.7 13.3 0.920 80.4 17.2 13.4 0.931 64.1 65.7 44,750 SMART CITY RANKING CCC in 2023 58.1 41.9 49.5 62.2 66.3 59.5 62.2 52.6 SMART CITY RATING +1,874 47,066 0.933 81.7 17.2 70.4% 53.2% 51.5% 39.9% 35.6% 33.9% 31.1% 29.2% 20.9% 20.7% 19.7% 15.9% 15.9% 12.9% 11.5% 0% 20% 40% 60% 80% 100% affordable housing health services road congestion unemployment security public transport air pollution fulfilling employment recycling Green spaces school education citizen engagement social mobility / inclusiveness corruption / transparency basic amenities (water, waste) 57.0% 67.9% 54.0% 76.1% 0% 20% 40% 60% 80% 100% 0 20 40 60 80 100 0 20 40 60 80 100
Score % of
Priority Area Score GROUP MEAN CITY LEGEND: MIN GROUP MAX CITY MEAN LEGEND:
Leeds
▲
% of respondents who chose the Priority Area

From a list of 15 indicators, survey respondents were asked to select 5 that they perceived as the most urgent for their city. The higher the percentage of responses per area, the greater the priority for the city.
% of respondents who agree or strongly agree with the statement
ATTITUDES
You are willing to concede personal data in order to improve traffic congestion
You are comfortable with face recognition technologies to lower crime
You feel the availability of online information has increased your trust in authorities
The proportion of your day-to-day payment transactions that are non-cash (% of transactions)
PRIORITY AREAS
City Population HDI
BACKGROUND INFORMATION
Map tiles by Stamen Design CC BY 3.0 Map Data © OpenStreetMap Country France HDI Life expectancy at birth Expected years of schooling Mean years of schooling GNI per capita (PPP $)
sanitation meets the needs of the poorest areas
reporting of city maintenance problems provides a speedy solution Recycling services are satisfactory A website or App allows residents to easily give away unwanted items Public safety is not a problem Free public wifi has improved access to city services Air pollution is not a problem CCTV cameras has made residents feel safer Medical services provision is satisfactory A website or App allows residents to effectively monitor air pollution Finding housing with rent equal to 30% or less of a monthly salary is not a problem Arranging medical appointments online has improved access Mobility Mobility Traffic congestion is not a problem Car-sharing Apps have reduced congestion Public transport is satisfactory Apps that direct you to an available parking space have reduced journey time Bicycle hiring has reduced congestion Online scheduling and ticket sales has made public transport easier to use The city provides information on traffic congestion through mobile phones Activities Activities Green spaces are satisfactory Online purchasing of tickets to shows and museums has made it easier to attend Cultural activities (shows, bars, and museums) are satisfactory Opportunities (Work & School) Opportunities (Work & School) Employment finding services are readily available Online access to job
work
IT
Lifelong
provided
institutions
business Businesses are creating new jobs The current internet speed and reliability meet connectivity needs Minorities feel welcome Governance Governance Information on local government decisions are easily accessible Online public access to city finances has reduced corruption Corruption of city officials is not an issue of concern Online voting has increased participation Residents contribute to decision making of local government An online platform where residents can propose ideas has improved city life Residents provide feedback on local government projects Processing Identification Documents online has reduced waiting times (Eurostat) 910,000 0.880 (Global Data Lab)
Health & Safety Health & Safety Basic
Online
listings has made it easier to find
Most children have access to a good school
skills are taught well in schools
learning opportunities are
by local
Online services provided by the city has made it easier to start a new
75.0 56.5 68.1 69.0 STRUCTURES TECHNOLOGIES 50.7 60.2 61.0 28.0 58.1 59.4 51.8 68.4 29.4 47.1 52.3 All ratings range from AAA to D 85 3 57.9 GROUP CCC TECHNOLOGIES CC FACTOR RATINGS CCC STRUCTURES 65.0 61.6 2020 82.5 +0.004 +0.7 +0.0 +0.0 49.4 51.1 78.7 33.0 71.3
57.2 1 yr change 11.7 42,891 11.7 47,379 2021 2022 0.910 83.2 16.0 16.0 2019
84 in 2023 Out of 142 Out of 141 58.4 51.2 61.0 46.7 54.9 11.6 0.900 82.2 15.9 11.7 0.906 53.6 64.1 46,322 SMART CITY RANKING CCC in 2023 57.4 44.4 46.7 52.0 65.9 64.9 61.9 49.4 SMART CITY RATING +1,057 46,907 0.905 82.7 15.9 59.9% 55.0% 51.5% 43.3% 41.3% 28.1% 23.8% 23.8% 23.6% 21.4% 21.2% 16.6% 15.7% 12.7% 8.9% 0% 20% 40% 60% 80% 100% affordable housing security air pollution road congestion unemployment health services recycling public transport fulfilling employment Green spaces basic amenities (water, waste) school education corruption / transparency citizen engagement social mobility / inclusiveness 50.2% 66.3% 56.3% 65.6% 0% 20% 40% 60% 80% 100% 0 20 40 60 80 100 0 20 40 60 80 100
Lille
▼
Score
Score GROUP MEAN CITY LEGEND: MIN GROUP MAX CITY MEAN LEGEND:
Lima
chose

From a list of 15 indicators, survey respondents were asked to select 5 that they perceived as the most urgent for their city. The higher the percentage of responses per area, the greater the priority for the city.
respondents who agree or strongly agree with the statement
ATTITUDES
You are willing to concede personal data in order to improve traffic congestion
You are comfortable with face recognition technologies to lower crime
You feel the availability of online information has increased your trust in authorities
The proportion of your day-to-day payment transactions that are non-cash (% of transactions)
listings has made it easier to find work
PRIORITY AREAS
City Population HDI
BACKGROUND INFORMATION
Map tiles by Stamen Design CC BY 3.0 Map Data © OpenStreetMap Country Peru HDI Life expectancy at birth Expected years of schooling Mean years of schooling GNI per capita (PPP $)
sanitation meets the needs of the poorest areas
reporting of city maintenance
provides a speedy solution Recycling services are satisfactory A website or App allows residents to easily give away unwanted items Public safety is not a problem Free public wifi has improved access to city services Air pollution is not a problem CCTV cameras has made residents feel safer Medical services provision is satisfactory A website or App allows residents to effectively monitor air pollution Finding housing with rent equal to 30% or less of a monthly salary is not a problem Arranging medical appointments online has improved access Mobility Mobility Traffic congestion is not a problem Car-sharing Apps have reduced congestion Public transport is satisfactory Apps that direct you to an available parking space have reduced journey time Bicycle hiring has reduced congestion Online scheduling and ticket sales has made public transport easier to use The city provides information on traffic congestion through mobile phones Activities Activities Green spaces are satisfactory Online purchasing of tickets to shows and museums has made it easier to attend Cultural activities (shows, bars, and museums) are satisfactory Opportunities (Work & School) Opportunities (Work & School) Employment finding services are readily available Online access to job
Health & Safety Health & Safety Basic
Online
problems
Minorities feel welcome Governance Governance Information on local government decisions are easily accessible Online public access to city finances has reduced corruption Corruption of city officials is not an issue of concern Online voting has increased participation Residents contribute to decision making of local government An online platform where residents can propose ideas has improved city life Residents provide feedback on local government projects Processing Identification Documents online has reduced waiting times (UN Data) 9,560,000 0.820 (Global Data Lab)
Most children have access to a good school IT skills are taught well in schools Lifelong learning opportunities are provided by local institutions Online services provided by the city has made it easier to start a new business Businesses are creating new jobs The current internet speed and reliability meet connectivity needs
75.8 50.8 46.6 61.1 STRUCTURES TECHNOLOGIES 41.8 45.8 40.6 22.6 42.0 32.1 28.6 50.5 17.0 34.9 40.9 All ratings range from AAA to D
3 36.4 GROUP C TECHNOLOGIES C FACTOR RATINGS C STRUCTURES 23.4 55.7 2020 72.4 +0.007 +1.0 +0.0 +0.0 19.4 41.4 63.7 35.9 57.0
134
42.9 1 yr change 10.0 10,894 10.0 11,916 2021 2022 0.762 73.4 14.8 14.8 2019 ▬ 134 in 2023 Out of 142 Out of 141 62.1 32.4 61.0 24.5 37.4 9.9 0.758 73.7 14.8 10.0 0.755 31.9 45.2 11,510 SMART CITY RANKING C in 2023 32.6 23.8 16.5 33.3 20.8 41.9 33.6 55.1 SMART CITY RATING +407 12,279 0.774 76.2 14.7 89.8% 66.3% 60.4% 44.1% 42.2% 38.9% 29.5% 24.1% 23.8% 22.6% 17.7% 11.8% 9.2% 5.6% 5.2% 0% 20% 40% 60% 80% 100% security corruption / transparency health services basic amenities (water, waste) road congestion unemployment school education public transport air pollution fulfilling employment Green spaces affordable housing recycling social mobility / inclusiveness citizen engagement 62.3% 77.3% 46.9% 62.1% 0% 20% 40% 60% 80% 100% 0 20 40 60 80 100 0 20 40 60 80 100
of
Score % of
Score GROUP MEAN CITY LEGEND: MIN GROUP MAX CITY MEAN LEGEND:
%
respondents who
the Priority Area
respondents who chose the Priority

From a list of 15 indicators, survey respondents were asked to select 5 that they perceived as the most urgent for their city. The higher the percentage of responses per area, the greater the priority for the city.
respondents who agree or strongly agree with the statement
ATTITUDES
You are willing to concede personal data in order to improve traffic congestion
You are comfortable with face recognition technologies to lower crime
You feel the availability of online information has increased your trust in authorities
The proportion of your day-to-day payment transactions that are non-cash (% of transactions)
PRIORITY AREAS
City Population HDI
BACKGROUND INFORMATION
Map tiles by Stamen Design CC BY 3.0 Map Data © OpenStreetMap Country Portugal HDI Life expectancy at birth Expected years of schooling Mean years of schooling GNI per capita (PPP $)
Basic sanitation meets the needs of the poorest areas Online reporting of city maintenance problems provides a speedy solution Recycling services are satisfactory A website or App allows residents to easily give away unwanted items Public safety is not a problem Free public wifi has improved access to city services Air pollution is not a problem CCTV cameras has made residents feel safer Medical services provision is satisfactory A website or App allows residents to effectively monitor air pollution Finding housing with rent equal to 30% or less of a monthly salary is not a problem Arranging medical appointments online has improved access Mobility Mobility Traffic congestion is not a problem Car-sharing Apps have reduced congestion Public transport is satisfactory Apps that direct you to an available parking space have reduced journey time Bicycle hiring has reduced congestion Online scheduling and ticket sales has made public transport easier to use The city provides information on traffic congestion through mobile phones Activities Activities Green spaces are satisfactory Online purchasing of tickets to shows and museums has made it easier to attend Cultural activities (shows, bars, and museums) are satisfactory Opportunities (Work & School) Opportunities (Work & School) Employment finding services are readily available Online access to job
easier to find work
children
a good school IT skills are taught well in schools Lifelong learning opportunities are provided by local institutions Online services provided by the city
easier to start
business Businesses are creating new jobs The current internet speed and reliability meet connectivity needs Minorities feel welcome Governance Governance Information on local government decisions are easily accessible Online public access to city finances has reduced corruption Corruption of city officials is not an issue of concern Online voting has increased participation Residents contribute to decision making of local government An online platform where residents can propose ideas has improved city life Residents provide feedback on local government projects Processing Identification Documents online has reduced waiting times (Eurostat) 510,000 0.900 (Global Data Lab)
Health & Safety Health & Safety
listings has made it
Most
have access to
has made it
a new
81.3 46.2 60.4 66.7 STRUCTURES TECHNOLOGIES 41.5 53.7 46.8 31.8 54.4 38.7 38.6 57.6 16.3 35.3 41.1 All ratings range from AAA to D
3 61.6 GROUP C TECHNOLOGIES CC FACTOR RATINGS CC STRUCTURES 35.8 39.5 2020 81.0 +0.009 +1.2 +0.0 +0.0 50.8 41.7 74.8 8.4 63.0
52.6 1 yr change 9.6 31,510 9.6 35,315 2021 2022 0.874 82.2 16.8 16.8 2019 ▼ 99 in 2023 Out of 142 Out of 141 70.5 33.3 65.5 32.4 43.7 9.3 0.861 81.1 16.7 9.6 0.865 47.5 63.5 33,275 SMART CITY RANKING CC in 2023 45.4 27.7 16.2 39.1 48.3 52.6 44.7 50.8 SMART CITY RATING +2,040 34,036 0.864 81.7 16.6 88.3% 57.7% 53.0% 47.8% 39.1% 32.6% 32.5% 30.1% 25.5% 16.9% 15.6% 9.3% 9.1% 8.9% 7.7% 0% 20% 40% 60% 80% 100% affordable housing health services corruption / transparency road congestion public transport unemployment fulfilling employment security air pollution school education social mobility / inclusiveness basic amenities (water, waste) Green spaces recycling citizen engagement 63.4% 73.7% 59.9% 65.3% 0% 20% 40% 60% 80% 100% 0 20 40 60 80 100 0 20 40 60 80 100
of
Score % of
Area Score GROUP MEAN CITY LEGEND: MIN GROUP MAX CITY MEAN LEGEND:
108
Lisbon
%
Ljubljana
respondents who chose the

From a list of 15 indicators, survey respondents were asked to select 5 that they perceived as the most urgent for their city. The higher the percentage of responses per area, the greater the priority for the city.
% of respondents who agree or strongly agree with the statement
ATTITUDES
You are willing to concede personal data in order to improve traffic congestion
You are comfortable with face recognition technologies to lower crime
You feel the availability of online information has increased your trust in authorities
The proportion of your day-to-day payment transactions that are non-cash (% of transactions)
PRIORITY AREAS
City Population HDI
BACKGROUND INFORMATION
Map tiles by Stamen Design CC BY 3.0 Map Data © OpenStreetMap Country Slovenia HDI Life expectancy at birth Expected years of schooling Mean years of schooling GNI per capita (PPP $)
Basic sanitation meets the needs of the poorest areas Online reporting of city maintenance problems provides a speedy solution Recycling services are satisfactory A website or App allows residents to easily give away unwanted items Public safety is not a problem Free public wifi has improved access to city services Air pollution is not a problem CCTV cameras has made residents feel safer Medical services provision is satisfactory A website or App allows residents to effectively monitor air pollution Finding housing with rent equal to 30% or less of a monthly salary is not a problem Arranging medical appointments online has improved access Mobility Mobility Traffic congestion is not a problem Car-sharing Apps have reduced congestion Public transport is satisfactory Apps that direct you to an available parking space have reduced journey time Bicycle hiring has reduced congestion Online scheduling and ticket sales has made public transport easier to use The city provides information on traffic congestion through mobile phones Activities Activities Green spaces are satisfactory Online purchasing of tickets to shows and museums has made it easier to attend Cultural activities (shows, bars, and museums) are satisfactory Opportunities (Work & School) Opportunities (Work & School) Employment finding services are readily available Online access to job
work
IT
Lifelong learning opportunities
provided
institutions
Businesses are creating new jobs The current internet speed and reliability meet connectivity needs Minorities feel welcome Governance Governance Information on local government decisions are easily accessible Online public access to city finances has reduced corruption Corruption of city officials is not an issue of concern Online voting has increased participation Residents contribute to decision making of local government An online platform where residents can propose ideas has improved city life Residents provide feedback on local government projects Processing Identification Documents online has reduced waiting times (Eurostat) 290,000 0.953 (Global Data Lab)
Health & Safety Health & Safety
listings has made it easier to find
Most children have access to a good school
skills are taught well in schools
are
by local
Online services provided by the city has made it easier to start a new business
74.7 47.3 63.1 70.9 STRUCTURES TECHNOLOGIES 44.9 45.8 67.2 39.0 43.2 45.2 52.6 55.1 21.0 43.7 49.0 All ratings range from AAA to D
1 71.2 GROUP BBB TECHNOLOGIES A FACTOR RATINGS BBB STRUCTURES 53.2 59.2 2020 80.7 +0.010 +1.4 +0.0 +0.0 64.0 58.5 74.1 20.7 68.6
32
55.0 1 yr change 12.9 36,848 12.9 41,587 2021 2022 0.926 82.1 17.4 17.4 2019 ▲ 47 in 2023 Out of 142 Out of 141 68.5 44.5 52.5 37.1 45.9 12.8 0.910 80.4 17.3 12.9 0.916 58.1 72.6 39,478 SMART CITY RANKING BBB in 2023 53.2 35.4 33.7 39.4 72.3 53.7 65.9 51.1 SMART CITY RATING +2,109 38,436 0.918 81.6 17.3 65.4% 55.4% 49.7% 42.1% 36.1% 35.3% 32.3% 27.7% 25.0% 23.0% 22.0% 14.5% 13.3% 11.7% 11.0% 0% 20% 40% 60% 80% 100% affordable housing health services road congestion corruption / transparency air pollution public transport security unemployment basic amenities (water, waste) fulfilling employment Green spaces school education recycling social mobility / inclusiveness citizen engagement 47.5% 55.6% 38.7% 64.6% 0% 20% 40% 60% 80% 100% 0 20 40 60 80 100 0 20 40 60 80 100
Score % of
Priority Area Score GROUP MEAN CITY LEGEND: MIN GROUP MAX CITY MEAN LEGEND:
London
respondents who chose the

From a list of 15 indicators, survey respondents were asked to select 5 that they perceived as the most urgent for their city. The higher the percentage of responses per area, the greater the priority for the city.
% of respondents who agree or strongly agree with the statement
ATTITUDES
You are willing to concede personal data in order to improve traffic congestion
You are comfortable with face recognition technologies to lower crime
You feel the availability of online information has increased your trust in authorities
The proportion of your day-to-day payment transactions that are non-cash (% of transactions)
PRIORITY AREAS
City Population HDI
BACKGROUND INFORMATION
Map tiles by Stamen Design CC BY 3.0 Map Data © OpenStreetMap Country United Kingdom HDI Life expectancy at birth Expected years of schooling Mean years of schooling GNI per capita (PPP $)
Basic sanitation meets the needs of the poorest areas Online reporting of city maintenance problems provides a speedy solution Recycling services are satisfactory A website or App allows residents to easily give away unwanted items Public safety is not a problem Free public wifi has improved access to city services Air pollution is not a problem CCTV cameras has made residents feel safer Medical services provision is satisfactory A website or App allows residents to effectively monitor air pollution Finding housing with rent equal to 30% or less of a monthly salary is not a problem Arranging medical appointments online has improved access Mobility Mobility Traffic congestion is not a problem Car-sharing Apps have reduced congestion Public transport is satisfactory Apps that direct you to an available parking space have reduced journey time Bicycle hiring has reduced congestion Online scheduling and ticket sales has made public transport easier to use The city provides information on traffic congestion through mobile phones Activities Activities Green spaces are satisfactory Online purchasing of tickets to shows and museums has made it easier to attend Cultural activities (shows, bars, and museums) are satisfactory Opportunities (Work & School) Opportunities (Work & School) Employment finding services are readily available Online access to
IT
Lifelong learning opportunities
provided
institutions
business Businesses are creating new jobs The current
speed and reliability meet connectivity needs Minorities feel welcome Governance Governance Information on local government decisions are easily accessible Online public access to city finances has reduced corruption Corruption of city officials is not an issue of concern Online voting has increased participation Residents contribute to decision making of local government An online platform where residents can propose ideas has improved city life Residents provide feedback on local government projects Processing Identification Documents online has reduced waiting times (Eurostat) 8,870,000 0.973 (Global Data Lab)
Health & Safety Health & Safety
job listings has made it easier to find work Most children have access to a good school
skills are taught well in schools
are
by local
Online services provided by the city has made it easier to start a new
internet
74.8 64.6 65.6 69.2 STRUCTURES TECHNOLOGIES 48.7 65.0 57.4 30.6 56.8 48.5 43.9 52.1 24.9 45.1 50.8 All ratings range from AAA to D 8 1 61.7 GROUP A TECHNOLOGIES AA FACTOR RATINGS BBB STRUCTURES 58.1 65.0 2020 80.7 +0.009 +1.4 +0.0 +0.0 32.6 59.9 75.0 25.7 71.2
61.6 1 yr change 13.4 40,799 13.4 46,624 2021 2022 0.940 82.2 17.6 17.6
6 in 2023 Out of 142 Out of 141 69.1 50.8 62.2 45.3 52.5 13.3 0.920 80.4 17.2 13.4 0.931 60.9 60.4 44,750 SMART CITY RANKING A in 2023 62.4 44.3 37.7 55.4 61.4 64.4 61.5 58.1 SMART CITY RATING +1,874 47,066 0.933 81.7 17.2 73.8% 54.1% 40.4% 40.0% 40.0% 35.6% 29.3% 26.5% 22.7% 21.6% 21.4% 17.9% 16.6% 13.1% 6.2% 0% 20% 40% 60% 80% 100% affordable housing health services road congestion air pollution security unemployment public transport fulfilling employment recycling school education corruption / transparency basic amenities (water, waste) Green spaces social mobility / inclusiveness citizen engagement 59.3% 71.1% 55.9% 75.4% 0% 20% 40% 60% 80% 100% 0 20 40 60 80 100 0 20 40 60 80 100
2019 ▼
Score %
Priority Area Score GROUP MEAN CITY LEGEND: MIN GROUP MAX CITY MEAN LEGEND:
of
respondents who chose the

From a list of 15 indicators, survey respondents were asked to select 5 that they perceived as the most urgent for their city. The higher the percentage of responses per area, the greater the priority for the city.
% of respondents who agree or strongly agree with the statement
ATTITUDES
You are willing to concede personal data in order to improve traffic congestion
You are comfortable with face recognition technologies to lower crime
You feel the availability of online information has increased your trust in authorities
The proportion of your day-to-day payment transactions that are non-cash (% of transactions)
PRIORITY AREAS
City Population HDI
BACKGROUND INFORMATION
Map tiles by Stamen Design CC BY 3.0 Map Data © OpenStreetMap Country USA HDI Life expectancy at birth Expected years of schooling Mean years of schooling GNI per capita (PPP $)
Safety
Basic sanitation meets the needs of the poorest areas Online reporting of city maintenance problems provides a speedy solution Recycling services are satisfactory A website or App allows residents to easily give away unwanted items Public safety is not a problem Free public wifi has improved access to city services Air pollution is not a problem CCTV cameras has made residents feel safer Medical services provision is satisfactory A website or App allows residents to effectively monitor air pollution Finding housing with rent equal to 30% or less of a monthly salary is not a problem Arranging medical appointments online has improved access Mobility Mobility Traffic congestion is not a problem Car-sharing Apps have reduced congestion Public transport is satisfactory Apps that direct you to an available parking space have reduced journey time Bicycle hiring has reduced congestion Online scheduling and ticket sales has made public transport easier to use The city provides information on traffic congestion through mobile phones Activities Activities Green spaces are satisfactory Online purchasing of tickets to shows and museums has made it easier to attend Cultural activities (shows, bars, and museums) are satisfactory Opportunities (Work & School) Opportunities (Work & School) Employment finding services are readily available Online access to job
work
IT
Lifelong learning opportunities
provided
institutions
business Businesses are creating new jobs The current
speed and reliability meet connectivity needs Minorities feel welcome Governance Governance Information on local government decisions are easily accessible Online public access to city finances has reduced corruption Corruption of city officials is not an issue of concern Online voting has increased participation Residents contribute to decision making of local government An online platform where residents can propose ideas has improved city life Residents provide feedback on local government projects Processing Identification Documents online has reduced waiting times (UN Data) 3,900,000 0.931 (Global Data Lab)
Health &
Health & Safety
listings has made it easier to find
Most children have access to a good school
skills are taught well in schools
are
by local
Online services provided by the city has made it easier to start a new
internet
72.5 63.9 56.3 63.7 STRUCTURES TECHNOLOGIES 46.8 61.3 43.3 31.8 50.8 50.4 50.8 64.4 22.5 49.3 50.3 All ratings range from AAA to D 68 2 50.4 GROUP BB TECHNOLOGIES BB FACTOR RATINGS BB STRUCTURES 42.8 57.6 2020 77.2 +0.006 +1.0 +0.0 +0.0 32.7 57.5 70.5 28.6 55.0
55.4 1 yr change 13.7 61,077 13.6 65,565 2021 2022 0.927 78.2 16.4 16.4 2019 ▼ 50 in 2023 Out of 142 Out of 141 62.7 55.3 65.9 49.6 50.5 13.6 0.923 77.4 16.6 13.6 0.921 51.1 62.7 64,484 SMART CITY RANKING BB in 2023 58.7 43.4 33.8 59.0 50.0 48.4 53.9 52.2 SMART CITY RATING +1,081 63,654 0.933 79.1 16.6 71.3% 50.1% 47.0% 44.3% 36.8% 32.3% 31.2% 28.2% 27.2% 25.2% 21.7% 13.4% 13.4% 10.2% 6.8% 0% 20% 40% 60% 80% 100% affordable housing security road congestion health services air pollution unemployment school education corruption / transparency fulfilling employment basic amenities (water, waste) public transport recycling Green spaces social mobility / inclusiveness citizen engagement 56.6% 63.0% 50.9% 71.4% 0% 20% 40% 60% 80% 100% 0 20 40 60 80 100 0 20 40 60 80 100
Score % of
Priority Area Score GROUP MEAN CITY LEGEND: MIN GROUP MAX CITY MEAN LEGEND:
Los Angeles
respondents who chose the Priority Area

From a list of 15 indicators, survey respondents were asked to select 5 that they perceived as the most urgent for their city. The higher the percentage of responses per area, the greater the priority for the city.
% of respondents who agree or strongly agree with the statement
ATTITUDES
You are willing to concede personal data in order to improve traffic congestion
You are comfortable with face recognition technologies to lower crime
You feel the availability of online information has increased your trust in authorities
The proportion of your day-to-day payment transactions that are non-cash (% of transactions)
PRIORITY AREAS
City Population HDI
BACKGROUND INFORMATION
Map tiles by Stamen Design CC BY 3.0 Map Data © OpenStreetMap Country Luxembourg HDI Life expectancy at birth Expected years of schooling Mean years of schooling GNI per capita (PPP $)
sanitation meets the needs of the poorest areas
reporting of city maintenance problems provides a speedy solution Recycling services are satisfactory A website or App allows residents to easily give away unwanted items Public safety is not a problem Free public wifi has improved access to city services Air pollution is not a problem CCTV cameras has made residents feel safer Medical services provision is satisfactory A website or App allows residents to effectively monitor air pollution Finding housing with rent equal to 30% or less of a monthly salary is not a problem Arranging medical appointments online has improved access Mobility Mobility Traffic congestion is not a problem Car-sharing Apps have reduced congestion Public transport is satisfactory Apps that direct you to an available parking space have reduced journey time Bicycle hiring has reduced congestion Online scheduling and ticket sales has made public transport easier to use The city provides information on traffic congestion through mobile phones Activities Activities Green spaces are satisfactory Online purchasing of tickets to shows and museums has made it easier to attend Cultural activities (shows, bars, and museums) are satisfactory Opportunities (Work & School) Opportunities (Work & School) Employment finding services are readily available Online access to job
Health & Safety Health & Safety Basic
Online
listings has made it easier to find work
IT
Businesses are creating new jobs The current
speed
reliability
needs Minorities feel welcome Governance Governance Information on local government decisions are easily accessible Online public access to city finances has reduced corruption Corruption of city officials is not an issue of concern Online voting has increased participation Residents contribute to decision making of local government An online platform where residents can propose ideas has improved city life Residents provide feedback on local government projects Processing Identification Documents online has reduced waiting times (Eurostat) 120,000 0.930 (Global Data Lab)
Most children have access to a good school
skills are taught well in schools Lifelong learning opportunities are provided by local institutions Online services provided by the city has made it easier to start a new business
internet
and
meet connectivity
80.0 54.2 57.4 75.9 STRUCTURES TECHNOLOGIES 52.6 56.0 47.0 57.8 48.1 80.4 35.4 74.4 26.1 35.8 37.7 All ratings range from AAA to D
79.6 GROUP BBB TECHNOLOGIES BB FACTOR RATINGS A STRUCTURES 73.0 68.3 2020 82.6 +0.000 -0.0 +0.0 +0.0 67.3 61.2 76.5 16.8 81.1
61.8 1 yr change 13.0 76,504 13.0 78,554 2021 2022 0.927 82.6 14.2 14.2 2019 ▲ 45 in 2023 Out of 142 Out of 141 66.0 54.8 67.5 52.7 44.4 13.0 0.921 81.4 14.2 13.0 0.927 65.4 84.7 78,651 SMART CITY RANKING BB in 2023 72.8 37.8 57.8 40.8 84.7 57.0 73.8 52.1 SMART CITY RATING -96 77,423 0.925 82.1 14.2 85.9% 68.9% 46.7% 34.5% 27.7% 23.3% 19.7% 19.4% 18.7% 17.5% 17.3% 15.5% 13.9% 13.8% 8.7% 0% 20% 40% 60% 80% 100% affordable housing road congestion security unemployment fulfilling employment citizen engagement air pollution health services corruption / transparency social mobility / inclusiveness public transport school education Green spaces recycling basic amenities (water, waste) 52.0% 69.6% 63.5% 70.6% 0% 20% 40% 60% 80% 100% 0 20 40 60 80 100 0 20 40 60 80 100
Score
of
Score GROUP MEAN CITY LEGEND: MIN GROUP MAX CITY MEAN LEGEND:
27 2
Luxembourg
%
Lyon
of respondents who chose the Priority Area

From a list of 15 indicators, survey respondents were asked to select 5 that they perceived as the most urgent for their city. The higher the percentage of responses per area, the greater the priority for the city.
% of respondents who agree or strongly agree with the statement
ATTITUDES
You are willing to concede personal data in order to improve traffic congestion
You are comfortable with face recognition technologies to lower crime
You feel the availability of online information has increased your trust in authorities
The proportion of your day-to-day payment transactions that are non-cash (% of transactions)
PRIORITY AREAS
City Population HDI
BACKGROUND INFORMATION
Map tiles by Stamen Design CC BY 3.0 Map Data © OpenStreetMap Country France HDI Life expectancy at birth Expected years of schooling Mean years of schooling GNI per capita (PPP $)
Basic sanitation meets the needs of the poorest areas Online reporting of city maintenance problems provides a speedy solution Recycling services are satisfactory A website or App allows residents to easily give away unwanted items Public safety is not a problem Free public wifi has improved access to city services Air pollution is not a problem CCTV cameras has made residents feel safer Medical services provision is satisfactory A website or App allows residents to effectively monitor air pollution Finding housing with rent equal to 30% or less of a monthly salary is not a problem Arranging medical appointments online has improved access Mobility Mobility Traffic congestion is not a problem Car-sharing Apps have reduced congestion Public transport is satisfactory Apps that direct you to an available parking space have reduced journey time Bicycle hiring has reduced congestion Online scheduling and ticket sales has made public transport easier to use The city provides information on traffic congestion through mobile phones Activities Activities Green spaces are satisfactory Online purchasing of tickets to shows and museums has made it easier to attend Cultural activities (shows, bars, and museums) are satisfactory Opportunities (Work & School) Opportunities (Work & School) Employment finding services are readily available Online access to job
work
children
good school IT skills
taught
in schools Lifelong learning opportunities are provided
local institutions
services provided
the
easier
business Businesses are creating new jobs The current internet speed and reliability meet connectivity needs Minorities feel welcome Governance Governance Information on local government decisions are easily accessible Online public access to city finances has reduced corruption Corruption of city officials is not an issue of concern Online voting has increased participation Residents contribute to decision making of local government An online platform where residents can propose ideas has improved city life Residents provide feedback on local government projects Processing Identification Documents online has reduced waiting times (Eurostat) 1,080,000 0.914 (Global Data Lab)
Health & Safety Health & Safety
listings has made it easier to find
Most
have access to a
are
well
by
Online
by
city has made it
to start a new
78.3 61.7 65.4 72.6 STRUCTURES TECHNOLOGIES 48.6 59.6 59.1 19.2 58.4 58.8 52.5 70.9 25.2 48.3 52.2 All ratings range from AAA to D
2 58.2 GROUP BB TECHNOLOGIES BBB FACTOR RATINGS BB STRUCTURES 63.6 66.1 2020 82.5 +0.004 +0.7 +0.0 +0.0 43.4 61.5 82.6 29.6 75.9
61
58.6 1 yr change 11.7 42,891 11.7 47,379 2021 2022 0.910 83.2 16.0 16.0 2019 ▲ 64 in 2023 Out of 142 Out of 141 62.3 49.8 62.2 47.6 51.9 11.6 0.900 82.2 15.9 11.7 0.906 49.7 61.9 46,322 SMART CITY RANKING BB in 2023 56.7 42.5 45.5 50.5 67.8 59.6 61.9 52.8 SMART CITY RATING +1,057 46,907 0.905 82.7 15.9 66.6% 62.0% 58.7% 57.2% 33.2% 26.6% 23.1% 22.0% 21.8% 18.5% 15.6% 14.9% 14.7% 12.2% 8.8% 0% 20% 40% 60% 80% 100% affordable housing air pollution security road congestion unemployment health services recycling public transport fulfilling employment basic amenities (water, waste) school education social mobility / inclusiveness Green spaces corruption / transparency citizen engagement 51.9% 63.6% 55.9% 66.9% 0% 20% 40% 60% 80% 100% 0 20 40 60 80 100 0 20 40 60 80 100
Score
Score GROUP MEAN CITY LEGEND: MIN GROUP MAX CITY MEAN LEGEND:
%
Madrid
of respondents who chose the Priority Area

From a list of 15 indicators, survey respondents were asked to select 5 that they perceived as the most urgent for their city. The higher the percentage of responses per area, the greater the priority for the city.
% of respondents who agree or strongly agree with the statement
ATTITUDES
You are willing to concede personal data in order to improve traffic congestion
You are comfortable with face recognition technologies to lower crime
You feel the availability of online information has increased your trust in authorities
The proportion of your day-to-day payment transactions that are non-cash (% of transactions)
Health & Safety Health & Safety
PRIORITY AREAS
City Population HDI
BACKGROUND INFORMATION
Map tiles by Stamen Design CC BY 3.0 Map Data © OpenStreetMap
Spain HDI Life expectancy at birth Expected years of schooling Mean years of schooling GNI per capita (PPP $)
Country
sanitation
Recycling services are satisfactory A website or App allows residents to easily give away unwanted items Public safety is not a problem Free public wifi has improved access to city services Air pollution is not a problem CCTV cameras has made residents feel safer Medical services provision is satisfactory A website or App allows residents to effectively monitor air pollution Finding housing with rent equal to 30% or less of a monthly salary is not a problem Arranging medical appointments online has improved access
Mobility Traffic congestion is not a problem Car-sharing Apps have reduced congestion Public transport is satisfactory
that direct you to an available parking space have reduced journey time Bicycle hiring has reduced congestion
scheduling and ticket sales has made public transport easier to use
city provides information on traffic congestion through mobile phones Activities Activities Green spaces are satisfactory Online purchasing of tickets to shows and museums has made it easier to attend Cultural activities (shows, bars, and museums) are satisfactory Opportunities (Work & School) Opportunities (Work & School) Employment finding services are readily available Online access to job
work
Basic
meets the needs of the poorest areas Online reporting of city maintenance problems provides a speedy solution
Mobility
Apps
Online
The
listings has made it easier to find
IT
institutions
Businesses are creating new jobs The current
reliability
needs Minorities feel welcome Governance Governance Information on local government decisions are easily accessible Online public access to city finances has reduced corruption Corruption of city officials is not an issue of concern Online voting has increased participation Residents contribute to decision making of local government An online platform where residents can propose ideas has improved city life Residents provide feedback on local government projects Processing Identification Documents online has reduced waiting times (Eurostat) 3,270,000 0.940 (Global Data Lab)
Most children have access to a good school
skills are taught well in schools Lifelong learning opportunities are provided by local
Online services provided by the city has made it easier to start a new business
internet speed and
meet connectivity
78.7 68.5 70.8 77.1 STRUCTURES TECHNOLOGIES 51.0 57.5 55.4 32.3 54.6 49.3 47.9 63.0 24.0 49.9 55.9 All ratings range from AAA to D
63.2 GROUP BB TECHNOLOGIES BBB FACTOR RATINGS BB STRUCTURES 63.4 72.9 2020 83.0 +0.007 +0.9 +0.0 +0.0 55.6 51.2 79.6 21.0 71.5
35 2
51.8 1 yr change 10.6 36,076 10.6 40,043 2021 2022 0.911 83.9 17.8 17.8 2019 ▲ 37 in 2023 Out of 142 Out of 141 64.7 43.7 64.8 39.4 52.9 10.4 0.894 82.3 17.5 10.6 0.904 55.0 64.1 38,133 SMART CITY RANKING BB in 2023 54.0 39.3 33.3 50.5 64.9 58.9 68.1 56.0 SMART CITY RATING +1,911 40,854 0.904 83.5 17.5 72.1% 59.0% 57.4% 41.8% 38.0% 35.9% 30.5% 25.2% 23.5% 21.6% 17.2% 16.9% 12.8% 12.1% 10.2% 0% 20% 40% 60% 80% 100% affordable housing fulfilling employment health services unemployment security air pollution corruption / transparency road congestion school education public transport basic amenities (water, waste) Green spaces recycling citizen engagement social mobility / inclusiveness 62.6% 72.6% 59.7% 68.7% 0% 20% 40% 60% 80% 100% 0 20 40 60 80 100 0 20 40 60 80 100
Score
Score GROUP MEAN CITY LEGEND: MIN GROUP MAX CITY MEAN LEGEND:
%
Makassar
% of respondents who chose the Priority Area

From a list of 15 indicators, survey respondents were asked to select 5 that they perceived as the most urgent for their city. The higher the percentage of responses per area, the greater the priority for the city.
% of respondents who agree or strongly agree with the statement
ATTITUDES
You are willing to concede personal data in order to improve traffic congestion
You are comfortable with face recognition technologies to lower crime
You feel the availability of online information has increased your trust in authorities
The proportion of your day-to-day payment transactions that are non-cash (% of transactions)
PRIORITY AREAS
City Population HDI
BACKGROUND INFORMATION
Map tiles by Stamen Design CC BY 3.0 Map Data © OpenStreetMap Country Indonesia HDI Life expectancy at birth Expected years of schooling Mean years of schooling GNI per capita (PPP $)
Basic sanitation meets the needs of the poorest areas Online reporting of city maintenance problems provides a speedy solution Recycling services are satisfactory A website or App allows residents to easily give away unwanted items Public safety is not a problem Free public wifi has improved access to city services Air pollution is not a problem CCTV cameras has made residents feel safer Medical services provision is satisfactory A website or App allows residents to effectively monitor air pollution Finding housing with rent equal to 30% or less of a monthly salary is not a problem Arranging medical appointments online has improved access Mobility Mobility Traffic congestion is not a problem Car-sharing Apps have reduced congestion Public transport is satisfactory Apps that direct you to an available parking space have reduced journey time Bicycle hiring has reduced congestion Online scheduling and ticket sales has made public transport easier to use The city provides information on traffic congestion through mobile phones Activities Activities Green spaces are satisfactory Online purchasing of tickets to shows and museums has made it easier to attend Cultural activities (shows, bars, and museums) are satisfactory Opportunities (Work & School) Opportunities (Work & School) Employment finding services are readily available Online access to job
Health & Safety Health & Safety
listings has made it easier to find work
IT
Businesses
new jobs The current
connectivity needs Minorities feel welcome Governance Governance Information on local government decisions are easily accessible Online public access to city finances has reduced corruption Corruption of city officials is not an issue of concern Online voting has increased participation Residents contribute to decision making of local government An online platform where residents can propose ideas has improved city life Residents provide feedback on local government projects Processing Identification Documents online has reduced waiting times (UN World Urbanization Prospects) 1,580,000 0.699 (Global Data Lab)
Most children have access to a good school
skills are taught well in schools Lifelong learning opportunities are provided by local institutions Online services provided by the city has made it easier to start a new business
are creating
internet speed and reliability meet
67.8 59.3 72.1 68.4 STRUCTURES TECHNOLOGIES 52.4 53.8 45.1 38.4 68.9 65.7 52.2 74.0 30.3 51.1 49.1 All ratings range from AAA to D
4 58.9 GROUP CC TECHNOLOGIES CC FACTOR RATINGS CC STRUCTURES 55.9 57.7 2020 67.6 +0.006 +0.7 +0.0 +0.0 48.1 78.5 65.0 60.4 61.3
115
52.2 1 yr change 8.6 11,206 8.6 12,046 2021 2022 0.713 68.3 14.0 14.0 2019 ▼ 114 in 2023 Out of 142 Out of 141 73.9 55.0 71.0 56.3 58.2 8.4 0.712 68.8 14.0 8.6 0.707 73.6 51.6 11,531 SMART CITY RANKING CC in 2023 62.0 47.5 22.5 56.1 67.5 64.2 56.5 68.4 SMART CITY RATING +514 11,498 0.718 70.5 13.9 52.6% 52.5% 49.6% 49.3% 43.5% 38.4% 31.8% 27.5% 26.5% 24.0% 22.8% 22.1% 21.1% 12.2% 11.8% 0% 20% 40% 60% 80% 100% road congestion unemployment corruption / transparency basic amenities (water, waste) security health services public transport Green spaces air pollution fulfilling employment affordable housing recycling school education citizen engagement social mobility / inclusiveness 67.2% 84.3% 75.9% 62.7% 0% 20% 40% 60% 80% 100% 0 20 40 60 80 100 0 20 40 60 80 100
Score
Score GROUP MEAN CITY LEGEND: MIN GROUP MAX CITY MEAN LEGEND:
of respondents who chose the Priority Area

From a list of 15 indicators, survey respondents were asked to select 5 that they perceived as the most urgent for their city. The higher the percentage of responses per area, the greater the priority for the city.
% of respondents who agree or strongly agree with the statement
ATTITUDES
You are willing to concede personal data in order to improve traffic congestion
You are comfortable with face recognition technologies to lower crime
You feel the availability of online information has increased your trust in authorities
The proportion of your day-to-day payment transactions that are non-cash (% of transactions)
PRIORITY AREAS
City Population HDI
BACKGROUND INFORMATION
Map tiles by Stamen Design CC BY 3.0 Map Data © OpenStreetMap Country United Kingdom HDI Life expectancy at birth Expected years of schooling Mean years of schooling GNI per capita (PPP $)
Basic sanitation meets the needs of the poorest areas Online reporting of city maintenance problems provides a speedy solution Recycling services are satisfactory A website or App allows residents to easily give away unwanted items Public safety is not a problem Free public wifi has improved access to city services Air pollution is not a problem CCTV cameras has made residents feel safer Medical services provision is satisfactory A website or App allows residents to effectively monitor air pollution Finding housing with rent equal to 30% or less of a monthly salary is not a problem Arranging medical appointments online has improved access Mobility Mobility Traffic congestion is not a problem Car-sharing Apps have reduced congestion Public transport is satisfactory Apps that direct you to an available parking space have reduced journey time Bicycle hiring has reduced congestion Online scheduling and ticket sales has made public transport easier to use The city provides information on traffic congestion through mobile phones Activities Activities Green spaces are satisfactory Online purchasing of tickets to shows and museums has made it easier to attend Cultural activities (shows, bars, and museums) are satisfactory Opportunities (Work & School) Opportunities (Work & School) Employment finding services are readily available Online access to job listings has
easier to find work
children have access to a good school IT skills are taught well in schools Lifelong learning opportunities are provided by local institutions Online services provided by the city has made it easier to start a new business Businesses are creating new jobs The current internet speed and reliability meet connectivity needs Minorities feel welcome Governance Governance Information on local government decisions are easily accessible Online public access to city finances has reduced corruption Corruption of city officials is not an issue of concern Online voting has increased participation Residents contribute to decision making of local government An online platform where residents can propose ideas has improved city life Residents provide feedback on local government projects Processing Identification Documents online has reduced waiting times (Eurostat) 550,000 0.915 (Global Data Lab)
Health & Safety Health & Safety
made it
Most
75.5 52.8 60.2 69.7 STRUCTURES TECHNOLOGIES 43.2 66.0 45.2 36.9 57.9 51.6 30.7 51.7 28.9 38.9 40.5 All ratings range from AAA to D 71 2 63.0 GROUP BB TECHNOLOGIES BB FACTOR RATINGS BB STRUCTURES 59.9 64.2 2020 80.7 +0.009 +1.4 +0.0 +0.0 39.7 60.7 75.4 30.2 59.3
59.7 1 yr change 13.4 40,799 13.4 46,624 2021 2022 0.940 82.2 17.6 17.6 2019 ▲ 73 in 2023 Out of 142 Out of 141 66.9 52.9 57.4 46.8 47.4 13.3 0.920 80.4 17.2 13.4 0.931 67.8 66.4 44,750 SMART CITY RANKING BB in 2023 58.8 40.7 43.7 56.6 66.1 60.2 62.6 51.6 SMART CITY RATING +1,874 47,066 0.933 81.7 17.2 75.6% 54.5% 42.8% 40.1% 34.6% 29.9% 26.8% 26.6% 25.1% 24.3% 18.5% 18.1% 14.3% 13.7% 11.6% 0% 20% 40% 60% 80% 100% affordable housing health services unemployment road congestion security air pollution public transport fulfilling employment school education Green spaces recycling corruption / transparency social mobility / inclusiveness basic amenities (water, waste) citizen engagement 51.0% 70.9% 53.0% 73.5% 0% 20% 40% 60% 80% 100% 0 20 40 60 80 100 0 20 40 60 80 100
Score
Score GROUP MEAN CITY LEGEND: MIN GROUP MAX CITY MEAN LEGEND:
Manchester
%
Manila
respondents who chose the Priority

From a list of 15 indicators, survey respondents were asked to select 5 that they perceived as the most urgent for their city. The higher the percentage of responses per area, the greater the priority for the city.
% of respondents who agree or strongly agree with the statement
ATTITUDES
You are willing to concede personal data in order to improve traffic congestion
You are comfortable with face recognition technologies to lower crime
You feel the availability of online information has increased your trust in authorities
The proportion of your day-to-day payment transactions that are non-cash (% of transactions)
PRIORITY AREAS
City Population HDI
BACKGROUND INFORMATION
Map tiles by Stamen Design CC BY 3.0 Map Data © OpenStreetMap Country Philippines HDI Life expectancy at birth Expected years of schooling Mean years of schooling GNI per capita (PPP $)
Basic sanitation meets the needs of the poorest areas Online reporting of city maintenance problems provides a speedy solution Recycling services are satisfactory A website or App allows residents to easily give away unwanted items Public safety is not a problem Free public wifi has improved access to city services Air pollution is not a problem CCTV cameras has made residents feel safer Medical services provision is satisfactory A website or App allows residents to effectively monitor air pollution Finding housing with rent equal to 30% or less of a monthly salary is not a problem Arranging medical appointments online has improved access Mobility Mobility Traffic congestion is not a problem Car-sharing Apps have reduced congestion Public transport is satisfactory Apps that direct you to an available parking space have reduced journey time Bicycle hiring has reduced congestion Online scheduling and ticket sales has made public transport easier to use The city provides information on traffic congestion through mobile phones Activities Activities Green spaces are satisfactory Online purchasing of tickets to shows and museums has made it easier to attend Cultural activities (shows, bars, and museums) are satisfactory Opportunities (Work & School) Opportunities (Work & School) Employment finding services are readily available Online access to job
Health & Safety Health & Safety
listings has made it easier to find work
IT
jobs
needs Minorities feel welcome Governance Governance Information on local government decisions are easily accessible Online public access to city finances has reduced corruption Corruption of city officials is not an issue of concern Online voting has increased participation Residents contribute to decision making of local government An online platform where residents can propose ideas has improved city life Residents provide feedback on local government projects Processing Identification Documents online has reduced waiting times (UN World Urbanization Prospects) 1,850,000 0.760 (Global Data Lab)
Most children have access to a good school
skills are taught well in schools Lifelong learning opportunities are provided by local institutions Online services provided by the city has made it easier to start a new business Businesses are creating new
The current internet speed and reliability meet connectivity
74.2 62.4 60.3 51.6 STRUCTURES TECHNOLOGIES 53.7 48.0 49.2 18.2 69.4 50.2 40.0 67.5 13.3 48.5 46.3 All ratings range from AAA to D
4 48.7 GROUP C TECHNOLOGIES C FACTOR RATINGS C STRUCTURES 33.9 58.1 2020 69.3 +0.018 +2.9 +0.0 +0.0 35.2 71.6 68.5 33.6 50.1
121
54.0 1 yr change 9.0 8,355 9.0 9,059 2021 2022 0.710 72.2 12.8 12.8 2019
115 in 2023 Out of 142 Out of 141 75.7 57.2 68.5 44.0 53.5 9.0 0.705 72.1 12.8 9.0 0.692 55.3 50.7 8,369 SMART CITY RANKING C in 2023 59.5 44.5 16.8 59.6 47.5 59.7 52.6 66.5 SMART CITY RATING +690 9,590 0.714 71.9 13.0 53.9% 50.6% 45.9% 43.8% 42.2% 42.0% 39.8% 38.1% 36.9% 27.9% 22.4% 19.0% 12.9% 4.8% 4.7% 0% 20% 40% 60% 80% 100% health services corruption / transparency unemployment public transport road congestion security affordable housing air pollution basic amenities (water, waste) fulfilling employment school education recycling Green spaces social mobility / inclusiveness citizen engagement 67.2% 77.5% 63.2% 61.0% 0% 20% 40% 60% 80% 100% 0 20 40 60 80 100 0 20 40 60 80 100
Score
of
Score GROUP MEAN CITY LEGEND: MIN GROUP MAX CITY MEAN LEGEND:
▼
%
Area
chose the

From a list of 15 indicators, survey respondents were asked to select 5 that they perceived as the most urgent for their city. The higher the percentage of responses per area, the greater the priority for the city.
respondents who agree or strongly agree with the statement
ATTITUDES
You are willing to concede personal data in order to improve traffic congestion
You are comfortable with face recognition technologies to lower crime
You feel the availability of online information has increased your trust in authorities
The proportion of your day-to-day payment transactions that are non-cash (% of transactions)
PRIORITY AREAS
City Population HDI
BACKGROUND INFORMATION
Map tiles by Stamen Design CC BY 3.0 Map Data © OpenStreetMap Country France HDI Life expectancy at birth Expected years of schooling Mean years of schooling GNI per capita (PPP $)
Basic sanitation meets the needs of the poorest areas Online reporting of city maintenance problems provides a speedy solution Recycling services are satisfactory A website or App allows residents to easily give away unwanted items Public safety is not a problem Free public wifi has improved access to city services Air pollution is not a problem CCTV cameras has made residents feel safer Medical services provision is satisfactory A website or App allows residents to effectively monitor air pollution Finding housing with rent equal to 30% or less of a monthly salary is not a problem Arranging medical appointments online has improved access Mobility Mobility Traffic congestion is not a problem Car-sharing Apps have reduced congestion Public transport is satisfactory Apps that direct you to an available parking space have reduced journey time Bicycle hiring has reduced congestion Online scheduling and ticket sales has made public transport easier to use The city provides information on traffic congestion through mobile phones Activities Activities Green spaces are satisfactory Online purchasing of tickets to shows and museums has made it easier to attend Cultural activities (shows, bars, and museums) are satisfactory Opportunities (Work & School) Opportunities (Work & School) Employment finding services are readily available Online access to job
easier to find work
children
a good school IT skills are taught well in schools Lifelong learning opportunities are provided by local institutions Online services provided by the city has
it easier to start a new business Businesses are creating new jobs The current internet speed and reliability meet connectivity needs Minorities feel welcome Governance Governance Information on local government decisions are easily accessible Online public access to city finances has reduced corruption Corruption of city officials is not an issue of concern Online voting has increased participation Residents contribute to decision making of local government An online platform where residents can propose ideas has improved city life Residents provide feedback on local government projects Processing Identification Documents online has reduced waiting times (Eurostat) 900,000 0.899 (Global Data Lab)
Health & Safety Health & Safety
listings has made it
Most
have access to
made
71.9 52.6 60.2 61.2 STRUCTURES TECHNOLOGIES 41.8 55.3 52.3 22.4 49.3 55.6 44.9 65.2 24.0 40.2 47.6 All ratings range from AAA to D
3 45.6 GROUP CC TECHNOLOGIES CC FACTOR RATINGS CC STRUCTURES 49.7 54.0 2020 82.5 +0.004 +0.7 +0.0 +0.0 34.6 49.4 66.3 32.1 54.6
57.5 1 yr change 11.7 42,891 11.7 47,379 2021 2022 0.910 83.2 16.0 16.0 2019 ▼ 101 in 2023 Out of 142 Out of 141 51.7 43.2 54.8 38.3 43.6 11.6 0.900 82.2 15.9 11.7 0.906 46.6 40.6 46,322 SMART CITY RANKING CC in 2023 50.1 38.4 36.5 46.4 49.3 52.9 48.5 47.5 SMART CITY RATING +1,057 46,907 0.905 82.7 15.9 73.0% 53.5% 46.2% 45.9% 34.6% 30.1% 30.0% 26.1% 24.0% 21.0% 20.3% 18.8% 14.8% 10.8% 7.7% 0% 20% 40% 60% 80% 100% security affordable housing road congestion air pollution unemployment recycling basic amenities (water, waste) corruption / transparency public transport Green spaces health services school education fulfilling employment social mobility / inclusiveness citizen engagement 48.9% 55.2% 45.8% 64.0% 0% 20% 40% 60% 80% 100% 0 20 40 60 80 100 0 20 40 60 80 100 % of
Score % of
Area Score GROUP MEAN CITY LEGEND: MIN GROUP MAX CITY MEAN LEGEND:
104
Marseille
respondents who
Priority
Mecca
% of respondents who chose the Priority Area
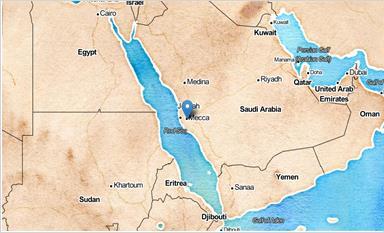
From a list of 15 indicators, survey respondents were asked to select 5 that they perceived as the most urgent for their city. The higher the percentage of responses per area, the greater the priority for the city.
% of respondents who agree or strongly agree with the statement
ATTITUDES
You are willing to concede personal data in order to improve traffic congestion
You are comfortable with face recognition technologies to lower crime
You feel the availability of online information has increased your trust in authorities
The proportion of your day-to-day payment transactions that are non-cash (% of transactions)
PRIORITY AREAS
City Population HDI
BACKGROUND INFORMATION
Map tiles by Stamen Design CC BY 3.0 Map Data © OpenStreetMap Country Saudi Arabia HDI Life expectancy at birth Expected years of schooling Mean years of schooling GNI per capita (PPP $)
Recycling services are satisfactory A website or App
residents
items Public safety is not a problem Free public wifi has improved access to city services Air pollution is not a problem CCTV cameras has made residents feel safer Medical services provision is satisfactory A website or App allows residents to effectively monitor air pollution Finding housing with rent equal to 30% or less of a monthly salary is not a problem Arranging medical appointments online has improved access
Traffic congestion is not a problem Car-sharing
congestion Public transport is satisfactory
time
congestion
scheduling and ticket sales has made public transport easier to use
city provides information on traffic congestion through mobile phones Activities Activities Green spaces are satisfactory Online purchasing of tickets to shows and museums has made it easier to attend Cultural activities (shows, bars, and museums) are satisfactory Opportunities (Work & School) Opportunities (Work & School) Employment finding services are readily available Online access to
Health & Safety Health & Safety Basic sanitation meets the needs of the poorest areas Online reporting of city maintenance problems provides a speedy solution
allows
to easily give away unwanted
Mobility Mobility
Apps have reduced
Apps that direct you to an available parking space have reduced journey
Bicycle hiring has reduced
Online
The
job listings has made it easier to find work
IT
Businesses are creating new jobs
current
connectivity needs Minorities feel welcome Governance Governance Information on local government decisions are easily accessible Online public access to city finances has reduced corruption Corruption of city officials is not an issue of concern Online voting has increased participation Residents contribute to decision making of local government An online platform where residents can propose ideas has improved city life Residents provide feedback on local government projects Processing Identification Documents online has reduced waiting times (UN World Urbanization Prospects) 2,110,000 0.871 (Global Data Lab)
Most children have access to a good school
skills are taught well in schools Lifelong learning opportunities are provided by local institutions Online services provided by the city has made it easier to start a new business
The
internet speed and reliability meet
76.5 67.7 73.2 78.3 STRUCTURES TECHNOLOGIES 73.1 64.2 51.7 34.6 77.5 75.1 57.3 80.4 42.2 69.2 68.6 All ratings range from AAA to D
3 82.6 GROUP B TECHNOLOGIES B FACTOR RATINGS B STRUCTURES 72.5 54.3 2020 76.9 +0.008 +1.0 +0.0 +0.0 50.1 65.6 70.6 57.4 65.9
52
60.0 1 yr change 11.3 45,563 11.3 50,620 2021 2022 0.875 77.9 15.2 15.2 2019 ▬ 52 in 2023 Out of 142 Out of 141 72.2 57.7 83.6 56.6 70.1 10.9 0.861 76.2 15.2 11.3 0.867 66.7 70.1 47,441 SMART CITY RANKING B in 2023 78.7 69.5 51.0 70.3 75.9 74.1 67.9 74.4 SMART CITY RATING +3,179 47,529 0.862 77.3 15.0 65.4% 47.0% 43.6% 32.5% 30.7% 30.1% 29.6% 29.0% 27.4% 21.3% 20.7% 18.9% 17.7% 15.2% 13.3% 0% 20% 40% 60% 80% 100% affordable housing unemployment road congestion health services basic amenities (water, waste) fulfilling employment Green spaces air pollution recycling security corruption / transparency public transport school education social mobility / inclusiveness citizen engagement 50.1% 81.5% 81.0% 61.3% 0% 20% 40% 60% 80% 100% 0 20 40 60 80 100 0 20 40 60 80 100
Score
Score GROUP MEAN CITY LEGEND: MIN GROUP MAX CITY MEAN LEGEND:
Medan
% of respondents who chose the Priority Area
112

From a list of 15 indicators, survey respondents were asked to select 5 that they perceived as the most urgent for their city. The higher the percentage of responses per area, the greater the priority for the city.
% of respondents who agree or strongly agree with the statement
ATTITUDES
You are willing to concede personal data in order to improve traffic congestion
You are comfortable with face recognition technologies to lower crime
You feel the availability of online information has increased your trust in authorities
The proportion of your day-to-day payment transactions that are non-cash (% of transactions)
Health & Safety Health & Safety
PRIORITY AREAS
City Population HDI
BACKGROUND INFORMATION
Map tiles by Stamen Design CC BY 3.0 Map Data © OpenStreetMap Country Indonesia HDI Life expectancy at birth Expected years of schooling Mean years of schooling GNI per capita (PPP $)
sanitation meets the needs of the poorest areas
reporting
city maintenance
solution Recycling services are satisfactory A website or App allows residents to easily give away unwanted items Public safety is not a problem Free public wifi has improved access to city services Air pollution is not a problem CCTV cameras has made residents feel safer Medical services provision is satisfactory A website or App allows residents to effectively monitor air pollution Finding housing with rent equal to 30% or less of a monthly salary is not a problem Arranging medical appointments online has improved access Mobility Mobility Traffic congestion is not a problem Car-sharing Apps have reduced congestion Public transport is satisfactory
that direct you to an available parking space have reduced journey time Bicycle hiring has reduced congestion Online scheduling and ticket sales has made public transport easier to use The city provides information on traffic congestion through mobile phones Activities Activities Green spaces are satisfactory Online purchasing of tickets to shows and museums has made it easier to attend Cultural activities (shows, bars, and museums) are satisfactory Opportunities (Work & School) Opportunities (Work & School) Employment finding services are readily available Online access to job
Basic
Online
of
problems provides a speedy
Apps
listings has made it easier to find work
IT
Businesses
new jobs
needs Minorities feel welcome Governance Governance Information on local government decisions are easily accessible Online public access to city finances has reduced corruption Corruption of city officials is not an issue of concern Online voting has increased participation Residents contribute to decision making of local government An online platform where residents can propose ideas has improved city life Residents provide feedback on local government projects Processing Identification Documents online has reduced waiting times (UN World Urbanization Prospects) 2,340,000 0.711 (Global Data Lab)
Most children have access to a good school
skills are taught well in schools Lifelong learning opportunities are provided by local institutions Online services provided by the city has made it easier to start a new business
are creating
The current internet speed and reliability meet connectivity
72.5 60.8 77.8 68.9 STRUCTURES TECHNOLOGIES 54.0 57.0 49.8 30.9 69.2 64.0 57.6 74.9 30.2 56.0 53.8 All ratings range from AAA to D
4 58.4 GROUP CC TECHNOLOGIES CC FACTOR RATINGS CC STRUCTURES 55.1 59.3 2020 67.6 +0.006 +0.7 +0.0 +0.0 46.1 78.3 67.4 58.9 60.9
57.2 1 yr change 8.6 11,206 8.6 12,046 2021 2022 0.713 68.3 14.0 14.0 2019 ▬ 112 in 2023 Out of 142 Out of 141 77.0 54.2 73.7 55.9 62.3 8.4 0.712 68.8 14.0 8.6 0.707 72.4 52.3 11,531 SMART CITY RANKING CC in 2023 62.5 47.8 25.3 56.5 67.6 67.2 57.0 70.4 SMART CITY RATING +514 11,498 0.718 70.5 13.9 58.3% 53.2% 52.7% 52.1% 46.5% 40.8% 37.9% 29.8% 19.8% 19.7% 18.9% 15.1% 14.5% 10.1% 9.8% 0% 20% 40% 60% 80% 100% security unemployment corruption / transparency road congestion basic amenities (water, waste) air pollution health services fulfilling employment Green spaces public transport school education recycling affordable housing citizen engagement social mobility / inclusiveness 69.5% 81.4% 74.6% 61.8% 0% 20% 40% 60% 80% 100% 0 20 40 60 80 100 0 20 40 60 80 100
Score
Score GROUP MEAN CITY LEGEND: MIN GROUP MAX CITY MEAN LEGEND:
respondents who chose the Priority

From a list of 15 indicators, survey respondents were asked to select 5 that they perceived as the most urgent for their city. The higher the percentage of responses per area, the greater the priority for the city.
respondents who agree or strongly agree with the statement
ATTITUDES
You are willing to concede personal data in order to improve traffic congestion
You are comfortable with face recognition technologies to lower crime
You feel the availability of online information has increased your trust in authorities
The proportion of your day-to-day payment transactions that are non-cash (% of transactions)
PRIORITY AREAS
City Population HDI
BACKGROUND INFORMATION
Map tiles by Stamen Design CC BY 3.0 Map Data © OpenStreetMap Country Colombia HDI Life expectancy at birth Expected years of schooling Mean years of schooling GNI per capita (PPP $)
Basic sanitation meets the needs of the poorest areas Online reporting of city maintenance problems provides a speedy solution Recycling services are satisfactory A website or App allows residents to easily give away unwanted items Public safety is not a problem Free public wifi has improved access to city services Air pollution is not a problem CCTV cameras has made residents feel safer Medical services provision is satisfactory A website or App allows residents to effectively monitor air pollution Finding housing with rent equal to 30% or less of a monthly salary is not a problem Arranging medical appointments online has improved access Mobility Mobility Traffic congestion is not a problem Car-sharing Apps have reduced congestion Public transport is satisfactory Apps that direct you to an available parking space have reduced journey time Bicycle hiring has reduced congestion Online scheduling and ticket sales has made public transport easier to use The city provides information on traffic congestion through mobile phones Activities Activities Green spaces are satisfactory Online purchasing of tickets to shows and museums has made it easier to attend Cultural activities (shows, bars, and museums) are satisfactory Opportunities (Work & School) Opportunities (Work & School) Employment finding services are readily available Online access to job
Health & Safety Health & Safety
listings has made it easier to find work
Minorities feel welcome Governance Governance Information on local government decisions are easily accessible Online public access to city finances has reduced corruption Corruption of city officials is not an issue of concern Online voting has increased participation Residents contribute to decision making of local government An online platform where residents can propose ideas has improved city life Residents provide feedback on local government projects Processing Identification Documents online has reduced waiting times (UN Data) 2,370,000 0.757 (Global Data Lab)
Most children have access to a good school IT skills are taught well in schools Lifelong learning opportunities are provided by local institutions Online services provided by the city has made it easier to start a new business Businesses are creating new jobs The current internet speed and reliability meet connectivity needs
74.6 59.0 64.1 68.6 STRUCTURES TECHNOLOGIES 48.6 49.4 53.5 29.8 54.8 49.5 54.9 66.0 28.9 45.5 48.7 All ratings range from AAA to D
4 51.2 GROUP C TECHNOLOGIES C FACTOR RATINGS C STRUCTURES 57.5 63.0 2020 72.8 +0.006 +0.8 +0.0 +0.0 32.9 52.3 75.6 28.7 74.7
62.6 1 yr change 8.9 13,220 8.9 15,014 2021 2022 0.758 73.7 14.4 14.4 2019
118 in 2023 Out of 142 Out of 141 67.5 44.0 63.5 32.5 45.1 8.6 0.756 74.8 14.4 8.9 0.752 48.2 63.8 14,403 SMART CITY RANKING C in 2023 50.1 32.0 23.5 36.6 55.2 57.7 60.5 58.6 SMART CITY RATING +611 14,294 0.768 76.8 14.5 78.6% 54.3% 47.7% 45.3% 44.6% 42.5% 36.6% 34.6% 21.1% 17.1% 15.8% 14.5% 11.7% 10.8% 10.7% 0% 20% 40% 60% 80% 100% security corruption / transparency affordable housing unemployment health services air pollution fulfilling employment road congestion basic amenities (water, waste) school education social mobility / inclusiveness public transport recycling Green spaces citizen engagement 69.2% 79.8% 62.4% 61.6% 0% 20% 40% 60% 80% 100% 0 20 40 60 80 100 0 20 40 60 80 100
Score % of
Score GROUP MEAN CITY LEGEND: MIN GROUP MAX CITY MEAN LEGEND:
119
Medellin
▼
% of
Area
Medina
% of respondents who chose the Priority Area

From a list of 15 indicators, survey respondents were asked to select 5 that they perceived as the most urgent for their city. The higher the percentage of responses per area, the greater the priority for the city.
% of respondents who agree or strongly agree with the statement
ATTITUDES
You are willing to concede personal data in order to improve traffic congestion
You are comfortable with face recognition technologies to lower crime
You feel the availability of online information has increased your trust in authorities
The proportion of your day-to-day payment transactions that are non-cash (% of transactions)
PRIORITY AREAS
City Population HDI
BACKGROUND INFORMATION
Map tiles by Stamen Design CC BY 3.0 Map Data © OpenStreetMap Country Saudi Arabia HDI Life expectancy at birth Expected years of schooling Mean years of schooling GNI per capita (PPP $)
Basic sanitation meets the needs of the poorest areas Online reporting of city maintenance problems provides a speedy solution Recycling services are satisfactory A website or App allows residents to easily give away unwanted items Public safety is not a problem Free public wifi has improved access to city services Air pollution is not a problem CCTV cameras has made residents feel safer Medical services provision is satisfactory A website or App allows residents to effectively monitor air pollution Finding housing with rent equal to 30% or less of a monthly salary is not a problem Arranging medical appointments online has improved access Mobility Mobility Traffic congestion is not a problem Car-sharing Apps have reduced congestion Public transport is satisfactory Apps that direct you to an available parking space have reduced journey time Bicycle hiring has reduced congestion Online scheduling and ticket sales has made public transport easier to use The city provides information on traffic congestion through mobile phones Activities Activities Green spaces are satisfactory Online purchasing of tickets to shows and museums has made it easier to attend Cultural activities (shows, bars, and museums) are satisfactory Opportunities (Work & School) Opportunities (Work & School) Employment finding services are readily available Online access to
work
IT
Lifelong
institutions
business Businesses are creating new jobs The current
reliability meet connectivity needs Minorities feel welcome Governance Governance Information on local government decisions are easily accessible Online public access to city finances has reduced corruption Corruption of city officials is not an issue of concern Online voting has increased participation Residents contribute to decision making of local government An online platform where residents can propose ideas has improved city life Residents provide feedback on local government projects Processing Identification Documents online has reduced waiting times (UN Data) 150,000 0.871 (Global Data Lab)
Health & Safety Health & Safety
job listings has made it easier to find
Most children have access to a good school
skills are taught well in schools
learning opportunities are provided by local
Online services provided by the city has made it easier to start a new
internet speed and
70.9 56.6 69.8 71.0 STRUCTURES TECHNOLOGIES 66.7 63.2 49.3 32.1 67.3 73.2 49.8 77.0 37.4 55.3 62.7 All ratings range from AAA to D
3 76.1 GROUP CCC TECHNOLOGIES CCC FACTOR RATINGS B STRUCTURES 60.1 43.2 2020 76.9 +0.008 +1.0 +0.0 +0.0 49.7 51.3 68.7 49.0 60.7
74
50.9 1 yr change 11.3 45,563 11.3 50,620 2021 2022 0.875 77.9 15.2 15.2 2019 ▲ 85 in 2023 Out of 142 Out of 141 61.4 57.6 77.0 53.3 64.8 10.9 0.861 76.2 15.2 11.3 0.867 64.6 64.2 47,441 SMART CITY RANKING CCC in 2023 75.5 59.1 46.6 60.4 74.1 63.4 63.5 69.1 SMART CITY RATING +3,179 47,529 0.862 77.3 15.0 60.7% 54.7% 43.2% 37.0% 32.5% 31.8% 30.5% 29.0% 24.9% 24.6% 20.6% 16.1% 15.5% 15.4% 7.4% 0% 20% 40% 60% 80% 100% affordable housing unemployment road congestion fulfilling employment Green spaces public transport health services recycling corruption / transparency basic amenities (water, waste) air pollution citizen engagement security school education social mobility / inclusiveness 47.6% 79.1% 79.1% 60.5% 0% 20% 40% 60% 80% 100% 0 20 40 60 80 100 0 20 40 60 80 100
Score
Score GROUP MEAN CITY LEGEND: MIN GROUP MAX CITY MEAN LEGEND:
respondents who chose the Priority Area

From a list of 15 indicators, survey respondents were asked to select 5 that they perceived as the most urgent for their city. The higher the percentage of responses per area, the greater the priority for the city.
% of respondents who agree or strongly agree with the statement
ATTITUDES
You are willing to concede personal data in order to improve traffic congestion
You are comfortable with face recognition technologies to lower crime
You feel the availability of online information has increased your trust in authorities
The proportion of your day-to-day payment transactions that are non-cash (% of transactions)
PRIORITY AREAS
City Population HDI
BACKGROUND INFORMATION
Map tiles by Stamen Design CC BY 3.0 Map Data © OpenStreetMap Country Australia HDI Life expectancy at birth Expected years of schooling Mean years of schooling GNI per capita (PPP $)
Basic sanitation meets the needs of the poorest areas Online reporting of city maintenance problems provides a speedy solution Recycling services are satisfactory A website or App allows residents to easily give away unwanted items Public safety is not a problem Free public wifi has improved access to city services Air pollution is not a problem CCTV cameras has made residents feel safer Medical services provision is satisfactory A website or App allows residents to effectively monitor air pollution Finding housing with rent equal to 30% or less of a monthly salary is not a problem Arranging medical appointments online has improved access Mobility Mobility Traffic congestion is not a problem Car-sharing Apps have reduced congestion Public transport is satisfactory Apps that direct you to an available parking space have reduced journey time Bicycle hiring has reduced congestion Online scheduling and ticket sales has made public transport easier to use The city provides information on traffic congestion through mobile phones Activities Activities Green spaces are satisfactory Online purchasing of tickets to shows and museums has made it easier to attend Cultural activities (shows, bars, and museums) are satisfactory Opportunities (Work & School) Opportunities (Work & School) Employment finding services are readily available Online access to job
Health & Safety Health & Safety
listings has made it easier to find work
IT
Businesses
creating new jobs The current
needs Minorities feel welcome Governance Governance Information on local government decisions are easily accessible Online public access to city finances has reduced corruption Corruption of city officials is not an issue of concern Online voting has increased participation Residents contribute to decision making of local government An online platform where residents can propose ideas has improved city life Residents provide feedback on local government projects Processing Identification Documents online has reduced waiting times (UN Data) 4,200,000 0.948 (Global Data Lab)
Most children have access to a good school
skills are taught well in schools Lifelong learning opportunities are provided by local institutions Online services provided by the city has made it easier to start a new business
are
internet speed and reliability meet connectivity
73.1 54.7 59.4 63.5 STRUCTURES TECHNOLOGIES 47.6 58.4 40.9 49.5 54.9 58.9 38.8 68.7 21.4 38.4 39.5 All ratings range from AAA to D
1 68.1 GROUP A TECHNOLOGIES A FACTOR RATINGS BBB STRUCTURES 54.1 69.8 2020 84.5 -0.003 -0.9 +0.0 +0.0 39.3 61.1 77.7 23.5 67.9
59.6 1 yr change 12.7 48,075 12.7 49,257 2021 2022 0.946 83.6 21.1 21.1 2019
31 in 2023 Out of 142 Out of 141 70.7 57.6 57.0 44.1 43.3 12.7 0.948 84.3 20.9 12.7 0.949 62.6 65.0 48,076 SMART CITY RANKING A in 2023 53.0 35.0 40.7 45.5 70.7 54.3 69.2 45.9 SMART CITY RATING +1,181 47,054 0.941 83.1 21.4 82.0% 58.9% 53.7% 42.1% 33.1% 28.3% 24.5% 24.4% 22.3% 20.3% 15.9% 15.9% 15.4% 13.1% 9.3% 0% 20% 40% 60% 80% 100% affordable housing road congestion health services security unemployment public transport fulfilling employment corruption / transparency recycling school education Green spaces social mobility / inclusiveness air pollution basic amenities (water, waste) citizen engagement 52.5% 63.1% 43.0% 74.0% 0% 20% 40% 60% 80% 100% 0 20 40 60 80 100 0 20 40 60 80 100
33
Melbourne
▼
Score
Score GROUP MEAN CITY LEGEND: MIN GROUP MAX CITY MEAN LEGEND:
% of
of respondents who chose the Priority Area

From a list of 15 indicators, survey respondents were asked to select 5 that they perceived as the most urgent for their city. The higher the percentage of responses per area, the greater the priority for the city.
% of respondents who agree or strongly agree with the statement
ATTITUDES
You are willing to concede personal data in order to improve traffic congestion
You are comfortable with face recognition technologies to lower crime
You feel the availability of online information has increased your trust in authorities
The proportion of your day-to-day payment transactions that are non-cash (% of transactions)
PRIORITY AREAS
City Population HDI
BACKGROUND INFORMATION
Map tiles by Stamen Design CC BY 3.0 Map Data © OpenStreetMap Country Mexico HDI Life expectancy at birth Expected years of schooling Mean years of schooling GNI per capita (PPP $)
Basic sanitation meets the needs of the poorest areas Online reporting of city maintenance problems provides a speedy solution Recycling services are satisfactory A website or App allows residents to easily give away unwanted items Public safety is not a problem Free public wifi has improved access to city services Air pollution is not a problem CCTV cameras has made residents feel safer Medical services provision is satisfactory A website or App allows residents to effectively monitor air pollution Finding housing with rent equal to 30% or less of a monthly salary is not a problem Arranging medical appointments online has improved access Mobility Mobility Traffic congestion is not a problem Car-sharing Apps have reduced congestion Public transport is satisfactory Apps that direct you to an available parking space have reduced journey time Bicycle hiring has reduced congestion Online scheduling and ticket sales has made public transport easier to use The city provides information on traffic congestion through mobile phones Activities Activities Green spaces are satisfactory Online purchasing of tickets to shows and museums has made it easier to attend Cultural activities (shows, bars, and museums) are satisfactory Opportunities (Work & School) Opportunities (Work & School) Employment finding services are readily available Online access to job
Health & Safety Health & Safety
listings has made it easier to find work
IT
institutions
Businesses are creating new jobs The current
reliability meet connectivity needs Minorities feel welcome Governance Governance Information on local government decisions are easily accessible Online public access to city finances has reduced corruption Corruption of city officials is not an issue of concern Online voting has increased participation Residents contribute to decision making of local government An online platform where residents can propose ideas has improved city life Residents provide feedback on local government projects Processing Identification Documents online has reduced waiting times (UN World Urbanization Prospects) 21,780,000 0.815 (Global Data Lab)
Most children have access to a good school
skills are taught well in schools Lifelong learning opportunities are provided by local
Online services provided by the city has made it easier to start a new business
internet speed and
71.5 63.4 55.1 65.0 STRUCTURES TECHNOLOGIES 41.8 46.2 52.8 20.1 53.7 39.0 48.1 57.4 23.4 42.6 43.0 All ratings range from AAA to D
4 43.5 GROUP C TECHNOLOGIES C FACTOR RATINGS D STRUCTURES 33.0 52.1 2020 70.2 +0.024 +4.6 +0.0 +0.0 20.7 53.3 70.6 27.8 58.2
122
61.3 1 yr change 9.2 17,721 9.2 19,138 2021 2022 0.781 74.8 14.5 14.5 2019
121 in 2023 Out of 142 Out of 141 60.6 38.0 69.0 40.5 45.9 9.1 0.757 70.1 14.8 9.2 0.757 40.4 45.8 18,582 SMART CITY RANKING C in 2023 51.1 35.0 19.7 44.6 38.4 50.2 40.3 55.2 SMART CITY RATING +556 19,471 0.781 74.2 14.9 82.7% 53.9% 52.7% 52.6% 38.3% 34.1% 31.7% 26.9% 23.6% 22.6% 19.8% 19.1% 14.8% 7.2% 4.7% 0% 20% 40% 60% 80% 100% security corruption / transparency health services basic amenities (water, waste) unemployment air pollution fulfilling employment public transport school education affordable housing road congestion recycling Green spaces social mobility / inclusiveness citizen engagement 57.0% 69.1% 47.9% 57.0% 0% 20% 40% 60% 80% 100% 0 20 40 60 80 100 0 20 40 60 80 100
Score
Score GROUP MEAN CITY LEGEND: MIN GROUP MAX CITY MEAN LEGEND:
Mexico City
▼
%
Milan
respondents who chose the Priority Area

From a list of 15 indicators, survey respondents were asked to select 5 that they perceived as the most urgent for their city. The higher the percentage of responses per area, the greater the priority for the city.
% of respondents who agree or strongly agree with the statement
ATTITUDES
You are willing to concede personal data in order to improve traffic congestion
You are comfortable with face recognition technologies to lower crime
You feel the availability of online information has increased your trust in authorities
The proportion of your day-to-day payment transactions that are non-cash (% of transactions)
PRIORITY AREAS
City Population HDI
BACKGROUND INFORMATION
Map tiles by Stamen Design CC BY 3.0 Map Data © OpenStreetMap
Italy HDI Life expectancy at birth Expected years of schooling Mean years of schooling GNI per capita (PPP $)
Country
sanitation meets the needs of the poorest areas
reporting of city maintenance problems provides a speedy solution Recycling services are satisfactory A website or App allows residents to easily give away unwanted items Public safety is not a problem Free public wifi has improved access to city services Air pollution is not a problem CCTV cameras has made residents feel safer Medical services provision is satisfactory A website or App allows residents to effectively monitor air pollution Finding housing with rent equal to 30% or less of a monthly salary is not a problem Arranging medical appointments online has improved access Mobility Mobility Traffic congestion is not a problem Car-sharing Apps have reduced congestion Public transport is satisfactory Apps that direct you to an available parking space have reduced journey time Bicycle hiring has reduced congestion Online scheduling and ticket sales has made public transport easier to use The city provides information on traffic congestion through mobile phones Activities Activities Green spaces are satisfactory Online purchasing of tickets to shows and museums has made it easier to attend Cultural activities (shows, bars, and museums) are satisfactory Opportunities (Work & School) Opportunities (Work & School) Employment finding services are readily available Online access to job
Health & Safety Health & Safety Basic
Online
listings has made it easier to find work
IT
are creating new jobs The current
needs Minorities feel welcome Governance Governance Information on local government decisions are easily accessible Online public access to city finances has reduced corruption Corruption of city officials is not an issue of concern Online voting has increased participation Residents contribute to decision making of local government An online platform where residents can propose ideas has improved city life Residents provide feedback on local government projects Processing Identification Documents online has reduced waiting times (Eurostat) 1,410,000 0.915 (Global Data Lab)
Most children have access to a good school
skills are taught well in schools Lifelong learning opportunities are provided by local institutions Online services provided by the city has made it easier to start a new business Businesses
internet speed and reliability meet connectivity
81.4 51.7 68.7 57.6 STRUCTURES TECHNOLOGIES 52.0 59.2 48.3 16.6 49.9 54.6 46.8 68.3 19.6 39.1 44.9 All ratings range from AAA to D 91 2 60.0 GROUP B TECHNOLOGIES B FACTOR RATINGS B STRUCTURES 52.2 45.4 2020 82.9 +0.007 +1.2 +0.0 +0.0 32.7 45.9 78.3 54.6 55.3
46.3 1 yr change 10.7 39,587 10.7 44,284 2021 2022 0.906 84.1 16.7 16.7 2019
82 in 2023 Out of 142 Out of 141 64.5 39.6 65.5 33.1 45.4 10.7 0.892 82.4 16.5 10.7 0.899 38.7 74.7 42,856 SMART CITY RANKING BB in 2023 50.8 35.7 30.1 37.2 58.8 43.0 53.6 44.4 SMART CITY RATING +1,428 43,102 0.899 83.6 16.4 71.7% 66.2% 57.0% 43.3% 40.1% 30.0% 28.2% 25.8% 24.4% 16.1% 15.3% 13.9% 13.2% 12.5% 9.5% 0% 20% 40% 60% 80% 100% air pollution security affordable housing road congestion unemployment fulfilling employment public transport Green spaces corruption / transparency health services citizen engagement school education recycling social mobility / inclusiveness basic amenities (water, waste) 58.1% 67.9% 45.5% 60.2% 0% 20% 40% 60% 80% 100% 0 20 40 60 80 100 0 20 40 60 80 100
Score
Score GROUP MEAN CITY LEGEND: MIN GROUP MAX CITY MEAN LEGEND:
▼
% of
Montreal
respondents who chose the Priority

From a list of 15 indicators, survey respondents were asked to select 5 that they perceived as the most urgent for their city. The higher the percentage of responses per area, the greater the priority for the city.
% of respondents who agree or strongly agree with the statement
ATTITUDES
You are willing to concede personal data in order to improve traffic congestion
You are comfortable with face recognition technologies to lower crime
You feel the availability of online information has increased your trust in authorities
The proportion of your day-to-day payment transactions that are non-cash (% of transactions)
PRIORITY AREAS
City Population HDI
BACKGROUND INFORMATION
Map tiles by Stamen Design CC BY 3.0 Map Data © OpenStreetMap Country Canada HDI Life expectancy at birth Expected years of schooling Mean years of schooling GNI per capita (PPP $)
Basic sanitation meets the needs of the poorest areas Online reporting of city maintenance problems provides a speedy solution Recycling services are satisfactory A website or App allows residents to easily give away unwanted items Public safety is not a problem Free public wifi has improved access to city services Air pollution is not a problem CCTV cameras has made residents feel safer Medical services provision is satisfactory A website or App allows residents to effectively monitor air pollution Finding housing with rent equal to 30% or less of a monthly salary is not a problem Arranging medical appointments online has improved access Mobility Mobility Traffic congestion is not a problem Car-sharing Apps have reduced congestion Public transport is satisfactory Apps that direct you to an available parking space have reduced journey time Bicycle hiring has reduced congestion Online scheduling and ticket sales has made public transport easier to use The city provides information on traffic congestion through mobile phones Activities Activities Green spaces are satisfactory Online purchasing of tickets to shows and museums has made it easier to attend Cultural activities (shows, bars, and museums) are satisfactory Opportunities (Work & School) Opportunities (Work & School) Employment finding services are readily available Online access to job
Health & Safety Health & Safety
listings has made it easier to find work
IT
Businesses
new jobs The current
needs Minorities feel welcome Governance Governance Information on local government decisions are easily accessible Online public access to city finances has reduced corruption Corruption of city officials is not an issue of concern Online voting has increased participation Residents contribute to decision making of local government An online platform where residents can propose ideas has improved city life Residents provide feedback on local government projects Processing Identification Documents online has reduced waiting times (UN Data) 1,700,000 0.923 (Global Data Lab)
Most children have access to a good school
skills are taught well in schools Lifelong learning opportunities are provided by local institutions Online services provided by the city has made it easier to start a new business
are creating
internet speed and reliability meet connectivity
72.7 51.1 53.8 68.8 STRUCTURES TECHNOLOGIES 39.4 52.2 44.5 37.7 45.3 42.9 38.7 50.4 16.4 35.1 35.5 All ratings range from AAA to D
2 59.5 GROUP BB TECHNOLOGIES B FACTOR RATINGS BB STRUCTURES 58.3 69.2 2020 82.7 +0.001 +0.2 +0.0 +0.0 49.4 65.7 80.6 18.7 70.8
80
51.4 1 yr change 13.9 45,828 13.9 48,444 2021 2022 0.935 82.8 16.0 16.0 2019
69 in 2023 Out of 142 Out of 141 69.8 50.2 48.9 41.2 44.7 13.8 0.928 82.0 15.9 13.9 0.934 61.9 67.7 47,933 SMART CITY RANKING BB in 2023 58.1 34.4 39.7 39.6 67.0 52.4 68.8 47.4 SMART CITY RATING +512 48,591 0.932 82.4 15.9 83.6% 68.3% 55.2% 46.8% 30.3% 26.6% 25.8% 19.7% 18.9% 18.5% 17.2% 15.5% 15.1% 13.9% 10.1% 0% 20% 40% 60% 80% 100% affordable housing health services road congestion security public transport air pollution corruption / transparency school education fulfilling employment unemployment recycling basic amenities (water, waste) Green spaces social mobility / inclusiveness citizen engagement 56.6% 59.9% 51.0% 75.2% 0% 20% 40% 60% 80% 100% 0 20 40 60 80 100 0 20 40 60 80 100
Score
Area Score GROUP MEAN CITY LEGEND: MIN GROUP MAX CITY MEAN LEGEND:
▼
% of
% of respondents who chose the Priority Area

From a list of 15 indicators, survey respondents were asked to select 5 that they perceived as the most urgent for their city. The higher the percentage of responses per area, the greater the priority for the city.
% of respondents who agree or strongly agree with the statement
ATTITUDES
You are willing to concede personal data in order to improve traffic congestion
You are comfortable with face recognition technologies to lower crime
You feel the availability of online information has increased your trust in authorities
The proportion of your day-to-day payment transactions that are non-cash (% of transactions)
PRIORITY AREAS
City Population HDI
BACKGROUND INFORMATION
Map tiles by Stamen Design CC BY 3.0 Map Data © OpenStreetMap Country India HDI Life expectancy at birth Expected years of schooling Mean years of schooling GNI per capita (PPP $)
sanitation meets the needs of the poorest areas
reporting of city maintenance problems provides a speedy solution Recycling services are satisfactory A website or App allows residents to easily give away unwanted items Public safety is not a problem Free public wifi has improved access to city services Air pollution is not a problem CCTV cameras has made residents feel safer Medical services provision is satisfactory A website or App allows residents to effectively monitor air pollution Finding housing with rent equal to 30% or less of a monthly salary is not a problem Arranging medical appointments online has improved access Mobility Mobility Traffic congestion is not a problem Car-sharing Apps have reduced congestion Public transport is satisfactory Apps that direct you to an available parking space have reduced journey time Bicycle hiring has reduced congestion Online scheduling and ticket sales has made public transport easier to use The city provides information on traffic congestion through mobile phones Activities Activities Green spaces are satisfactory Online purchasing of tickets to shows and museums has made it easier to attend Cultural activities (shows, bars, and museums) are satisfactory Opportunities (Work & School) Opportunities (Work & School) Employment finding services are readily available Online access to job
Health & Safety Health & Safety Basic
Online
listings has made it easier to find work
IT
institutions
Businesses are creating new jobs The current
meet connectivity needs Minorities feel welcome Governance Governance Information on local government decisions are easily accessible Online public access to city finances has reduced corruption Corruption of city officials is not an issue of concern Online voting has increased participation Residents contribute to decision making of local government An online platform where residents can propose ideas has improved city life Residents provide feedback on local government projects Processing Identification Documents online has reduced waiting times (UN World Urbanization Prospects) 20,410,000 0.688 (Global Data Lab)
Most children have access to a good school
skills are taught well in schools Lifelong learning opportunities are provided by local
Online services provided by the city has made it easier to start a new business
internet speed and reliability
82.4 77.6 79.4 79.3 STRUCTURES TECHNOLOGIES 69.5 62.9 63.1 27.4 80.8 74.0 63.1 79.4 24.7 67.9 65.0 All ratings range from AAA to D
4 69.8 GROUP CC TECHNOLOGIES CCC FACTOR RATINGS CC STRUCTURES 70.7 75.3 2020 67.2 +0.011 +0.5 +0.6 +0.0 50.0 78.3 75.8 47.3 67.3
68.6 1 yr change 6.5 6,090 6.6 6,951 2021 2022 0.644 67.7 12.6 12.0 2019 ▲ 109 in 2023 Out of 142 Out of 141 78.5 66.2 78.3 65.5 71.1 6.3 0.638 70.2 11.7 6.5 0.633 73.3 68.1 6,542 SMART CITY RANKING CC in 2023 77.3 63.1 40.2 65.8 70.9 69.6 69.8 78.3 SMART CITY RATING +408 6,554 0.638 70.9 11.4 54.9% 48.3% 43.2% 40.9% 34.9% 34.1% 34.1% 33.5% 33.4% 28.7% 26.3% 23.2% 18.6% 11.1% 9.2% 0% 20% 40% 60% 80% 100% air pollution affordable housing basic amenities (water, waste) road congestion security Green spaces unemployment health services corruption / transparency public transport fulfilling employment recycling school education social mobility / inclusiveness citizen engagement 82.0% 82.1% 82.9% 76.9% 0% 20% 40% 60% 80% 100% 0 20 40 60 80 100 0 20 40 60 80 100
107
Mumbai
Score
Score GROUP MEAN CITY LEGEND: MIN GROUP MAX CITY MEAN LEGEND:
Munich
% of respondents who chose the Priority Area

From a list of 15 indicators, survey respondents were asked to select 5 that they perceived as the most urgent for their city. The higher the percentage of responses per area, the greater the priority for the city.
% of respondents who agree or strongly agree with the statement
ATTITUDES
You are willing to concede personal data in order to improve traffic congestion
You are comfortable with face recognition technologies to lower crime
You feel the availability of online information has increased your trust in authorities
The proportion of your day-to-day payment transactions that are non-cash (% of transactions)
PRIORITY AREAS
City Population HDI
BACKGROUND INFORMATION
Map tiles by Stamen Design CC BY 3.0 Map Data © OpenStreetMap Country Germany HDI Life expectancy at birth Expected years of schooling Mean years of schooling GNI per capita (PPP $)
Basic sanitation meets the needs of the poorest areas Online reporting of city maintenance problems provides a speedy solution Recycling services are satisfactory A website or App allows residents to easily give away unwanted items Public safety is not a problem Free public wifi has improved access to city services Air pollution is not a problem CCTV cameras has made residents feel safer Medical services provision is satisfactory A website or App allows residents to effectively monitor air pollution Finding housing with rent equal to 30% or less of a monthly salary is not a problem Arranging medical appointments online has improved access Mobility Mobility Traffic congestion is not a problem Car-sharing Apps have reduced congestion Public transport is satisfactory Apps that direct you to an available parking space have reduced journey time Bicycle hiring has reduced congestion Online scheduling and ticket sales has made public transport easier to use The city provides information on traffic congestion through mobile phones Activities Activities Green spaces are satisfactory Online purchasing of tickets to shows and museums has made it easier to attend Cultural activities (shows, bars, and museums) are satisfactory Opportunities (Work & School) Opportunities (Work & School) Employment finding services are readily available Online access to job
Health & Safety Health & Safety
listings has made it easier to find work
IT
jobs
needs Minorities feel welcome Governance Governance Information on local government decisions are easily accessible Online public access to city finances has reduced corruption Corruption of city officials is not an issue of concern Online voting has increased participation Residents contribute to decision making of local government An online platform where residents can propose ideas has improved city life Residents provide feedback on local government projects Processing Identification Documents online has reduced waiting times (UN World Urbanization Prospects) 1,540,000 0.950 (Global Data Lab)
Most children have access to a good school
skills are taught well in schools Lifelong learning opportunities are provided by local institutions Online services provided by the city has made it easier to start a new business Businesses are creating new
The current internet speed and reliability meet connectivity
79.7 54.2 68.3 63.6 STRUCTURES TECHNOLOGIES 48.2 55.6 46.6 43.6 49.8 74.6 35.5 54.6 30.1 41.8 43.5 All ratings range from AAA to D
1 71.9 GROUP A TECHNOLOGIES A FACTOR RATINGS A STRUCTURES 64.4 63.4 2020 80.6 +0.002 +0.4 +0.0 +0.0 58.0 67.3 83.8 21.6 70.1
21
57.3 1 yr change 14.3 53,375 14.3 55,340 2021 2022 0.950 81.0 17.3 17.3 2019
20 in 2023 Out of 142 Out of 141 71.3 55.1 50.9 51.5 47.8 14.2 0.948 81.1 17.2 14.3 0.948 59.5 77.8 55,057 SMART CITY RANKING AA in 2023 58.6 41.2 55.4 51.9 68.8 49.1 62.0 45.3 SMART CITY RATING +284 55,685 0.951 81.6 17.2 82.1% 60.9% 39.2% 37.4% 32.9% 27.4% 20.7% 20.0% 19.3% 18.4% 18.0% 16.9% 16.2% 13.9% 11.3% 0% 20% 40% 60% 80% 100% affordable housing road congestion security air pollution unemployment public transport Green spaces recycling citizen engagement fulfilling employment basic amenities (water, waste) health services school education social mobility / inclusiveness corruption / transparency 59.5% 60.3% 55.4% 65.1% 0% 20% 40% 60% 80% 100% 0 20 40 60 80 100 0 20 40 60 80 100
▼
Score
Score GROUP MEAN CITY LEGEND: MIN GROUP MAX CITY MEAN LEGEND:
Muscat
% of respondents who chose the Priority Area

From a list of 15 indicators, survey respondents were asked to select 5 that they perceived as the most urgent for their city. The higher the percentage of responses per area, the greater the priority for the city.
% of respondents who agree or strongly agree with the statement
ATTITUDES
You are willing to concede personal data in order to improve traffic congestion
You are comfortable with face recognition technologies to lower crime
You feel the availability of online information has increased your trust in authorities
The proportion of your day-to-day payment transactions that are non-cash (% of transactions)
Health & Safety Health & Safety
PRIORITY AREAS
City Population HDI
BACKGROUND INFORMATION
Map tiles by Stamen Design CC BY 3.0 Map Data © OpenStreetMap Country Oman HDI Life expectancy at birth Expected years of schooling Mean years of schooling GNI per capita (PPP $)
sanitation meets the needs of the poorest areas
reporting
maintenance
solution Recycling services are satisfactory A website or App allows residents to easily give away unwanted items Public safety is not a problem Free public wifi has improved access to city services Air pollution is not a problem CCTV cameras has made residents feel safer Medical services provision is satisfactory A website or App allows residents to effectively monitor air pollution Finding housing with rent equal to 30% or less of a monthly salary is not a problem Arranging medical appointments online has improved access Mobility Mobility Traffic congestion is not a problem Car-sharing Apps have reduced congestion Public transport is satisfactory
that direct you to an available parking space have reduced journey time Bicycle hiring has reduced congestion Online scheduling and ticket sales has made public transport easier to use The city provides information on traffic congestion through mobile phones Activities Activities Green spaces are satisfactory Online purchasing of tickets to shows and museums has made it easier to attend Cultural activities (shows, bars, and museums) are satisfactory Opportunities (Work & School) Opportunities (Work & School) Employment finding services are readily available Online access to job
Basic
Online
of city
problems provides a speedy
Apps
listings has made it easier to find work
IT
Businesses
new jobs
needs Minorities feel welcome Governance Governance Information on local government decisions are easily accessible Online public access to city finances has reduced corruption Corruption of city officials is not an issue of concern Online voting has increased participation Residents contribute to decision making of local government An online platform where residents can propose ideas has improved city life Residents provide feedback on local government projects Processing Identification Documents online has reduced waiting times (UN World Urbanization Prospects) 1,620,000 0.816 (Global Data Lab)
Most children have access to a good school
skills are taught well in schools Lifelong learning opportunities are provided by local institutions Online services provided by the city has made it easier to start a new business
are creating
The current internet speed and reliability meet connectivity
75.7 62.2 73.2 76.0 STRUCTURES TECHNOLOGIES 70.1 63.8 42.3 53.6 73.5 75.3 47.3 72.3 44.4 56.3 60.0 All ratings range from AAA to D 88 3 79.7 GROUP B TECHNOLOGIES CCC FACTOR RATINGS B STRUCTURES 67.1 47.4 2020 72.5 +0.009 +1.4 +0.0 +0.0 65.4 60.2 70.3 55.0 70.2
61.4 1 yr change 11.9 30,926 11.9 32,967 2021 2022 0.819 73.9 13.0 13.0 2019 ▲ 96 in 2023 Out of 142 Out of 141 67.8 60.5 78.9 54.2 60.1 11.4 0.823 74.8 13.2 11.9 0.810 69.8 72.2 31,995 SMART CITY RANKING B in 2023 73.8 59.1 50.1 65.7 79.8 66.6 64.4 67.9 SMART CITY RATING +972 31,513 0.841 78.0 14.0 66.1% 58.0% 43.6% 42.2% 32.3% 29.6% 28.9% 26.3% 26.1% 24.0% 21.5% 21.3% 15.7% 15.7% 14.1% 0% 20% 40% 60% 80% 100% unemployment affordable housing road congestion fulfilling employment public transport Green spaces health services corruption / transparency recycling basic amenities (water, waste) citizen engagement air pollution social mobility / inclusiveness school education security 60.8% 82.4% 85.0% 61.7% 0% 20% 40% 60% 80% 100% 0 20 40 60 80 100 0 20 40 60 80 100
Score
Score GROUP MEAN CITY LEGEND: MIN GROUP MAX CITY MEAN LEGEND:
Nairobi
% of respondents who chose the Priority Area

From a list of 15 indicators, survey respondents were asked to select 5 that they perceived as the most urgent for their city. The higher the percentage of responses per area, the greater the priority for the city.
% of respondents who agree or strongly agree with the statement
ATTITUDES
You are willing to concede personal data in order to improve traffic congestion
You are comfortable with face recognition technologies to lower crime
You feel the availability of online information has increased your trust in authorities
The proportion of your day-to-day payment transactions that are non-cash (% of transactions)
Health & Safety Health & Safety
PRIORITY AREAS
City Population HDI
BACKGROUND INFORMATION
Map tiles by Stamen Design CC BY 3.0 Map Data © OpenStreetMap Country Kenya HDI Life expectancy at birth Expected years of schooling Mean years of schooling GNI per capita (PPP $)
sanitation meets the needs of the poorest areas
reporting of city maintenance problems provides a speedy solution Recycling services are satisfactory A website or App allows residents to easily give away unwanted items Public safety is not a problem Free public wifi has improved access to city services Air pollution is not a problem CCTV cameras has made residents feel safer Medical services provision is satisfactory A website or App allows residents to effectively monitor air pollution Finding housing with rent equal to 30% or less of a monthly salary is not a problem Arranging medical appointments online has improved access Mobility Mobility Traffic congestion is not a problem Car-sharing Apps have reduced congestion Public transport is satisfactory
that direct you to an available parking space have reduced journey time Bicycle hiring has reduced congestion Online scheduling and ticket sales has made public transport easier to use The city provides information on traffic congestion through mobile phones Activities Activities Green spaces are satisfactory Online purchasing of tickets to shows and museums has made it easier to attend Cultural activities (shows, bars, and museums) are satisfactory Opportunities (Work & School) Opportunities (Work & School) Employment finding services are readily available Online access to job
Basic
Online
Apps
listings has made it easier to find work
IT
Businesses
new jobs
needs Minorities feel welcome Governance Governance Information on local government decisions are easily accessible Online public access to city finances has reduced corruption Corruption of city officials is not an issue of concern Online voting has increased participation Residents contribute to decision making of local government An online platform where residents can propose ideas has improved city life Residents provide feedback on local government projects Processing Identification Documents online has reduced waiting times (UN World Urbanization Prospects) 4,730,000 0.636 (Global Data Lab)
Most children have access to a good school
skills are taught well in schools Lifelong learning opportunities are provided by local institutions Online services provided by the city has made it easier to start a new business
are creating
The current internet speed and reliability meet connectivity
75.4 48.2 61.8 72.2 STRUCTURES TECHNOLOGIES 42.3 38.0 31.8 21.8 63.9 51.3 23.3 61.3 14.3 53.5 46.8 All ratings range from AAA to D
4 38.6 GROUP C TECHNOLOGIES C FACTOR RATINGS C STRUCTURES 47.6 29.2 2020 61.4 +0.005 +0.6 +0.0 +0.0 28.7 68.1 75.6 35.7 52.7
131
46.7 1 yr change 7.7 4,420 7.7 4,808 2021 2022 0.601 62.1 11.4 11.4 2019 ▬ 131 in 2023 Out of 142 Out of 141 68.9 47.8 66.4 34.1 45.0 8.0 0.599 62.7 11.4 7.7 0.596 51.6 44.3 4,666 SMART CITY RANKING C in 2023 55.3 32.5 11.0 38.1 42.4 65.0 45.5 60.6 SMART CITY RATING +142 4,528 0.604 62.9 11.3 68.3% 66.9% 62.9% 59.9% 57.9% 52.1% 34.3% 30.0% 14.9% 12.2% 11.5% 9.1% 5.5% 4.1% 3.8% 0% 20% 40% 60% 80% 100% basic amenities (water, waste) unemployment security health services corruption / transparency affordable housing fulfilling employment road congestion school education air pollution public transport citizen engagement recycling social mobility / inclusiveness Green spaces 72.5% 85.3% 69.1% 70.4% 0% 20% 40% 60% 80% 100% 0 20 40 60 80 100 0 20 40 60 80 100
Score
Score GROUP MEAN CITY LEGEND: MIN GROUP MAX CITY MEAN LEGEND:
Nanjing
%
respondents who chose the

From a list of 15 indicators, survey respondents were asked to select 5 that they perceived as the most urgent for their city. The higher the percentage of responses per area, the greater the priority for the city.
% of respondents who agree or strongly agree with the statement
ATTITUDES
You are willing to concede personal data in order to improve traffic congestion
You are comfortable with face recognition technologies to lower crime
You feel the availability of online information has increased your trust in authorities
The proportion of your day-to-day payment transactions that are non-cash (% of transactions)
PRIORITY AREAS
INFORMATION City Population HDI
BACKGROUND
Map tiles by Stamen Design CC BY 3.0 Map Data © OpenStreetMap Country China HDI Life expectancy at birth Expected years of schooling Mean years of schooling GNI per capita (PPP $)
Basic sanitation meets the needs of the poorest areas Online reporting of city maintenance problems provides a speedy solution Recycling services are satisfactory A website or App allows residents to easily give away unwanted items Public safety is not a problem Free public wifi has improved access to city services Air pollution is not a problem CCTV cameras has made residents feel safer Medical services provision is satisfactory A website or App allows residents to effectively monitor air pollution Finding housing with rent equal to 30% or less of a monthly salary is not a problem Arranging medical appointments online has improved access Mobility Mobility Traffic congestion is not a problem Car-sharing Apps have reduced congestion Public transport is satisfactory Apps that direct you to an available parking space have reduced journey time Bicycle hiring has reduced congestion Online scheduling and ticket sales has made public transport easier to use The city provides information on traffic congestion through mobile phones Activities Activities Green spaces are satisfactory Online purchasing of tickets to shows and museums has made it easier to attend Cultural activities (shows, bars, and museums) are satisfactory Opportunities (Work & School) Opportunities (Work & School) Employment finding services are readily available Online access to job
Health & Safety Health & Safety
listings has made it easier to find work
IT
jobs
needs Minorities feel welcome Governance Governance Information on local government decisions are easily accessible Online public access to city finances has reduced corruption Corruption of city officials is not an issue of concern Online voting has increased participation Residents contribute to decision making of local government An online platform where residents can propose ideas has improved city life Residents provide feedback on local government projects Processing Identification Documents online has reduced waiting times (UN World Urbanization Prospects) 8,850,000 0.810 (Global Data Lab)
Most children have access to a good school
skills are taught well in schools Lifelong learning opportunities are provided by local institutions Online services provided by the city has made it easier to start a new business Businesses are creating new
The current internet speed and reliability meet connectivity
90.1 83.8 85.3 86.8 STRUCTURES TECHNOLOGIES 83.4 73.6 81.2 60.0 78.9 79.8 73.6 85.5 40.3 71.2 79.2 All ratings range from AAA to D 62 4 83.7 GROUP CCC TECHNOLOGIES CCC FACTOR RATINGS CCC STRUCTURES 71.4 77.0 2020 78.2 +0.003 +0.4 +0.0 +0.0 77.4 74.0 83.3 65.7 83.3
79.2 1 yr change 8.1 16,168 8.1 18,025 2021 2022 0.788 78.6 15.2 15.2 2019
58 in 2023 Out of 142 Out of 141 81.1 70.6 81.9 55.7 76.7 8.0 0.781 78.1 15.2 8.1 0.785 81.6 78.4 17,499 SMART CITY RANKING CCC in 2023 71.9 68.2 50.7 68.5 78.5 80.2 67.2 74.6 SMART CITY RATING +526 15,934 0.775 78.0 15.0 61.0% 46.5% 42.8% 42.5% 42.2% 39.4% 28.4% 28.1% 26.7% 21.9% 18.7% 15.5% 15.1% 15.1% 13.9% 0% 20% 40% 60% 80% 100% road congestion fulfilling employment air pollution affordable housing health services corruption / transparency unemployment school education basic amenities (water, waste) social mobility / inclusiveness citizen engagement public transport recycling Green spaces security 87.4% 86.5% 89.0% 91.3% 0% 20% 40% 60% 80% 100% 0 20 40 60 80 100 0 20 40 60 80 100
▼
Score
Priority Area Score GROUP MEAN CITY LEGEND: MIN GROUP MAX CITY MEAN LEGEND:
of
New York
respondents who chose the

From a list of 15 indicators, survey respondents were asked to select 5 that they perceived as the most urgent for their city. The higher the percentage of responses per area, the greater the priority for the city.
% of respondents who agree or strongly agree with the statement
ATTITUDES
You are willing to concede personal data in order to improve traffic congestion
You are comfortable with face recognition technologies to lower crime
You feel the availability of online information has increased your trust in authorities
The proportion of your day-to-day payment transactions that are non-cash (% of transactions)
PRIORITY AREAS
City Population HDI
BACKGROUND INFORMATION
Map tiles by Stamen Design CC BY 3.0 Map Data © OpenStreetMap Country USA HDI Life expectancy at birth Expected years of schooling Mean years of schooling GNI per capita (PPP $)
Basic sanitation meets the needs of the poorest areas Online reporting of city maintenance problems provides a speedy solution Recycling services are satisfactory A website or App allows residents to easily give away unwanted items Public safety is not a problem Free public wifi has improved access to city services Air pollution is not a problem CCTV cameras has made residents feel safer Medical services provision is satisfactory A website or App allows residents to effectively monitor air pollution Finding housing with rent equal to 30% or less of a monthly salary is not a problem Arranging medical appointments online has improved access Mobility Mobility Traffic congestion is not a problem Car-sharing Apps have reduced congestion Public transport is satisfactory Apps that direct you to an available parking space have reduced journey time Bicycle hiring has reduced congestion Online scheduling and ticket sales has made public transport easier to use The city provides information on traffic congestion through mobile phones Activities Activities Green spaces are satisfactory Online purchasing of tickets to shows and museums has made it easier to attend Cultural activities (shows, bars, and museums) are satisfactory Opportunities (Work & School) Opportunities (Work & School) Employment finding services are readily available Online access to job
Health & Safety Health & Safety
listings has made it easier to find work
IT
Businesses
new jobs The current
needs Minorities feel welcome Governance Governance Information on local government decisions are easily accessible Online public access to city finances has reduced corruption Corruption of city officials is not an issue of concern Online voting has increased participation Residents contribute to decision making of local government An online platform where residents can propose ideas has improved city life Residents provide feedback on local government projects Processing Identification Documents online has reduced waiting times (UN Data) 8,800,000 0.938 (Global Data Lab)
Most children have access to a good school
skills are taught well in schools Lifelong learning opportunities are provided by local institutions Online services provided by the city has made it easier to start a new business
are creating
internet speed and reliability meet connectivity
76.0 63.6 64.9 71.1 STRUCTURES TECHNOLOGIES 49.2 60.0 51.4 34.3 57.2 64.5 47.4 68.6 27.8 48.5 52.4 All ratings range from AAA to D 34 2 58.6 GROUP BB TECHNOLOGIES BB FACTOR RATINGS BB STRUCTURES 55.2 63.4 2020 77.2 +0.006 +1.0 +0.0 +0.0 36.1 61.0 78.2 36.2 63.0
64.4 1 yr change 13.7 61,077 13.6 65,565 2021 2022 0.927 78.2 16.4 16.4 2019
21 in 2023 Out of 142 Out of 141 66.7 59.1 63.1 50.6 50.4 13.6 0.923 77.4 16.6 13.6 0.921 61.4 67.0 64,484 SMART CITY RANKING BBB in 2023 62.1 44.0 36.0 57.6 57.7 50.6 62.8 52.7 SMART CITY RATING +1,081 63,654 0.933 79.1 16.6 71.0% 54.5% 43.0% 39.1% 33.6% 32.5% 31.9% 28.8% 28.0% 27.8% 21.6% 15.4% 14.5% 14.1% 7.8% 0% 20% 40% 60% 80% 100% affordable housing security road congestion health services corruption / transparency air pollution unemployment public transport school education fulfilling employment basic amenities (water, waste) recycling Green spaces social mobility / inclusiveness citizen engagement 57.7% 66.2% 53.6% 69.9% 0% 20% 40% 60% 80% 100% 0 20 40 60 80 100 0 20 40 60 80 100
Score % of
Priority Area Score GROUP MEAN CITY LEGEND: MIN GROUP MAX CITY MEAN LEGEND:
▼
Newcastle
% of respondents who chose the Priority Area

From a list of 15 indicators, survey respondents were asked to select 5 that they perceived as the most urgent for their city. The higher the percentage of responses per area, the greater the priority for the city.
% of respondents who agree or strongly agree with the statement
ATTITUDES
You are willing to concede personal data in order to improve traffic congestion
You are comfortable with face recognition technologies to lower crime
You feel the availability of online information has increased your trust in authorities
The proportion of your day-to-day payment transactions that are non-cash (% of transactions)
PRIORITY AREAS
City Population HDI
BACKGROUND INFORMATION
Map tiles by Stamen Design CC BY 3.0 Map Data © OpenStreetMap Country United Kingdom HDI Life expectancy at birth Expected years of schooling Mean years of schooling GNI per capita (PPP $)
Basic sanitation meets the needs of the poorest areas Online reporting of city maintenance problems provides a speedy solution Recycling services are satisfactory A website or App allows residents to easily give away unwanted items Public safety is not a problem Free public wifi has improved access to city services Air pollution is not a problem CCTV cameras has made residents feel safer Medical services provision is satisfactory A website or App allows residents to effectively monitor air pollution Finding housing with rent equal to 30% or less of a monthly salary is not a problem Arranging medical appointments online has improved access Mobility Mobility Traffic congestion is not a problem Car-sharing Apps have reduced congestion Public transport is satisfactory Apps that direct you to an available parking space have reduced journey time Bicycle hiring has reduced congestion Online scheduling and ticket sales has made public transport easier to use The city provides information on traffic congestion through mobile phones Activities Activities Green spaces are satisfactory Online purchasing of tickets to shows and museums has made it easier to attend Cultural activities (shows, bars, and museums) are satisfactory Opportunities (Work & School) Opportunities (Work & School) Employment finding services are readily available Online access to
work
good
IT
schools Lifelong learning opportunities are provided
institutions
services
business Businesses are creating new jobs The current internet speed and reliability meet connectivity needs Minorities feel welcome Governance Governance Information on local government decisions are easily accessible Online public access to city finances has reduced corruption Corruption of city officials is not an issue of concern Online voting has increased participation Residents contribute to decision making of local government An online platform where residents can propose ideas has improved city life Residents provide feedback on local government projects Processing Identification Documents online has reduced waiting times (Eurostat) 300,000 0.901 (Global Data Lab)
Health & Safety Health & Safety
job listings has made it easier to find
Most children have access to a
school
skills are taught well in
by local
Online
provided by the city has made it easier to start a new
75.1 45.6 62.1 68.0 STRUCTURES TECHNOLOGIES 44.5 66.3 42.6 48.7 58.2 57.0 29.9 53.0 36.5 38.4 38.6 All ratings range from AAA to D
3 63.1 GROUP CC TECHNOLOGIES CC FACTOR RATINGS B STRUCTURES 60.7 64.7 2020 80.7 +0.009 +1.4 +0.0 +0.0 47.7 58.4 80.8 36.1 65.5
77
62.2 1 yr change 13.4 40,799 13.4 46,624 2021 2022 0.940 82.2 17.6 17.6 2019 ▬ 77 in 2023 Out of 142 Out of 141 66.0 55.8 55.0 45.5 43.4 13.3 0.920 80.4 17.2 13.4 0.931 64.6 68.9 44,750 SMART CITY RANKING CCC in 2023 54.2 37.7 51.8 57.4 70.7 61.1 60.9 45.6 SMART CITY RATING +1,874 47,066 0.933 81.7 17.2 77.9% 56.9% 54.6% 37.2% 36.6% 31.3% 28.9% 20.5% 20.1% 19.7% 19.4% 17.8% 15.6% 13.3% 11.2% 0% 20% 40% 60% 80% 100% affordable housing unemployment health services road congestion fulfilling employment security public transport recycling Green spaces school education air pollution citizen engagement social mobility / inclusiveness basic amenities (water, waste) corruption / transparency 57.7% 72.1% 55.7% 75.6% 0% 20% 40% 60% 80% 100% 0 20 40 60 80 100 0 20 40 60 80 100
Score
Score GROUP MEAN CITY LEGEND: MIN GROUP MAX CITY MEAN LEGEND:
Nicosia
respondents who chose the Priority Area

From a list of 15 indicators, survey respondents were asked to select 5 that they perceived as the most urgent for their city. The higher the percentage of responses per area, the greater the priority for the city.
% of respondents who agree or strongly agree with the statement
ATTITUDES
You are willing to concede personal data in order to improve traffic congestion
You are comfortable with face recognition technologies to lower crime
You feel the availability of online information has increased your trust in authorities
The proportion of your day-to-day payment transactions that are non-cash (% of transactions)
PRIORITY AREAS
City Population HDI
BACKGROUND INFORMATION
Map tiles by Stamen Design CC BY 3.0 Map Data © OpenStreetMap Country Cyprus HDI Life expectancy at birth Expected years of schooling Mean years of schooling GNI per capita (PPP $)
Basic sanitation meets the needs of the poorest areas Online reporting of city maintenance problems provides a speedy solution Recycling services are satisfactory A website or App allows residents to easily give away unwanted items Public safety is not a problem Free public wifi has improved access to city services Air pollution is not a problem CCTV cameras has made residents feel safer Medical services provision is satisfactory A website or App allows residents to effectively monitor air pollution Finding housing with rent equal to 30% or less of a monthly salary is not a problem Arranging medical appointments online has improved access Mobility Mobility Traffic congestion is not a problem Car-sharing Apps have reduced congestion Public transport is satisfactory Apps that direct you to an available parking space have reduced journey time Bicycle hiring has reduced congestion Online scheduling and ticket sales has made public transport easier to use The city provides information on traffic congestion through mobile phones Activities Activities Green spaces are satisfactory Online purchasing of tickets to shows and museums has made it easier to attend Cultural activities (shows, bars, and museums) are satisfactory Opportunities (Work & School) Opportunities (Work & School) Employment finding services are readily available Online access to job
work
children
a good school IT skills
taught well in schools Lifelong learning opportunities are provided by local institutions Online services provided by the city
it easier to start a
business Businesses are creating new jobs The current internet speed and reliability meet connectivity needs Minorities feel welcome Governance Governance Information on local government decisions are easily accessible Online public access to city finances has reduced corruption Corruption of city officials is not an issue of concern Online voting has increased participation Residents contribute to decision making of local government An online platform where residents can propose ideas has improved city life Residents provide feedback on local government projects Processing Identification Documents online has reduced waiting times (Eurostat) 900,000 0.896 (Global Data Lab)
Health & Safety Health & Safety
listings has made it easier to find
Most
have access to
are
has made
new
74.3 35.6 42.4 71.1 STRUCTURES TECHNOLOGIES 40.0 52.2 29.2 37.3 41.4 58.6 44.5 44.6 13.9 28.4 31.5 All ratings range from AAA to D
3 68.3 GROUP C TECHNOLOGIES C FACTOR RATINGS CC STRUCTURES 18.2 54.6 2020 81.2 +0.006 +0.7 +0.0 +0.0 47.4 53.9 58.4 18.4 44.5
118
46.6 1 yr change 12.4 36,716 12.4 40,137 2021 2022 0.907 81.9 16.2 16.2 2019
117 in 2023 Out of 142 Out of 141 77.0 33.3 51.3 23.9 27.6 12.4 0.900 81.4 16.2 12.4 0.901 43.9 52.6 38,169 SMART CITY RANKING C in 2023 41.5 21.9 22.6 28.9 60.4 46.9 50.8 43.9 SMART CITY RATING +1,968 39,467 0.901 81.4 16.0 60.2% 56.0% 44.5% 43.5% 41.0% 36.3% 35.5% 29.9% 25.6% 25.3% 21.2% 15.5% 15.4% 13.3% 12.1% 0% 20% 40% 60% 80% 100% affordable housing road congestion corruption / transparency public transport security health services Green spaces school education fulfilling employment unemployment recycling basic amenities (water, waste) air pollution citizen engagement social mobility / inclusiveness 62.3% 67.1% 50.5% 71.2% 0% 20% 40% 60% 80% 100% 0 20 40 60 80 100 0 20 40 60 80 100
Score % of
Score GROUP MEAN CITY LEGEND: MIN GROUP MAX CITY MEAN LEGEND:
▼
respondents who chose the Priority

From a list of 15 indicators, survey respondents were asked to select 5 that they perceived as the most urgent for their city. The higher the percentage of responses per area, the greater the priority for the city.
of respondents who agree or strongly agree with the statement
ATTITUDES
You are willing to concede personal data in order to improve traffic congestion
You are comfortable with face recognition technologies to lower crime
You feel the availability of online information has increased your trust in authorities
The proportion of your day-to-day payment transactions that are non-cash (% of transactions)
PRIORITY AREAS
City Population HDI
BACKGROUND INFORMATION
Map tiles by Stamen Design CC BY 3.0 Map Data © OpenStreetMap Country Japan HDI Life expectancy at birth Expected years of schooling Mean years of schooling GNI per capita (PPP $)
sanitation meets the needs of the poorest areas
reporting of city maintenance problems provides a speedy solution Recycling services are satisfactory A website or App allows residents to easily give away unwanted items Public safety is not a problem Free public wifi has improved access to city services Air pollution is not a problem CCTV cameras has made residents feel safer Medical services provision is satisfactory A website or App allows residents to effectively monitor air pollution Finding housing with rent equal to 30% or less of a monthly salary is not a problem Arranging medical appointments online has improved access Mobility Mobility Traffic congestion is not a problem Car-sharing Apps have reduced congestion Public transport is satisfactory Apps that direct you to an available parking space have reduced journey time Bicycle hiring has reduced congestion Online scheduling and ticket sales has made public transport easier to use The city provides information on traffic congestion through mobile phones Activities Activities Green spaces are satisfactory Online purchasing of tickets to shows and museums has made it easier to attend Cultural activities (shows, bars, and museums) are satisfactory Opportunities (Work & School) Opportunities (Work & School) Employment finding services are readily available Online access to job
Health & Safety Health & Safety Basic
Online
listings has made it easier to find work
IT
Businesses are creating new jobs The current
reliability meet connectivity needs Minorities feel welcome Governance Governance Information on local government decisions are easily accessible Online public access to city finances has reduced corruption Corruption of city officials is not an issue of concern Online voting has increased participation Residents contribute to decision making of local government An online platform where residents can propose ideas has improved city life Residents provide feedback on local government projects Processing Identification Documents online has reduced waiting times (UN Data) 2,750,000 0.928 (Global Data Lab)
Most children have access to a good school
skills are taught well in schools Lifelong learning opportunities are provided by local institutions Online services provided by the city has made it easier to start a new business
internet speed and
54.5 54.2 46.7 56.9 STRUCTURES TECHNOLOGIES 42.8 51.0 28.1 41.5 52.6 70.5 37.0 47.5 38.0 27.1 34.4 All ratings range from AAA to D
2 68.4 GROUP B TECHNOLOGIES CCC FACTOR RATINGS BB STRUCTURES 73.3 55.0 2020 84.8 +0.000 +0.0 +0.0 +0.0 49.5 49.3 58.7 52.0 49.8
46.4 1 yr change 12.7 41,446 12.7 43,644 2021 2022 0.920 84.8 15.5 15.5 2019 ▲ 98 in 2023 Out of 142 Out of 141 54.4 46.3 42.3 46.4 32.9 12.7 0.917 84.7 15.5 12.7 0.920 38.2 65.3 43,008 SMART CITY RANKING B in 2023 54.3 32.8 35.3 29.8 54.9 33.8 56.8 37.2 SMART CITY RATING +636 43,276 0.918 84.4 15.4 51.1% 49.9% 39.0% 36.5% 35.7% 33.3% 32.3% 28.8% 26.9% 24.5% 23.1% 21.8% 19.1% 16.0% 14.4% 0% 20% 40% 60% 80% 100% basic amenities (water, waste) health services affordable housing road congestion school education security public transport fulfilling employment corruption / transparency Green spaces unemployment citizen engagement air pollution social mobility / inclusiveness recycling 41.5% 63.8% 40.2% 68.8% 0% 20% 40% 60% 80% 100% 0 20 40 60 80 100 0 20 40 60 80 100
Score % of
Score GROUP MEAN CITY LEGEND: MIN GROUP MAX CITY MEAN LEGEND:
95
Osaka
%
Area
Oslo
respondents who chose the

From a list of 15 indicators, survey respondents were asked to select 5 that they perceived as the most urgent for their city. The higher the percentage of responses per area, the greater the priority for the city.
% of respondents who agree or strongly agree with the statement
ATTITUDES
You are willing to concede personal data in order to improve traffic congestion
You are comfortable with face recognition technologies to lower crime
You feel the availability of online information has increased your trust in authorities
The proportion of your day-to-day payment transactions that are non-cash (% of transactions)
Health & Safety Health & Safety
listings has made it easier to find work
Most children have access to a good school IT skills are taught well in schools
Lifelong learning opportunities are provided by local institutions
Online services provided by the city has made it easier to start a new business Businesses are creating new jobs The current internet speed and reliability meet connectivity needs
PRIORITY AREAS
City Population HDI
BACKGROUND INFORMATION
Map tiles by Stamen Design CC BY 3.0 Map Data © OpenStreetMap Country Norway HDI Life expectancy at birth Expected years of schooling Mean years of schooling GNI per capita (PPP $)
Basic sanitation meets the needs of the poorest areas Online reporting of city maintenance problems provides a speedy solution Recycling services are satisfactory A website or App allows residents to easily give away unwanted items Public safety is not a problem Free public wifi has improved access to city services Air pollution is not a problem CCTV cameras has made residents feel safer Medical services provision is satisfactory A website or App allows residents to effectively monitor air pollution Finding housing with rent equal to 30% or less of a monthly salary is not a problem Arranging medical appointments online has improved access Mobility Mobility Traffic congestion is not a problem Car-sharing Apps have reduced congestion Public transport is satisfactory Apps that direct you to an available parking space have reduced journey time Bicycle hiring has reduced congestion Online scheduling and ticket sales has made public transport easier to use The city provides information on traffic congestion through mobile phones Activities Activities Green spaces are satisfactory Online purchasing of tickets to shows and museums has made it easier to attend Cultural activities (shows, bars, and museums) are satisfactory Opportunities (Work & School) Opportunities (Work & School) Employment finding services are readily available Online access to job
Minorities feel welcome Governance Governance Information on local government decisions are easily accessible Online public access to city finances has reduced corruption Corruption of city officials is not an issue of concern Online voting has increased participation Residents contribute to decision making of local government An online platform where residents can propose ideas has improved city life Residents provide feedback on local government projects Processing Identification Documents online has reduced waiting times (UN World Urbanization Prospects) 1,040,000 0.980 (Global Data Lab)
80.7 46.9 78.0 70.7 STRUCTURES TECHNOLOGIES 47.4 71.8 52.2 59.0 46.3 70.2 42.7 72.5 45.3 41.9 39.6 All ratings range from AAA to D 2 1 75.6 GROUP AA TECHNOLOGIES A FACTOR RATINGS AA STRUCTURES 62.8 75.7 2020 83.2 +0.002 +0.2 +0.0 +0.0 67.2 72.0 81.5 27.9 77.1
44.3 1 yr change 13.1 66,258 13.1 69,190 2021 2022 0.966 83.4 18.6 18.6 2019 ▬ 2 in 2023 Out of 142 Out of 141 71.3 64.1 51.0 56.3 41.4 13.0 0.963 83.2 18.3 13.1 0.964 64.6 77.3 67,597 SMART CITY RANKING AAA in 2023 64.4 41.9 56.8 45.8 80.0 55.4 69.3 46.5 SMART CITY RATING +1,593 66,977 0.961 83.0 18.2 73.4% 39.5% 36.5% 34.9% 33.9% 33.3% 30.6% 30.5% 23.5% 18.2% 18.0% 17.9% 17.7% 17.5% 14.7% 0% 20% 40% 60% 80% 100% affordable housing health services public transport security road congestion air pollution social mobility / inclusiveness unemployment school education recycling basic amenities (water, waste) corruption / transparency citizen engagement Green spaces fulfilling employment 56.2% 64.2% 59.8% 83.5% 0% 20% 40% 60% 80% 100% 0 20 40 60 80 100 0 20 40 60 80 100
Score
Area Score GROUP MEAN CITY LEGEND: MIN GROUP MAX CITY MEAN LEGEND:
% of
Priority
Ottawa
of respondents who chose the Priority Area

From a list of 15 indicators, survey respondents were asked to select 5 that they perceived as the most urgent for their city. The higher the percentage of responses per area, the greater the priority for the city.
% of respondents who agree or strongly agree with the statement
ATTITUDES
You are willing to concede personal data in order to improve traffic congestion
You are comfortable with face recognition technologies to lower crime
You feel the availability of online information has increased your trust in authorities
The proportion of your day-to-day payment transactions that are non-cash (% of transactions)
PRIORITY AREAS
City Population HDI
BACKGROUND INFORMATION
Map tiles by Stamen Design CC BY 3.0 Map Data © OpenStreetMap Country Canada HDI Life expectancy at birth Expected years of schooling Mean years of schooling GNI per capita (PPP $)
Basic sanitation meets the needs of the poorest areas Online reporting of city maintenance problems provides a speedy solution Recycling services are satisfactory A website or App allows residents to easily give away unwanted items Public safety is not a problem Free public wifi has improved access to city services Air pollution is not a problem CCTV cameras has made residents feel safer Medical services provision is satisfactory A website or App allows residents to effectively monitor air pollution Finding housing with rent equal to 30% or less of a monthly salary is not a problem Arranging medical appointments online has improved access Mobility Mobility Traffic congestion is not a problem Car-sharing Apps have reduced congestion Public transport is satisfactory Apps that direct you to an available parking space have reduced journey time Bicycle hiring has reduced congestion Online scheduling and ticket sales has made public transport easier to use The city provides information on traffic congestion through mobile phones Activities Activities Green spaces are satisfactory Online purchasing of tickets to shows and museums has made it easier to attend Cultural activities (shows, bars, and museums) are satisfactory Opportunities (Work & School) Opportunities (Work & School) Employment finding services are readily available Online access to job
Health & Safety Health & Safety
listings has made it easier to find work
IT
Businesses
jobs The
needs Minorities feel welcome Governance Governance Information on local government decisions are easily accessible Online public access to city finances has reduced corruption Corruption of city officials is not an issue of concern Online voting has increased participation Residents contribute to decision making of local government An online platform where residents can propose ideas has improved city life Residents provide feedback on local government projects Processing Identification Documents online has reduced waiting times (UN Data) 930,000 0.943 (Global Data Lab)
Most children have access to a good school
skills are taught well in schools Lifelong learning opportunities are provided by local institutions Online services provided by the city has made it easier to start a new business
are creating new
current internet speed and reliability meet connectivity
70.2 46.0 49.5 72.6 STRUCTURES TECHNOLOGIES 45.0 57.5 36.3 56.1 41.9 46.6 35.5 52.6 35.8 41.2 32.6 All ratings range from AAA to D
1 68.0 GROUP BBB TECHNOLOGIES BBB FACTOR RATINGS A STRUCTURES 38.7 65.2 2020 82.7 +0.001 +0.2 +0.0 +0.0 53.5 63.7 77.3 20.6 74.4
46
48.6 1 yr change 13.9 45,828 13.9 48,444 2021 2022 0.935 82.8 16.0 16.0 2019 ▼ 40 in 2023 Out of 142 Out of 141 64.6 62.2 55.7 50.2 38.7 13.8 0.928 82.0 15.9 13.9 0.934 73.4 72.8 47,933 SMART CITY RANKING A in 2023 63.4 37.0 46.4 44.7 75.3 49.7 71.8 48.5 SMART CITY RATING +512 48,591 0.932 82.4 15.9 86.9% 67.1% 53.2% 38.0% 29.6% 25.5% 25.0% 21.9% 21.7% 17.2% 16.4% 15.8% 14.3% 13.8% 12.0% 0% 20% 40% 60% 80% 100% affordable housing health services public transport road congestion unemployment fulfilling employment security corruption / transparency school education recycling air pollution basic amenities (water, waste) Green spaces social mobility / inclusiveness citizen engagement 55.2% 58.3% 45.1% 78.9% 0% 20% 40% 60% 80% 100% 0 20 40 60 80 100 0 20 40 60 80 100
Score
Score GROUP MEAN CITY LEGEND: MIN GROUP MAX CITY MEAN LEGEND:
%
of respondents who chose the Priority Area

From a list of 15 indicators, survey respondents were asked to select 5 that they perceived as the most urgent for their city. The higher the percentage of responses per area, the greater the priority for the city.
% of respondents who agree or strongly agree with the statement
ATTITUDES
You are willing to concede personal data in order to improve traffic congestion
You are comfortable with face recognition technologies to lower crime
You feel the availability of online information has increased your trust in authorities
The proportion of your day-to-day payment transactions that are non-cash (% of transactions)
PRIORITY AREAS
City Population HDI
BACKGROUND INFORMATION
Map tiles by Stamen Design CC BY 3.0 Map Data © OpenStreetMap Country France HDI Life expectancy at birth Expected years of schooling Mean years of schooling GNI per capita (PPP $)
Basic sanitation meets the needs of the poorest areas Online reporting of city maintenance problems provides a speedy solution Recycling services are satisfactory A website or App allows residents to easily give away unwanted items Public safety is not a problem Free public wifi has improved access to city services Air pollution is not a problem CCTV cameras has made residents feel safer Medical services provision is satisfactory A website or App allows residents to effectively monitor air pollution Finding housing with rent equal to 30% or less of a monthly salary is not a problem Arranging medical appointments online has improved access Mobility Mobility Traffic congestion is not a problem Car-sharing Apps have reduced congestion Public transport is satisfactory Apps that direct you to an available parking space have reduced journey time Bicycle hiring has reduced congestion Online scheduling and ticket sales has made public transport easier to use The city provides information on traffic congestion through mobile phones Activities Activities Green spaces are satisfactory Online purchasing of tickets to shows and museums has made it easier to attend Cultural activities (shows, bars, and museums) are satisfactory Opportunities (Work & School) Opportunities (Work & School) Employment finding services are readily available Online access to job
work
good
IT skills
schools Lifelong learning opportunities are provided
local institutions
services
business Businesses are creating new jobs The current internet speed and reliability meet connectivity needs Minorities feel welcome Governance Governance Information on local government decisions are easily accessible Online public access to city finances has reduced corruption Corruption of city officials is not an issue of concern Online voting has increased participation Residents contribute to decision making of local government An online platform where residents can propose ideas has improved city life Residents provide feedback on local government projects Processing Identification Documents online has reduced waiting times (UN Data) 2,150,000 0.949 (Global Data Lab)
Health & Safety Health & Safety
listings has made it easier to find
Most children have access to a
school
are taught well in
by
Online
provided by the city has made it easier to start a new
77.3 59.5 64.2 66.0 STRUCTURES TECHNOLOGIES 44.1 61.5 59.3 17.1 52.8 53.1 53.8 71.4 22.2 43.0 46.3 All ratings range from AAA to D
1 44.2 GROUP BBB TECHNOLOGIES A FACTOR RATINGS BB STRUCTURES 48.5 57.1 2020 82.5 +0.004 +0.7 +0.0 +0.0 35.0 54.0 78.3 23.2 61.5
59.2 1 yr change 11.7 42,891 11.7 47,379 2021 2022 0.910 83.2 16.0 16.0 2019
46 in 2023 Out of 142 Out of 141 58.2 49.1 55.7 43.0 50.8 11.6 0.900 82.2 15.9 11.7 0.906 41.9 51.4 46,322 SMART CITY RANKING BBB in 2023 53.6 38.1 37.9 49.2 57.3 56.5 55.5 50.7 SMART CITY RATING +1,057 46,907 0.905 82.7 15.9 65.4% 61.1% 58.7% 44.0% 32.3% 29.9% 27.6% 24.2% 24.1% 21.2% 18.4% 17.1% 15.0% 11.0% 7.4% 0% 20% 40% 60% 80% 100% affordable housing security air pollution road congestion public transport health services unemployment recycling basic amenities (water, waste) Green spaces fulfilling employment school education corruption / transparency social mobility / inclusiveness citizen engagement 51.1% 56.8% 51.1% 64.2% 0% 20% 40% 60% 80% 100% 0 20 40 60 80 100 0 20 40 60 80 100
Score
Score GROUP MEAN CITY LEGEND: MIN GROUP MAX CITY MEAN LEGEND:
49
Paris
▼
%
of respondents who chose the Priority Area

From a list of 15 indicators, survey respondents were asked to select 5 that they perceived as the most urgent for their city. The higher the percentage of responses per area, the greater the priority for the city.
% of respondents who agree or strongly agree with the statement
ATTITUDES
You are willing to concede personal data in order to improve traffic congestion
You are comfortable with face recognition technologies to lower crime
You feel the availability of online information has increased your trust in authorities
The proportion of your day-to-day payment transactions that are non-cash (% of transactions)
PRIORITY AREAS
City Population HDI
BACKGROUND INFORMATION
Map tiles by Stamen Design CC BY 3.0 Map Data © OpenStreetMap Country USA HDI Life expectancy at birth Expected years of schooling Mean years of schooling GNI per capita (PPP $)
Basic sanitation meets the needs of the poorest areas Online reporting of city maintenance problems provides a speedy solution Recycling services are satisfactory A website or App allows residents to easily give away unwanted items Public safety is not a problem Free public wifi has improved access to city services Air pollution is not a problem CCTV cameras has made residents feel safer Medical services provision is satisfactory A website or App allows residents to effectively monitor air pollution Finding housing with rent equal to 30% or less of a monthly salary is not a problem Arranging medical appointments online has improved access Mobility Mobility Traffic congestion is not a problem Car-sharing Apps have reduced congestion Public transport is satisfactory Apps that direct you to an available parking space have reduced journey time Bicycle hiring has reduced congestion Online scheduling and ticket sales has made public transport easier to use The city provides information on traffic congestion through mobile phones Activities Activities Green spaces are satisfactory Online purchasing of tickets to shows and museums has made it easier to attend Cultural activities (shows, bars, and museums) are satisfactory Opportunities (Work & School) Opportunities (Work & School) Employment finding services are readily available Online access to job
Health & Safety Health & Safety
listings has made it easier to find work
IT
creating new jobs The current
needs Minorities feel welcome Governance Governance Information on local government decisions are easily accessible Online public access to city finances has reduced corruption Corruption of city officials is not an issue of concern Online voting has increased participation Residents contribute to decision making of local government An online platform where residents can propose ideas has improved city life Residents provide feedback on local government projects Processing Identification Documents online has reduced waiting times (UN Data) 1,600,000 0.923 (Global Data Lab)
Most children have access to a good school
skills are taught well in schools Lifelong learning opportunities are provided by local institutions Online services provided by the city has made it easier to start a new business Businesses are
internet speed and reliability meet connectivity
72.2 54.1 57.4 63.7 STRUCTURES TECHNOLOGIES 38.1 53.6 44.0 32.1 45.5 59.9 37.7 60.1 23.6 42.3 46.3 All ratings range from AAA to D 90 2 45.7 GROUP B TECHNOLOGIES B FACTOR RATINGS B STRUCTURES 49.2 57.4 2020 77.2 +0.006 +1.0 +0.0 +0.0 26.1 54.8 76.1 32.2 49.5
49.4 1 yr change 13.7 61,077 13.6 65,565 2021 2022 0.927 78.2 16.4 16.4 2019 ▲ 92 in 2023 Out of 142 Out of 141 62.6 51.7 53.5 44.9 44.8 13.6 0.923 77.4 16.6 13.6 0.921 59.1 56.1 64,484 SMART CITY RANKING B in 2023 54.9 36.2 34.6 53.7 43.9 44.8 51.8 46.2 SMART CITY RATING +1,081 63,654 0.933 79.1 16.6 71.0% 60.3% 42.0% 36.8% 35.5% 35.4% 33.9% 28.3% 24.8% 23.2% 23.2% 19.3% 16.9% 8.8% 7.4% 0% 20% 40% 60% 80% 100% affordable housing security school education unemployment road congestion health services corruption / transparency fulfilling employment basic amenities (water, waste) public transport air pollution Green spaces recycling citizen engagement social mobility / inclusiveness 48.8% 61.0% 47.0% 69.0% 0% 20% 40% 60% 80% 100% 0 20 40 60 80 100 0 20 40 60 80 100
Philadelphia
Score
Score GROUP MEAN CITY LEGEND: MIN GROUP MAX CITY MEAN LEGEND:
%
Phoenix
respondents who chose the

From a list of 15 indicators, survey respondents were asked to select 5 that they perceived as the most urgent for their city. The higher the percentage of responses per area, the greater the priority for the city.
% of respondents who agree or strongly agree with the statement
ATTITUDES
You are willing to concede personal data in order to improve traffic congestion
You are comfortable with face recognition technologies to lower crime
You feel the availability of online information has increased your trust in authorities
The proportion of your day-to-day payment transactions that are non-cash (% of transactions)
PRIORITY AREAS
City Population HDI
BACKGROUND INFORMATION
Map tiles by Stamen Design CC BY 3.0 Map Data © OpenStreetMap Country USA HDI Life expectancy at birth Expected years of schooling Mean years of schooling GNI per capita (PPP $)
Basic sanitation meets the needs of the poorest areas Online reporting of city maintenance problems provides a speedy solution Recycling services are satisfactory A website or App allows residents to easily give away unwanted items Public safety is not a problem Free public wifi has improved access to city services Air pollution is not a problem CCTV cameras has made residents feel safer Medical services provision is satisfactory A website or App allows residents to effectively monitor air pollution Finding housing with rent equal to 30% or less of a monthly salary is not a problem Arranging medical appointments online has improved access Mobility Mobility Traffic congestion is not a problem Car-sharing Apps have reduced congestion Public transport is satisfactory Apps that direct you to an available parking space have reduced journey time Bicycle hiring has reduced congestion Online scheduling and ticket sales has made public transport easier to use The city provides information on traffic congestion through mobile phones Activities Activities Green spaces are satisfactory Online purchasing of tickets to shows and museums has made it easier to attend Cultural activities (shows, bars, and museums) are satisfactory Opportunities (Work & School) Opportunities (Work & School) Employment finding services are readily available Online access to job
Health & Safety Health & Safety
listings has made it easier to find work
IT
institutions
Businesses are creating new jobs The current
speed
reliability meet connectivity needs Minorities feel welcome Governance Governance Information on local government decisions are easily accessible Online public access to city finances has reduced corruption Corruption of city officials is not an issue of concern Online voting has increased participation Residents contribute to decision making of local government An online platform where residents can propose ideas has improved city life Residents provide feedback on local government projects Processing Identification Documents online has reduced waiting times (UN Data) 1,610,000 0.908 (Global Data Lab)
Most children have access to a good school
skills are taught well in schools Lifelong learning opportunities are provided by local
Online services provided by the city has made it easier to start a new business
internet
and
74.5 55.8 50.7 67.7 STRUCTURES TECHNOLOGIES 45.0 60.2 29.0 31.3 37.7 66.9 43.7 67.6 19.8 39.7 32.7 All ratings range from AAA to D
3 53.8 GROUP CC TECHNOLOGIES C FACTOR RATINGS CCC STRUCTURES 46.0 69.0 2020 77.2 +0.006 +1.0 +0.0 +0.0 36.6 64.0 71.9 22.2 52.1
98
44.4 1 yr change 13.7 61,077 13.6 65,565 2021 2022 0.927 78.2 16.4 16.4 2019
93 in 2023 Out of 142 Out of 141 70.5 54.5 50.9 47.0 37.4 13.6 0.923 77.4 16.6 13.6 0.921 59.3 62.7 64,484 SMART CITY RANKING CC in 2023 58.6 32.8 37.7 46.8 58.6 40.3 58.5 40.5 SMART CITY RATING +1,081 63,654 0.933 79.1 16.6 82.9% 51.4% 44.5% 37.5% 36.6% 34.7% 31.2% 26.8% 25.6% 22.4% 21.0% 18.3% 10.2% 8.3% 8.1% 0% 20% 40% 60% 80% 100% affordable housing road congestion air pollution school education security unemployment health services corruption / transparency basic amenities (water, waste) fulfilling employment public transport recycling citizen engagement Green spaces social mobility / inclusiveness 47.3% 58.5% 44.0% 77.3% 0% 20% 40% 60% 80% 100% 0 20 40 60 80 100 0 20 40 60 80 100
Score % of
Priority Area Score GROUP MEAN CITY LEGEND: MIN GROUP MAX CITY MEAN LEGEND:
▼
Prague
of respondents who chose the Priority Area

From a list of 15 indicators, survey respondents were asked to select 5 that they perceived as the most urgent for their city. The higher the percentage of responses per area, the greater the priority for the city.
% of respondents who agree or strongly agree with the statement
ATTITUDES
You are willing to concede personal data in order to improve traffic congestion
You are comfortable with face recognition technologies to lower crime
You feel the availability of online information has increased your trust in authorities
The proportion of your day-to-day payment transactions that are non-cash (% of transactions)
to job listings has made it easier to find work
PRIORITY AREAS
City Population HDI
BACKGROUND INFORMATION
Map tiles by Stamen Design CC BY 3.0 Map Data © OpenStreetMap Country Czech Rep. HDI Life expectancy at birth Expected years of schooling Mean years of schooling GNI per capita (PPP $)
sanitation meets the needs of the poorest areas Online reporting of city maintenance problems provides a speedy solution Recycling services are satisfactory A website or App allows residents to easily give away unwanted items Public safety is not a problem Free public wifi has improved access to city services Air pollution is not a problem CCTV cameras has made residents feel safer Medical services provision is satisfactory A website or App allows residents to effectively monitor air pollution Finding housing with rent equal to 30% or less of a monthly salary is not a problem Arranging medical appointments online has improved access Mobility Mobility Traffic congestion is not a problem Car-sharing Apps have reduced congestion Public transport is satisfactory Apps that direct you to an available parking space have reduced journey time Bicycle hiring has reduced congestion Online scheduling and ticket sales has made public transport easier to use The city provides information on traffic congestion through mobile phones Activities Activities Green spaces are satisfactory Online purchasing of tickets to shows and museums has made it easier to attend Cultural activities (shows, bars, and museums) are satisfactory Opportunities (Work & School) Opportunities (Work & School) Employment finding services are readily available Online access
Health & Safety Health & Safety Basic
connectivity needs Minorities feel welcome Governance Governance Information on local government decisions are easily accessible Online public access to city finances has reduced corruption Corruption of city officials is not an issue of concern Online voting has increased participation Residents contribute to decision making of local government An online platform where residents can propose ideas has improved city life Residents provide feedback on local government projects Processing Identification Documents online has reduced waiting times (Eurostat) 1,320,000 0.960 (Global Data Lab)
Most children have access to a good school IT skills are taught well in schools Lifelong learning opportunities are provided by local institutions Online services provided by the city has made it easier to start a new business Businesses are creating new jobs The current internet speed and reliability meet
76.4 49.0 69.6 67.0 STRUCTURES TECHNOLOGIES 51.5 60.6 44.6 40.4 63.4 71.7 47.1 62.3 24.8 38.1 50.8 All ratings range from AAA to D 15 1 62.1 GROUP A TECHNOLOGIES A FACTOR RATINGS A STRUCTURES 67.9 71.8 2020 77.7 +0.004 +0.4 +0.0 +0.0 54.2 65.7 79.4 27.6 49.0
58.8 1 yr change 12.9 36,696 12.9 39,945 2021 2022 0.895 78.1 16.3 16.3 2019
14 in 2023 Out of 142 Out of 141 71.9 59.4 61.9 52.3 54.1 12.9 0.891 78.6 16.1 12.9 0.891 57.1 63.1 39,061 SMART CITY RANKING AA in 2023 60.9 38.2 38.2 50.5 70.2 52.5 66.9 49.5 SMART CITY RATING +884 38,512 0.896 79.2 16.1 76.9% 66.3% 44.8% 42.9% 38.6% 33.1% 25.2% 23.8% 21.8% 18.5% 17.1% 15.8% 15.7% 13.9% 12.9% 0% 20% 40% 60% 80% 100% affordable housing road congestion security air pollution corruption / transparency Green spaces unemployment recycling fulfilling employment public transport citizen engagement school education health services social mobility / inclusiveness basic amenities (water, waste) 57.4% 64.8% 57.1% 71.6% 0% 20% 40% 60% 80% 100% 0 20 40 60 80 100 0 20 40 60 80 100
Score
Score GROUP MEAN CITY LEGEND: MIN GROUP MAX CITY MEAN LEGEND:
▼
%
Rabat
respondents who chose the Priority

From a list of 15 indicators, survey respondents were asked to select 5 that they perceived as the most urgent for their city. The higher the percentage of responses per area, the greater the priority for the city.
respondents who agree or strongly agree with the statement
ATTITUDES
You are willing to concede personal data in order to improve traffic congestion
You are comfortable with face recognition technologies to lower crime
You feel the availability of online information has increased your trust in authorities
The proportion of your day-to-day payment transactions that are non-cash (% of transactions)
PRIORITY AREAS
City Population HDI
BACKGROUND INFORMATION
Map tiles by Stamen Design CC BY 3.0 Map Data © OpenStreetMap Country Morocco HDI Life expectancy at birth Expected years of schooling Mean years of schooling GNI per capita (PPP $)
Basic sanitation meets the needs of the poorest areas Online reporting of city maintenance problems provides a speedy solution Recycling services are satisfactory A website or App allows residents to easily give away unwanted items Public safety is not a problem Free public wifi has improved access to city services Air pollution is not a problem CCTV cameras has made residents feel safer Medical services provision is satisfactory A website or App allows residents to effectively monitor air pollution Finding housing with rent equal to 30% or less of a monthly salary is not a problem Arranging medical appointments online has improved access Mobility Mobility Traffic congestion is not a problem Car-sharing Apps have reduced congestion Public transport is satisfactory Apps that direct you to an available parking space have reduced journey time Bicycle hiring has reduced congestion Online scheduling and ticket sales has made public transport easier to use The city provides information on traffic congestion through mobile phones Activities Activities Green spaces are satisfactory Online purchasing of tickets to shows and museums has made it easier to attend Cultural activities (shows, bars, and museums) are satisfactory Opportunities (Work & School) Opportunities (Work & School) Employment finding services are readily available Online access to job
Health & Safety Health & Safety
listings has made it easier to find work
IT
Businesses are creating new jobs The current internet speed and reliability meet connectivity needs Minorities feel welcome Governance Governance Information on local government decisions are easily accessible Online public access to city finances has reduced corruption Corruption of city officials is not an issue of concern Online voting has increased participation Residents contribute to decision making of local government An online platform where residents can propose ideas has improved city life Residents provide feedback on local government projects Processing Identification Documents online has reduced waiting times (UN Data) 190,000 0.702 (Global Data Lab)
Most children have access to a good school
skills are taught well in schools Lifelong learning opportunities are provided by local institutions Online services provided by the city has made it easier to start a new business
70.7 43.1 67.8 62.8 STRUCTURES TECHNOLOGIES 44.3 39.5 40.0 33.3 60.9 46.8 34.8 56.6 34.1 48.6 48.6 All ratings range from AAA to D
4 53.5 GROUP C TECHNOLOGIES C FACTOR RATINGS C STRUCTURES 55.2 40.5 2020 74.0 +0.010 +0.9 +0.6 +0.0 46.3 44.5 73.5 40.1 77.9
126
46.4 1 yr change 6.1 7,474 6.1 7,955 2021 2022 0.698 75.0 14.6 14.0 2019 ▬ 126 in 2023 Out of 142 Out of 141 61.8 42.7 63.7 34.7 43.5 5.9 0.683 73.9 13.9 6.1 0.688 61.8 51.4 7,948 SMART CITY RANKING C in 2023 52.0 39.1 30.2 38.6 46.3 51.9 49.9 53.8 SMART CITY RATING +7 8,093 0.684 74.3 13.7 58.6% 57.7% 52.2% 41.6% 39.3% 31.2% 28.8% 27.4% 25.2% 23.5% 22.6% 18.9% 16.7% 14.3% 9.8% 0% 20% 40% 60% 80% 100% affordable housing unemployment health services corruption / transparency school education security fulfilling employment road congestion public transport basic amenities (water, waste) air pollution recycling Green spaces citizen engagement social mobility / inclusiveness 55.6% 85.4% 69.2% 52.2% 0% 20% 40% 60% 80% 100% 0 20 40 60 80 100 0 20 40 60 80 100
Score % of
Score GROUP MEAN CITY LEGEND: MIN GROUP MAX CITY MEAN LEGEND:
% of
Area
Reykjavik
respondents who chose the

From a list of 15 indicators, survey respondents were asked to select 5 that they perceived as the most urgent for their city. The higher the percentage of responses per area, the greater the priority for the city.
% of respondents who agree or strongly agree with the statement
ATTITUDES
You are willing to concede personal data in order to improve traffic congestion
You are comfortable with face recognition technologies to lower crime
You feel the availability of online information has increased your trust in authorities
The proportion of your day-to-day payment transactions that are non-cash (% of transactions)
PRIORITY AREAS
City Population HDI
BACKGROUND INFORMATION
Map tiles by Stamen Design CC BY 3.0 Map Data © OpenStreetMap
Iceland HDI Life expectancy at birth Expected years of schooling Mean years of schooling GNI per capita (PPP $)
Country
sanitation meets the needs of the poorest areas
reporting of city maintenance problems provides a speedy solution Recycling services are satisfactory A website or App allows residents to easily give away unwanted items Public safety is not a problem Free public wifi has improved access to city services Air pollution is not a problem CCTV cameras has made residents feel safer Medical services provision is satisfactory A website or App allows residents to effectively monitor air pollution Finding housing with rent equal to 30% or less of a monthly salary is not a problem Arranging medical appointments online has improved access Mobility Mobility Traffic congestion is not a problem Car-sharing Apps have reduced congestion Public transport is satisfactory Apps that direct you to an available parking space have reduced journey time Bicycle hiring has reduced congestion Online scheduling and ticket sales has made public transport easier to use The city provides information on traffic congestion through mobile phones Activities Activities Green spaces are satisfactory Online purchasing of tickets to shows and museums has made it easier to attend Cultural activities (shows, bars, and museums) are satisfactory Opportunities (Work & School) Opportunities (Work & School) Employment finding services are readily available Online access to job
work
good
IT skills
schools Lifelong learning
provided
institutions
Businesses are creating new jobs The current
speed and reliability meet connectivity needs Minorities feel welcome Governance Governance Information on local government decisions are easily accessible Online public access to city finances has reduced corruption Corruption of city officials is not an issue of concern Online voting has increased participation Residents contribute to decision making of local government An online platform where residents can propose ideas has improved city life Residents provide feedback on local government projects Processing Identification Documents online has reduced waiting times (Eurostat) 240,000 0.959 (Global Data Lab)
Health & Safety Health & Safety Basic
Online
listings has made it easier to find
Most children have access to a
school
are taught well in
opportunities are
by local
Online services provided by the city has made it easier to start a new business
internet
82.4 19.0 51.9 73.0 STRUCTURES TECHNOLOGIES 38.8 63.7 30.0 63.5 50.8 49.7 58.0 62.8 32.1 21.3 29.5 All ratings range from AAA to D
1 75.3 GROUP BBB TECHNOLOGIES BBB FACTOR RATINGS A STRUCTURES 25.6 75.4 2020 82.7 +0.002 +0.1 +0.0 +0.0 78.3 66.7 79.5 6.5 59.1
26
43.9 1 yr change 13.8 51,984 13.8 54,688 2021 2022 0.959 82.8 19.1 19.1 2019 ▬ 26 in 2023 Out of 142 Out of 141 75.5 54.3 61.4 48.9 60.1 13.7 0.955 82.6 18.2 13.8 0.957 57.2 69.8 52,671 SMART CITY RANKING BBB in 2023 51.1 28.9 35.6 41.1 83.6 48.4 77.8 33.8 SMART CITY RATING +2,017 56,453 0.958 82.4 18.2 84.1% 71.1% 52.6% 36.6% 32.8% 26.7% 26.3% 25.4% 24.1% 23.7% 20.3% 15.5% 12.5% 12.5% 12.5% 0% 20% 40% 60% 80% 100% affordable housing health services public transport school education road congestion security basic amenities (water, waste) corruption / transparency Green spaces recycling air pollution fulfilling employment citizen engagement social mobility / inclusiveness unemployment 68.5% 75.4% 60.3% 89.2% 0% 20% 40% 60% 80% 100% 0 20 40 60 80 100 0 20 40 60 80 100
Score
Priority Area Score GROUP MEAN CITY LEGEND: MIN GROUP MAX CITY MEAN LEGEND:
% of
Riga
who chose the

From a list of 15 indicators, survey respondents were asked to select 5 that they perceived as the most urgent for their city. The higher the percentage of responses per area, the greater the priority for the city.
respondents who agree or strongly agree with the statement
ATTITUDES
You are willing to concede personal data in order to improve traffic congestion
You are comfortable with face recognition technologies to lower crime
You feel the availability of online information has increased your trust in authorities
The proportion of your day-to-day payment transactions that are non-cash (% of transactions)
PRIORITY AREAS
City Population HDI
BACKGROUND INFORMATION
Map tiles by Stamen Design CC BY 3.0 Map Data © OpenStreetMap Country Latvia HDI Life expectancy at birth Expected years of schooling Mean years of schooling GNI per capita (PPP $)
sanitation meets the needs of the poorest areas
reporting of city maintenance problems provides a speedy solution Recycling services are satisfactory A website or App allows residents to easily give away unwanted items Public safety is not a problem Free public wifi has improved access to city services Air pollution is not a problem CCTV cameras has made residents feel safer Medical services provision is satisfactory A website or App allows residents to effectively monitor air pollution Finding housing with rent equal to 30% or less of a monthly salary is not a problem Arranging medical appointments online has improved access Mobility Mobility Traffic congestion is not a problem Car-sharing Apps have reduced congestion Public transport is satisfactory Apps that direct you to an available parking space have reduced journey time Bicycle hiring has reduced congestion Online scheduling and ticket sales has made public transport easier to use The city provides information on traffic congestion through mobile phones Activities Activities Green spaces are satisfactory Online purchasing of tickets to shows and museums has made it easier to attend Cultural activities (shows, bars, and museums) are satisfactory Opportunities (Work & School) Opportunities (Work & School) Employment finding services are readily available Online access to job
find work
children
good school IT skills
taught well in schools Lifelong learning opportunities are provided by local institutions
services provided
the
easier
business Businesses are creating new jobs The current internet speed and reliability meet connectivity needs Minorities feel welcome Governance Governance Information on local government decisions are easily accessible Online public access to city finances has reduced corruption Corruption of city officials is not an issue of concern Online voting has increased participation Residents contribute to decision making of local government An online platform where residents can propose ideas has improved city life Residents provide feedback on local government projects Processing Identification Documents online has reduced waiting times (Eurostat) 630,000 0.929 (Global Data Lab)
Health & Safety Health & Safety Basic
Online
listings has made it easier to
Most
have access to a
are
Online
by
city has made it
to start a new
71.1 50.5 64.8 69.3 STRUCTURES TECHNOLOGIES 50.9 59.6 45.7 52.3 56.8 54.6 43.1 57.9 31.8 43.8 48.0 All ratings range from AAA to D
2 60.9 GROUP BB TECHNOLOGIES BB FACTOR RATINGS BB STRUCTURES 59.9 65.0 2020 73.6 +0.014 +2.3 +0.0 +0.0 58.0 53.6 74.0 34.0 66.7
59
59.3 1 yr change 13.3 30,562 13.3 32,083 2021 2022 0.879 75.9 16.6 16.6 2019 ▲ 83 in 2023 Out of 142 Out of 141 74.5 46.6 56.0 36.8 47.2 13.3 0.873 75.5 16.5 13.3 0.865 47.2 67.4 31,443 SMART CITY RANKING B in 2023 54.5 32.8 30.0 42.2 66.4 50.5 62.3 50.5 SMART CITY RATING +640 30,570 0.873 75.5 16.5 60.4% 51.4% 46.9% 43.8% 35.8% 28.5% 26.7% 26.4% 25.7% 24.0% 20.8% 18.4% 16.0% 14.2% 13.5% 0% 20% 40% 60% 80% 100% affordable housing road congestion corruption / transparency unemployment security school education basic amenities (water, waste) citizen engagement public transport fulfilling employment Green spaces air pollution recycling health services social mobility / inclusiveness 48.3% 68.1% 56.3% 71.4% 0% 20% 40% 60% 80% 100% 0 20 40 60 80 100 0 20 40 60 80 100
Score % of
Priority Area Score GROUP MEAN CITY LEGEND: MIN GROUP MAX CITY MEAN LEGEND:
% of
respondents
% of respondents who chose the Priority Area
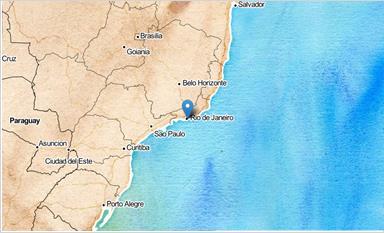
From a list of 15 indicators, survey respondents were asked to select 5 that they perceived as the most urgent for their city. The higher the percentage of responses per area, the greater the priority for the city.
% of respondents who agree or strongly agree with the statement
ATTITUDES
You are willing to concede personal data in order to improve traffic congestion
You are comfortable with face recognition technologies to lower crime
You feel the availability of online information has increased your trust in authorities
The proportion of your day-to-day payment transactions that are non-cash (% of transactions)
listings has made it easier to find work
Most
PRIORITY AREAS
City Population HDI
BACKGROUND INFORMATION
Map tiles by Stamen Design CC BY 3.0 Map Data © OpenStreetMap
Brazil HDI Life expectancy at birth Expected years of schooling Mean years of schooling GNI per capita (PPP $)
Country
Recycling
are satisfactory A website
Public safety is not a problem Free public wifi has
access to city services Air pollution is not a problem CCTV cameras has
residents feel safer Medical services provision is satisfactory A website or App allows
effectively monitor air pollution Finding housing with rent
or less of a monthly salary is not a problem
medical
online has improved access
Traffic
Public
Health & Safety Health & Safety Basic sanitation meets the needs of the poorest areas Online reporting of city maintenance problems provides a speedy solution
services
or App allows residents to easily give away unwanted items
improved
made
residents to
equal to 30%
Arranging
appointments
Mobility Mobility
congestion is not a problem Car-sharing Apps have reduced congestion
transport is satisfactory
Activities Green spaces are satisfactory
purchasing
tickets to shows and museums
easier
attend Cultural activities (shows, bars, and museums)
satisfactory Opportunities (Work & School) Opportunities (Work & School) Employment finding services are readily available Online access to job
Apps that direct you to an available parking space have reduced journey time Bicycle hiring has reduced congestion Online scheduling and ticket sales has made public transport easier to use The city provides information on traffic congestion through mobile phones Activities
Online
of
has made it
to
are
Minorities feel welcome Governance Governance Information on local government decisions are easily accessible Online public access to city finances has reduced corruption Corruption of city officials is not an issue of concern Online voting has increased participation Residents contribute to decision making of local government An online platform where residents can propose ideas has improved city life Residents provide feedback on local government projects Processing Identification Documents online has reduced waiting times (UN World Urbanization Prospects) 13,460,000 0.783 (Global Data Lab)
children have access to a good school IT skills are taught well in schools Lifelong learning opportunities are provided by local institutions Online services provided by the city has made it easier to start a new business Businesses are creating new jobs The current internet speed and reliability meet connectivity needs
74.5 54.2 54.2 55.2 STRUCTURES TECHNOLOGIES 30.9 40.9 45.1 26.0 39.2 28.8 25.8 40.6 14.1 42.7 42.5 All ratings range from AAA to D 139 4 35.5 GROUP D TECHNOLOGIES D FACTOR RATINGS D STRUCTURES 17.8 45.2 2020 72.8 +0.004 +0.7 +0.0 +0.0 13.7 39.2 64.2 19.6 56.3
32.3 1 yr change 8.3 13,815 8.3 14,616 2021 2022 0.760 73.4 15.6 15.6 2019 ▼ 136 in 2023 Out of 142 Out of 141 56.2 27.6 57.4 21.3 35.5 8.1 0.758 74.0 15.4 8.3 0.756 25.0 40.4 14,342 SMART CITY RANKING D in 2023 36.7 22.9 13.6 38.6 22.4 25.0 35.9 46.2 SMART CITY RATING +274 14,291 0.764 75.3 15.4 81.5% 69.9% 49.2% 48.3% 47.6% 37.5% 36.1% 27.4% 25.8% 15.3% 14.6% 13.6% 9.7% 5.2% 4.9% 0% 20% 40% 60% 80% 100% security health services public transport unemployment school education corruption / transparency basic amenities (water, waste) fulfilling employment affordable housing road congestion social mobility / inclusiveness air pollution recycling citizen engagement Green spaces 67.7% 78.2% 46.8% 63.4% 0% 20% 40% 60% 80% 100% 0 20 40 60 80 100 0 20 40 60 80 100
Rio de Janeiro
Score
Score GROUP MEAN CITY LEGEND: MIN GROUP MAX CITY MEAN LEGEND:
Riyadh
% of respondents who chose the Priority Area

From a list of 15 indicators, survey respondents were asked to select 5 that they perceived as the most urgent for their city. The higher the percentage of responses per area, the greater the priority for the city.
% of respondents who agree or strongly agree with the statement
ATTITUDES
You are willing to concede personal data in order to improve traffic congestion
You are comfortable with face recognition technologies to lower crime
You feel the availability of online information has increased your trust in authorities
The proportion of your day-to-day payment transactions that are non-cash (% of transactions)
PRIORITY AREAS
City Population HDI
BACKGROUND INFORMATION
Map tiles by Stamen Design CC BY 3.0 Map Data © OpenStreetMap Country Saudi Arabia HDI Life expectancy at birth Expected years of schooling Mean years of schooling GNI per capita (PPP $)
Recycling services are satisfactory A website or App allows residents
items Public safety is not a problem Free public wifi has improved access to city services Air pollution is not a problem CCTV cameras has made residents feel safer Medical services provision is satisfactory A website or App allows residents to effectively monitor air pollution Finding housing with rent equal to 30% or less of a monthly salary is not a problem Arranging medical appointments online has improved access
Traffic congestion is not a problem Car-sharing
congestion Public transport is satisfactory
time
congestion
scheduling and ticket sales has made public transport easier to use
city provides information on traffic congestion through mobile phones Activities Activities Green spaces are satisfactory Online purchasing of tickets to shows and museums has made it easier to attend Cultural activities (shows, bars, and museums) are satisfactory Opportunities (Work & School) Opportunities (Work & School) Employment finding services are readily available Online access to
Health & Safety Health & Safety Basic sanitation meets the needs of the poorest areas Online reporting of city maintenance problems provides a speedy solution
to easily give away unwanted
Mobility Mobility
Apps have reduced
Apps that direct you to an available parking space have reduced journey
Bicycle hiring has reduced
Online
The
job listings has made it easier to find work
IT
Businesses are creating new jobs
current
and reliability meet connectivity needs Minorities feel welcome Governance Governance Information on local government decisions are easily accessible Online public access to city finances has reduced corruption Corruption of city officials is not an issue of concern Online voting has increased participation Residents contribute to decision making of local government An online platform where residents can propose ideas has improved city life Residents provide feedback on local government projects Processing Identification Documents online has reduced waiting times (UN World Urbanization Prospects) 7,230,000 0.900 (Global Data Lab)
Most children have access to a good school
skills are taught well in schools Lifelong learning opportunities are provided by local institutions Online services provided by the city has made it easier to start a new business
The
internet speed
84.6 70.9 73.6 80.3 STRUCTURES TECHNOLOGIES 78.8 69.7 54.5 34.0 79.8 79.8 59.0 86.5 24.1 63.0 66.9 All ratings range from AAA to D
3 83.8 GROUP B TECHNOLOGIES B FACTOR RATINGS B STRUCTURES 61.1 60.9 2020 76.9 +0.008 +1.0 +0.0 +0.0 49.3 67.6 81.1 53.5 68.9
25
62.8 1 yr change 11.3 45,563 11.3 50,620 2021 2022 0.875 77.9 15.2 15.2 2019 ▲ 30 in 2023 Out of 142 Out of 141 76.1 59.9 86.1 56.2 73.8 10.9 0.861 76.2 15.2 11.3 0.867 68.3 70.5 47,441 SMART CITY RANKING BB in 2023 81.4 70.4 52.4 72.1 77.8 72.7 72.0 73.8 SMART CITY RATING +3,179 47,529 0.862 77.3 15.0 65.4% 62.8% 34.9% 33.1% 31.6% 30.9% 29.8% 26.3% 26.1% 25.4% 24.7% 19.5% 14.8% 13.7% 7.7% 0% 20% 40% 60% 80% 100% affordable housing road congestion unemployment air pollution basic amenities (water, waste) public transport Green spaces security recycling health services fulfilling employment corruption / transparency school education social mobility / inclusiveness citizen engagement 59.1% 85.1% 85.2% 70.7% 0% 20% 40% 60% 80% 100% 0 20 40 60 80 100 0 20 40 60 80 100
Score
Score GROUP MEAN CITY LEGEND: MIN GROUP MAX CITY MEAN LEGEND:
Rome
respondents who chose the

From a list of 15 indicators, survey respondents were asked to select 5 that they perceived as the most urgent for their city. The higher the percentage of responses per area, the greater the priority for the city.
% of respondents who agree or strongly agree with the statement
ATTITUDES
You are willing to concede personal data in order to improve traffic congestion
You are comfortable with face recognition technologies to lower crime
You feel the availability of online information has increased your trust in authorities
The proportion of your day-to-day payment transactions that are non-cash (% of transactions)
Health & Safety Health & Safety
PRIORITY AREAS
City Population HDI
BACKGROUND INFORMATION
Map tiles by Stamen Design CC BY 3.0 Map Data © OpenStreetMap
HDI Life expectancy at birth Expected years of schooling Mean years of schooling GNI per capita (PPP $)
Country Italy
Basic sanitation meets the needs of the poorest areas Online reporting of city maintenance problems provides a speedy solution Recycling services are satisfactory A website or App allows residents to easily give away unwanted items Public safety is not a problem Free public wifi has improved access to city services Air pollution is not a problem CCTV cameras has made residents feel safer Medical services provision is satisfactory A website or App allows residents to effectively monitor air pollution Finding housing with rent equal to 30% or less of a monthly salary is not a problem Arranging medical appointments online has improved access Mobility Mobility Traffic congestion is not a problem Car-sharing Apps have reduced congestion Public transport is satisfactory Apps that direct you to an available parking space have reduced journey time Bicycle hiring has reduced congestion Online scheduling and ticket sales has made public transport easier to use The city provides information on traffic congestion through mobile phones Activities Activities Green spaces are satisfactory Online purchasing of tickets to shows and museums has made it easier to attend Cultural activities (shows, bars, and museums) are satisfactory Opportunities (Work & School) Opportunities (Work & School) Employment finding services are readily available Online access to job
work
IT skills
schools Lifelong learning opportunities are provided
local institutions
services
business Businesses are creating new jobs The current internet speed and reliability meet connectivity needs Minorities feel welcome Governance Governance Information on local government decisions are easily accessible Online public access to city finances has reduced corruption Corruption of city officials is not an issue of concern Online voting has increased participation Residents contribute to decision making of local government An online platform where residents can propose ideas has improved city life Residents provide feedback on local government projects Processing Identification Documents online has reduced waiting times (Eurostat) 2,810,000 0.917 (Global Data Lab)
listings has made it easier to find
Most children have access to a good school
are taught well in
by
Online
provided by the city has made it easier to start a new
77.1 44.5 57.1 45.5 STRUCTURES TECHNOLOGIES 37.2 49.2 35.1 21.3 46.3 39.6 34.2 56.4 11.8 32.4 35.0 All ratings range from AAA to D 133 2 41.6 GROUP CCC TECHNOLOGIES CCC FACTOR RATINGS CCC STRUCTURES 17.7 23.5 2020 82.9 +0.007 +1.2 +0.0 +0.0 28.7 26.1 71.0 37.8 52.5
41.1 1 yr change 10.7 39,587 10.7 44,284 2021 2022 0.906 84.1 16.7 16.7 2019
122 in 2023 Out of 142 Out of 141 50.3 29.1 50.3 20.9 33.0 10.7 0.892 82.4 16.5 10.7 0.899 25.8 25.2 42,856 SMART CITY RANKING CCC in 2023 32.7 27.3 19.9 29.9 48.7 34.0 38.0 36.5 SMART CITY RATING +1,428 43,102 0.899 83.6 16.4 64.7% 62.4% 55.2% 49.6% 47.8% 43.0% 33.6% 27.8% 23.2% 21.1% 15.0% 11.0% 10.5% 8.3% 7.9% 0% 20% 40% 60% 80% 100% recycling public transport road congestion air pollution security basic amenities (water, waste) unemployment affordable housing fulfilling employment corruption / transparency social mobility / inclusiveness health services Green spaces citizen engagement school education 58.0% 59.6% 40.6% 55.9% 0% 20% 40% 60% 80% 100% 0 20 40 60 80 100 0 20 40 60 80 100
Score % of
Priority Area Score GROUP MEAN CITY LEGEND: MIN GROUP MAX CITY MEAN LEGEND:
▼
Rotterdam
% of respondents who chose the Priority Area

From a list of 15 indicators, survey respondents were asked to select 5 that they perceived as the most urgent for their city. The higher the percentage of responses per area, the greater the priority for the city.
% of respondents who agree or strongly agree with the statement
ATTITUDES
You are willing to concede personal data in order to improve traffic congestion
You are comfortable with face recognition technologies to lower crime
You feel the availability of online information has increased your trust in authorities
The proportion of your day-to-day payment transactions that are non-cash (% of transactions)
Health & Safety Health & Safety
PRIORITY AREAS
City Population HDI
BACKGROUND INFORMATION
Map tiles by Stamen Design CC BY 3.0 Map Data © OpenStreetMap Country Netherlands HDI Life expectancy at birth Expected years of schooling Mean years of schooling GNI per capita (PPP $)
sanitation meets the needs of the poorest areas
reporting of city maintenance problems provides a speedy solution Recycling services are satisfactory A website or App allows residents to easily give away unwanted items Public safety is not a problem Free public wifi has improved access to city services Air pollution is not a problem CCTV cameras has made residents feel safer Medical services provision is satisfactory A website or App allows residents to effectively monitor air pollution Finding housing with rent equal to 30% or less of a monthly salary is not a problem Arranging medical appointments online has improved access Mobility Mobility Traffic congestion is not a problem Car-sharing Apps have reduced congestion Public transport is satisfactory Apps that direct you to an available parking space have reduced journey time Bicycle hiring has reduced congestion Online scheduling and ticket sales has made public transport easier to use The city provides information on traffic congestion through mobile phones Activities Activities Green spaces are satisfactory Online purchasing of tickets to shows and museums has made it easier to attend Cultural activities (shows, bars, and museums) are satisfactory Opportunities (Work & School) Opportunities (Work & School) Employment finding services are readily available Online access to job
Basic
Online
listings has made it easier to find work
IT
institutions
Businesses are creating new jobs The current internet speed and reliability meet connectivity needs Minorities feel welcome Governance Governance Information on local government decisions are easily accessible Online public access to city finances has reduced corruption Corruption of city officials is not an issue of concern Online voting has increased participation Residents contribute to decision making of local government An online platform where residents can propose ideas has improved city life Residents provide feedback on local government projects Processing Identification Documents online has reduced waiting times (Eurostat) 620,000 0.941 (Global Data Lab)
Most children have access to a good school
skills are taught well in schools Lifelong learning opportunities are provided by local
Online services provided by the city has made it easier to start a new business
75.8 51.3 61.8 69.8 STRUCTURES TECHNOLOGIES 49.1 59.2 47.2 33.1 55.4 71.6 34.7 62.6 25.7 32.6 51.9 All ratings range from AAA to D
1 56.3 GROUP A TECHNOLOGIES A FACTOR RATINGS BBB STRUCTURES 64.2 68.7 2020 81.7 +0.005 +0.8 +0.0 +0.0 39.2 62.0 73.7 20.7 52.8
41
55.2 1 yr change 12.6 52,500 12.6 57,278 2021 2022 0.946 82.5 18.6 18.6 2019 ▬ 41 in 2023 Out of 142 Out of 141 75.0 57.1 60.6 49.6 53.2 12.5 0.938 81.6 18.4 12.6 0.941 57.7 60.8 55,355 SMART CITY RANKING A in 2023 58.1 39.6 49.4 48.2 71.3 52.0 59.7 53.0 SMART CITY RATING +1,923 55,628 0.941 82.0 18.4 77.8% 68.3% 38.2% 34.3% 32.9% 32.9% 29.7% 27.5% 26.3% 26.1% 17.0% 15.0% 14.7% 11.9% 9.5% 0% 20% 40% 60% 80% 100% affordable housing security health services unemployment road congestion basic amenities (water, waste) Green spaces public transport school education air pollution recycling citizen engagement social mobility / inclusiveness fulfilling employment corruption / transparency 61.0% 62.7% 57.5% 75.9% 0% 20% 40% 60% 80% 100% 0 20 40 60 80 100 0 20 40 60 80 100
Score
Score GROUP MEAN CITY LEGEND: MIN GROUP MAX CITY MEAN LEGEND:
respondents who chose the

From a list of 15 indicators, survey respondents were asked to select 5 that they perceived as the most urgent for their city. The higher the percentage of responses per area, the greater the priority for the city.
% of respondents who agree or strongly agree with the statement
ATTITUDES
You are willing to concede personal data in order to improve traffic congestion
You are comfortable with face recognition technologies to lower crime
You feel the availability of online information has increased your trust in authorities
The proportion of your day-to-day payment transactions that are non-cash (% of transactions)
PRIORITY AREAS
City Population HDI
BACKGROUND INFORMATION
Map tiles by Stamen Design CC BY 3.0 Map Data © OpenStreetMap Country USA HDI Life expectancy at birth Expected years of schooling Mean years of schooling GNI per capita (PPP $)
Basic sanitation meets the needs of the poorest areas Online reporting of city maintenance problems provides a speedy solution Recycling services are satisfactory A website or App allows residents to easily give away unwanted items Public safety is not a problem Free public wifi has improved access to city services Air pollution is not a problem CCTV cameras has made residents feel safer Medical services provision is satisfactory A website or App allows residents to effectively monitor air pollution Finding housing with rent equal to 30% or less of a monthly salary is not a problem Arranging medical appointments online has improved access Mobility Mobility Traffic congestion is not a problem Car-sharing Apps have reduced congestion Public transport is satisfactory Apps that direct you to an available parking space have reduced journey time Bicycle hiring has reduced congestion Online scheduling and ticket sales has made public transport easier to use The city provides information on traffic congestion through mobile phones Activities Activities Green spaces are satisfactory Online purchasing of tickets to shows and museums has made it easier to attend Cultural activities (shows, bars, and museums) are satisfactory Opportunities (Work & School) Opportunities (Work & School) Employment finding services are readily available Online access to job
Health & Safety Health & Safety
listings has made it easier to find work
IT
Businesses are creating new jobs The current
reliability
connectivity needs Minorities feel welcome Governance Governance Information on local government decisions are easily accessible Online public access to city finances has reduced corruption Corruption of city officials is not an issue of concern Online voting has increased participation Residents contribute to decision making of local government An online platform where residents can propose ideas has improved city life Residents provide feedback on local government projects Processing Identification Documents online has reduced waiting times (UN Data) 870,000 0.931 (Global Data Lab)
Most children have access to a good school
skills are taught well in schools Lifelong learning opportunities are provided by local institutions Online services provided by the city has made it easier to start a new business
internet speed and
meet
71.6 54.4 58.3 62.0 STRUCTURES TECHNOLOGIES 35.4 54.2 46.9 42.7 40.8 60.6 47.0 60.2 20.5 46.8 46.7 All ratings range from AAA to D
2 42.8 GROUP BB TECHNOLOGIES B FACTOR RATINGS BB STRUCTURES 51.0 58.4 2020 77.2 +0.006 +1.0 +0.0 +0.0 25.6 53.5 78.3 19.0 63.6
50.4 1 yr change 13.7 61,077 13.6 65,565 2021 2022 0.927 78.2 16.4 16.4 2019
68 in 2023 Out of 142 Out of 141 60.6 63.3 50.5 54.0 45.9 13.6 0.923 77.4 16.6 13.6 0.921 59.7 62.8 64,484 SMART CITY RANKING BB in 2023 62.8 35.6 35.2 53.2 52.0 44.0 60.0 42.1 SMART CITY RATING +1,081 63,654 0.933 79.1 16.6 84.5% 58.9% 46.2% 40.1% 34.3% 30.6% 25.9% 23.8% 20.9% 19.1% 17.8% 14.7% 12.9% 11.8% 11.7% 0% 20% 40% 60% 80% 100% affordable housing security road congestion health services unemployment school education corruption / transparency public transport air pollution fulfilling employment basic amenities (water, waste) social mobility / inclusiveness recycling citizen engagement Green spaces 49.2% 58.9% 47.4% 72.5% 0% 20% 40% 60% 80% 100% 0 20 40 60 80 100 0 20 40 60 80 100
Score % of
Priority Area Score GROUP MEAN CITY LEGEND: MIN GROUP MAX CITY MEAN LEGEND:
75
San Francisco
▼
San José
respondents who chose the Priority Area

From a list of 15 indicators, survey respondents were asked to select 5 that they perceived as the most urgent for their city. The higher the percentage of responses per area, the greater the priority for the city.
% of respondents who agree or strongly agree with the statement
ATTITUDES
You are willing to concede personal data in order to improve traffic congestion
You are comfortable with face recognition technologies to lower crime
You feel the availability of online information has increased your trust in authorities
The proportion of your day-to-day payment transactions that are non-cash (% of transactions)
PRIORITY AREAS
City Population HDI
BACKGROUND INFORMATION
Map tiles by Stamen Design CC BY 3.0 Map Data © OpenStreetMap Country Costa Rica HDI Life expectancy at birth Expected years of schooling Mean years of schooling GNI per capita (PPP $)
Basic sanitation meets the needs of the poorest areas Online reporting of city maintenance problems provides a speedy solution Recycling services are satisfactory A website or App allows residents to easily give away unwanted items Public safety is not a problem Free public wifi has improved access to city services Air pollution is not a problem CCTV cameras has made residents feel safer Medical services provision is satisfactory A website or App allows residents to effectively monitor air pollution Finding housing with rent equal to 30% or less of a monthly salary is not a problem Arranging medical appointments online has improved access Mobility Mobility Traffic congestion is not a problem Car-sharing Apps have reduced congestion Public transport is satisfactory Apps that direct you to an available parking space have reduced journey time Bicycle hiring has reduced congestion Online scheduling and ticket sales has made public transport easier to use The city provides information on traffic congestion through mobile phones Activities Activities Green spaces are satisfactory Online purchasing of tickets to shows and museums has made it easier to attend Cultural activities (shows, bars, and museums) are satisfactory Opportunities (Work & School) Opportunities (Work & School) Employment finding services are readily available Online access to
Health & Safety Health & Safety
job listings has made it easier to find work
IT
Businesses are creating new jobs The current
speed
reliability meet connectivity needs Minorities feel welcome Governance Governance Information on local government decisions are easily accessible Online public access to city finances has reduced corruption Corruption of city officials is not an issue of concern Online voting has increased participation Residents contribute to decision making of local government An online platform where residents can propose ideas has improved city life Residents provide feedback on local government projects Processing Identification Documents online has reduced waiting times (UN Data) 350,000 0.826 (Global Data Lab)
Most children have access to a good school
skills are taught well in schools Lifelong learning opportunities are provided by local institutions Online services provided by the city has made it easier to start a new business
internet
and
75.4 45.8 40.0 66.3 STRUCTURES TECHNOLOGIES 36.0 34.2 25.2 40.6 50.7 59.8 27.3 54.9 18.2 34.2 38.3 All ratings range from AAA to D 125 3 51.6 GROUP C TECHNOLOGIES C FACTOR RATINGS CC STRUCTURES 34.5 56.2 2020 77.0 +0.002 +0.3 +0.0 +0.0 29.6 46.1 72.3 32.8 66.5
52.3 1 yr change 8.8 18,632 8.8 20,248 2021 2022 0.806 77.3 16.1 16.1 2019 ▲ 127 in 2023 Out of 142 Out of 141 59.2 34.3 51.8 29.5 30.8 8.8 0.811 79.3 16.1 8.8 0.804 42.7 54.9 19,913 SMART CITY RANKING C in 2023 45.0 25.6 21.8 26.7 54.0 40.3 56.8 42.9 SMART CITY RATING +335 19,585 0.811 79.4 15.8 80.5% 60.1% 58.8% 55.3% 39.7% 39.0% 31.8% 27.6% 22.1% 18.6% 15.1% 12.9% 10.3% 9.7% 8.2% 0% 20% 40% 60% 80% 100% security corruption / transparency unemployment road congestion affordable housing fulfilling employment health services basic amenities (water, waste) public transport air pollution school education recycling citizen engagement social mobility / inclusiveness Green spaces 57.8% 76.4% 46.8% 68.6% 0% 20% 40% 60% 80% 100% 0 20 40 60 80 100 0 20 40 60 80 100
Score %
Score GROUP MEAN CITY LEGEND: MIN GROUP MAX CITY MEAN LEGEND:
of
Sana'a
% of respondents who chose the Priority Area

From a list of 15 indicators, survey respondents were asked to select 5 that they perceived as the most urgent for their city. The higher the percentage of responses per area, the greater the priority for the city.
% of respondents who agree or strongly agree with the statement
ATTITUDES
You are willing to concede personal data in order to improve traffic congestion
You are comfortable with face recognition technologies to lower crime
You feel the availability of online information has increased your trust in authorities
The proportion of your day-to-day payment transactions that are non-cash (% of transactions)
listings has made it easier to find work
Most
PRIORITY AREAS
City Population HDI
BACKGROUND INFORMATION
Map tiles by Stamen Design CC BY 3.0 Map Data © OpenStreetMap Country Yemen HDI Life expectancy at birth Expected years of schooling Mean years of schooling GNI per capita (PPP $)
sanitation meets the needs of the poorest areas
reporting of city maintenance problems provides a speedy solution Recycling services are satisfactory A website or App allows residents to easily give away unwanted items Public safety is not a problem Free public wifi has improved access to city services Air pollution is not a problem CCTV cameras has made residents feel safer Medical services provision is satisfactory A website or App allows residents to effectively monitor air pollution Finding housing with rent equal to 30% or less of a monthly salary is not a problem Arranging medical appointments online has improved access Mobility Mobility Traffic congestion is not a problem Car-sharing Apps have reduced congestion Public transport is satisfactory Apps that direct you to an available parking space have reduced journey time Bicycle hiring has reduced congestion Online scheduling and ticket sales has made public transport easier to use The city provides information on traffic congestion through mobile phones Activities Activities Green spaces are satisfactory Online purchasing of tickets to shows and museums has made it easier to attend Cultural activities (shows, bars, and museums) are satisfactory Opportunities (Work & School) Opportunities (Work & School) Employment finding services are readily available Online access to job
Health & Safety Health & Safety Basic
Online
children have access to a good school IT skills are taught well in schools Lifelong learning opportunities are provided by local institutions
Minorities feel welcome Governance Governance Information on local government decisions are easily accessible Online public access to city finances has reduced corruption Corruption of city officials is not an issue of concern Online voting has increased participation Residents contribute to decision making of local government An online platform where residents can propose ideas has improved city life Residents provide feedback on local government projects Processing Identification Documents online has reduced waiting times (UN World Urbanization Prospects) 3,180,000 0.521 (Global Data Lab)
Online services provided by the city has made it easier to start a new business Businesses are creating new jobs The current internet speed and reliability meet connectivity needs
25.6 22.0 48.4 50.0 STRUCTURES TECHNOLOGIES 30.3 34.6 49.1 14.3 71.5 30.5 33.3 48.4 17.4 31.8 39.0 All ratings range from AAA to D 141 4 44.7 GROUP D TECHNOLOGIES D FACTOR RATINGS D STRUCTURES 39.6 16.9 2020 63.8 -0.001 -0.0 +0.0 +0.0 34.1 29.3 37.8 28.5 37.8
38.8 1 yr change 2.8 1,152 2.8 1,106 2021 2022 0.424 63.7 7.9 7.9 2019 ▼ 140 in 2023 Out of 142 Out of 141 50.7 30.9 36.7 26.4 35.3 2.7 0.430 64.7 7.9 2.8 0.425 47.0 36.7 1,112 SMART CITY RANKING D in 2023 32.1 28.6 19.8 36.1 33.3 33.8 24.9 42.4 SMART CITY RATING -6 1,165 0.430 65.1 7.9 66.8% 63.2% 59.6% 50.1% 47.2% 36.8% 35.9% 28.9% 28.5% 17.6% 13.3% 11.1% 9.7% 8.8% 3.8% 0% 20% 40% 60% 80% 100% unemployment health services school education affordable housing corruption / transparency security basic amenities (water, waste) fulfilling employment road congestion air pollution public transport Green spaces recycling citizen engagement social mobility / inclusiveness 39.0% 80.8% 53.5% 39.6% 0% 20% 40% 60% 80% 100% 0 20 40 60 80 100 0 20 40 60 80 100
Score
Score GROUP MEAN CITY LEGEND: MIN GROUP MAX CITY MEAN LEGEND:
Santiago
% of respondents who chose the Priority Area

From a list of 15 indicators, survey respondents were asked to select 5 that they perceived as the most urgent for their city. The higher the percentage of responses per area, the greater the priority for the city.
% of respondents who agree or strongly agree with the statement
ATTITUDES
You are willing to concede personal data in order to improve traffic congestion
You are comfortable with face recognition technologies to lower crime
You feel the availability of online information has increased your trust in authorities
The proportion of your day-to-day payment transactions that are non-cash (% of transactions)
PRIORITY AREAS
City Population HDI
BACKGROUND INFORMATION
Map tiles by Stamen Design CC BY 3.0 Map Data © OpenStreetMap Country Chile HDI Life expectancy at birth Expected years of schooling Mean years of schooling GNI per capita (PPP $)
Basic sanitation meets the needs of the poorest areas Online reporting of city maintenance problems provides a speedy solution Recycling services are satisfactory A website or App allows residents to easily give away unwanted items Public safety is not a problem Free public wifi has improved access to city services Air pollution is not a problem CCTV cameras has made residents feel safer Medical services provision is satisfactory A website or App allows residents to effectively monitor air pollution Finding housing with rent equal to 30% or less of a monthly salary is not a problem Arranging medical appointments online has improved access Mobility Mobility Traffic congestion is not a problem Car-sharing Apps have reduced congestion Public transport is satisfactory Apps that direct you to an available parking space have reduced journey time Bicycle hiring has reduced congestion Online scheduling and ticket sales has made public transport easier to use The city provides information on traffic congestion through mobile phones Activities Activities Green spaces are satisfactory Online purchasing of tickets to shows and museums has made it easier to attend Cultural activities (shows, bars, and museums) are satisfactory Opportunities (Work & School) Opportunities (Work & School) Employment finding services are readily available Online access to job
Health & Safety Health & Safety
listings has made it easier to find work
Minorities feel welcome Governance Governance Information on local government decisions are easily accessible Online public access to city finances has reduced corruption Corruption of city officials is not an issue of concern Online voting has increased participation Residents contribute to decision making of local government An online platform where residents can propose ideas has improved city life Residents provide feedback on local government projects Processing Identification Documents online has reduced waiting times (UN World Urbanization Prospects) 5,270,000 0.886 (Global Data Lab)
Most children have access to a good school IT skills are taught well in schools Lifelong learning opportunities are provided by local institutions Online services provided by the city has made it easier to start a new business Businesses are creating new jobs The current internet speed and reliability meet connectivity needs
75.3 60.2 55.3 68.4 STRUCTURES TECHNOLOGIES 41.9 47.6 48.3 18.1 47.1 42.9 37.1 69.8 21.3 37.9 40.9 All ratings range from AAA to D
3 43.5 GROUP C TECHNOLOGIES C FACTOR RATINGS C STRUCTURES 48.3 62.3 2020 78.9 +0.004 +0.6 +0.0 +0.0 17.6 41.1 60.2 18.1 53.7
117
50.8 1 yr change 11.1 21,509 11.1 24,431 2021 2022 0.860 79.5 16.8 16.8 2019
119 in 2023 Out of 142 Out of 141 65.3 39.7 56.2 28.0 35.4 10.9 0.849 79.4 16.3 11.1 0.856 33.2 45.0 23,853 SMART CITY RANKING C in 2023 47.0 29.1 28.3 29.0 35.5 39.9 40.4 56.9 SMART CITY RATING +578 23,893 0.859 80.3 16.6 83.3% 58.5% 49.4% 39.1% 39.0% 37.0% 30.7% 30.2% 20.8% 20.5% 17.9% 17.5% 15.5% 13.3% 9.9% 0% 20% 40% 60% 80% 100% security health services affordable housing unemployment corruption / transparency fulfilling employment air pollution school education Green spaces basic amenities (water, waste) public transport recycling road congestion social mobility / inclusiveness citizen engagement 62.6% 73.6% 45.3% 68.7% 0% 20% 40% 60% 80% 100% 0 20 40 60 80 100 0 20 40 60 80 100
▲
Score
Score GROUP MEAN CITY LEGEND: MIN GROUP MAX CITY MEAN LEGEND:
Sao Paulo
% of respondents who chose the Priority Area

From a list of 15 indicators, survey respondents were asked to select 5 that they perceived as the most urgent for their city. The higher the percentage of responses per area, the greater the priority for the city.
% of respondents who agree or strongly agree with the statement
ATTITUDES
You are willing to concede personal data in order to improve traffic congestion
You are comfortable with face recognition technologies to lower crime
You feel the availability of online information has increased your trust in authorities
The proportion of your day-to-day payment transactions that are non-cash (% of transactions)
PRIORITY AREAS
City Population HDI
BACKGROUND INFORMATION
Map tiles by Stamen Design CC BY 3.0 Map Data © OpenStreetMap Country Brazil HDI Life expectancy at birth Expected years of schooling Mean years of schooling GNI per capita (PPP $)
Basic sanitation meets the needs of the poorest areas Online reporting of city maintenance problems provides a speedy solution Recycling services are satisfactory A website or App allows residents to easily give away unwanted items Public safety is not a problem Free public wifi has improved access to city services Air pollution is not a problem CCTV cameras has made residents feel safer Medical services provision is satisfactory A website or App allows residents to effectively monitor air pollution Finding housing with rent equal to 30% or less of a monthly salary is not a problem Arranging medical appointments online has improved access Mobility Mobility Traffic congestion is not a problem Car-sharing Apps have reduced congestion Public transport is satisfactory Apps that direct you to an available parking space have reduced journey time Bicycle hiring has reduced congestion Online scheduling and ticket sales has made public transport easier to use The city provides information on traffic congestion through mobile phones Activities Activities Green spaces are satisfactory Online purchasing of tickets to shows and museums has made it easier to attend Cultural activities (shows, bars, and museums) are satisfactory Opportunities (Work & School) Opportunities (Work & School) Employment finding services are readily available Online access to job
Health & Safety Health & Safety
listings has made it easier to find work
IT
institutions
Businesses are creating new jobs The current
speed and reliability meet connectivity needs Minorities feel welcome Governance Governance Information on local government decisions are easily accessible Online public access to city finances has reduced corruption Corruption of city officials is not an issue of concern Online voting has increased participation Residents contribute to decision making of local government An online platform where residents can propose ideas has improved city life Residents provide feedback on local government projects Processing Identification Documents online has reduced waiting times (UN World Urbanization Prospects) 22,040,000 0.780 (Global Data Lab)
Most children have access to a good school
skills are taught well in schools Lifelong learning opportunities are provided by local
Online services provided by the city has made it easier to start a new business
internet
77.2 61.7 59.7 56.7 STRUCTURES TECHNOLOGIES 35.8 45.5 43.0 19.9 45.7 33.0 36.4 51.2 13.9 42.8 49.9 All ratings range from AAA to D 132 4 38.7 GROUP D TECHNOLOGIES C FACTOR RATINGS D STRUCTURES 26.8 54.1 2020 72.8 +0.004 +0.7 +0.0 +0.0 17.7 45.8 69.1 21.1 51.6
45.2 1 yr change 8.3 13,815 8.3 14,616 2021 2022 0.760 73.4 15.6 15.6 2019
130 in 2023 Out of 142 Out of 141 63.2 32.6 65.2 27.1 43.5 8.1 0.758 74.0 15.4 8.3 0.756 28.0 49.6 14,342 SMART CITY RANKING D in 2023 40.8 28.9 19.4 44.8 30.9 30.5 44.7 55.2 SMART CITY RATING +274 14,291 0.764 75.3 15.4 80.0% 69.5% 45.8% 44.7% 38.8% 32.5% 32.1% 28.1% 26.6% 24.5% 21.2% 12.8% 11.7% 10.1% 6.6% 0% 20% 40% 60% 80% 100% security health services unemployment school education public transport affordable housing basic amenities (water, waste) air pollution corruption / transparency fulfilling employment road congestion Green spaces social mobility / inclusiveness recycling citizen engagement 64.3% 75.7% 52.7% 61.9% 0% 20% 40% 60% 80% 100% 0 20 40 60 80 100 0 20 40 60 80 100
▼
Score
Score GROUP MEAN CITY LEGEND: MIN GROUP MAX CITY MEAN LEGEND:
respondents who chose the

From a list of 15 indicators, survey respondents were asked to select 5 that they perceived as the most urgent for their city. The higher the percentage of responses per area, the greater the priority for the city.
% of respondents who agree or strongly agree with the statement
ATTITUDES
You are willing to concede personal data in order to improve traffic congestion
You are comfortable with face recognition technologies to lower crime
You feel the availability of online information has increased your trust in authorities
The proportion of your day-to-day payment transactions that are non-cash (% of transactions)
PRIORITY AREAS
City Population HDI
BACKGROUND INFORMATION
Map tiles by Stamen Design CC BY 3.0 Map Data © OpenStreetMap Country USA HDI Life expectancy at birth Expected years of schooling Mean years of schooling GNI per capita (PPP $)
Basic sanitation meets the needs of the poorest areas Online reporting of city maintenance problems provides a speedy solution Recycling services are satisfactory A website or App allows residents to easily give away unwanted items Public safety is not a problem Free public wifi has improved access to city services Air pollution is not a problem CCTV cameras has made residents feel safer Medical services provision is satisfactory A website or App allows residents to effectively monitor air pollution Finding housing with rent equal to 30% or less of a monthly salary is not a problem Arranging medical appointments online has improved access Mobility Mobility Traffic congestion is not a problem Car-sharing Apps have reduced congestion Public transport is satisfactory Apps that direct you to an available parking space have reduced journey time Bicycle hiring has reduced congestion Online scheduling and ticket sales has made public transport easier to use The city provides information on traffic congestion through mobile phones Activities Activities Green spaces are satisfactory Online purchasing of tickets to shows and museums has made it easier to attend Cultural activities (shows, bars, and museums) are satisfactory Opportunities (Work & School) Opportunities (Work & School) Employment finding services are readily available Online access to job
work
good
IT skills
schools Lifelong learning opportunities are provided
local institutions
services provided
the
easier
business Businesses are creating new jobs The current internet speed and reliability meet connectivity needs Minorities feel welcome Governance Governance Information on local government decisions are easily accessible Online public access to city finances has reduced corruption Corruption of city officials is not an issue of concern Online voting has increased participation Residents contribute to decision making of local government An online platform where residents can propose ideas has improved city life Residents provide feedback on local government projects Processing Identification Documents online has reduced waiting times (UN Data) 740,000 0.940 (Global Data Lab)
Health & Safety Health & Safety
listings has made it easier to find
Most children have access to a
school
are taught well in
by
Online
by
city has made it
to start a new
71.7 58.4 53.0 66.5 STRUCTURES TECHNOLOGIES 42.2 64.1 38.8 44.5 37.7 61.2 44.0 65.9 15.6 40.4 37.3 All ratings range from AAA to D
2 41.7 GROUP BB TECHNOLOGIES B FACTOR RATINGS BB STRUCTURES 55.9 66.0 2020 77.2 +0.006 +1.0 +0.0 +0.0 25.0 62.2 76.7 20.2 62.3
47.4 1 yr change 13.7 61,077 13.6 65,565 2021 2022 0.927 78.2 16.4 16.4 2019
55 in 2023 Out of 142 Out of 141 67.8 57.7 51.3 47.3 41.4 13.6 0.923 77.4 16.6 13.6 0.921 64.9 69.1 64,484 SMART CITY RANKING BB in 2023 62.2 34.2 39.4 50.3 61.1 48.6 61.2 40.8 SMART CITY RATING +1,081 63,654 0.933 79.1 16.6 84.9% 63.5% 58.6% 35.6% 34.8% 27.2% 26.8% 23.4% 20.3% 18.0% 17.1% 15.8% 12.9% 12.2% 11.2% 0% 20% 40% 60% 80% 100% affordable housing road congestion security health services unemployment corruption / transparency school education fulfilling employment public transport air pollution Green spaces basic amenities (water, waste) social mobility / inclusiveness recycling citizen engagement 53.2% 54.7% 40.8% 75.0% 0% 20% 40% 60% 80% 100% 0 20 40 60 80 100 0 20 40 60 80 100
Score
of
Area Score GROUP MEAN CITY LEGEND: MIN GROUP MAX CITY MEAN LEGEND:
63
Seattle
▼
%
Priority
% of respondents who chose the Priority Area

From a list of 15 indicators, survey respondents were asked to select 5 that they perceived as the most urgent for their city. The higher the percentage of responses per area, the greater the priority for the city.
% of respondents who agree or strongly agree with the statement
ATTITUDES
You are willing to concede personal data in order to improve traffic congestion
You are comfortable with face recognition technologies to lower crime
You feel the availability of online information has increased your trust in authorities
The proportion of your day-to-day payment transactions that are non-cash (% of transactions)
Health & Safety Health & Safety Basic sanitation meets the needs of the poorest areas Online reporting of city maintenance problems provides a speedy solution
PRIORITY AREAS
City Population HDI
BACKGROUND INFORMATION
Map tiles by Stamen Design CC BY 3.0 Map Data © OpenStreetMap Country Korea,
HDI Life expectancy
GNI
South
at birth Expected years of schooling Mean years of schooling
per capita (PPP $)
Recycling services are satisfactory A website or App
Public safety is not a problem Free public wifi has
access to city services Air pollution is not a problem CCTV cameras has made residents feel safer Medical services provision is satisfactory A website or App allows residents to effectively monitor air pollution Finding housing with rent
to 30% or less of a monthly salary is not a problem Arranging medical appointments online has improved access
Traffic congestion is not a problem
Public transport
satisfactory
scheduling and ticket sales
transport
to use
city
traffic congestion through mobile phones Activities Activities Green spaces are satisfactory Online purchasing of tickets to shows and museums has made it easier to attend Cultural activities (shows, bars, and museums) are satisfactory Opportunities (Work & School) Opportunities (Work & School) Employment finding services are readily available Online access
allows residents to easily give away unwanted items
improved
equal
Mobility Mobility
Car-sharing Apps have reduced congestion
is
Apps that direct you to an available parking space have reduced journey time Bicycle hiring has reduced congestion Online
has made public
easier
The
provides information on
to job listings has made it easier to find work
IT
Businesses
creating new jobs
connectivity needs Minorities feel welcome Governance Governance Information on local government decisions are easily accessible Online public access to city finances has reduced corruption Corruption of city officials is not an issue of concern Online voting has increased participation Residents contribute to decision making of local government An online platform where residents can propose ideas has improved city life Residents provide feedback on local government projects Processing Identification Documents online has reduced waiting times (UN World Urbanization Prospects) 9,960,000 0.952 (Global Data Lab)
Most children have access to a good school
skills are taught well in schools Lifelong learning opportunities are provided by local institutions Online services provided by the city has made it easier to start a new business
are
The current internet speed and reliability meet
79.7 81.0 72.8 79.8 STRUCTURES TECHNOLOGIES 59.1 68.6 46.1 17.0 80.6 73.3 66.7 74.7 20.5 43.4 50.1 All ratings range from AAA to D 17 1 75.4 GROUP AA TECHNOLOGIES AAA FACTOR RATINGS BBB STRUCTURES 72.7 61.6 2020 83.7 +0.003 +0.3 +0.0 +0.0 65.7 43.4 68.1 30.4 54.7
75.9 1 yr change 12.6 42,757 12.6 46,026 2021 2022 0.929 84.0 16.5 16.5 2019
16 in 2023 Out of 142 Out of 141 67.2 49.7 78.7 50.4 56.7 12.5 0.922 83.6 16.4 12.6 0.926 31.1 69.4 44,710 SMART CITY RANKING AA in 2023 64.2 44.2 28.7 57.5 54.0 63.0 62.5 54.9 SMART CITY RATING +1,317 43,117 0.922 83.7 16.4 59.2% 57.7% 49.1% 45.6% 43.7% 42.2% 32.4% 28.3% 21.6% 18.5% 16.9% 16.8% 13.4% 10.0% 9.7% 0% 20% 40% 60% 80% 100% affordable housing air pollution fulfilling employment road congestion corruption / transparency unemployment security basic amenities (water, waste) public transport health services recycling Green spaces social mobility / inclusiveness citizen engagement school education 50.5% 74.3% 53.7% 75.6% 0% 20% 40% 60% 80% 100% 0 20 40 60 80 100 0 20 40 60 80 100
Seoul
▼
Score
Score GROUP MEAN CITY LEGEND: MIN GROUP MAX CITY MEAN LEGEND:
Shanghai
of respondents who chose the Priority Area

From a list of 15 indicators, survey respondents were asked to select 5 that they perceived as the most urgent for their city. The higher the percentage of responses per area, the greater the priority for the city.
% of respondents who agree or strongly agree with the statement
ATTITUDES
You are willing to concede personal data in order to improve traffic congestion
You are comfortable with face recognition technologies to lower crime
You feel the availability of online information has increased your trust in authorities
The proportion of your day-to-day payment transactions that are non-cash (% of transactions)
PRIORITY AREAS
City Population HDI
BACKGROUND INFORMATION
Map tiles by Stamen Design CC BY 3.0 Map Data © OpenStreetMap Country China HDI Life expectancy at birth Expected years of schooling Mean years of schooling GNI per capita (PPP $)
Basic sanitation meets the needs of the poorest areas Online reporting of city maintenance problems provides a speedy solution Recycling services are satisfactory A website or App allows residents to easily give away unwanted items Public safety is not a problem Free public wifi has improved access to city services Air pollution is not a problem CCTV cameras has made residents feel safer Medical services provision is satisfactory A website or App allows residents to effectively monitor air pollution Finding housing with rent equal to 30% or less of a monthly salary is not a problem Arranging medical appointments online has improved access Mobility Mobility Traffic congestion is not a problem Car-sharing Apps have reduced congestion Public transport is satisfactory Apps that direct you to an available parking space have reduced journey time Bicycle hiring has reduced congestion Online scheduling and ticket sales has made public transport easier to use The city provides information on traffic congestion through mobile phones Activities Activities Green spaces are satisfactory Online purchasing of tickets to shows and museums has made it easier to attend Cultural activities (shows, bars, and museums) are satisfactory Opportunities (Work & School) Opportunities (Work & School) Employment finding services are readily available Online access to job
work
Health & Safety Health & Safety
listings has made it easier to find
IT
Lifelong learning opportunities are provided
institutions
services provided
business Businesses are creating new jobs The current internet speed and reliability meet connectivity needs Minorities feel welcome Governance Governance Information on local government decisions are easily accessible Online public access to city finances has reduced corruption Corruption of city officials is not an issue of concern Online voting has increased participation Residents contribute to decision making of local government An online platform where residents can propose ideas has improved city life Residents provide feedback on local government projects Processing Identification Documents online has reduced waiting times (UN World Urbanization Prospects) 27,060,000 0.880 (Global Data Lab)
Most children have access to a good school
skills are taught well in schools
by local
Online
by the city has made it easier to start a new
90.5 88.1 87.5 88.8 STRUCTURES TECHNOLOGIES 84.5 79.6 83.0 55.9 83.8 80.6 80.0 89.7 42.9 72.1 82.7 All ratings range from AAA to D 19 3 86.9 GROUP BB TECHNOLOGIES BB FACTOR RATINGS BB STRUCTURES 66.1 84.8 2020 78.2 +0.003 +0.4 +0.0 +0.0 73.9 77.5 85.7 56.9 79.8
81.8 1 yr change 8.1 16,168 8.1 18,025 2021 2022 0.788 78.6 15.2 15.2 2019 ▲ 25 in 2023 Out of 142 Out of 141 85.5 73.3 86.9 67.9 82.0 8.0 0.781 78.1 15.2 8.1 0.785 83.1 80.9 17,499 SMART CITY RANKING BB in 2023 80.9 75.8 60.6 77.8 77.3 83.1 73.7 80.7 SMART CITY RATING +526 15,934 0.775 78.0 15.0 54.0% 43.8% 42.7% 39.8% 32.8% 31.2% 28.9% 23.9% 23.8% 22.6% 22.6% 17.5% 17.2% 14.9% 13.9% 0% 20% 40% 60% 80% 100% road congestion air pollution affordable housing fulfilling employment health services social mobility / inclusiveness basic amenities (water, waste) corruption / transparency unemployment public transport security Green spaces school education recycling citizen engagement 89.0% 85.5% 90.0% 83.1% 0% 20% 40% 60% 80% 100% 0 20 40 60 80 100 0 20 40 60 80 100
Score
Score GROUP MEAN CITY LEGEND: MIN GROUP MAX CITY MEAN LEGEND:
%
Shenzhen
respondents who chose the

From a list of 15 indicators, survey respondents were asked to select 5 that they perceived as the most urgent for their city. The higher the percentage of responses per area, the greater the priority for the city.
% of respondents who agree or strongly agree with the statement
ATTITUDES
You are willing to concede personal data in order to improve traffic congestion
You are comfortable with face recognition technologies to lower crime
You feel the availability of online information has increased your trust in authorities
The proportion of your day-to-day payment transactions that are non-cash (% of transactions)
PRIORITY AREAS
INFORMATION City Population HDI
BACKGROUND
Map tiles by Stamen Design CC BY 3.0 Map Data © OpenStreetMap Country China HDI Life expectancy at birth Expected years of schooling Mean years of schooling GNI per capita (PPP $)
& Safety Health & Safety Basic sanitation meets the needs of the poorest areas Online reporting of city maintenance problems provides a speedy solution Recycling services are satisfactory A website or App allows residents to easily give away unwanted items Public safety is not a problem Free public wifi has improved access to city services Air pollution is not a problem CCTV cameras has made residents feel safer Medical services provision is satisfactory A website or App allows residents to effectively monitor air pollution Finding housing with rent equal to 30% or less of a monthly salary is not a problem Arranging medical appointments online has improved access Mobility Mobility Traffic congestion is not a problem Car-sharing Apps have reduced congestion Public transport is satisfactory Apps that direct you to an available parking space have reduced journey time Bicycle hiring has reduced congestion Online scheduling and ticket sales has made public transport easier to use The city provides information on traffic congestion through mobile phones Activities Activities Green spaces are satisfactory Online purchasing of tickets to shows and museums has made it easier to attend Cultural activities (shows, bars, and museums) are satisfactory Opportunities (Work & School) Opportunities (Work & School) Employment finding services are readily available Online access to job
to find work
children
a good school IT skills
taught well in schools Lifelong learning opportunities are provided by local institutions Online services provided by the city
it easier to start a new business Businesses are creating new jobs The current internet speed and reliability meet connectivity needs Minorities feel welcome Governance Governance Information on local government decisions are easily accessible Online public access to city finances has reduced corruption Corruption of city officials is not an issue of concern Online voting has increased participation Residents contribute to decision making of local government An online platform where residents can propose ideas has improved city life Residents provide feedback on local government projects Processing Identification Documents online has reduced waiting times (UN World Urbanization Prospects) 12,360,000 0.799 (Global Data Lab)
Health
listings has made it easier
Most
have access to
are
has made
90.9 88.5 89.4 88.9 STRUCTURES TECHNOLOGIES 83.9 79.6 81.2 64.0 82.6 80.4 76.5 89.4 45.2 68.4 84.1 All ratings range from AAA to D 60 4 86.6 GROUP CCC TECHNOLOGIES CCC FACTOR RATINGS CCC STRUCTURES 73.9 84.0 2020 78.2 +0.003 +0.4 +0.0 +0.0 76.0 79.6 84.4 63.4 84.0
80.7 1 yr change 8.1 16,168 8.1 18,025 2021 2022 0.788 78.6 15.2 15.2 2019 ▲ 66 in 2023 Out of 142 Out of 141 86.9 74.1 84.5 60.8 82.5 8.0 0.781 78.1 15.2 8.1 0.785 81.7 79.3 17,499 SMART CITY RANKING CCC in 2023 77.1 72.5 57.6 72.5 74.3 80.3 69.7 81.5 SMART CITY RATING +526 15,934 0.775 78.0 15.0 56.7% 50.9% 47.0% 37.0% 30.8% 30.7% 29.1% 24.5% 24.5% 22.9% 21.2% 16.9% 15.2% 14.5% 12.3% 0% 20% 40% 60% 80% 100% affordable housing road congestion fulfilling employment air pollution corruption / transparency health services social mobility / inclusiveness citizen engagement unemployment school education basic amenities (water, waste) public transport security recycling Green spaces 88.5% 86.0% 92.4% 91.5% 0% 20% 40% 60% 80% 100% 0 20 40 60 80 100 0 20 40 60 80 100
Score
of
Priority Area Score GROUP MEAN CITY LEGEND: MIN GROUP MAX CITY MEAN LEGEND:
%
of respondents who chose the Priority Area

From a list of 15 indicators, survey respondents were asked to select 5 that they perceived as the most urgent for their city. The higher the percentage of responses per area, the greater the priority for the city.
% of respondents who agree or strongly agree with the statement
ATTITUDES
You are willing to concede personal data in order to improve traffic congestion
You are comfortable with face recognition technologies to lower crime
You feel the availability of online information has increased your trust in authorities
The proportion of your day-to-day payment transactions that are non-cash (% of transactions)
Health & Safety Health & Safety
PRIORITY AREAS
City Population HDI
BACKGROUND INFORMATION
Map tiles by Stamen Design CC BY 3.0 Map Data © OpenStreetMap Country Singapore HDI Life expectancy at birth Expected years of schooling Mean years of schooling GNI per capita (PPP $)
sanitation
reporting
Recycling services are satisfactory A website or App allows residents to easily give away unwanted items Public safety is not a problem Free public wifi has improved access to city services Air pollution is not a problem CCTV cameras has made residents feel safer Medical services provision is satisfactory A website or App allows residents to effectively monitor air pollution Finding housing with rent equal to 30% or less of a monthly salary is not a problem Arranging medical appointments online has improved access
Mobility Traffic congestion is not a problem Car-sharing Apps have reduced congestion Public transport is satisfactory
that direct you to an available parking space have reduced journey time Bicycle hiring has reduced congestion Online scheduling and ticket sales has made public transport easier to use
city provides information on traffic congestion through mobile phones Activities Activities Green spaces are satisfactory Online purchasing of tickets to shows and museums has made it easier to attend Cultural activities (shows, bars, and museums) are satisfactory Opportunities (Work & School) Opportunities (Work & School) Employment finding services are readily available Online access to job
Basic
meets the needs of the poorest areas Online
of city maintenance problems provides a speedy solution
Mobility
Apps
The
listings has made it easier to find work
IT
Businesses
creating new jobs
connectivity needs Minorities feel welcome Governance Governance Information on local government decisions are easily accessible Online public access to city finances has reduced corruption Corruption of city officials is not an issue of concern Online voting has increased participation Residents contribute to decision making of local government An online platform where residents can propose ideas has improved city life Residents provide feedback on local government projects Processing Identification Documents online has reduced waiting times (UN World Urbanization Prospects) 5,940,000 0.939 (Global Data Lab)
Most children have access to a good school
skills are taught well in schools Lifelong learning opportunities are provided by local institutions Online services provided by the city has made it easier to start a new business
are
The current internet speed and reliability meet
82.0 75.7 63.2 82.7 STRUCTURES TECHNOLOGIES 70.2 66.8 56.7 64.9 80.8 81.5 62.3 79.2 50.0 57.6 57.5 All ratings range from AAA to D 5 2 84.8 GROUP A TECHNOLOGIES A FACTOR RATINGS A STRUCTURES 78.5 74.1 2020 82.8 +0.007 +1.4 +0.0 +0.0 80.4 69.1 77.1 45.0 76.7
71.3 1 yr change 11.9 81,431 11.9 88,761 2021 2022 0.949 84.1 16.9 16.9 2019 ▲ 7 in 2023 Out of 142 Out of 141 78.5 68.0 79.9 61.3 61.7 11.9 0.942 82.9 16.8 11.9 0.942 69.9 68.9 88,519 SMART CITY RANKING A in 2023 79.1 59.1 66.5 56.2 78.1 69.2 80.7 71.1 SMART CITY RATING +242 86,456 0.945 83.8 16.7 77.1% 50.1% 48.0% 44.6% 31.8% 29.9% 25.8% 23.8% 22.9% 20.6% 19.3% 18.1% 17.6% 16.5% 16.0% 0% 20% 40% 60% 80% 100% affordable housing fulfilling employment unemployment health services recycling citizen engagement social mobility / inclusiveness public transport road congestion security basic amenities (water, waste) air pollution Green spaces school education corruption / transparency 67.9% 75.5% 77.2% 72.4% 0% 20% 40% 60% 80% 100% 0 20 40 60 80 100 0 20 40 60 80 100
Singapore
Score %
Score GROUP MEAN CITY LEGEND: MIN GROUP MAX CITY MEAN LEGEND:
Sofia
of respondents who chose the Priority Area

From a list of 15 indicators, survey respondents were asked to select 5 that they perceived as the most urgent for their city. The higher the percentage of responses per area, the greater the priority for the city.
% of respondents who agree or strongly agree with the statement
ATTITUDES
You are willing to concede personal data in order to improve traffic congestion
You are comfortable with face recognition technologies to lower crime
You feel the availability of online information has increased your trust in authorities
The proportion of your day-to-day payment transactions that are non-cash (% of transactions)
PRIORITY AREAS
City Population HDI
BACKGROUND INFORMATION
Map tiles by Stamen Design CC BY 3.0 Map Data © OpenStreetMap Country Bulgaria HDI Life expectancy at birth Expected years of schooling Mean years of schooling GNI per capita (PPP $)
Basic sanitation meets the needs of the poorest areas Online reporting of city maintenance problems provides a speedy solution Recycling services are satisfactory A website or App allows residents to easily give away unwanted items Public safety is not a problem Free public wifi has improved access to city services Air pollution is not a problem CCTV cameras has made residents feel safer Medical services provision is satisfactory A website or App allows residents to effectively monitor air pollution Finding housing with rent equal to 30% or less of a monthly salary is not a problem Arranging medical appointments online has improved access Mobility Mobility Traffic congestion is not a problem Car-sharing Apps have reduced congestion Public transport is satisfactory Apps that direct you to an available parking space have reduced journey time Bicycle hiring has reduced congestion Online scheduling and ticket sales has made public transport easier to use The city provides information on traffic congestion through mobile phones Activities Activities Green spaces are satisfactory Online purchasing of tickets to shows and museums has made it easier to attend Cultural activities (shows, bars, and museums) are satisfactory Opportunities (Work & School) Opportunities (Work & School) Employment finding services are readily available Online access to job
Health & Safety Health & Safety
listings has made it easier to find work
IT
Businesses are creating new jobs The current
reliability
needs Minorities feel welcome Governance Governance Information on local government decisions are easily accessible Online public access to city finances has reduced corruption Corruption of city officials is not an issue of concern Online voting has increased participation Residents contribute to decision making of local government An online platform where residents can propose ideas has improved city life Residents provide feedback on local government projects Processing Identification Documents online has reduced waiting times (Eurostat) 1,240,000 0.856 (Global Data Lab)
Most children have access to a good school
skills are taught well in schools Lifelong learning opportunities are provided by local institutions Online services provided by the city has made it easier to start a new business
internet speed and
meet connectivity
73.3 52.8 57.6 70.4 STRUCTURES TECHNOLOGIES 42.1 49.6 42.5 23.4 48.5 45.9 49.6 58.6 20.3 39.0 46.3 All ratings range from AAA to D
3 53.1 GROUP C TECHNOLOGIES CC FACTOR RATINGS CC STRUCTURES 50.7 66.7 2020 71.8 +0.003 -0.3 +0.0 +0.0 40.7 55.2 68.9 31.7 43.9
113
52.9 1 yr change 11.4 21,653 11.4 25,921 2021 2022 0.799 71.5 13.9 13.9 2019
111 in 2023 Out of 142 Out of 141 66.6 36.4 54.0 30.2 41.8 11.4 0.802 73.6 14.0 11.4 0.796 44.0 46.5 23,725 SMART CITY RANKING CC in 2023 44.0 27.3 21.6 36.7 53.1 51.1 48.5 51.1 SMART CITY RATING +2,196 22,591 0.813 75.1 14.3 68.8% 60.1% 55.0% 40.3% 38.7% 38.3% 30.5% 25.6% 21.7% 20.0% 20.0% 16.9% 14.4% 9.5% 6.9% 0% 20% 40% 60% 80% 100% air pollution road congestion corruption / transparency security affordable housing health services Green spaces unemployment basic amenities (water, waste) recycling school education fulfilling employment public transport social mobility / inclusiveness citizen engagement 53.1% 67.1% 43.5% 56.1% 0% 20% 40% 60% 80% 100% 0 20 40 60 80 100 0 20 40 60 80 100
Score
Score GROUP MEAN CITY LEGEND: MIN GROUP MAX CITY MEAN LEGEND:
▼
%
Stockholm
respondents who chose the Priority Area

From a list of 15 indicators, survey respondents were asked to select 5 that they perceived as the most urgent for their city. The higher the percentage of responses per area, the greater the priority for the city.
% of respondents who agree or strongly agree with the statement
ATTITUDES
You are willing to concede personal data in order to improve traffic congestion
You are comfortable with face recognition technologies to lower crime
You feel the availability of online information has increased your trust in authorities
The proportion of your day-to-day payment transactions that are non-cash
(% of transactions)
PRIORITY AREAS
City Population HDI
BACKGROUND INFORMATION
Map tiles by Stamen Design CC BY 3.0 Map Data © OpenStreetMap Country Sweden HDI Life expectancy at birth Expected years of schooling Mean years of schooling GNI per capita (PPP $)
Basic sanitation meets the needs of the poorest areas Online reporting of city maintenance problems provides a speedy solution Recycling services are satisfactory A website or App allows residents to easily give away unwanted items Public safety is not a problem Free public wifi has improved access to city services Air pollution is not a problem CCTV cameras has made residents feel safer Medical services provision is satisfactory A website or App allows residents to effectively monitor air pollution Finding housing with rent equal to 30% or less of a monthly salary is not a problem Arranging medical appointments online has improved access Mobility Mobility Traffic congestion is not a problem Car-sharing Apps have reduced congestion Public transport is satisfactory Apps that direct you to an available parking space have reduced journey time Bicycle hiring has reduced congestion Online scheduling and ticket sales has made public transport easier to use The city provides information on traffic congestion through mobile phones Activities Activities Green spaces are satisfactory Online purchasing of tickets to shows and museums has made it easier to attend Cultural activities (shows, bars, and museums) are satisfactory Opportunities (Work & School) Opportunities (Work & School) Employment finding services are readily available Online access to job
IT
Businesses are creating new jobs The current internet speed and reliability meet connectivity needs Minorities feel welcome Governance Governance Information on local government decisions are easily accessible Online public access to city finances has reduced corruption Corruption of city officials is not an issue of concern Online voting has increased participation Residents contribute to decision making of local government An online platform where residents can propose ideas has improved city life Residents provide feedback on local government projects Processing Identification Documents online has reduced waiting times (Eurostat) 950,000 0.972 (Global Data Lab)
Health & Safety Health & Safety
listings has made it easier to find work Most children have access to a good school
skills are taught well in schools Lifelong learning opportunities are provided by local institutions Online services provided by the city has made it easier to start a new business
74.3 56.0 69.6 66.6 STRUCTURES TECHNOLOGIES 47.7 60.9 38.9 50.8 51.7 58.8 37.9 57.8 27.4 33.5 40.2 All ratings range from AAA to D
1 63.8 GROUP A TECHNOLOGIES A FACTOR RATINGS A STRUCTURES 53.5 69.2 2020 83.0 +0.003 +0.5 +0.0 +0.0 41.1 65.6 78.7 26.2 73.3
11
54.6 1 yr change 12.7 53,195 12.7 56,996 2021 2022 0.952 83.5 19.0 19.0 2019
10 in 2023 Out of 142 Out of 141 64.6 54.0 48.7 48.7 48.0 12.6 0.944 82.4 18.7 12.7 0.949 53.8 71.4 55,908 SMART CITY RANKING A in 2023 65.9 38.4 50.6 43.4 70.7 50.4 66.8 49.2 SMART CITY RATING +1,088 54,441 0.947 83.1 18.5 71.7% 68.8% 64.3% 41.4% 35.4% 34.7% 23.8% 21.9% 20.2% 17.0% 16.0% 15.1% 12.7% 12.1% 7.8% 0% 20% 40% 60% 80% 100% affordable housing security health services unemployment school education public transport road congestion fulfilling employment Green spaces social mobility / inclusiveness air pollution recycling corruption / transparency basic amenities (water, waste) citizen engagement 50.8% 66.5% 55.9% 81.4% 0% 20% 40% 60% 80% 100% 0 20 40 60 80 100 0 20 40 60 80 100
Score % of
Score GROUP MEAN CITY LEGEND: MIN GROUP MAX CITY MEAN LEGEND:
▼
Sydney
% of respondents who chose the Priority Area

From a list of 15 indicators, survey respondents were asked to select 5 that they perceived as the most urgent for their city. The higher the percentage of responses per area, the greater the priority for the city.
% of respondents who agree or strongly agree with the statement
ATTITUDES
You are willing to concede personal data in order to improve traffic congestion
You are comfortable with face recognition technologies to lower crime
You feel the availability of online information has increased your trust in authorities
The proportion of your day-to-day payment transactions that are non-cash (% of transactions)
listings has made it easier to find work
PRIORITY AREAS
City Population HDI
BACKGROUND INFORMATION
Map tiles by Stamen Design CC BY 3.0 Map Data © OpenStreetMap Country Australia HDI Life expectancy at birth Expected years of schooling Mean years of schooling GNI per capita (PPP $)
Basic sanitation meets the needs of the poorest areas Online reporting of city maintenance problems provides a speedy solution Recycling services are satisfactory A website or App allows residents to easily give away unwanted items Public safety is not a problem Free public wifi has improved access to city services Air pollution is not a problem CCTV cameras has made residents feel safer Medical services provision is satisfactory A website or App allows residents to effectively monitor air pollution Finding housing with rent equal to 30% or less of a monthly salary is not a problem Arranging medical appointments online has improved access Mobility Mobility Traffic congestion is not a problem Car-sharing Apps have reduced congestion Public transport is satisfactory Apps that direct you to an available parking space have reduced journey time Bicycle hiring has reduced congestion Online scheduling and ticket sales has made public transport easier to use The city provides information on traffic congestion through mobile phones Activities Activities Green spaces are satisfactory Online purchasing of tickets to shows and museums has made it easier to attend Cultural activities (shows, bars, and museums) are satisfactory Opportunities (Work & School) Opportunities (Work & School) Employment finding services are readily available Online access to job
Health & Safety Health & Safety
Minorities feel welcome Governance Governance Information on local government decisions are easily accessible Online public access to city finances has reduced corruption Corruption of city officials is not an issue of concern Online voting has increased participation Residents contribute to decision making of local government An online platform where residents can propose ideas has improved city life Residents provide feedback on local government projects Processing Identification Documents online has reduced waiting times (UN World Urbanization Prospects) 4,930,000 0.952 (Global Data Lab)
Most children have access to a good school IT skills are taught well in schools Lifelong learning opportunities are provided by local institutions Online services provided by the city has made it easier to start a new business Businesses are creating new jobs The current internet speed and reliability meet connectivity needs
75.9 60.8 57.8 62.9 STRUCTURES TECHNOLOGIES 51.7 67.5 36.1 47.1 62.3 65.8 43.5 72.0 24.5 38.0 40.1 All ratings range from AAA to D
1 67.8 GROUP A TECHNOLOGIES A FACTOR RATINGS BBB STRUCTURES 59.2 68.3 2020 84.5 -0.003 -0.9 +0.0 +0.0 48.8 63.0 74.3 23.1 65.6
22
59.2 1 yr change 12.7 48,075 12.7 49,257 2021 2022 0.946 83.6 21.1 21.1 2019
18 in 2023 Out of 142 Out of 141 70.0 58.1 61.9 47.8 47.7 12.7 0.948 84.3 20.9 12.7 0.949 61.3 69.9 48,076 SMART CITY RANKING AA in 2023 56.7 38.1 35.1 50.0 72.2 52.2 63.9 50.5 SMART CITY RATING +1,181 47,054 0.941 83.1 21.4 82.8% 56.4% 49.9% 35.7% 32.9% 27.3% 25.8% 23.6% 22.7% 21.2% 20.6% 15.7% 12.3% 12.1% 10.9% 0% 20% 40% 60% 80% 100% affordable housing road congestion health services public transport unemployment fulfilling employment security corruption / transparency air pollution recycling school education basic amenities (water, waste) social mobility / inclusiveness Green spaces citizen engagement 54.1% 63.0% 52.8% 77.0% 0% 20% 40% 60% 80% 100% 0 20 40 60 80 100 0 20 40 60 80 100
▼
Score
Score GROUP MEAN CITY LEGEND: MIN GROUP MAX CITY MEAN LEGEND:
Taipei City
chose

From a list of 15 indicators, survey respondents were asked to select 5 that they perceived as the most urgent for their city. The higher the percentage of responses per area, the greater the priority for the city.
respondents who agree or strongly agree with the statement
ATTITUDES
You are willing to concede personal data in order to improve traffic congestion
You are comfortable with face recognition technologies to lower crime
You feel the availability of online information has increased your trust in authorities
The proportion of your day-to-day payment transactions that are non-cash (% of transactions)
PRIORITY AREAS
City Population HDI
BACKGROUND INFORMATION
Map tiles by Stamen Design CC BY 3.0 Map Data © OpenStreetMap Country Taiwan HDI Life expectancy at birth Expected years of schooling Mean years of schooling GNI per capita (PPP $)
sanitation meets the needs of the poorest areas
reporting of city maintenance problems provides a speedy solution Recycling services are satisfactory A website or App allows residents to easily give away unwanted items Public safety is not a problem Free public wifi has improved access to city services Air pollution is not a problem CCTV cameras has made residents feel safer Medical services provision is satisfactory A website or App allows residents to effectively monitor air pollution Finding housing with rent equal to 30% or less of a monthly salary is not a problem Arranging medical appointments online has improved access Mobility Mobility Traffic congestion is not a problem Car-sharing Apps have reduced congestion Public transport is satisfactory Apps that direct you to an available parking space have reduced journey time Bicycle hiring has reduced congestion Online scheduling and ticket sales has made public transport easier to use The city provides information on traffic congestion through mobile phones Activities Activities Green spaces are satisfactory Online purchasing of tickets to shows and museums has made it easier to attend Cultural activities (shows, bars, and museums) are satisfactory Opportunities (Work & School) Opportunities (Work & School) Employment finding services are readily available Online access to job
Health & Safety Health & Safety Basic
Online
listings has made it easier to find work
IT
Lifelong learning opportunities
provided
institutions
Businesses are creating new jobs The current
speed
reliability meet connectivity needs Minorities feel welcome Governance Governance Information on local government decisions are easily accessible Online public access to city finances has reduced corruption Corruption of city officials is not an issue of concern Online voting has increased participation Residents contribute to decision making of local government An online platform where residents can propose ideas has improved city life Residents provide feedback on local government projects Processing Identification Documents online has reduced waiting times (UN World Urbanization Prospects) 2,720,000 0.916
Most children have access to a good school
skills are taught well in schools
are
by local
Online services provided by the city has made it easier to start a new business
internet
and
82.8 75.0 75.6 78.2 STRUCTURES TECHNOLOGIES 65.3 64.3 60.8 41.7 74.1 84.1 65.3 83.0 22.7 55.5 59.5 All ratings range from AAA to D
2 85.7 GROUP A TECHNOLOGIES A FACTOR RATINGS BBB STRUCTURES 58.9 68.8 2020 80.9 N/A -1.1 N/A N/A 70.6 63.2 71.3 29.7 62.4
16
73.6 1 yr change 41,946 2021 2022 79.8 16.9 2019
29 in 2023 Out of 142 Out of 141 70.8 67.3 72.7 63.3 69.9 13.0 81.3 0.926 64.0 84.2 44,057 SMART CITY RANKING A in 2023 69.1 58.5 37.5 67.5 63.1 58.9 72.6 61.3 SMART CITY RATING N/A 42,404 0.916 80.9 16.5 75.2% 57.1% 48.2% 39.6% 37.2% 37.0% 29.4% 28.7% 27.0% 20.5% 18.8% 16.2% 15.5% 13.6% 11.9% 0% 20% 40% 60% 80% 100% affordable housing road congestion air pollution fulfilling employment security corruption / transparency unemployment basic amenities (water, waste) public transport health services Green spaces social mobility / inclusiveness school education citizen engagement recycling 77.5% 63.3% 73.7% 66.1% 0% 20% 40% 60% 80% 100% 0 20 40 60 80 100 0 20 40 60 80 100
of
Score % of
Score GROUP MEAN CITY LEGEND: MIN GROUP MAX CITY MEAN LEGEND:
▲
%
respondents who
the Priority Area
Tallinn
of respondents who chose the Priority Area

From a list of 15 indicators, survey respondents were asked to select 5 that they perceived as the most urgent for their city. The higher the percentage of responses per area, the greater the priority for the city.
% of respondents who agree or strongly agree with the statement
ATTITUDES
You are willing to concede personal data in order to improve traffic congestion
You are comfortable with face recognition technologies to lower crime
You feel the availability of online information has increased your trust in authorities
The proportion of your day-to-day payment transactions that are non-cash (% of transactions)
PRIORITY AREAS
City Population HDI
BACKGROUND INFORMATION
Map tiles by Stamen Design CC BY 3.0 Map Data © OpenStreetMap Country Estonia HDI Life expectancy at birth Expected years of schooling Mean years of schooling GNI per capita (PPP $)
sanitation meets the needs of the poorest areas
reporting
city maintenance
solution Recycling services are satisfactory A website or App allows residents to easily give away unwanted items Public safety is not a problem Free public wifi has improved access to city services Air pollution is not a problem CCTV cameras has made residents feel safer Medical services provision is satisfactory A website or App allows residents to effectively monitor air pollution Finding housing with rent equal to 30% or less of a monthly salary is not a problem Arranging medical appointments online has improved access Mobility Mobility Traffic congestion is not a problem Car-sharing Apps have reduced congestion Public transport is satisfactory
that direct you to an available parking space have reduced journey time Bicycle hiring has reduced congestion Online scheduling and ticket sales has made public transport easier to use The city provides information on traffic congestion through mobile phones Activities Activities Green spaces are satisfactory Online purchasing of tickets to shows and museums has made it easier to attend Cultural activities (shows, bars, and museums) are satisfactory Opportunities (Work & School) Opportunities (Work & School) Employment finding services are readily available Online access to job
Health & Safety Health & Safety Basic
Online
of
problems provides a speedy
Apps
listings has made it easier to find work
IT
Businesses are creating new jobs The current
needs Minorities feel welcome Governance Governance Information on local government decisions are easily accessible Online public access to city finances has reduced corruption Corruption of city officials is not an issue of concern Online voting has increased participation Residents contribute to decision making of local government An online platform where residents can propose ideas has improved city life Residents provide feedback on local government projects Processing Identification Documents online has reduced waiting times (Eurostat) 440,000 0.932 (Global Data Lab)
Most children have access to a good school
skills are taught well in schools Lifelong learning opportunities are provided by local institutions Online services provided by the city has made it easier to start a new business
internet speed and reliability meet connectivity
82.6 34.7 77.1 70.4 STRUCTURES TECHNOLOGIES 55.7 58.4 45.0 66.9 60.5 72.5 40.1 71.0 29.3 37.4 44.1 All ratings range from AAA to D
71.4 GROUP BBB TECHNOLOGIES BBB FACTOR RATINGS BBB STRUCTURES 69.5 76.8 2020 77.1 +0.009 +2.0 +0.0 +0.0 73.7 63.4 81.5 33.0 67.7
24 2
63.8 1 yr change 13.5 35,481 13.5 37,152 2021 2022 0.899 79.2 15.9 15.9 2019 ▲ 32 in 2023 Out of 142 Out of 141 79.9 53.5 77.2 46.1 52.8 13.6 0.891 78.3 15.8 13.5 0.890 53.3 71.5 38,027 SMART CITY RANKING BBB in 2023 67.0 38.8 39.1 74.6 74.0 60.4 63.2 61.2 SMART CITY RATING -876 35,472 0.893 78.7 15.7 67.9% 42.9% 42.6% 39.8% 36.4% 30.7% 26.1% 23.3% 22.0% 21.6% 21.0% 20.5% 19.9% 17.5% 16.2% 0% 20% 40% 60% 80% 100% affordable housing unemployment corruption / transparency road congestion health services fulfilling employment Green spaces public transport basic amenities (water, waste) school education citizen engagement recycling security social mobility / inclusiveness air pollution 56.5% 57.2% 57.7% 75.4% 0% 20% 40% 60% 80% 100% 0 20 40 60 80 100 0 20 40 60 80 100
Score
Score GROUP MEAN CITY LEGEND: MIN GROUP MAX CITY MEAN LEGEND:
%
Tel Aviv
respondents who chose the Priority

From a list of 15 indicators, survey respondents were asked to select 5 that they perceived as the most urgent for their city. The higher the percentage of responses per area, the greater the priority for the city.
respondents who agree or strongly agree with the statement
ATTITUDES
You are willing to concede personal data in order to improve traffic congestion
You are comfortable with face recognition technologies to lower crime
You feel the availability of online information has increased your trust in authorities
The proportion of your day-to-day payment transactions that are non-cash (% of transactions)
PRIORITY AREAS
City Population HDI
BACKGROUND INFORMATION
Map tiles by Stamen Design CC BY 3.0 Map Data © OpenStreetMap Country Israel HDI Life expectancy at birth Expected years of schooling Mean years of schooling GNI per capita (PPP $)
Basic sanitation meets the needs of the poorest areas Online reporting of city maintenance problems provides a speedy solution Recycling services are satisfactory A website or App allows residents to easily give away unwanted items Public safety is not a problem Free public wifi has improved access to city services Air pollution is not a problem CCTV cameras has made residents feel safer Medical services provision is satisfactory A website or App allows residents to effectively monitor air pollution Finding housing with rent equal to 30% or less of a monthly salary is not a problem Arranging medical appointments online has improved access Mobility Mobility Traffic congestion is not a problem Car-sharing Apps have reduced congestion Public transport is satisfactory Apps that direct you to an available parking space have reduced journey time Bicycle hiring has reduced congestion Online scheduling and ticket sales has made public transport easier to use The city provides information on traffic congestion through mobile phones Activities Activities Green spaces are satisfactory Online purchasing of tickets to shows and museums has made it easier to attend Cultural activities (shows, bars, and museums) are satisfactory Opportunities (Work & School) Opportunities (Work & School) Employment finding services are readily available Online access to job
Health & Safety Health & Safety
listings has made it easier to find work
IT
Businesses are creating new jobs The current
speed and reliability meet connectivity needs Minorities feel welcome Governance Governance Information on local government decisions are easily accessible Online public access to city finances has reduced corruption Corruption of city officials is not an issue of concern Online voting has increased participation Residents contribute to decision making of local government An online platform where residents can propose ideas has improved city life Residents provide feedback on local government projects Processing Identification Documents online has reduced waiting times (UN Data) 460,000 0.919 (Global Data Lab)
Most children have access to a good school
skills are taught well in schools Lifelong learning opportunities are provided by local institutions Online services provided by the city has made it easier to start a new business
internet
78.1 42.9 58.3 63.7 STRUCTURES TECHNOLOGIES 57.9 54.8 46.6 32.2 45.6 66.9 33.3 74.5 10.5 32.8 34.0 All ratings range from AAA to D
2 51.1 GROUP B TECHNOLOGIES B FACTOR RATINGS B STRUCTURES 34.6 52.8 2020 82.3 +0.004 +0.3 +0.0 +0.0 43.7 59.7 75.4 17.1 48.8
94
48.1 1 yr change 13.4 39,324 13.4 43,588 2021 2022 0.915 82.6 15.0 15.0 2019
91 in 2023 Out of 142 Out of 141 63.8 48.4 58.8 35.8 46.8 13.3 0.906 82.4 14.8 13.4 0.911 41.9 54.5 41,754 SMART CITY RANKING B in 2023 54.0 35.2 38.7 33.8 63.3 56.5 57.8 50.1 SMART CITY RATING +1,834 40,920 0.909 82.8 14.8 75.9% 70.7% 52.1% 44.2% 36.7% 36.3% 23.7% 21.2% 20.7% 19.3% 18.3% 15.4% 12.0% 11.4% 9.8% 0% 20% 40% 60% 80% 100% road congestion affordable housing public transport security air pollution Green spaces school education health services corruption / transparency recycling fulfilling employment basic amenities (water, waste) unemployment citizen engagement social mobility / inclusiveness 64.9% 58.3% 55.2% 73.6% 0% 20% 40% 60% 80% 100% 0 20 40 60 80 100 0 20 40 60 80 100
Score % of
Area Score GROUP MEAN CITY LEGEND: MIN GROUP MAX CITY MEAN LEGEND:
▼
% of
The Hague
% of respondents who chose the Priority Area

From a list of 15 indicators, survey respondents were asked to select 5 that they perceived as the most urgent for their city. The higher the percentage of responses per area, the greater the priority for the city.
% of respondents who agree or strongly agree with the statement
ATTITUDES
You are willing to concede personal data in order to improve traffic congestion
You are comfortable with face recognition technologies to lower crime
You feel the availability of online information has increased your trust in authorities
The proportion of your day-to-day payment transactions that are non-cash (% of transactions)
PRIORITY AREAS
City Population HDI
BACKGROUND INFORMATION
Map tiles by Stamen Design CC BY 3.0 Map Data © OpenStreetMap Country Netherlands HDI Life expectancy at birth Expected years of schooling Mean years of schooling GNI per capita (PPP $)
sanitation meets the needs of the poorest areas
reporting of city maintenance problems provides a speedy solution Recycling services are satisfactory A website or App allows residents to easily give away unwanted items Public safety is not a problem Free public wifi has improved access to city services Air pollution is not a problem CCTV cameras has made residents feel safer Medical services provision is satisfactory A website or App allows residents to effectively monitor air pollution Finding housing with rent equal to 30% or less of a monthly salary is not a problem Arranging medical appointments online has improved access Mobility Mobility Traffic congestion is not a problem Car-sharing Apps have reduced congestion Public transport is satisfactory Apps that direct you to an available parking space have reduced journey time Bicycle hiring has reduced congestion Online scheduling and ticket sales has made public transport easier to use The city provides information on traffic congestion through mobile phones Activities Activities Green spaces are satisfactory Online purchasing of tickets to shows and museums has made it easier to attend Cultural activities (shows, bars, and museums) are satisfactory Opportunities (Work & School) Opportunities (Work & School) Employment finding services are readily available Online access to job
work
IT
institutions
Businesses are creating new jobs The current internet speed and reliability meet connectivity needs Minorities feel welcome Governance Governance Information on local government decisions are easily accessible Online public access to city finances has reduced corruption Corruption of city officials is not an issue of concern Online voting has increased participation Residents contribute to decision making of local government An online platform where residents can propose ideas has improved city life Residents provide feedback on local government projects Processing Identification Documents online has reduced waiting times (Eurostat) 770,000 0.941 (Global Data Lab)
Health & Safety Health & Safety Basic
Online
listings has made it easier to find
Most children have access to a good school
skills are taught well in schools Lifelong learning opportunities are provided by local
Online services provided by the city has made it easier to start a new business
76.9 48.2 64.8 67.4 STRUCTURES TECHNOLOGIES 45.4 53.7 47.1 41.5 49.6 72.6 34.4 66.1 26.0 34.3 44.9 All ratings range from AAA to D
1 62.8 GROUP A TECHNOLOGIES A FACTOR RATINGS BBB STRUCTURES 65.0 66.2 2020 81.7 +0.005 +0.8 +0.0 +0.0 46.4 61.2 74.1 21.9 56.9
42
52.0 1 yr change 12.6 52,500 12.6 57,278 2021 2022 0.946 82.5 18.6 18.6 2019 ▲ 43 in 2023 Out of 142 Out of 141 69.9 55.6 59.0 49.4 51.5 12.5 0.938 81.6 18.4 12.6 0.941 59.4 62.6 55,355 SMART CITY RANKING A in 2023 59.1 40.2 48.0 48.3 70.6 53.1 59.4 49.8 SMART CITY RATING +1,923 55,628 0.941 82.0 18.4 79.0% 64.1% 39.9% 35.8% 29.7% 26.7% 26.4% 25.3% 24.7% 24.3% 16.8% 16.5% 15.6% 14.8% 11.8% 0% 20% 40% 60% 80% 100% affordable housing security road congestion health services Green spaces basic amenities (water, waste) air pollution school education public transport unemployment citizen engagement social mobility / inclusiveness recycling corruption / transparency fulfilling employment 57.3% 64.5% 58.1% 76.0% 0% 20% 40% 60% 80% 100% 0 20 40 60 80 100 0 20 40 60 80 100
Score
Score GROUP MEAN CITY LEGEND: MIN GROUP MAX CITY MEAN LEGEND:
Tianjin
% of respondents who chose the Priority Area

From a list of 15 indicators, survey respondents were asked to select 5 that they perceived as the most urgent for their city. The higher the percentage of responses per area, the greater the priority for the city.
% of respondents who agree or strongly agree with the statement
ATTITUDES
You are willing to concede personal data in order to improve traffic congestion
You are comfortable with face recognition technologies to lower crime
You feel the availability of online information has increased your trust in authorities
The proportion of your day-to-day payment transactions that are non-cash (% of transactions)
PRIORITY AREAS
City Population HDI
BACKGROUND INFORMATION
Map tiles by Stamen Design CC BY 3.0 Map Data © OpenStreetMap Country China HDI Life expectancy at birth Expected years of schooling Mean years of schooling GNI per capita (PPP $)
sanitation
Recycling services are satisfactory A website or App allows residents to
unwanted items Public safety is not a problem Free public wifi has improved access to city services Air pollution is not a problem CCTV cameras has made residents feel safer Medical services provision is satisfactory A website or App allows residents to effectively monitor air pollution Finding housing with rent equal to 30% or less of a monthly salary is not a problem Arranging medical appointments online has improved access Mobility Mobility Traffic congestion is not a problem Car-sharing Apps have reduced congestion Public transport is satisfactory
that direct you
an available parking space have reduced journey time
hiring has reduced congestion
scheduling and ticket sales has made public transport easier to use
city provides information on traffic congestion through mobile phones Activities Activities Green spaces are satisfactory Online purchasing of tickets to shows and museums has made it easier to attend Cultural activities (shows, bars, and museums) are satisfactory Opportunities (Work & School) Opportunities (Work & School) Employment finding services are readily available Online access to job
Health & Safety Health & Safety Basic
meets the needs of the poorest areas Online reporting of city maintenance problems provides a speedy solution
easily give away
Apps
to
Bicycle
Online
The
listings has made it easier to find work
IT
institutions
Businesses are creating new jobs The current
meet connectivity needs Minorities feel welcome Governance Governance Information on local government decisions are easily accessible Online public access to city finances has reduced corruption Corruption of city officials is not an issue of concern Online voting has increased participation Residents contribute to decision making of local government An online platform where residents can propose ideas has improved city life Residents provide feedback on local government projects Processing Identification Documents online has reduced waiting times (UN World Urbanization Prospects) 13,590,000 0.844 (Global Data Lab)
Most children have access to a good school
skills are taught well in schools Lifelong learning opportunities are provided by local
Online services provided by the city has made it easier to start a new business
internet speed and reliability
88.6 82.4 82.6 83.5 STRUCTURES TECHNOLOGIES 81.6 71.7 76.1 55.6 75.5 70.2 71.4 86.4 53.2 74.3 75.8 All ratings range from AAA to D 54 3 77.9 GROUP BB TECHNOLOGIES BB FACTOR RATINGS BB STRUCTURES 62.8 72.9 2020 78.2 +0.003 +0.4 +0.0 +0.0 73.5 67.5 73.1 66.2 75.8
75.0 1 yr change 8.1 16,168 8.1 18,025 2021 2022 0.788 78.6 15.2 15.2 2019 ▲ 67 in 2023 Out of 142 Out of 141 78.3 64.3 76.4 54.6 70.9 8.0 0.781 78.1 15.2 8.1 0.785 80.1 66.6 17,499 SMART CITY RANKING BB in 2023 66.9 67.5 51.0 68.2 71.9 72.4 61.9 70.3 SMART CITY RATING +526 15,934 0.775 78.0 15.0 45.5% 43.8% 40.7% 39.5% 35.2% 27.2% 23.9% 23.6% 22.5% 22.3% 22.3% 21.2% 21.2% 20.8% 14.3% 0% 20% 40% 60% 80% 100% road congestion air pollution fulfilling employment corruption / transparency health services affordable housing basic amenities (water, waste) recycling social mobility / inclusiveness unemployment public transport Green spaces security school education citizen engagement 81.0% 85.1% 79.1% 86.6% 0% 20% 40% 60% 80% 100% 0 20 40 60 80 100 0 20 40 60 80 100
Score
Score GROUP MEAN CITY LEGEND: MIN GROUP MAX CITY MEAN LEGEND:
Tokyo
chose the

From a list of 15 indicators, survey respondents were asked to select 5 that they perceived as the most urgent for their city. The higher the percentage of responses per area, the greater the priority for the city.
respondents who agree or strongly agree with the statement
ATTITUDES
You are willing to concede personal data in order to improve traffic congestion
You are comfortable with face recognition technologies to lower crime
You feel the availability of online information has increased your trust in authorities
The proportion of your day-to-day payment transactions that are non-cash (% of transactions)
PRIORITY AREAS
City Population HDI
BACKGROUND INFORMATION
Map tiles by Stamen Design CC BY 3.0 Map Data © OpenStreetMap Country Japan HDI Life expectancy at birth Expected years of schooling Mean years of schooling GNI per capita (PPP $)
sanitation meets the needs of the poorest areas
reporting of city maintenance problems provides a speedy solution Recycling services are satisfactory A website or App allows residents to easily give away unwanted items Public safety is not a problem Free public wifi has improved access to city services Air pollution is not a problem CCTV cameras has made residents feel safer Medical services provision is satisfactory A website or App allows residents to effectively monitor air pollution Finding housing with rent equal to 30% or less of a monthly salary is not a problem Arranging medical appointments online has improved access Mobility Mobility Traffic congestion is not a problem Car-sharing Apps have reduced congestion Public transport is satisfactory Apps that direct you to an available parking space have reduced journey time Bicycle hiring has reduced congestion Online scheduling and ticket sales has made public transport easier to use The city provides information on traffic congestion through mobile phones Activities Activities Green spaces are satisfactory Online purchasing of tickets to shows and museums has made it easier to attend Cultural activities (shows, bars, and museums) are satisfactory Opportunities (Work & School) Opportunities (Work & School) Employment finding services are readily available Online access to job
work
Health & Safety Health & Safety Basic
Online
listings has made it easier to find
IT
Lifelong
provided
institutions
business Businesses are creating new jobs The current
speed and reliability meet connectivity needs Minorities feel welcome Governance Governance Information on local government decisions are easily accessible Online public access to city finances has reduced corruption Corruption of city officials is not an issue of concern Online voting has increased participation Residents contribute to decision making of local government An online platform where residents can propose ideas has improved city life Residents provide feedback on local government projects Processing Identification Documents online has reduced waiting times (UN Data) 9,730,000 0.951 (Global Data Lab)
Most children have access to a good school
skills are taught well in schools
learning opportunities are
by local
Online services provided by the city has made it easier to start a new
internet
56.5 56.4 48.3 54.4 STRUCTURES TECHNOLOGIES 43.0 54.4 28.0 40.7 55.7 66.4 35.9 51.5 32.3 24.8 32.7 All ratings range from AAA to D 86 1 68.1 GROUP BB TECHNOLOGIES BB FACTOR RATINGS BB STRUCTURES 68.4 56.9 2020 84.8 +0.000 +0.0 +0.0 +0.0 56.3 48.4 59.7 40.2 40.5
47.7 1 yr change 12.7 41,446 12.7 43,644 2021 2022 0.920 84.8 15.5 15.5 2019 ▼ 72 in 2023 Out of 142 Out of 141 55.0 36.8 44.2 39.9 31.7 12.7 0.917 84.7 15.5 12.7 0.920 36.9 61.8 43,008 SMART CITY RANKING BB in 2023 50.1 27.5 31.6 26.7 49.8 33.7 53.5 36.5 SMART CITY RATING +636 43,276 0.918 84.4 15.4 49.0% 48.9% 47.3% 46.7% 32.9% 31.0% 25.7% 24.5% 23.8% 23.6% 21.0% 19.1% 18.8% 18.7% 17.6% 0% 20% 40% 60% 80% 100% basic amenities (water, waste) affordable housing health services security road congestion public transport school education air pollution citizen engagement fulfilling employment corruption / transparency unemployment Green spaces social mobility / inclusiveness recycling 35.2% 59.3% 34.1% 67.4% 0% 20% 40% 60% 80% 100% 0 20 40 60 80 100 0 20 40 60 80 100 % of
Score % of respondents
Priority Area Score GROUP MEAN CITY LEGEND: MIN GROUP MAX CITY MEAN LEGEND:
who
Toronto
% of respondents who chose the Priority

From a list of 15 indicators, survey respondents were asked to select 5 that they perceived as the most urgent for their city. The higher the percentage of responses per area, the greater the priority for the city.
% of respondents who agree or strongly agree with the statement
ATTITUDES
You are willing to concede personal data in order to improve traffic congestion
You are comfortable with face recognition technologies to lower crime
You feel the availability of online information has increased your trust in authorities
The proportion of your day-to-day payment transactions that are non-cash (% of transactions)
PRIORITY AREAS
City Population HDI
BACKGROUND INFORMATION
Map tiles by Stamen Design CC BY 3.0 Map Data © OpenStreetMap Country Canada HDI Life expectancy at birth Expected years of schooling Mean years of schooling GNI per capita (PPP $)
sanitation meets the needs of the poorest areas
reporting of city maintenance problems provides a speedy solution Recycling services are satisfactory A website or App allows residents to easily give away unwanted items Public safety is not a problem Free public wifi has improved access to city services Air pollution is not a problem CCTV cameras has made residents feel safer Medical services provision is satisfactory A website or App allows residents to effectively monitor air pollution Finding housing with rent equal to 30% or less of a monthly salary is not a problem Arranging medical appointments online has improved access Mobility Mobility Traffic congestion is not a problem Car-sharing Apps have reduced congestion Public transport is satisfactory Apps that direct you to an available parking space have reduced journey time Bicycle hiring has reduced congestion Online scheduling and ticket sales has made public transport easier to use The city provides information on traffic congestion through mobile phones Activities Activities Green spaces are satisfactory Online purchasing of tickets to shows and museums has made it easier to attend Cultural activities (shows, bars, and museums) are satisfactory Opportunities (Work & School) Opportunities (Work & School) Employment finding services are readily available Online access to job
Health & Safety Health & Safety Basic
Online
listings has made it easier to find work
IT
institutions
Businesses are creating new jobs The current
meet connectivity needs Minorities feel welcome Governance Governance Information on local government decisions are easily accessible Online public access to city finances has reduced corruption Corruption of city officials is not an issue of concern Online voting has increased participation Residents contribute to decision making of local government An online platform where residents can propose ideas has improved city life Residents provide feedback on local government projects Processing Identification Documents online has reduced waiting times (UN World Urbanization Prospects) 2,930,000 0.943 (Global Data Lab)
Most children have access to a good school
skills are taught well in schools Lifelong learning opportunities are provided by local
Online services provided by the city has made it easier to start a new business
internet speed and reliability
74.5 53.9 55.3 72.4 STRUCTURES TECHNOLOGIES 45.1 55.0 42.1 43.3 49.6 51.7 39.1 52.4 14.2 38.5 42.6 All ratings range from AAA to D 51 1 63.3 GROUP BBB TECHNOLOGIES A FACTOR RATINGS BBB STRUCTURES 46.8 58.5 2020 82.7 +0.001 +0.2 +0.0 +0.0 37.0 57.0 80.1 16.5 66.5
53.1 1 yr change 13.9 45,828 13.9 48,444 2021 2022 0.935 82.8 16.0 16.0 2019
48 in 2023 Out of 142 Out of 141 67.2 58.0 59.7 49.1 43.0 13.8 0.928 82.0 15.9 13.9 0.934 64.1 68.6 47,933 SMART CITY RANKING BBB in 2023 60.6 37.8 42.6 47.8 65.9 49.0 67.2 51.3 SMART CITY RATING +512 48,591 0.932 82.4 15.9 90.0% 63.9% 58.0% 39.1% 37.6% 34.1% 27.6% 23.6% 21.2% 20.9% 15.1% 13.1% 11.1% 8.1% 5.8% 0% 20% 40% 60% 80% 100% affordable housing health services road congestion security unemployment public transport fulfilling employment air pollution school education corruption / transparency Green spaces basic amenities (water, waste) recycling social mobility / inclusiveness citizen engagement 50.4% 58.0% 48.2% 77.5% 0% 20% 40% 60% 80% 100% 0 20 40 60 80 100 0 20 40 60 80 100
▼
Score
Score GROUP MEAN CITY LEGEND: MIN GROUP MAX CITY MEAN LEGEND:
Area
Tunis
% of respondents who chose the Priority Area

From a list of 15 indicators, survey respondents were asked to select 5 that they perceived as the most urgent for their city. The higher the percentage of responses per area, the greater the priority for the city.
% of respondents who agree or strongly agree with the statement
ATTITUDES
You are willing to concede personal data in order to improve traffic congestion
You are comfortable with face recognition technologies to lower crime
You feel the availability of online information has increased your trust in authorities
The proportion of your day-to-day payment transactions that are non-cash (% of transactions)
PRIORITY AREAS
City Population HDI
BACKGROUND INFORMATION
Map tiles by Stamen Design CC BY 3.0 Map Data © OpenStreetMap Country Tunisia HDI Life expectancy at birth Expected years of schooling Mean years of schooling GNI per capita (PPP $)
Basic sanitation meets the needs of the poorest areas Online reporting of city maintenance problems provides a speedy solution Recycling services are satisfactory A website or App allows residents to easily give away unwanted items Public safety is not a problem Free public wifi has improved access to city services Air pollution is not a problem CCTV cameras has made residents feel safer Medical services provision is satisfactory A website or App allows residents to effectively monitor air pollution Finding housing with rent equal to 30% or less of a monthly salary is not a problem Arranging medical appointments online has improved access Mobility Mobility Traffic congestion is not a problem Car-sharing Apps have reduced congestion Public transport is satisfactory Apps that direct you to an available parking space have reduced journey time Bicycle hiring has reduced congestion Online scheduling and ticket sales has made public transport easier to use The city provides information on traffic congestion through mobile phones Activities Activities Green spaces are satisfactory Online purchasing of tickets to shows and museums has made it easier to attend Cultural activities (shows, bars, and museums) are satisfactory Opportunities (Work & School) Opportunities (Work & School) Employment finding services are readily available Online access to job
Health & Safety Health & Safety
listings has made it easier to find work
IT
Businesses
creating new jobs The current
connectivity needs Minorities feel welcome Governance Governance Information on local government decisions are easily accessible Online public access to city finances has reduced corruption Corruption of city officials is not an issue of concern Online voting has increased participation Residents contribute to decision making of local government An online platform where residents can propose ideas has improved city life Residents provide feedback on local government projects Processing Identification Documents online has reduced waiting times (UN World Urbanization Prospects) 2,440,000 0.775 (Global Data Lab)
Most children have access to a good school
skills are taught well in schools Lifelong learning opportunities are provided by local institutions Online services provided by the city has made it easier to start a new business
are
internet speed and reliability meet
61.3 33.5 44.9 47.6 STRUCTURES TECHNOLOGIES 37.2 37.5 33.5 26.7 48.0 37.2 28.2 53.5 19.0 35.3 38.6 All ratings range from AAA to D
4 38.4 GROUP D TECHNOLOGIES D FACTOR RATINGS D STRUCTURES 17.9 33.4 2020 73.8 +0.003 +0.5 +0.0 +0.0 39.0 33.9 51.9 26.6 41.0
137
34.9 1 yr change 8.0 9,710 8.0 10,297 2021 2022 0.732 74.3 14.6 14.6 2019 ▬ 137 in 2023 Out of 142 Out of 141 57.3 34.8 41.6 33.7 40.7 7.8 0.734 75.3 14.6 8.0 0.729 44.9 33.2 10,123 SMART CITY RANKING D in 2023 40.1 36.6 19.5 35.5 40.8 52.8 49.0 35.3 SMART CITY RATING +174 10,821 0.740 76.0 14.6 67.5% 59.4% 55.8% 43.2% 39.5% 36.1% 35.7% 27.6% 25.3% 25.0% 23.8% 16.7% 13.8% 6.1% 5.3% 0% 20% 40% 60% 80% 100% unemployment public transport health services security corruption / transparency road congestion affordable housing basic amenities (water, waste) school education fulfilling employment air pollution Green spaces recycling social mobility / inclusiveness citizen engagement 50.2% 76.0% 54.1% 48.9% 0% 20% 40% 60% 80% 100% 0 20 40 60 80 100 0 20 40 60 80 100
Score
Score GROUP MEAN CITY LEGEND: MIN GROUP MAX CITY MEAN LEGEND:
respondents who chose the

From a list of 15 indicators, survey respondents were asked to select 5 that they perceived as the most urgent for their city. The higher the percentage of responses per area, the greater the priority for the city.
% of respondents who agree or strongly agree with the statement
ATTITUDES
You are willing to concede personal data in order to improve traffic congestion
You are comfortable with face recognition technologies to lower crime
You feel the availability of online information has increased your trust in authorities
The proportion of your day-to-day payment transactions that are non-cash (% of transactions)
listings has made it easier to find work
PRIORITY AREAS
City Population HDI
BACKGROUND INFORMATION
Map tiles by Stamen Design CC BY 3.0 Map Data © OpenStreetMap Country Canada HDI Life expectancy at birth Expected years of schooling Mean years of schooling GNI per capita (PPP $)
sanitation meets the needs of the poorest areas
reporting of city maintenance problems provides a speedy solution Recycling services are satisfactory A website or App allows residents to easily give away unwanted items Public safety is not a problem Free public wifi has improved access to city services Air pollution is not a problem CCTV cameras has made residents feel safer Medical services provision is satisfactory A website or App allows residents to effectively monitor air pollution Finding housing with rent equal to 30% or less of a monthly salary is not a problem Arranging medical appointments online has improved access Mobility Mobility Traffic congestion is not a problem Car-sharing Apps have reduced congestion Public transport is satisfactory Apps that direct you to an available parking space have reduced journey time Bicycle hiring has reduced congestion Online scheduling and ticket sales has made public transport easier to use The city provides information on traffic congestion through mobile phones Activities Activities Green spaces are satisfactory Online purchasing of tickets to shows and museums has made it easier to attend Cultural activities (shows, bars, and museums) are satisfactory Opportunities (Work & School) Opportunities (Work & School) Employment finding services are readily available Online access to job
Health & Safety Health & Safety Basic
Online
Most children have access to a good school IT skills are taught well in schools Lifelong learning opportunities are provided by local institutions
Minorities feel welcome Governance Governance Information on local government decisions are easily accessible Online public access to city finances has reduced corruption Corruption of city officials is not an issue of concern Online voting has increased participation Residents contribute to decision making of local government An online platform where residents can propose ideas has improved city life Residents provide feedback on local government projects Processing Identification Documents online has reduced waiting times (UN World Urbanization Prospects) 670,000 0.944 (Global Data Lab)
Online services provided by the city has made it easier to start a new business Businesses are creating new jobs The current internet speed and reliability meet connectivity needs
69.0 50.3 56.1 71.1 STRUCTURES TECHNOLOGIES 44.5 54.7 42.5 54.0 46.7 50.3 40.3 57.5 23.1 41.4 34.4 All ratings range from AAA to D
1 56.2 GROUP BBB TECHNOLOGIES BBB FACTOR RATINGS BBB STRUCTURES 57.4 63.8 2020 82.7 +0.001 +0.2 +0.0 +0.0 43.8 56.9 74.6 13.0 75.5 Vancouver 52.8 1 yr change 13.9 45,828 13.9 48,444 2021 2022 0.935 82.8 16.0 16.0 2019 ▼ 42 in 2023 Out of 142 Out of 141 69.1 59.7 54.2 48.4 45.0 13.8 0.928 82.0 15.9 13.9 0.934 63.0 78.5 47,933 SMART CITY RANKING A in 2023 59.3 40.3 48.8 45.0 72.5 52.8 70.2 46.9 SMART CITY RATING +512 48,591 0.932 82.4 15.9 90.5% 73.5% 50.9% 40.3% 30.6% 30.6% 21.3% 17.9% 17.5% 17.1% 16.1% 13.9% 13.4% 12.5% 11.8% 0% 20% 40% 60% 80% 100% affordable housing health services road congestion security unemployment public transport fulfilling employment social mobility / inclusiveness basic amenities (water, waste) corruption / transparency air pollution school education citizen engagement recycling Green spaces 59.6% 60.3% 53.2% 79.7% 0% 20% 40% 60% 80% 100% 0 20 40 60 80 100 0 20 40 60 80 100
Score % of
Priority Area Score GROUP MEAN CITY LEGEND: MIN GROUP MAX CITY MEAN LEGEND:
43
Vienna
% of respondents who chose the Priority Area

From a list of 15 indicators, survey respondents were asked to select 5 that they perceived as the most urgent for their city. The higher the percentage of responses per area, the greater the priority for the city.
% of respondents who agree or strongly agree with the statement
ATTITUDES
You are willing to concede personal data in order to improve traffic congestion
You are comfortable with face recognition technologies to lower crime
You feel the availability of online information has increased your trust in authorities
The proportion of your day-to-day payment transactions that are non-cash (% of transactions)
PRIORITY AREAS
City Population HDI
BACKGROUND INFORMATION
Map tiles by Stamen Design CC BY 3.0 Map Data © OpenStreetMap Country Austria HDI Life expectancy at birth Expected years of schooling Mean years of schooling GNI per capita (PPP $)
Basic sanitation meets the needs of the poorest areas Online reporting of city maintenance problems provides a speedy solution Recycling services are satisfactory A website or App allows residents to easily give away unwanted items Public safety is not a problem Free public wifi has improved access to city services Air pollution is not a problem CCTV cameras has made residents feel safer Medical services provision is satisfactory A website or App allows residents to effectively monitor air pollution Finding housing with rent equal to 30% or less of a monthly salary is not a problem Arranging medical appointments online has improved access Mobility Mobility Traffic congestion is not a problem Car-sharing Apps have reduced congestion Public transport is satisfactory Apps that direct you to an available parking space have reduced journey time Bicycle hiring has reduced congestion Online scheduling and ticket sales has made public transport easier to use The city provides information on traffic congestion through mobile phones Activities Activities Green spaces are satisfactory Online purchasing of tickets to shows and museums has made it easier to attend Cultural activities (shows, bars, and museums) are satisfactory Opportunities (Work & School) Opportunities (Work & School) Employment finding services are readily available Online access to job
Health & Safety Health & Safety
listings has made it easier to find work
IT
Businesses
creating new jobs
current
connectivity needs Minorities feel welcome Governance Governance Information on local government decisions are easily accessible Online public access to city finances has reduced corruption Corruption of city officials is not an issue of concern Online voting has increased participation Residents contribute to decision making of local government An online platform where residents can propose ideas has improved city life Residents provide feedback on local government projects Processing Identification Documents online has reduced waiting times (UN World Urbanization Prospects) 1,930,000 0.942 (Global Data Lab)
Most children have access to a good school
skills are taught well in schools Lifelong learning opportunities are provided by local institutions Online services provided by the city has made it easier to start a new business
are
The
internet speed and reliability meet
80.3 58.2 74.2 69.9 STRUCTURES TECHNOLOGIES 49.3 60.3 47.5 57.4 41.7 72.9 37.0 62.9 42.3 37.4 41.2 All ratings range from AAA to D
1 77.5 GROUP AA TECHNOLOGIES A FACTOR RATINGS AA STRUCTURES 75.0 68.1 2020 81.6 +0.006 +0.8 +0.0 +0.0 62.0 67.9 85.8 31.0 69.6
23
53.6 1 yr change 12.3 52,446 12.3 56,530 2021 2022 0.926 82.4 16.4 16.4 2019 ▲ 28 in 2023 Out of 142 Out of 141 74.3 52.0 58.4 44.9 49.6 12.3 0.916 81.5 16.1 12.3 0.920 60.2 76.7 54,361 SMART CITY RANKING AA in 2023 57.7 36.3 43.1 47.4 69.2 54.9 68.0 52.1 SMART CITY RATING +2,169 55,647 0.920 81.9 16.1 69.5% 46.1% 44.5% 43.9% 32.1% 27.5% 26.5% 23.7% 22.7% 21.8% 20.4% 17.5% 17.1% 15.1% 13.4% 0% 20% 40% 60% 80% 100% affordable housing security road congestion unemployment corruption / transparency health services Green spaces school education air pollution public transport recycling citizen engagement fulfilling employment social mobility / inclusiveness basic amenities (water, waste) 61.1% 62.8% 54.9% 64.2% 0% 20% 40% 60% 80% 100% 0 20 40 60 80 100 0 20 40 60 80 100
Score
Score GROUP MEAN CITY LEGEND: MIN GROUP MAX CITY MEAN LEGEND:
Vilnius
47 2
of respondents who chose the Priority Area

From a list of 15 indicators, survey respondents were asked to select 5 that they perceived as the most urgent for their city. The higher the percentage of responses per area, the greater the priority for the city.
% of respondents who agree or strongly agree with the statement
ATTITUDES
You are willing to concede personal data in order to improve traffic congestion
You are comfortable with face recognition technologies to lower crime
You feel the availability of online information has increased your trust in authorities
The proportion of your day-to-day payment transactions that are non-cash (% of transactions)
Health & Safety Health & Safety
PRIORITY AREAS
City Population HDI
BACKGROUND INFORMATION
Map tiles by Stamen Design CC BY 3.0 Map Data © OpenStreetMap Country Lithuania HDI Life expectancy at birth Expected years of schooling Mean years of schooling GNI per capita (PPP $)
sanitation
Recycling services are satisfactory A website or App allows residents to easily give away unwanted items Public safety is not a problem Free public wifi has improved access to city services Air pollution is not a problem CCTV cameras has made residents feel safer Medical services provision is satisfactory A website or App allows residents to effectively monitor air pollution Finding housing with rent equal to 30% or less of a monthly salary is not a problem Arranging medical appointments online has improved access Mobility Mobility Traffic congestion is not a problem Car-sharing Apps have reduced congestion Public transport is satisfactory Apps that direct you to an available parking space have reduced journey time Bicycle hiring has reduced congestion Online scheduling and ticket sales has made public transport easier to use The city provides information on traffic congestion through mobile phones Activities Activities Green spaces are satisfactory Online purchasing of tickets to shows and museums has made it easier to attend Cultural activities (shows, bars, and museums) are satisfactory Opportunities (Work & School) Opportunities (Work & School) Employment finding services are readily available Online access to job
work
good school IT skills
in schools Lifelong learning opportunities are provided
local institutions
services provided
business Businesses are creating new jobs The current internet speed and reliability meet connectivity needs Minorities feel welcome Governance Governance Information on local government decisions are easily accessible Online public access to city finances has reduced corruption Corruption of city officials is not an issue of concern Online voting has increased participation Residents contribute to decision making of local government An online platform where residents can propose ideas has improved city life Residents provide feedback on local government projects Processing Identification Documents online has reduced waiting times (Eurostat) 550,000 0.913 (Global Data Lab)
Basic
meets the needs of the poorest areas Online reporting of city maintenance problems provides a speedy solution
listings has made it easier to find
Most children have access to a
are taught well
by
Online
by the city has made it easier to start a new
76.6 58.7 73.1 76.6 STRUCTURES TECHNOLOGIES 54.1 70.1 48.0 47.1 61.7 63.7 55.9 63.4 29.0 43.3 53.1 All ratings range from AAA to D
72.2 GROUP BBB TECHNOLOGIES BBB FACTOR RATINGS BBB STRUCTURES 58.7 70.5 2020 73.7 +0.004 +0.6 +0.0 +0.0 65.6 65.8 79.0 31.6 68.6
65.7 1 yr change 13.5 36,103 13.5 38,131 2021 2022 0.879 74.3 16.4 16.4 2019 ▲ 65 in 2023 Out of 142 Out of 141 74.6 56.4 65.8 41.9 51.2 13.4 0.880 75.1 16.4 13.5 0.875 52.0 75.8 37,854 SMART CITY RANKING BB in 2023 54.7 41.4 34.1 49.8 60.1 65.4 61.6 60.3 SMART CITY RATING +277 35,897 0.886 76.2 16.5 59.0% 57.6% 44.4% 43.4% 36.8% 32.9% 31.0% 24.7% 23.7% 19.7% 18.1% 17.1% 16.6% 15.3% 9.3% 0% 20% 40% 60% 80% 100% affordable housing road congestion corruption / transparency health services fulfilling employment air pollution unemployment school education security recycling public transport basic amenities (water, waste) Green spaces citizen engagement social mobility / inclusiveness 45.4% 60.8% 51.5% 71.8% 0% 20% 40% 60% 80% 100% 0 20 40 60 80 100 0 20 40 60 80 100
Score
Score GROUP MEAN CITY LEGEND: MIN GROUP MAX CITY MEAN LEGEND:
%
Warsaw
% of respondents who chose the Priority

From a list of 15 indicators, survey respondents were asked to select 5 that they perceived as the most urgent for their city. The higher the percentage of responses per area, the greater the priority for the city.
% of respondents who agree or strongly agree with the statement
ATTITUDES
You are willing to concede personal data in order to improve traffic congestion
You are comfortable with face recognition technologies to lower crime
You feel the availability of online information has increased your trust in authorities
The proportion of your day-to-day payment transactions that are non-cash (% of transactions)
PRIORITY AREAS
City Population HDI
BACKGROUND INFORMATION
Map tiles by Stamen Design CC BY 3.0 Map Data © OpenStreetMap Country Poland HDI Life expectancy at birth Expected years of schooling Mean years of schooling GNI per capita (PPP $)
sanitation meets the needs of the poorest areas
reporting of city maintenance problems provides a speedy solution Recycling services are satisfactory A website or App allows residents to easily give away unwanted items Public safety is not a problem Free public wifi has improved access to city services Air pollution is not a problem CCTV cameras has made residents feel safer Medical services provision is satisfactory A website or App allows residents to effectively monitor air pollution Finding housing with rent equal to 30% or less of a monthly salary is not a problem Arranging medical appointments online has improved access Mobility Mobility Traffic congestion is not a problem Car-sharing Apps have reduced congestion Public transport is satisfactory Apps that direct you to an available parking space have reduced journey time Bicycle hiring has reduced congestion Online scheduling and ticket sales has made public transport easier to use The city provides information on traffic congestion through mobile phones Activities Activities Green spaces are satisfactory Online purchasing of tickets to shows and museums has made it easier to attend Cultural activities (shows, bars, and museums) are satisfactory Opportunities (Work & School) Opportunities (Work & School) Employment finding services are readily available Online access to job
Health & Safety Health & Safety Basic
Online
listings has made it easier to find work
IT
Businesses are creating new jobs The current
connectivity needs Minorities feel welcome Governance Governance Information on local government decisions are easily accessible Online public access to city finances has reduced corruption Corruption of city officials is not an issue of concern Online voting has increased participation Residents contribute to decision making of local government An online platform where residents can propose ideas has improved city life Residents provide feedback on local government projects Processing Identification Documents online has reduced waiting times (UN World Urbanization Prospects) 1,780,000 0.926 (Global Data Lab)
Most children have access to a good school
skills are taught well in schools Lifelong learning opportunities are provided by local institutions Online services provided by the city has made it easier to start a new business
internet speed and reliability meet
78.6 49.9 71.1 69.8 STRUCTURES TECHNOLOGIES 49.2 61.4 57.6 33.4 51.4 46.9 61.7 66.8 30.0 47.0 50.5 All ratings range from AAA to D
2 64.7 GROUP BBB TECHNOLOGIES BBB FACTOR RATINGS BBB STRUCTURES 61.9 64.7 2020 76.5 +0.005 +0.5 +0.0 +0.0 59.4 68.4 79.5 25.6 60.8
38
57.9 1 yr change 13.2 31,293 13.2 35,151 2021 2022 0.881 77.0 15.9 15.9 2019 ▲ 44 in 2023 Out of 142 Out of 141 74.9 65.4 68.3 54.9 63.7 13.1 0.874 76.9 15.8 13.2 0.876 58.3 62.0 33,264 SMART CITY RANKING BBB in 2023 62.4 44.4 44.0 61.4 69.5 56.3 67.8 60.8 SMART CITY RATING +1,887 31,772 0.880 77.9 15.9 62.0% 51.9% 43.0% 41.4% 37.1% 36.6% 35.0% 34.6% 29.6% 23.9% 19.7% 18.7% 14.7% 12.6% 11.7% 0% 20% 40% 60% 80% 100% affordable housing security health services fulfilling employment road congestion air pollution public transport basic amenities (water, waste) Green spaces recycling unemployment school education corruption / transparency social mobility / inclusiveness citizen engagement 49.0% 65.3% 50.1% 75.9% 0% 20% 40% 60% 80% 100% 0 20 40 60 80 100 0 20 40 60 80 100
Score
Score GROUP MEAN CITY LEGEND: MIN GROUP MAX CITY
LEGEND:
Area
MEAN
respondents who chose the

From a list of 15 indicators, survey respondents were asked to select 5 that they perceived as the most urgent for their city. The higher the percentage of responses per area, the greater the priority for the city.
% of respondents who agree or strongly agree with the statement
ATTITUDES
You are willing to concede personal data in order to improve traffic congestion
You are comfortable with face recognition technologies to lower crime
You feel the availability of online information has increased your trust in authorities
The proportion of your day-to-day payment transactions that are non-cash (% of transactions)
PRIORITY AREAS
City Population HDI
BACKGROUND INFORMATION
Map tiles by Stamen Design CC BY 3.0 Map Data © OpenStreetMap Country USA HDI Life expectancy at birth Expected years of schooling Mean years of schooling GNI per capita (PPP $)
Basic sanitation meets the needs of the poorest areas Online reporting of city maintenance problems provides a speedy solution Recycling services are satisfactory A website or App allows residents to easily give away unwanted items Public safety is not a problem Free public wifi has improved access to city services Air pollution is not a problem CCTV cameras has made residents feel safer Medical services provision is satisfactory A website or App allows residents to effectively monitor air pollution Finding housing with rent equal to 30% or less of a monthly salary is not a problem Arranging medical appointments online has improved access Mobility Mobility Traffic congestion is not a problem Car-sharing Apps have reduced congestion Public transport is satisfactory Apps that direct you to an available parking space have reduced journey time Bicycle hiring has reduced congestion Online scheduling and ticket sales has made public transport easier to use The city provides information on traffic congestion through mobile phones Activities Activities Green spaces are satisfactory Online purchasing of tickets to shows and museums has made it easier to attend Cultural activities (shows, bars, and museums) are satisfactory Opportunities (Work & School) Opportunities (Work & School) Employment finding services are readily available Online access to job
find work
children
good school IT skills
taught
in schools Lifelong learning opportunities are provided by local institutions
services provided by the city
easier to
business Businesses are creating new jobs The current internet speed and reliability meet connectivity needs Minorities feel welcome Governance Governance Information on local government decisions are easily accessible Online public access to city finances has reduced corruption Corruption of city officials is not an issue of concern Online voting has increased participation Residents contribute to decision making of local government An online platform where residents can propose ideas has improved city life Residents provide feedback on local government projects Processing Identification Documents online has reduced waiting times (UN Data) 690,000 0.940 (Global Data Lab)
Health & Safety Health & Safety
listings has made it easier to
Most
have access to a
are
well
Online
has made it
start a new
74.2 57.0 54.1 64.5 STRUCTURES TECHNOLOGIES 43.4 55.5 47.3 42.5 45.8 58.5 41.0 64.4 25.6 48.0 49.8 All ratings range from AAA to D
2 53.7 GROUP BB TECHNOLOGIES BB FACTOR RATINGS BB STRUCTURES 54.1 62.1 2020 77.2 +0.006 +1.0 +0.0 +0.0 33.1 60.8 81.4 30.2 60.8
50
52.9 1 yr change 13.7 61,077 13.6 65,565 2021 2022 0.927 78.2 16.4 16.4 2019 ▼ 39 in 2023 Out of 142 Out of 141 66.7 58.0 56.0 50.7 47.8 13.6 0.923 77.4 16.6 13.6 0.921 60.7 58.8 64,484 SMART CITY RANKING BB in 2023 61.3 41.6 36.3 56.2 51.8 49.8 59.3 50.7 SMART CITY RATING +1,081 63,654 0.933 79.1 16.6 75.3% 55.9% 48.2% 42.5% 39.3% 34.4% 26.7% 26.4% 25.3% 25.1% 16.0% 14.1% 11.9% 11.3% 9.7% 0% 20% 40% 60% 80% 100% affordable housing security road congestion health services unemployment school education fulfilling employment public transport air pollution corruption / transparency basic amenities (water, waste) social mobility / inclusiveness recycling citizen engagement Green spaces 54.3% 67.2% 50.7% 77.3% 0% 20% 40% 60% 80% 100% 0 20 40 60 80 100 0 20 40 60 80 100
Washington D.C.
Score % of
Priority Area Score GROUP MEAN CITY LEGEND: MIN GROUP MAX CITY MEAN LEGEND:
% of respondents who chose the Priority Area

From a list of 15 indicators, survey respondents were asked to select 5 that they perceived as the most urgent for their city. The higher the percentage of responses per area, the greater the priority for the city.
% of respondents who agree or strongly agree with the statement
ATTITUDES
You are willing to concede personal data in order to improve traffic congestion
You are comfortable with face recognition technologies to lower crime
You feel the availability of online information has increased your trust in authorities
The proportion of your day-to-day payment transactions that are non-cash (% of transactions)
PRIORITY AREAS
City Population HDI
BACKGROUND INFORMATION
Map tiles by Stamen Design CC BY 3.0 Map Data © OpenStreetMap Country New Zealand HDI Life expectancy at birth Expected years of schooling Mean years of schooling GNI per capita (PPP $)
sanitation meets the needs of the poorest areas
reporting of city maintenance problems provides a speedy solution Recycling services are satisfactory A website or App allows residents to easily give away unwanted items Public safety is not a problem Free public wifi has improved access to city services Air pollution is not a problem CCTV cameras has made residents feel safer Medical services provision is satisfactory A website or App allows residents to effectively monitor air pollution Finding housing with rent equal to 30% or less of a monthly salary is not a problem Arranging medical appointments online has improved access Mobility Mobility Traffic congestion is not a problem Car-sharing Apps have reduced congestion Public transport is satisfactory Apps that direct you to an available parking space have reduced journey time Bicycle hiring has reduced congestion Online scheduling and ticket sales has made public transport easier to use The city provides information on traffic congestion through mobile phones Activities Activities Green spaces are satisfactory Online purchasing of tickets to shows and museums has made it easier to attend Cultural activities (shows, bars, and museums) are satisfactory Opportunities (Work & School) Opportunities (Work & School) Employment finding services are readily available Online access to
IT
Lifelong
institutions
Businesses are creating new jobs The current
speed and reliability meet connectivity needs Minorities feel welcome Governance Governance Information on local government decisions are easily accessible Online public access to city finances has reduced corruption Corruption of city officials is not an issue of concern Online voting has increased participation Residents contribute to decision making of local government An online platform where residents can propose ideas has improved city life Residents provide feedback on local government projects Processing Identification Documents online has reduced waiting times (UN Data) 200,000 0.958 (Global Data Lab)
Health & Safety Health & Safety Basic
Online
job listings has made it easier to find work Most children have access to a good school
skills are taught well in schools
learning opportunities are provided by local
Online services provided by the city has made it easier to start a new business
internet
71.3 47.0 49.7 71.8 STRUCTURES TECHNOLOGIES 41.6 63.6 34.4 64.0 49.2 55.4 29.9 56.8 29.6 31.2 31.8 All ratings range from AAA to D
1 66.2 GROUP BBB TECHNOLOGIES BBB FACTOR RATINGS A STRUCTURES 41.7 64.7 2020 82.5 +0.003 +0.6 +0.0 +0.0 52.0 56.1 74.4 19.6 72.4
54.5 1 yr change 12.9 41,225 12.9 43,665 2021 2022 0.939 83.0 19.7 19.7 2019
23 in 2023 Out of 142 Out of 141 73.0 60.6 53.6 46.2 38.5 13.0 0.935 82.7 19.2 12.9 0.936 62.2 68.1 42,850 SMART CITY RANKING A in 2023 51.9 36.5 52.1 43.9 72.7 48.4 67.3 43.3 SMART CITY RATING +816 42,210 0.937 82.6 19.5 86.4% 54.2% 50.1% 46.7% 38.0% 37.4% 24.8% 23.4% 23.3% 21.6% 15.6% 13.6% 10.9% 8.3% 4.6% 0% 20% 40% 60% 80% 100% affordable housing health services basic amenities (water, waste) public transport road congestion unemployment fulfilling employment school education security recycling corruption / transparency citizen engagement social mobility / inclusiveness air pollution Green spaces 50.6% 63.0% 46.3% 78.1% 0% 20% 40% 60% 80% 100% 0 20 40 60 80 100 0 20 40 60 80 100
28
Wellington
▼
Score
Score GROUP MEAN CITY LEGEND: MIN GROUP MAX CITY MEAN LEGEND:
Zagreb
of respondents who chose the Priority Area

From a list of 15 indicators, survey respondents were asked to select 5 that they perceived as the most urgent for their city. The higher the percentage of responses per area, the greater the priority for the city.
% of respondents who agree or strongly agree with the statement
ATTITUDES
You are willing to concede personal data in order to improve traffic congestion
You are comfortable with face recognition technologies to lower crime
You feel the availability of online information has increased your trust in authorities
The proportion of your day-to-day payment transactions that are non-cash (% of transactions)
PRIORITY AREAS
City Population HDI
BACKGROUND INFORMATION
Map tiles by Stamen Design CC BY 3.0 Map Data © OpenStreetMap Country Croatia HDI Life expectancy at birth Expected years of schooling Mean years of schooling GNI per capita (PPP $)
Basic sanitation meets the needs of the poorest areas Online reporting of city maintenance problems provides a speedy solution Recycling services are satisfactory A website or App allows residents to easily give away unwanted items Public safety is not a problem Free public wifi has improved access to city services Air pollution is not a problem CCTV cameras has made residents feel safer Medical services provision is satisfactory A website or App allows residents to effectively monitor air pollution Finding housing with rent equal to 30% or less of a monthly salary is not a problem Arranging medical appointments online has improved access Mobility Mobility Traffic congestion is not a problem Car-sharing Apps have reduced congestion Public transport is satisfactory Apps that direct you to an available parking space have reduced journey time Bicycle hiring has reduced congestion Online scheduling and ticket sales has made public transport easier to use The city provides information on traffic congestion through mobile phones Activities Activities Green spaces are satisfactory Online purchasing of tickets to shows and museums has made it easier to attend Cultural activities (shows, bars, and museums) are satisfactory Opportunities (Work & School) Opportunities (Work & School) Employment finding services are readily available Online access to job
Health & Safety Health & Safety
listings has made it easier to find work
IT
Businesses are creating new jobs The current internet speed and reliability meet connectivity needs Minorities feel welcome Governance Governance Information on local government decisions are easily accessible Online public access to city finances has reduced corruption Corruption of city officials is not an issue of concern Online voting has increased participation Residents contribute to decision making of local government An online platform where residents can propose ideas has improved city life Residents provide feedback on local government projects Processing Identification Documents online has reduced waiting times (Eurostat) 800,000 0.916 (Global Data Lab)
Most children have access to a good school
skills are taught well in schools Lifelong learning opportunities are provided by local institutions Online services provided by the city has made it easier to start a new business
78.8 43.0 61.3 64.4 STRUCTURES TECHNOLOGIES 39.7 48.4 37.5 33.2 45.5 44.6 51.1 53.3 15.9 40.0 37.5 All ratings range from AAA to D
2 49.4 GROUP B TECHNOLOGIES B FACTOR RATINGS B STRUCTURES 42.5 60.8 2020 77.6 +0.011 +1.7 +0.0 +0.0 65.9 50.7 74.0 18.9 56.1
102
57.2 1 yr change 12.3 27,624 12.3 34,324 2021 2022 0.878 79.2 15.6 15.6 2019 ▲ 106 in 2023 Out of 142 Out of 141 65.4 35.7 61.0 28.7 37.9 12.2 0.860 78.0 15.5 12.3 0.867 56.4 42.5 32,073 SMART CITY RANKING CCC in 2023 47.7 32.3 23.0 37.5 62.5 57.7 56.1 49.7 SMART CITY RATING +2,251 29,373 0.866 78.7 15.5 57.3% 55.7% 53.8% 49.6% 39.1% 36.2% 29.9% 29.4% 27.4% 27.4% 17.8% 17.1% 9.7% 9.6% 5.6% 0% 20% 40% 60% 80% 100% basic amenities (water, waste) road congestion corruption / transparency affordable housing air pollution health services unemployment recycling fulfilling employment public transport Green spaces security school education citizen engagement social mobility / inclusiveness 46.5% 66.0% 40.2% 64.4% 0% 20% 40% 60% 80% 100% 0 20 40 60 80 100 0 20 40 60 80 100
Score
Score GROUP MEAN CITY LEGEND: MIN GROUP MAX CITY MEAN LEGEND:
%
Zaragoza
%
respondents who chose the

From a list of 15 indicators, survey respondents were asked to select 5 that they perceived as the most urgent for their city. The higher the percentage of responses per area, the greater the priority for the city.
% of respondents who agree or strongly agree with the statement
ATTITUDES
You are willing to concede personal data in order to improve traffic congestion
You are comfortable with face recognition technologies to lower crime
You feel the availability of online information has increased your trust in authorities
The proportion of your day-to-day payment transactions that are non-cash (% of transactions)
PRIORITY AREAS
City Population HDI
BACKGROUND INFORMATION
Map tiles by Stamen Design CC BY 3.0 Map Data © OpenStreetMap Country Spain HDI Life expectancy at birth Expected years of schooling Mean years of schooling GNI per capita (PPP $)
sanitation meets the needs of the poorest areas
reporting of city maintenance problems provides a speedy solution Recycling services are satisfactory A website or App allows residents to easily give away unwanted items Public safety is not a problem Free public wifi has improved access to city services Air pollution is not a problem CCTV cameras has made residents feel safer Medical services provision is satisfactory A website or App allows residents to effectively monitor air pollution Finding housing with rent equal to 30% or less of a monthly salary is not a problem Arranging medical appointments online has improved access Mobility Mobility Traffic congestion is not a problem Car-sharing Apps have reduced congestion Public transport is satisfactory Apps that direct you to an available parking space have reduced journey time Bicycle hiring has reduced congestion Online scheduling and ticket sales has made public transport easier to use The city provides information on traffic congestion through mobile phones Activities Activities Green spaces are satisfactory Online purchasing of tickets to shows and museums has made it easier to attend Cultural activities (shows, bars, and museums) are satisfactory Opportunities (Work & School) Opportunities (Work & School) Employment finding services are readily available Online access to job
Health & Safety Health & Safety Basic
Online
listings has made it easier to find work
IT
Businesses are creating new jobs The current
needs Minorities feel welcome Governance Governance Information on local government decisions are easily accessible Online public access to city finances has reduced corruption Corruption of city officials is not an issue of concern Online voting has increased participation Residents contribute to decision making of local government An online platform where residents can propose ideas has improved city life Residents provide feedback on local government projects Processing Identification Documents online has reduced waiting times (Eurostat) 670,000 0.912 (Global Data Lab)
Most children have access to a good school
skills are taught well in schools Lifelong learning opportunities are provided by local institutions Online services provided by the city has made it easier to start a new business
internet speed and reliability meet connectivity
81.9 53.7 66.1 75.6 STRUCTURES TECHNOLOGIES 50.0 59.8 60.1 52.4 49.0 51.9 49.2 67.6 48.1 46.5 44.3 All ratings range from AAA to D
3 65.2 GROUP CCC TECHNOLOGIES CC FACTOR RATINGS B STRUCTURES 62.5 72.5 2020 83.0 +0.007 +0.9 +0.0 +0.0 65.0 53.8 77.5 28.2 76.7
57
49.7 1 yr change 10.6 36,076 10.6 40,043 2021 2022 0.911 83.9 17.8 17.8 2019
54 in 2023 Out of 142 Out of 141 66.8 48.8 60.4 42.4 51.0 10.4 0.894 82.3 17.5 10.6 0.904 61.1 67.3 38,133 SMART CITY RANKING CCC in 2023 58.6 40.5 42.3 46.6 73.7 57.1 72.0 51.8 SMART CITY RATING +1,911 40,854 0.904 83.5 17.5 69.7% 61.9% 61.2% 43.4% 33.9% 31.5% 25.4% 23.1% 20.9% 19.6% 18.3% 16.1% 14.0% 12.7% 11.2% 0% 20% 40% 60% 80% 100% affordable housing health services fulfilling employment unemployment security public transport school education corruption / transparency basic amenities (water, waste) Green spaces recycling citizen engagement social mobility / inclusiveness road congestion air pollution 54.6% 73.5% 60.1% 65.5% 0% 20% 40% 60% 80% 100% 0 20 40 60 80 100 0 20 40 60 80 100
▼
Score
Area Score GROUP MEAN CITY LEGEND: MIN GROUP MAX CITY MEAN LEGEND:
of
Priority
Zhuhai
respondents who chose the

From a list of 15 indicators, survey respondents were asked to select 5 that they perceived as the most urgent for their city. The higher the percentage of responses per area, the greater the priority for the city.
% of respondents who agree or strongly agree with the statement
ATTITUDES
You are willing to concede personal data in order to improve traffic congestion
You are comfortable with face recognition technologies to lower crime
You feel the availability of online information has increased your trust in authorities
The proportion of your day-to-day payment transactions that are non-cash (% of transactions)
PRIORITY AREAS
INFORMATION City Population HDI
BACKGROUND
Map tiles by Stamen Design CC BY 3.0 Map Data © OpenStreetMap Country China HDI Life expectancy at birth Expected years of schooling Mean years of schooling GNI per capita (PPP $)
Basic sanitation meets the needs of the poorest areas Online reporting of city maintenance problems provides a speedy solution Recycling services are satisfactory A website or App allows residents to easily give away unwanted items Public safety is not a problem Free public wifi has improved access to city services Air pollution is not a problem CCTV cameras has made residents feel safer Medical services provision is satisfactory A website or App allows residents to effectively monitor air pollution Finding housing with rent equal to 30% or less of a monthly salary is not a problem Arranging medical appointments online has improved access Mobility Mobility Traffic congestion is not a problem Car-sharing Apps have reduced congestion Public transport is satisfactory Apps that direct you to an available parking space have reduced journey time Bicycle hiring has reduced congestion Online scheduling and ticket sales has made public transport easier to use The city provides information on traffic congestion through mobile phones Activities Activities Green spaces are satisfactory Online purchasing of tickets to shows and museums has made it easier to attend Cultural activities (shows, bars, and museums) are satisfactory Opportunities (Work & School) Opportunities (Work & School) Employment finding services are readily available Online access to job
Health & Safety Health & Safety
listings has made it easier to find work
IT
Lifelong
institutions
Businesses are creating new jobs The current
meet connectivity needs Minorities feel welcome Governance Governance Information on local government decisions are easily accessible Online public access to city finances has reduced corruption Corruption of city officials is not an issue of concern Online voting has increased participation Residents contribute to decision making of local government An online platform where residents can propose ideas has improved city life Residents provide feedback on local government projects Processing Identification Documents online has reduced waiting times (UN World Urbanization Prospects) 1,760,000 0.799 (Global Data Lab)
Most children have access to a good school
skills are taught well in schools
learning opportunities are provided by local
Online services provided by the city has made it easier to start a new business
internet speed and reliability
86.4 88.4 81.8 88.9 STRUCTURES TECHNOLOGIES 87.5 76.9 83.4 65.7 81.9 80.4 81.6 82.9 72.6 83.2 75.5 All ratings range from AAA to D
4 82.5 GROUP CCC TECHNOLOGIES CCC FACTOR RATINGS CCC STRUCTURES 72.7 80.2 2020 78.2 +0.003 +0.4 +0.0 +0.0 61.7 81.3 81.3 78.7 85.0
58
80.3 1 yr change 8.1 16,168 8.1 18,025 2021 2022 0.788 78.6 15.2 15.2 2019 ▲ 60 in 2023 Out of 142 Out of 141 86.4 80.4 88.1 71.3 85.1 8.0 0.781 78.1 15.2 8.1 0.785 83.0 74.3 17,499 SMART CITY RANKING CCC in 2023 77.0 81.0 67.0 77.8 72.1 75.3 69.8 79.4 SMART CITY RATING +526 15,934 0.775 78.0 15.0 46.7% 40.8% 39.9% 37.8% 36.6% 35.9% 35.5% 28.4% 28.0% 27.4% 23.3% 19.7% 15.2% 11.2% 8.3% 0% 20% 40% 60% 80% 100% security fulfilling employment social mobility / inclusiveness health services air pollution road congestion affordable housing corruption / transparency public transport basic amenities (water, waste) Green spaces recycling unemployment citizen engagement school education 88.8% 76.0% 86.4% 80.4% 0% 20% 40% 60% 80% 100% 0 20 40 60 80 100 0 20 40 60 80 100
Score
Priority Area Score GROUP MEAN CITY LEGEND: MIN GROUP MAX CITY MEAN LEGEND:
% of
Zurich
chose

From a list of 15 indicators, survey respondents were asked to select 5 that they perceived as the most urgent for their city. The higher the percentage of responses per area, the greater the priority for the city.
respondents who agree or strongly agree with the statement
ATTITUDES
You are willing to concede personal data in order to improve traffic congestion
You are comfortable with face recognition technologies to lower crime
You feel the availability of online information has increased your trust in authorities
The proportion of your day-to-day payment transactions that are non-cash (% of transactions)
PRIORITY AREAS
City Population HDI
BACKGROUND INFORMATION
Map tiles by Stamen Design CC BY 3.0 Map Data © OpenStreetMap Country Switzerland HDI Life expectancy at birth Expected years of schooling Mean years of schooling GNI per capita (PPP $)
Basic sanitation meets the needs of the poorest areas Online reporting of city maintenance problems provides a speedy solution Recycling services are satisfactory A website or App allows residents to easily give away unwanted items Public safety is not a problem Free public wifi has improved access to city services Air pollution is not a problem CCTV cameras has made residents feel safer Medical services provision is satisfactory A website or App allows residents to effectively monitor air pollution Finding housing with rent equal to 30% or less of a monthly salary is not a problem Arranging medical appointments online has improved access Mobility Mobility Traffic congestion is not a problem Car-sharing Apps have reduced congestion Public transport is satisfactory Apps that direct you to an available parking space have reduced journey time Bicycle hiring has reduced congestion Online scheduling and ticket sales has made public transport easier to use The city provides information on traffic congestion through mobile phones Activities Activities Green spaces are satisfactory Online purchasing of tickets to shows and museums has made it easier to attend Cultural activities (shows, bars, and museums) are satisfactory Opportunities (Work & School) Opportunities (Work & School) Employment finding services are readily available Online access to job listings has made
easier to find work
children
access to a good school IT skills are taught well in schools Lifelong learning opportunities are provided by local institutions Online services provided by the city has made it easier to start a new business Businesses are creating new jobs The current internet speed and reliability meet connectivity needs Minorities feel welcome Governance Governance Information on local government decisions are easily accessible Online public access to city finances has reduced corruption Corruption of city officials is not an issue of concern Online voting has increased participation Residents contribute to decision making of local government An online platform where residents can propose ideas has improved city life Residents provide feedback on local government projects Processing Identification Documents online has reduced waiting times (Eurostat) 410,000 0.989 (Global Data Lab)
Health & Safety Health & Safety
it
Most
have
82.0 61.8 79.7 82.0 STRUCTURES TECHNOLOGIES 60.6 58.3 55.6 62.9 51.4 86.3 45.4 63.2 41.0 43.6 44.5 All ratings range from AAA to D 1 1 86.2 GROUP AAA TECHNOLOGIES AA FACTOR RATINGS AAA STRUCTURES 80.0 75.9 2020 84.0 +0.002 +0.3 +0.0 +0.0 75.9 71.4 84.3 29.6 74.1
54.3 1 yr change 13.9 66,267 13.9 69,433 2021 2022 0.967 84.3 16.6 16.6 2019 ▬ 1 in 2023 Out of 142 Out of 141 79.8 69.6 61.6 74.7 51.7 13.9 0.957 83.1 16.4 13.9 0.965 67.0 86.3 68,550 SMART CITY RANKING AAA in 2023 73.8 48.4 65.5 53.1 84.0 63.9 74.3 57.1 SMART CITY RATING +882 67,531 0.960 83.8 16.3 76.4% 58.8% 32.2% 29.4% 28.2% 27.8% 25.9% 24.0% 22.3% 21.0% 20.1% 13.7% 11.8% 11.2% 11.1% 0% 20% 40% 60% 80% 100% affordable housing road congestion air pollution unemployment security Green spaces fulfilling employment health services public transport social mobility / inclusiveness recycling citizen engagement basic amenities (water, waste) corruption / transparency school education 67.6% 62.7% 66.5% 75.8% 0% 20% 40% 60% 80% 100% 0 20 40 60 80 100 0 20 40 60 80 100 % of
Score % of respondents
Priority Area Score GROUP MEAN CITY LEGEND: MIN GROUP MAX CITY MEAN LEGEND:
who
the
In part nership with
