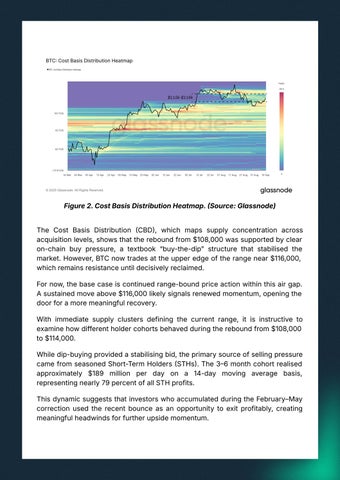
Figure 2. Cost Basis Distribution Heatmap. Source: Glassnode) The Cost Basis Distribution CBD, which maps supply concentration across acquisition levels, shows that the rebound from $108,000 was supported by clear on-chain buy pressure, a textbook “buy-the-dipˮ structure that stabilised the market. However, BTC now trades at the upper edge of the range near $116,000, which remains resistance until decisively reclaimed. For now, the base case is continued range-bound price action within this air gap. A sustained move above $116,000 likely signals renewed momentum, opening the door for a more meaningful recovery. With immediate supply clusters defining the current range, it is instructive to examine how different holder cohorts behaved during the rebound from $108,000 to $114,000. While dip-buying provided a stabilising bid, the primary source of selling pressure came from seasoned Short-Term Holders STHs. The 36 month cohort realised approximately $189 million per day on a 14-day moving average basis, representing nearly 79 percent of all STH profits. This dynamic suggests that investors who accumulated during the February–May correction used the recent bounce as an opportunity to exit profitably, creating meaningful headwinds for further upside momentum.
Bitfinex Alpha #172 | Bitcoin Rebounds as Stagflation Pressures Mount
Issuu converts static files into: and more. Sign up and create your flipbook.