Where is the floor for BTC? The market has just ended its third consecutive week of retracement from the $123,640 all-time high, prompting debate over whether this represents a temporary pause or the onset of a deeper contraction. To contextualise such a discussion we believe it is useful to turn to price models, and particularly the Cost Basis Distribution CBD) heatmap.
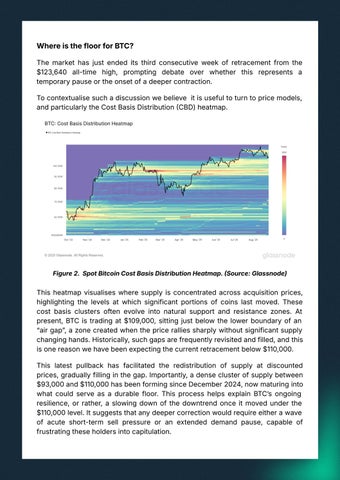
Figure 2. Spot Bitcoin Cost Basis Distribution Heatmap. Source: Glassnode)
This heatmap visualises where supply is concentrated across acquisition prices, highlighting the levels at which significant portions of coins last moved. These cost basis clusters often evolve into natural support and resistance zones. At present, BTC is trading at $109,000, sitting just below the lower boundary of an “air gapˮ, a zone created when the price rallies sharply without significant supply changing hands. Historically, such gaps are frequently revisited and filled, and this is one reason we have been expecting the current retracement below $110,000. This latest pullback has facilitated the redistribution of supply at discounted prices, gradually filling in the gap. Importantly, a dense cluster of supply between $93,000 and $110,000 has been forming since December 2024, now maturing into what could serve as a durable floor. This process helps explain BTCʼs ongoing resilience, or rather, a slowing down of the downtrend once it moved under the $110,000 level. It suggests that any deeper correction would require either a wave of acute short-term sell pressure or an extended demand pause, capable of frustrating these holders into capitulation.