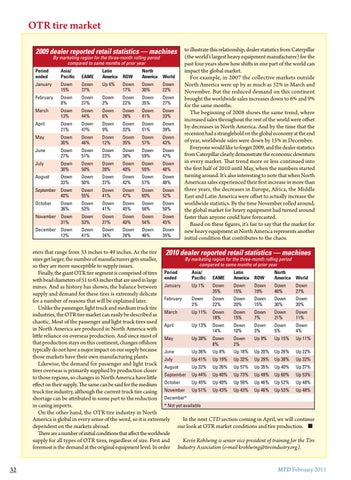
OTR tire market 2009 dealer reported retail statistics — machines By marketing region for the three-month rolling period compared to same months of prior year Latin America ROW
North America World
Down 27%
Up 4%
Down 17%
Down 30%
Down 22%
Down 8%
Down 37%
Down 2%
Down 22%
Down 35%
Down 27%
March
Down 13%
Down 44%
Down 6%
Down 28%
Down 41%
Down 33%
April
Down 21%
Down 47%
Down 9%
Down 32%
Down 51%
Down 39%
May
Down 30%
Down 46%
Down 12%
Down 35%
Down 57%
Down 43%
June
Down 27%
Down 51%
Down 23%
Down 38%
Down 59%
Down 47%
July
Down 30%
Down 50%
Down 28%
Down 40%
Down 59%
Down 48%
August
Down 33%
Down 50%
Down 37%
Down 42%
Down 57%
Down 48%
September Down 40%
Down 55%
Down 41%
Down 47%
Down 60%
Down 52%
October
Down 36%
Down 53%
Down 41%
Down 45%
Down 58%
Down 50%
November
Down 31%
Down 53%
Down 27%
Down 40%
Down 54%
Down 45%
December
Down 12%
Down 41%
Down 24%
Down 28%
Down 46%
Down 35%
Period ended
Asia/ Pacific
EAME
January
Down 15%
February
to illustrate this relationship, dealer statistics from Caterpillar (the world’s largest heavy equipment manufacturer) for the past four years show how shifts in one part of the world can impact the global market. For example, in 2007 the collective markets outside North America were up by as much as 32% in March and November. But the reduced demand on this continent brought the worldwide sales increases down to 6% and 9% for the same months. The beginning of 2008 shows the same trend, where increased sales throughout the rest of the world were offset by decreases in North America. And by the time that the recession had a stranglehold on the global economy at the end of year, worldwide sales were down by 15% in December. Everyone would like to forget 2009, and the dealer statistics from Caterpillar clearly demonstrate the economic downturn in every market. That trend more or less continued into the first half of 2010 until May, when the numbers started turning around. It’s also interesting to note that when North American sales experienced their first increase in more than three years, the decreases in Europe, Africa, the Middle East and Latin America were offset to actually increase the worldwide statistics. By the time November rolled around, the global market for heavy equipment had turned around faster than anyone could have forecasted. Based on these figures, it’s fair to say that the market for new heavy equipment in North America represents another initial condition that contributes to the chaos.
eters that range from 33 inches to 49 inches. As the tire 2010 dealer reported retail statistics — machines sizes get larger, the number of manufacturers gets smaller, By marketing region for the three-month rolling period compared to same months of prior year so they are more susceptible to supply issues. Latin North Asia/ Finally, the giant OTR tire segment is comprised of tires Period America ROW America World Pacific EAME with bead diameters of 51 to 63 inches that are used in large ended Up 1% Down Down Down Down Down mines. And as history has shown, the balance between January 35% 15% 19% 40% 27% supply and demand for these tires is extremely delicate February Down Down Down Down Down Down for a number of reasons that will be explained later. 2% 22% 20% 15% 30% 20% Unlike the passenger, light truck and medium truck tire March Up 11% Down Down Down Down Down industries, the OTR tire market can easily be described as 18% 15% 7% 21% 11% chaotic. Most of the passenger and light truck tires used April Up 13% Down Down Down Down Down in North America are produced in North America with 14% 10% 3% 5% 4% little reliance on overseas production. And since most of May Up 38% Down Down Up 9% Up 15% Up 11% that production stays on this continent, changes offshore 8% 2% typically do not have a major impact on our supply because June Up 36% Up 8% Up 18% Up 20% Up 26% Up 22% those markets have their own manufacturing plants. July Up 41% Up 19% Up 32% Up 29% Up 38% Up 32% Likewise, the demand for passenger and light truck August Up 32% Up 26% Up 57% Up 35% Up 40% Up 37% tires overseas is primarily supplied by production closer to those regions, so changes in North America have little September Up 44% Up 40% Up 73% Up 49% Up 60% Up 53% Up 45% Up 40% Up 59% Up 46% Up 52% Up 48% effect on their supply. The same can be said for the medium October truck tire industry, although the current truck tire casing November Up 51% Up 43% Up 43% Up 46% Up 53% Up 48% shortage can be attributed in some part to the reduction December* * Not yet available in casing imports. On the other hand, the OTR tire industry in North America is global in every sense of the word, so it is extremely In the next CTD section coming in April, we will continue dependent on the markets abroad. our look at OTR market conditions and tire production. ■ There are a number of initial conditions that affect the worldwide supply for all types of OTR tires, regardless of size. First and Kevin Rohlwing is senior vice president of training for the Tire foremost is the demand at the original equipment level. In order Industry Association (e-mail krohlwing@tireindustry.org).
32 MTD_31-39.indd 32
MTD February 2011 4/26/11 11:30:55 AM