cross references of tests, equipment, products, services
+ REFERENCE GUIDES
critical limits, drug levels, drug testing cutoffs, adult and pediatric reference intervals A SUPPLEMENT OF
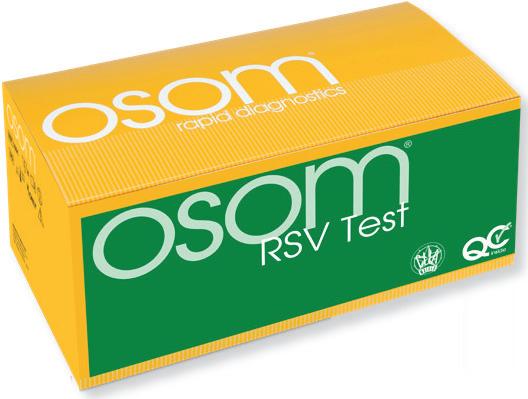
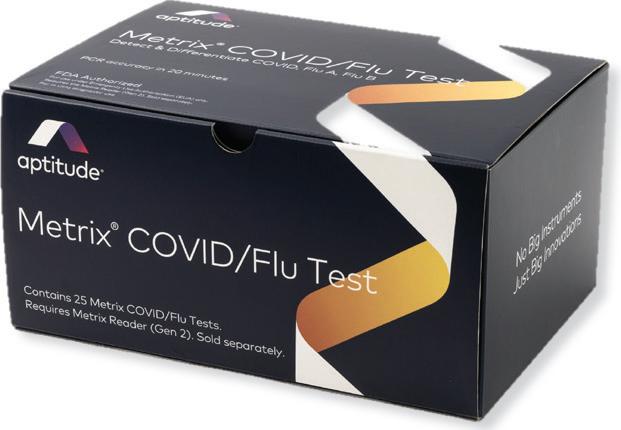
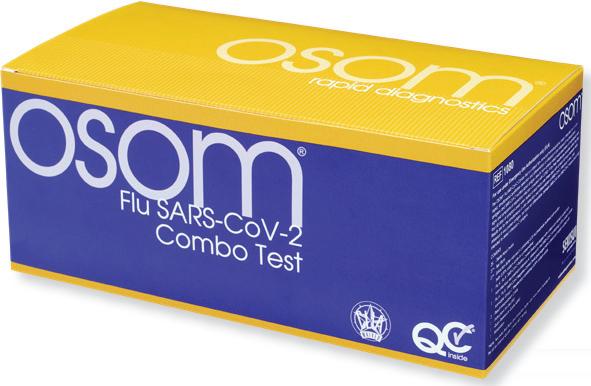
Fast + Accurate Point-of-Care Respiratory Solutions To Meet Your Needs
During respiratory season, your patients depend on you to provide fast, accurate diagnosis and effective treatment plans. Having the right diagnostic solutions in your office can help you provide the care your patients expect.
Our product portfolio includes high-quality, point-of-care molecular and antigen tests for diagnosing respiratory illnesses. Our solutions can help you deliver answers and treatment plans for your patients which can get them on the road to recovery and improve outcomes for your clinical practice.
We make diagnostics that matter because we believe each test represents the health and well-being of a real person.
HOW TO USE CLR
The
The
index conveniently categorizes and
laboratory products by test names, equipment types, and services
Our annual guide
By Christina Wichmann
Editor in Chief
Medical Laboratory Observer’s annual reference guide, Clinical Laboratory Reference (CLR) is the industry’s only complete resource guide providing tables of critical values and high and low critical limits; cutoff concentrations for drug tests; critical limits for therapeutic drug levels; adult reference intervals; and pediatric reference intervals. CLR also provides an extensive, alphabetical guide to tests, equipment, and services for the clinical lab market, along with company descriptions and contact information for ordering and pricing.
The tables of critical limits, critical values, and reference intervals help laboratorians interpret test results. Critical limits establish the upper and lower values that indicate when a patient’s medical condition may be precarious, requiring the immediate attention of the provider who ordered the test. A clinical laboratory critical value is a laboratory test result that falls significantly outside the normal reference interval and indicates a potentially life-threatening situation requiring immediate medical attention. Clinical laboratory reference intervals (also known as reference ranges) are the set of values used by healthcare providers to interpret laboratory test results. These intervals represent the expected range of values for a healthy population and help determine whether a patient’s test result is normal, low, or high.
I want to thank our committed reviewers of these tables; without them this important resource would not be available:
• The tables of critical limits and values were reviewed and updated by Gerald Kost, MD, PhD, MS, FADLM of the POCT•CTR, School of Medicine, UC Davis, and his UC Honors Program student team. A new glucose critical limits table is included this year based on their research in press, “Critical Limits and Clinical Recommendations for Notification of Life-Threatening Glucose Test Results in the 21st Century” in Archives of Pathology & Laboratory Medicine.
• New this year, is Point-of-Care Testing Critical Limits by Kami Osher and Gerald J. Kost, MD, PhD, MS, FADLM, derived from their research published in Diagnostics (Basel) in 2026, “Critical Decision Thresholds for Urgent Physician Notification of Point-of-Care Testing Results.”
• Also new this year is Critical Limits for Therapeutic Drug Levels, from research by Elina Kuang, Yasmeen Ibrahim, Kyle Cheng, and Gerald J. Kost, MD, PhD, MS, FADLM. “Drug Critical Limits for Urgent Physician Notification” was published this year in Clinical Pharmacology & Therapeutics (CPT).
• The cutoff concentrations for drug tests table was reviewed by Jason Hudson, PhD, Scientific Director & Laboratory Director at Quest Diagnostics. A callout for the DOT was added regarding the morphine 4000 ng/mL cutoff.
• The table of reference intervals was reviewed and updated by Sean T. Campbell, PhD, DABCC, FADLM, Clinical Biochemist, Mount Sinai Hospital, Toronto, ON.
• The pediatric reference intervals table was reviewed and updated by Khosrow Adeli, PhD, FCACB, DABCC, FADLM, Head, Clinical Biochemistry, Hospital for Sick Children and Principle Investigator – CALIPER Program, along with Erin Brady, MLO Managing Editor.
Lastly, I hope you enjoy reading “Preparing labs for the near future” by Erin Brady. Seven laboratory industry professionals provided their viewpoints on the changes they believe will have the largest impacts on labs over the next one to two years, such as artificial intelligence, automation, workflow redesigns, staffing challenges, and healthcare affordability and financial pressures.
We hope readers find this resource beneficial. For the online version of CLR, please visit www.clr-online.com.
For comments or feedback on CLR, please feel free to reach out to me at cwichmann@mlo-online.com.
Vol. 58, No. 5
EDITOR IN CHIEF Christina Wichmann cwichmann@mlo-online.com
MANAGING EDITOR Erin Brady ebrady@endeavorb2b.com
PRODUCTION MANAGER Edward Bartlett
ART DIRECTOR Kelli Mylchreest
AUDIENCE DEVELOPMENT/LIST RENTALS Laura Moulton | lmoulton@endeavorb2b.com
ADVERTISING SERVICES MANAGER Terry Gann | tgann@endeavorb2b.com
ADVERTISING
SALES DIRECTOR OF HEALTHCARE Jennifer Hazen DIRECTOR OF SALES
EAST COAST/MIDWEST SALES, CLASSIFIEDS Carol Vovcsko (941) 321-2873 | cvovcsko@mlo-online.com
John Brunstein, PhD, Biochemistry (Molecular Virology) President & CSO PathoID, Inc., British Columbia, Canada
Lisa-Jean Clifford, COO & Chief Strategy Officer Gestalt, Spokane, WA
Barbara Strain, MA, SM(ASCP), CVAHP Principal, Barbara Strain Consulting LLC, Formerly Director, Value Management, University of Virginia Health System, Charlottesville, VA
Jeffrey D. Klausner, MD, MPH Professor of Preventive Medicine in the Division of Disease Prevention, Policy and Global Health, Department of Preventive Medicine at University of Southern California Keck School of Medicine. Donna Beasley, DLM(ASCP), Director Huron Healthcare, Chicago, IL
Anthony Kurec, MS, H(ASCP)DLM, Clinical Associate Professor, Emeritus, SUNY Upstate Medical University, Syracuse, NY
Paul R. Eden, Jr., MT(ASCP), PhD, Lt. Col., USAF (ret.) (formerly) Chief, Laboratory Services, 88th Diagnostics/Therapeutics Squadron, Wright-Patterson AFB, OH
Daniel J. Scungio, MT (ASCP), SLS, CQA (ASQ), Consultant at Dan the Lab Safety Man and Safety Officer at Sentara Healthcare, Norfolk, VA CORPORATE TEAM
CEO Chris Ferrell COO Patrick Rains CDO Jacquie Niemiec CALO Tracy Kane CMO Amanda Landsaw EVP INFRASTRUCTURE & PUBLIC SECTOR GROUP Kylie Hirko VP OF CONTENT STRATEGY, INFRASTRUCTURE & PUBLIC SECTOR GROUP Michelle Kopier 30 Burton Hills Blvd., Suite 185 Nashville, TN 37215 800-547-7377 | www.mlo-online.com
Medical Laboratory Observer USPS Permit 60930, ISSN 05807247 print, ISSN 2771-6759 online is published 9 times annually (January, March, April, May, July, August, September, October, November) by Endeavor Business Media, LLC. 201 N Main St 5th Floor, Fort Atkinson, WI 53538. Periodicals postage paid at Fort Atkinson, WI, and additional mailing offices. POSTMASTER: Send address changes to Medical Laboratory Observer, PO Box 3257, Northbrook, IL 60065-3257. SUBSCRIPTIONS: Publisher reserves the right to reject non-qualified subscriptions. Subscription prices: U.S. $164.80 per year; Canada/Mexico $199.56 per year; All other countries $284.54 per year. All subscriptions are payable in U.S. funds. Send subscription inquiries to Medical Laboratory Observer, PO Box 3257, Northbrook, IL 60065-3257. Customer service can be reached toll-free at 877-382-9187 or at MLO@ omeda.com for magazine subscription assistance or questions Printed in the USA. Copyright 2026 Endeavor Business Media, LLC. All rights reserved. No part of this publication may be reproduced or transmitted
Preparing labs for the near future
By Erin Brady
The clinical laboratory industry is rapidly changing and frequently asked to be resilient without always having the proper resources to adapt. Medical Laboratory Observer (MLO) asked seven industry experts which changes they believe will have the largest impact on labs over the next one-two years. They shared their insights on how labs should be preparing for continued staffing issues, regulatory pressures and changes, financial burdens, continued artificial intelligence (AI) rise, and other operational and diagnostic challenges. Here is what they said:
Operational improvements
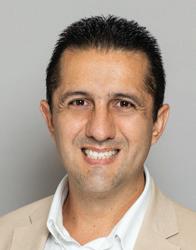
LUIS CARVAJAL, Director, Business Operations UHealth Laboratories, University of Miami Health System, Miami, Florida
AI and automation technologies, as well as strong research and clinical expertise.
The greatest transformation over the next 12 to 24 months will be the transition from labor-intensive operating models to more structured and scalable ways of running laboratory operations, built to sustain performance despite ongoing staffing pressure. This is not about implementing new technology. It is about redesigning how work actually flows through the lab in response to persistent workforce constraints, increasing testing complexity, tighter compliance expectations, and financial pressure.
Labs should be acting now. They should standardize workflows, clarify roles and ownership, strengthen operational governance, and use operational excellence as the foundation for targeted automation. Organizations that do this well will see clear improvements in turnaround time, quality, and workforce stability. Those that do not will continue to struggle, regardless of how much technology they deploy.
AI and automation are accelerating our understanding of increasingly complex biological systems and diseases, which in turn is driving demand for more advanced and efficient testing. At the same time, staffing shortages and reimbursement pressures are forcing laboratories to become more productive while operating with the same or fewer resources. In this environment, automation has become a critical strategic lever for maximizing investment and improving operational efficiency. AI is also making sophisticated technologies more accessible to less specialized operators, enabling laboratories to address growing complexity while easing workforce constraints. As these trends continue, the laboratory workforce of the future will increasingly require both familiarity with
One of the many changes likely to have a major impact on clinical laboratory operations over the next 12-24 months is the rapid convergence of artificial intelligence, automation, and workforce redesign. Laboratories are already managing persistent staffing shortages (documented in the ASCP vacancy survey), rising test complexity, expected shorter turnaround times, and heavier quality documentation demands. The practical question is no longer whether or what technology will enter the laboratory workflow, but how well laboratories will integrate the technology without weakening professional identity, trust, or culture.
AI and automation may help stabilize operations by reducing repetitive manual work, improving data visibility, supporting test triage, and enabling laboratory professionals to focus on interpretive, quality, and patient-impacting responsibilities. However, this transition has a psychological dimension that laboratory leaders should not underestimate. Despite a high vacancy rate,1,2 staff may reasonably wonder whether AI will eventually eliminate their jobs4, downgrade their job classifications, reroute tasks away from them, or create opportunities for administrators to reduce compensation. If these concerns are left unaddressed, technology adoption can be perceived less as support and more as a threat.
Laboratories should therefore prepare for AI implementation as both an operational and cultural change. In my paper, Reshaping Organizational Culture in Pathology,3 I emphasized that pathology and laboratory departments undergoing rapid transformation must move beyond traditional hierarchical models and intentionally build cultures grounded in collaboration, transparency, psychological safety, adaptability, and shared purpose. Those same principles apply to AI adoption. Staff are more likely to engage with new tools when leaders explain why the change is occurring, how patient care and quality will be protected, what work will remain human-centered, and how employees will be reskilled rather than simply displaced.
In the next two years, laboratories should prepare by developing clear governance around AI-enabled tools, including validation, competency, oversight, documentation, escalation pathways, and defined limits of use. They should also develop communication plans addressing the human side of implementation. This includes acknowledging uncertainty directly,
involving frontline laboratory professionals in workflow redesign, identifying tasks appropriate for automation rather than human judgment, and creating training pathways that help staff move into higher-value analytical, quality, informatics, supervisory, and patient-safety functions.
Laboratories navigating this transition most effectively will be those that treat technology as an extension of laboratory expertise, not a substitute for it. AI may change how work is distributed, documented, and monitored, but it will not eliminate the need for professional judgment, regulatory discipline, quality oversight, ethical decision-making, and accountability. Preparing now means strengthening both the technical infrastructure and the cultural infrastructure required for change. Laboratories should be inspection-ready, data-driven, and digitally capable. Still, they must also remain psychologically safe places where staff understand their future role in an increasingly technology-enabled laboratory environment.
Leadership opportunities
PATTY J. ESCHLIMAN, Mha, MlS(aScp)cM, DlM(aScp)cM Director of laboratory operations, nKc health, the lab leader coach, llc
In my MLO article New and current laboratory challenges that impact staffing: What you can do to overcome and reach success5 (April 7, 2026), I discuss the financial pressures facing medical laboratories under H.R.1 OBBB, commonly known as The One Big Beautiful Bill. Reduced healthcare affordability and tighter access are projected to leave as many as 14.2 million more Americans uninsured. Combined with lower Medicare and Medicaid reimbursement, these pressures could be the tipping point for already struggling rural hospitals.6 They may also prompt hospitals to view laboratory services as a loss leader and consider selling them to outside reference labs. Additionally, I highlighted workforce trends affecting laboratories: as Gen Z enters the workforce and baby boomers retire, staffing, recruitment, and retention are changing in ways laboratory leaders cannot afford to ignore.
Together, these changes point to what I see as the greatest opportunity for clinical laboratories: leadership development. It is discouraging to visit almost any laboratory social media group and see the unchecked expression of negativity and hostility. Some of this may be driven by bots designed to boost engagement by imitating human emotion and, in the process, amplifying harmful beliefs. However, there is often an underlying theme regarding a lack of leadership for addressing issues. Some of what I wince while reading include team members that are bullied by co-workers or other problematic behavioral issues that are reported but ignored, unequal work expectations and favoritism, micromanagement and the refusal to support the team, safety concerns, and even unethical conduct or unprofessional behavior from the supervisors themselves. Many times, these posts end with the questions: “What should I do?”“Should I stay here?” Or even “Should I leave the field of laboratory medicine?” Is this because so many laboratories promote individuals that are high in technical skills without considering if they are strong in interpersonal skills? Is it because our profession is so short staffed that there is no one who will step up into leadership? Or is it a systemic issue within the organization that leadership training is not needed or unnecessary? I suspect all of these problems might be in play, but the bottom line is that without strong leadership, there is not a strong team. I highly recommend that if not provided by their employer,
new leaders seek out leadership training that will ensure success. Become active in your professional organizations such as ASCLS or ASCP. Volunteerism is a great way to learn leadership skills in a nonjudgemental way that you can then take back to your organization and shine! There are a lot of resources within these organizations to tap into: read books, listen to podcasts, seek out a mentor, or hire a coach!
Insights from UAMS
DR. NATHAN JOHNSON, chair of laboratory Sciences at the university of arkansas for Medical Sciences (uaMS)
A challenge impacting clinical laboratories over the next 12–24 months will be the continued mismatch between testing volume and complexity and the available workforce to perform that testing. Laboratories are being asked to do more with fewer experienced personnel, while at the same time managing ever-changing regulatory expectations. We need to establish more University and College based training programs to supply the workforce. Our current programs are doing a great job, but even working at capacity are producing less than 50 percent of what is needed. In the short-term, laboratories may need to shift to non-traditional students and specialized training (e.g. categorical certification) to meet workforce needs.
MR. JASON KEY, assistant professor/program Director for online Studies at the university of arkansas for Medical Sciences (uaMS) The workforce shortage is real. I have the opportunity to visit Medical Laboratory Technician (MLT) programs all over the United States and they are doing phenomenal work. To better support these students, our MLT programs need support from local hospitals to host students. There are willing students, but our future workforce pipeline depends on hospitals carving out the time to host them. It’s hard because these hospitals are understaffed, but it is something we must do.
MR. PAUL NELSON , a ssociate p rofessor/ p rogram Director for non-Degree Studies at the university of arkansas for Medical Sciences (uaMS)
As AI becomes a more affordable and commonplace tool adopted across medical professions, clinical laboratories will continue moving away from physical manipulation of samples and manual bench testing at a more rapid pace. Over the next 12-24 months, clinical laboratories and the role of the medical laboratory scientist will continue to shift towards more quality management oversight, including increased data analysis and result interpretations, along with increased attention on machine/automation troubleshooting and more interdisciplinary communication and data sharing across the healthcare facility. Labs can better prepare by focusing on creating guidelines for the use of effective AI tools, training department supervisors on how to incorporate such tools into their daily workflows while actively listening to the frontline laboratory staff regarding which tools are working and which are problematic, overly burdensome and/or reduce accuracy, precision and timeliness of test result release back to the ordering provider.
CRITICAL LIMITS
By Gerald J. Kost, MD, PhD, MS, FADLM
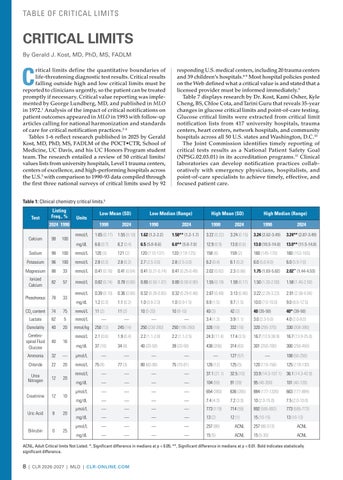
Critical limits define the quantitative boundaries of life-threatening diagnostic test results. Critical results falling outside high and low critical limits must be reported to clinicians urgently, so the patient can be treated promptly if necessary. Critical value reporting was implemented by George Lundberg, MD, and published in MLO in 1972.1 Analysis of the impact of critical notifications on patient outcomes appeared in MLO in 1993 with follow-up articles calling for national harmonization and standards of care for critical notification practices. 2-4
Tables 1-6 reflect research published in 2025 by Gerald Kost, MD, PhD, MS, FADLM of the POCT•CTR, School of Medicine, UC Davis, and his UC Honors Program student team. The research entailed a review of 50 critical limits/ values lists from university hospitals, Level 1 trauma centers, centers of excellence, and high-performing hospitals across the U.S.5 with comparison to 1990-93 data compiled through the first three national surveys of critical limits used by 92
Table 1: Clinical chemistry critical limits.5
ACNL, Adult Critical limits Not Listed. *, Significant difference in
responding U.S. medical centers, including 20 trauma centers and 39 children’s hospitals.6-8 Most hospital policies posted on the Web defined what a critical value is and stated that a licensed provider must be informed immediately.9
Table 7 displays research by Dr. Kost, Kami Osher, Kyle Cheng, BS, Chloe Cota, and Tarini Guru that reveals 35-year changes in glucose critical limits and point-of-care testing. Glucose critical limits were extracted from critical limit notification lists from 417 university hospitals, trauma centers, heart centers, network hospitals, and community hospitals across all 50 U.S. states and Washington, D.C.10
The Joint Commission identifies timely reporting of critical tests results as a National Patient Safety Goal (NPSG.02.03.01) in its accreditation programs. 11 Clinical laboratories can develop notification practices collaboratively with emergency physicians, hospitalists, and point-of-care specialists to achieve timely, effective, and focused patient care.
Hospitals are advised to review their notification practices, quantitative decision thresholds, and qualitative critical value notifications to assure that effective life-saving alerts improve patient outcomes without excessively burdening laboratory, bedside, critical care, or emergency staff.
REFERENCES
1. Lundberg GD. When to panic over an abnormal value. MLO. 1972;4:47-54.
2. Kost GJ. Using critical limits to improve patient outcomes. MLO 1993;25(3):22-27.
3. Kost GJ. Co-creating critical limits for enhanced acute care: proven need and web knowledge base. Part 1: A call to action! MLO. 2015;47(12):34, 36-37.
4. Kost GJ. Co-creating critical limits for enhanced acute care: proven need and web knowledge base. Part 2: Standard of care, what it means and how it is applied. MLO. 2016;48(1):28-29.
5. Shah A, Dohner J, Cheng K, Garcia M, Kost GJ. Visualization of Critical Limits and Critical Values Facilitates Interpretation. Diagnostics (Basel). 2025;15(5):604. doi:10.3390/diagnostics15050604.
6. Kost GJ. Critical limits for urgent clinician notification at U.S. medical centers. JAMA. 1990;263:704-707.
7. Kost GJ. Critical limits for emergency clinician notification at U.S. children’s hospitals. Pediatrics. 1991;88:597-603.
8. Kost GJ. The significance of ionized calcium in cardiac and critical care. Availability and critical limits at U.S. medical centers and children’s hospitals. Arch Pathol Lab Med. 1993;117:890-896.
9. Kost GJ, Dohner J, Liu J, Ramos D, Haider N, Thalladi V. Web-accessible critical limits and critical values for urgent clinician notification. Clin Chem Lab Med 2024;1-13. doi:10.1515/cclm-2024-0117.
10. Gerald J. Kost, et al. Critical Limits and Clinical Recommendations for Notification of Life-Threatening Glucose Test Results in the 21st Century. Arch Path Lab Med. 2026; in press.
11. Joint Commission. National Patient Safety Goal 02.03.01. Effective January 2026. https://digitalassets.jointcommission.org/api/public/content/3c7a110c2159 43bc80d9ce87e9d9ee9d?. Accessed June 1, 2026. *, Significant difference in medians at p < 0.05. Bold indicates statistically significant difference.
Table 3. Hematology and coagulation critical limits.5
Measurand
Table 2: Blood gas and pH critical limits.5
TABLE OF CRITICAL LIMITS
Table 4. Qualitative critical values.5
A. Microbiology
Table 4. Qualitative critical values.5
Table 5. Listing frequencies of critical pathogens.5
Table 6. Newborn critical limits.5
*, significant difference in medians and one mean at p < 0.05; **, significant difference in medians at p < 0.01. Bold indicates statistically significant difference.
7. Glucose critical limits — adults and newborns, 2025 versus 1990, and point-of-care testing.10
Newborns (at adult hospitals)
Point-of-care testing
Abbreviation: IQR, interquartile range; and SD, standard deviation. Note: Statistical computations were performed using data in mg/dL. To convert units, mmol/L= mg/dL x 0.05551. SI units (Système 555international d’unités) are shown for reader convenience.
Footnotes
a. For comparisons of 1990 versus 2025 critical limits, 35-year changes are boldfaced when median ranks differed significantly [Mann Whitney U statistical test, P <.001 or less, highly significant].
b. For the comparison of newborn high critical limits, P<.01.
c.Point-of-care testing showed no significant differences in when comparing adult matched pairs.
Table
Point-of-Care Testing (POCT) Critical Limits
By Kami Osher and Gerald J. Kost MD, PhD, MS, FADLM
The urgent communication of life-threatening test results is vital for patient safety, enabling rapid, potentially life-saving interventions. Unlike traditional laboratory testing, point-of-care testing (POCT) delivers rapid diagnostic results directly at or near the patient’s site. Healthcare institutions set thresholds for dangerously abnormal results to guide immediate treatment.
These tables display large-scale research by Kami Osher and Gerald J. Kost, MD, PhD, MS, FADLM, published in 2026 in Diagnostics (Basel), involving 417 hospitals across all 50 states and Washington, D.C., including university hospitals and affiliates, heart centers, and trauma centers.1
Abbreviation: SD, standard deviation.
1.B. Newborns
Table 1. Critical limits for point-of-care clinical chemistry tests.1
Table 2. Critical limits for point-of-care blood gas and pH tests.1
Abbreviation: SD, standard deviation.
Table 3. Critical limits for point-of-care hematology and coagulation tests.1
Elina Kuang, Yasmeen Ibrahim, Kyle Cheng, and Gerald J. Kost, MD, PhD, MS, FADLM
Acritical limit is an upper or lower numerical threshold of a diagnostic test that, when exceeded or fallen below, indicates a potentially life-threatening condition and requires immediate clinician notification. For drugs, critical limits represent concentrations associated with serious toxicity or loss of therapeutic effect. A critical value is defined as a qualitative result that also warrants urgent clinician notification. Critical values for drugs are commonly reported using qualitative notification phrases, indicating detection of a substance. An analyte is defined as a substance measured in a laboratory test.1 T he concept of critical values for drug levels was originally developed by the late Daniel M. Baer, MD, and first published in the April 1982 issue of MLO.
Tables 1-4 represent the first large- scale national analysis of critical limits for drugs, demonstrating variability between hospitals and offering a reference point for hospitals
to compare their practices. It consolidates and compares current practices to consensus recommendations for critical decision thresholds. Critical limits were collected by Kuang et al from 417 hospitals from all 50 U.S. states and Washington D.C. 411 of those kept drug critical limits lists. The research was originally published in the journal Clinical Pharmacology & Therapeutics (CPT).
The generally accepted definition for trough concentrations is defined as the measured drug concentration obtained immediately before the next scheduled dose. Peak is defined as the measured drug concentration obtained at a specified time after drug administration. Random is defined as a drug concentration measured at an unspecified time relative to dosing.1
REFERENCE
Bronchodilator
factors
1. Kuang E, Ibrahim Y, Cheng K, Kost GJ. Drug critical limits for urgent physician notification. Clin Pharmacol Ther. Published online 2026. doi:10.1002/cpt.70277.
Table 1 Cardiopulmonary critical limits1
Table 2. Psychotropic critical limits1
Antiepileptic
CRITICAL LIMITS FOR THERAPEUTIC DRUG LEVELS
Table 2 Psychotropic critical limits1
Tricyclic antidepressants
SI conversion factors are provided in Supplementary Table S3 of the original Clinical Pharmacology and Therapeutics article. n = number of hospitals. aPercent difference = [(maximum − minimum)/(minimum)] × 100. bQuartile coefficient of dispersion (QCD) = [(Q3
Table 3. Analgesic, antimicrobial, and immunosuppressant critical limits1
Analgesic
Antimicrobials
Table 3 Analgesic, antimicrobial, and immunosuppressant critical limits1
Antimicrobials
Immunosuppressants
SI conversion factors are provided in Supplementary Table S3 of the original Clinical Pharmacology and Therapeutics article. n = number of hospitals.
SI conversion factors are provided in Supplementary Table S3 of the original Clinical Pharmacology and Therapeutics article. n = number of hospitals. aPercent difference = [(maximum − minimum)/(minimum)] × 100. bQuartile coefficient of dispersion (QCD) = [(Q3 − Q1)/(Q3 + Q1)] × 100.
This table was put together by MLO staff and reviewed by Jason Hudson, PhD, Scientific Director & Laboratory Director at Quest Diagnostics. The table refers to federal regulations at 42 CFR Chapter 1, HHS Drug Testing Panel—Urine and 49 CFR part 40, Section 40.85. Fentanyl and norfentanyl were added to the table in 2025 due to the prevalence of fentanyl use and overdoses. The table follows:1,2
*The DOT has not yet approved the morphine 4000 ng/mL cutoff or testing for fentanyl.
REFERENCES
1. Mandatory guidelines for Federal workplace drug testing programs-authorized testing panels. Federal Register. January 16, 2025. Accessed June 5, 2026. https://www. federalregister.gov/d/2025-00425.
2. 49 CFR part 40 -- procedures for transportation workplace drug and alcohol testing programs. Ecfr.gov. Accessed June 5, 2026. https://www.ecfr.gov/current/title-49/ subtitle-A/part-40.
3. SAMHSA guidelines - US. Accessed June 5, 2026. https://www.thermofisher.com/us/en/home/clinical/diagnostic-testing/clinical-chemistry-drug-toxicology-testing/drugsabuse-testing/drug-testing-overview/samhsa.html.
A. For grouped analytes (i.e., two or more analytes that are in the same drug class and have the same initial test cutoff): Immunoassay: The test must be calibrated with one analyte from the group identified as the target analyte. The cross-reactivity of the immunoassay to the other analyte(s) within the group must be 80 percent or greater; if not, separate immunoassays must be used for the analytes within the group.
Alternate technology: Either one analyte or all analytes from the group must be used for calibration, depending on the technology. For a technology that measures a response from the entire group without differentiating between analytes (e.g., an activity-based assay, a mass spectrometric assay that does not differentiate isobaric compounds), the laboratory must compare the result to the initial test cutoff. In the case of an alternate technology that differentiates and quantifies each analyte in the group, the laboratory must compare each analyte’s result to the confirmatory test cutoff and reflex specimens with a positive initial test result to confirmatory testing.
B. Alternate technology (BZE): The confirmatory test cutoff must be used for an alternate technology initial test that is specific for the target analyte (i.e., 100 ng/mL for benzoylecgonine).
C. A fentanyl immunoassay must have at least 5% cross-reactivity to norfentanyl.
D. Methylenedioxymethamphetamine (MDMA).
TABLE OF REFERENCE INTERVALS
S
S Vitamin B12 (WHO Recommendation)
S Vitamin D (25-OH)
B WBC count 4-11
S Zinc
Specimens: B, whole blood; P, plasma; S, serum. Reference intervals depend on test method and the demographics of the normal population used.
*Adult intervals (18Y-60Y). Age specific ranges apply for pediatric and/or geriatric populations.
Source: Burtis CA, Bruns DE. Tietz Fundamentals of Clinical Chemistry and Molecular Diagnostics. 7th ed. St. Louis, MO; Elsevier; 2015 and Rifai, N, Horvath AR, Wittwer, CT. Tietz Textbook of Clinical Chemistry and Molecular Diagnostics, 6th ed. St. Louis, MO; Elsevier; 2018 McPherson RA, Pincus MR. Henry’s Clinical Diagnosis and Management by Laboratory Methods. 22nd ed. Philadelphia, PA: Elsevier Saunders; 22nd ed; 2011. Revised in 2026 by S. T. Campbell, PhD, DABCC, FADLM, Clinical Biochemist, Mount Sinai Hospital, Toronto, ON. Specimen Test
Albumin G1,2
Specimen Type: Serum
Instrument/Reagent: Abbott Architect
Carbon Dioxide CO21,2
Specimen Type: Serum
Instrument/Reagent: Abbott Architect
ALT (Alanine
Aminotransferase)1,2
Specimen Type: Serum
Instrument/Reagent: Abbott Architect
1−
ALP (Alkaline Phosphatase)1,2
Specimen Type: Serum
Instrument/Reagent: Abbott Architect
Chloride1,3
Specimen Type: Serum
Instrument/Reagent: Siemens ADVIA XPT/1800
0- <19 years 104-109
C−Reactive Protein- High Sensitivity (hsCRP)1,2
Specimen Type: Serum
Instrument/Reagent: Abbott Architect
Creatine Kinase (CK)1,3
Specimen Type: Serum
Instrument/Reagent: Siemens ADVIA XPT/1800
10− <13 years 141−460 141−460
13− <15 years 127−517 62−280
15− <17 years 89−365 54−128
17− <19 years 59−164 48−95
Bilirubin, total1 ,2
Specimen Type: Serum
Instrument/Reagent: Abbott Architect
0− <15 days 0.2−16.6 15 days− <1 year 0.1−0.7
1− <9 years 0.1−0.4 9− <12 years
Calcium1,2 Specimen Type: Serum
Instrument/Reagent: Abbott Architect
Creatinine (Enzymatic)1,2
Specimen Type: Serum
Instrument/Reagent: Abbott Architect
The information in this chart was updated by MLO Staff based on the CALIPER database1 and reviewed by Khosrow Adeli, PhD, FCACB, DABCC, FADLM, Head, Clinical Biochemistry at The Hospital for Sick Children and Principle Investigator of the CALIPER Program. The reviewed chemistries are comparable to those listed in MLO's original Pediatric Reference Intervals chart, last updated in 2022. For reference intervals obtained by other lab instruments, see the CALIPER database.1
Magnesium1,2
Specimen Type: Serum
Instrument/Reagent: Abbott Architect
and Female (mg/dL)
0- <15 days 1.99- 3.94
15 days to <1 year 1.97- 3.09
1 to <19 years 2.09- 2.84
Potassium1,3
Specimen Type: Serum
Instrument/Reagent: Siemens ADVIA XPT/1800
<1year 4.3-6.7 4.2-6.2
Protein, Total1,2
Specimen Type: Serum
Instrument/Reagent: Abbott Architect Age Male and Female (g/dL)
0− <15 days 5.3−8.3
Sodium Serum1,3
Specimen Type: Serum
Instrument/Reagent:
REFERENCES
Serum
Total Iron Binding Capacity1,3 Specimen Type: Serum/Plasma Instrument/Reagent: Siemens ADVIA XPT/1800
2. Colantonio DA, Kyriakopoulou L, Chan MK, et al. Closing the gaps in pediatric laboratory reference intervals: a CALIPER database of 40 biochemical markers in a healthy and multiethnic population of children. Clin Chem 2012;58(5):854-868. doi:10.1373/clinchem.2011.177741.
3. Tahmasebi H, Higgins V, Woroch A, Asgari S, Adeli K. Pediatric reference intervals for clinical chemistry assays on Siemens ADVIA XPT/1800 and Dimension EXL in the CALIPER cohort of healthy children and adolescents. Clin Chim Acta. 2019;490:88-97. doi:10.1016/j.cca.2018.12.011.
4. Higgins V, Asgari S, Chan MK, Adeli K. Pediatric reference intervals for calculated LDL cholesterol, non-HDL cholesterol, and remnant cholesterol in the healthy CALIPER cohort. Clin Chim Acta. 2018;486:129-134. doi:10.1016/j. cca.2018.07.028.
Abbott Diagnostics
Abbott Park, IL, US https://www.abbottdiagnostics.com
Advanced Data Systems Corporation Paramus, NJ, US https://www.adsc.com
Alba Bioscience, Inc. Chicago, IL, US https://alivedx.com/alba
ALCOR Scientific, Inc.
Smithfield, RI, US https://alcorscientific.com
American Proficiency Institute (API) Traverse City, MI, US https://www.api-pt.com
AP Visions, LLC
Santa Clara, UT, US https://www.ap-visions.com
Applied BioCode
Santa Fe Springs, CA, US https://www.apbiocode.com
Arkray USA Minneapolis, MN, US https://www.arkrayusa.com
Arkstone Medical Solutions LLC
Boca Raton, FL, US https://arkstone.ai
Ascentry
L’Union, France https://www.ascentry.com
Asuragen
Austin, TX, US https://asuragen.com
AUDIT MicroControls
Eatonton, GA, US https://www.auditmicro.com
Barry University
Miami Shores, FL, US https://www.barry.edu
BD Diagnostics
Franklin Lakes, NJ, US https://www.bd.com
Beckman Coulter, Inc. Brea, CA, US https://www.beckmancoulter.com
Bio-Rad Laboratories Inc Hercules, CA, US https://www.bio-rad.com
Carolina Liquid Chemistries Corp. Greensboro, NC, US https://www.carolinachemistries.com
Cepheid Sunnyvale, CA, US https://www.cepheid.com
Clinical Software Solutions
Queen Creek, AZ, US https://www.clin1mobile.net
Clinisys Tucson, AZ, US https://www.clinisys.com
CLSI/Clinical Laboratory
Standards Institute
Wayne, PA, US https://clsi.org
CompuGroup Medical Richardson, TX, US https://www.cgm.com
Computer Service and Support Linwood, NJ, US https://csslis.com
Diasorin
12112 Technology Blvd, Suite 130, Austin, TX, 78727, US
TEL: 512-219-8020
SUPPORT@LUMINEXCORP.COM
HTTPS://us.diasorin.com/en/moleculardiagnostics
See ad on back cover
Sample-to-Customizable Answers for Your Respiratory Testing
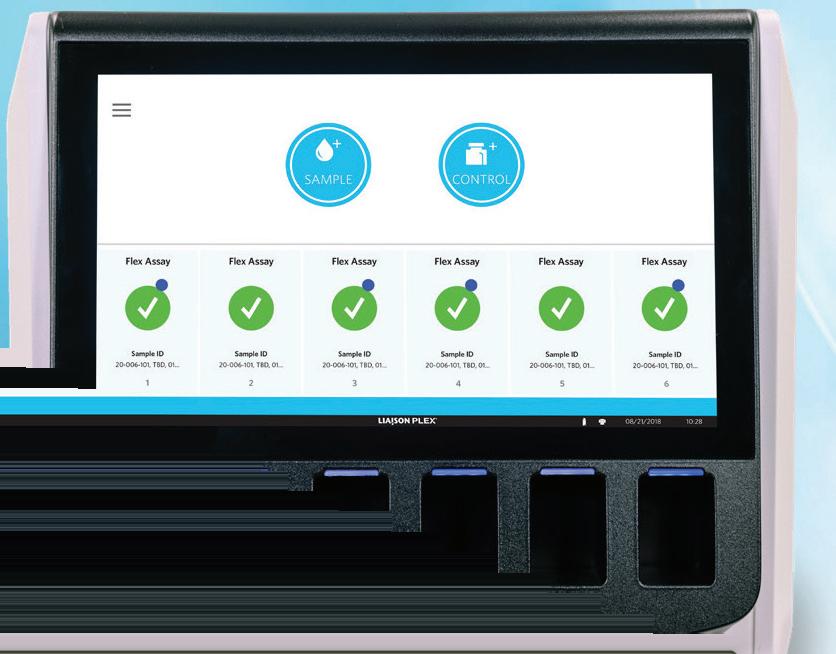
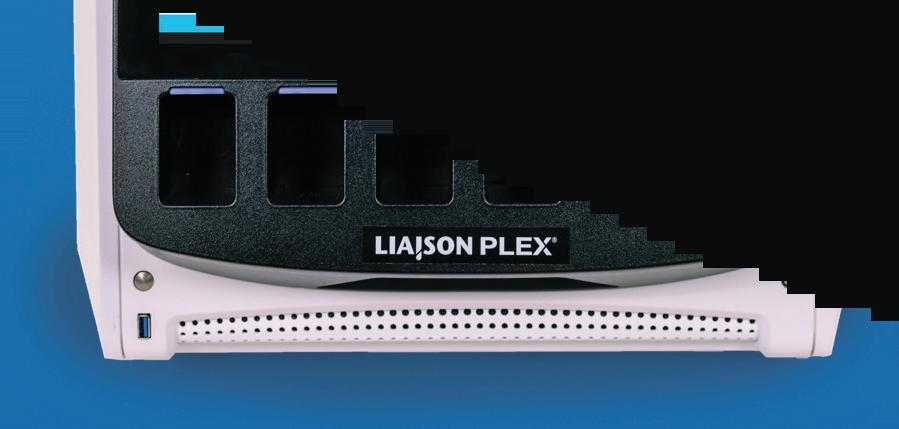
The LIAISON PLEX® System is uniquely designed to provide full flexibility in the customization of syndromic panels and will allow clinical laboratory staff to overcome the constraint of the “one size fits all” approach for infectious disease syndromic diagnostics. This fully automated, easy to use, sample-to answer system has a streamlined workflow and a room-temperature consumable. The operational handson time is only two minutes per sample and results are produced in less than two hours.
The LIAISON PLEX® Respiratory Flex Assay is the first assay cleared for use on our new LIAISON PLEX System. Testing for 19 pathogens commonly associated with respiratory infections—including 14 viral and 5 bacterial targets—the LIAISON PLEX Respiratory Flex Assay gives users the choice to process and pay for a specific subset of customized results based on patient needs. Compared to standard panel testing, this method can improve clinical utility while decreasing cost burdens on patients and healthcare systems. Through the application of panel testing, patient care and treatment can be optimized in support of diagnostic stewardship efforts, thus enabling proper patient therapies and reducing costly over-testing.
Modernize your respiratory testing with sample-to-customizable answer capabilities—discover how the LIAISON PLEX Respiratory Flex Assay will address your lab’s current and future needs while battling the rising cost of patient care.
Diazyme Laboratories
Poway, CA, US https://www.diazyme.com
Drucker Diagnostics
Port Matilda, PA, US https://druckerdiagnostics.com
ELITechGroup MDx
Bothell, WA, US https://egmdx.com
ELLKAY
Elmwood Park, NJ, US https://www.ellkay.com
Fujirebio Diagnostics, Inc. Malvern, PA, US https://www.fujirebio.com
Genomadix Kanata, ON, Canada https://genomadix.com
Gestalt Spokane, WA, US https://gestaltdiagnostics.com
Globe Scientific Mahwah, NJ, US https://www.globescientific.com
Greiner Bio-One Monroe, NC, US https://www.gbo.com
Grundium Ltd
Tampere, Finland https://www.grundium.com
Hardy Diagnostics
Santa Maria, CA, US https://hardydiagnostics.com
Health Care Logistics
PO Box 25, Circleville, OH, 43113, US 740-477-3755
HCL@GOHCL.COM HTTPS://gohcl.com
Health Care Logistics is an industry leader specializing in manufacturing, packaging and distributing unique and hard-to-find products. Top inventory lines include Lab Equipment, Biohazard Supplies and Specimen Handling Materials. The company’s commitment to customer satisfaction sets it apart
COMPANY DIRECTORY
with services such as free samples, small package quantities and sameday shipping on most items. HCL® has spent more than 40 years tailoring its products and services to the needs of its customers and will scout non-inventory items at no extra charge or manufacture custom solutions based on individual requests.
Hologic, Inc.
Marlborough, MA, US https://www.hologic.com
IMMY Norman, OK, US https://www.immy.com
Kamiya Biomedical Company, LLC Tukwila, WA, US https://www.kamiyabiomedical.com
MUSCLE SPECIFIC TYROSINE KINASE AUTOANTIBODY (MuSKAb)
• Radioimmunoassay Kit, 25 Tubes†
• TITIN AUTOANTIBODY
• ELISA Kit, 48 Wells†
KRONUS, Inc.
170 S Seneca Springs Way, Suite 105, Star, ID, 83669, US
TEL: 207-377-4800
KRONUS@KRONUS.COM
HTTPS://www.kronus.com
See ad on page 5
For over 35 years, KRONUS has provided specialized immunoassay test kits to medical professionals at the world’s most respected laboratory facilities. Please contact us directly with any questions, requests or comments that you may have. We welcome the opportunity to learn how KRONUS can be of assistance in meeting your laboratory’s immunoassay test kit needs.
• Radioimmunoassay Kit, 25 Tubes† † For Research Use Only. Not For Use in Diagnostic Procedures
Lab Savvy Falls Church, VA, US https://www.labsavvy.com
LabOS
Petah Tikva, Central District, Israel https://labos.co
LGP Lab Automation PO Box 18, Woodriver, IL, 62095, US SALES@LGPLABAUTOMATION.COM HTTPS://lgplabautomation.com
Is safety your concern? Then Pluggo Decapper(s) and KapSafe Recapper(s) are your solutions. Both are benchtop proven, reliable
and affordable. Eliminate possible injury during manual decapping and recapping. Serving labs since 2002. Luminex, a DiaSorin Company Austin, TX, US https://www.luminexcorp.com
MedPro Healthcare Staffing Sunrise, FL, US https://medprostaffing.com
Microbiologics
Saint Cloud, MN, US https://www.microbiologics.com
MilliporeSigma Burlington, MA, US https://www.sigmaaldrich.com
Northcentral Technical College Wausau, WI, US https://www.ntc.edu
Nova Biomedical Waltham, MA, US https://www.novabiomedical.com
Owen Mumford, Inc Marietta, GA, US https://www.owenmumford.com
Proline Laboratory Furniture 10 Avco Rd, Haverhill, MA, 01835, US
BENCH@1PROLINE.COM HTTPS://www.1proline.com
Proline Laboratory Furniture and Tables offers a modular design that allows you to configure laboratory to meet your requirement. Offering multiple work surface choices including but not limited to Epoxy Resin, Stainless Steel and economical Chem-Guard chemical resistant work surfaces. Cabinets offer 90 percent extension slides with 150 pounds capacity. Economical laboratory tables with hanging cabinets and casters offering a truly modular ergonomic design.
Puritan Medical Products Co
31 School St, PO Box 149, Guilford, ME, 04443, US 207-876-3311
SALES@PURITANMEDPRODUCTS.COM
HTTPS://www.puritanmedproducts.com
A tradition of excellence. Puritan is now in our 107th year of business. We founded our company on the principles of pride in achieving excellence and determination to succeed. Our customers know us as the swab experts, with a focus on quality, consistency, outstanding customer service, and our commitment to partnering with them in their pursuit of these same principles.
When you’ve been around since 1919, change is inevitable. While we’ve certainly grown, one thing that’s never changed at Puritan is our incredibly high standards. This commitment and attention to detail are why we have a worldwide reputation for consistent quality. In fact, we regularly go beyond for our own QC satisfaction because it is extremely important to us that every product we make is the best of its kind.
Our manufacturing facility is ISO certified and CE mark registered, so you can be certain we adhere to the strictest quality guidelines. We’ll deliver excellent products and services across our organization every time, on time. That’s our promise to you.
Order with confidence, knowing our products are manufactured, packaged, and shipped from our state-of-the-art facilities in Maine, USA.
Qiagen, Inc.
Germantown, MD, US https://www.qiagen.com
Quantimetrix
Redondo Beach, CA, US https://www.quantimetrix.com
QuidelOrtho
San Diego, CA, US https://www.quidelortho.com
Randox Laboratories-US, Ltd. Kearneysville, WV, US https://www.randox.com
Roche Diagnostics Corporation Indianapolis, IN, US https://diagnostics.roche.com
Sarstedt, Inc.
Nümbrecht, Germany https://www.sarstedt.com
SCC Soft Computer
Clearwater, FL, US https://www.softcomputer.com
Sciteck
Fletcher, NC, US https://sciteck.org
Sebia, Inc
Norcross, GA, US https://www.sebia.com
SEKISUI Diagnostics LLC
6659 Top Gun Street, San Diego, CA, 92121, US
TEL: 781-652-7800
QUESTIONS@SEKISUI-DX.COM
HTTPS://www.sekisuidiagnostics.com
See ad on inside front cover
With over 40 years of experience, SEKISUI Diagnostics’ mission is to provide intelligent solutions to enhance life with science and improve the health of all people. We supply innovative medical diagnostics globally to physicians, hospitals, laboratories and alternate testing locations. Our product lines include clinical chemistry reagents, point-of-care tests, blood collection tube materials as well as enzymes and specialty biochemicals.
Shimadzu Corp Kyoto, Japan https://www.shimadzu.com
Siemens Healthineers
Tarrytown, NY, US https://www.siemens-healthineers. com/en-us
StaffReady
Spokane, WA, US https://www.staffready.com
Streck La Vista, NE, US https://www.streck.com
Swift Sensors, Inc Austin, TX, US https://www.swiftsensors.com
Sysmex America, Inc.
577 Aptakisic Rd, Lincolnshire, IL, 60069, US 888-879-7639
A Portfolio of Solutions you need for the lab of tomorrow
Hematology Solutions
• As a global leader in hematology, we’re proud to offer labs of all sizes award-winning services and innovative solutions.
Hemostasis Solutions
• Our innovative portfolio of hemostasis analyzers, reagents and controls are designed with quality and efficiency in mind. We provide advanced hemostasis technology across multiple platforms.
Urinalysis Solutions
• With fluorescent flow cytometry technology at its core, the Sysmex UN-Series offers an innovative urinalysis solution for any size laboratory.
Flow Cytometry Solutions
• Our comprehensive Flow Cytometry solutions include automated sample preparation, flow cytometers, filters, reagents, monoclonal antibodies and analytical software.
Informatics Solutions
• From highly secure test results and impactful performance metrics to quality control management, our software is designed to help your lab streamline its clinical and operational workflows so you can provide optimal patient care. For more information about Sysmex solutions, visit www.sysmex.com/us
Techcyte Orem, UT, US https://www.techcyte.com
TechLab Blacksburg, VA, US https://www.techlab.com
Thermo Fisher Scientific, Genetic Sciences Division Waltham, MA, US https://www.thermofisher.com
Tosoh Bioscience Inc. Grove City, OH, US https://www.tosohbioscience.com
Visiun Inc Burlington, NC, US https://www.visiun.com
Werfen Bedford, MA, US https://www.werfen.com
WSLH Proficiency Testing Madison, WI, US https://www.wslhpt.org
ZeptoMetrix Buffalo, NY, US https://www.zeptometrix.com