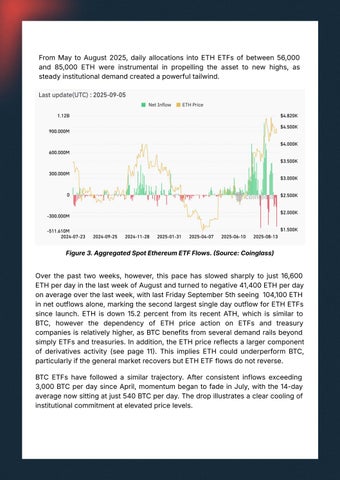
From May to August 2025, daily allocations into ETH ETFs of between 56,000 and 85,000 ETH were instrumental in propelling the asset to new highs, as steady institutional demand created a powerful tailwind.
Figure 3. Aggregated Spot Ethereum ETF Flows. Source: Coinglass)
Over the past two weeks, however, this pace has slowed sharply to just 16,600 ETH per day in the last week of August and turned to negative 41,400 ETH per day on average over the last week, with last Friday September 5th seeing 104,100 ETH in net outflows alone, marking the second largest single day outflow for ETH ETFs since launch. ETH is down 15.2 percent from its recent ATH, which is similar to BTC, however the dependency of ETH price action on ETFs and treasury companies is relatively higher, as BTC benefits from several demand rails beyond simply ETFs and treasuries. In addition, the ETH price reflects a larger component of derivatives activity (see page 11. This implies ETH could underperform BTC, particularly if the general market recovers but ETH ETF flows do not reverse. BTC ETFs have followed a similar trajectory. After consistent inflows exceeding 3,000 BTC per day since April, momentum began to fade in July, with the 14-day average now sitting at just 540 BTC per day. The drop illustrates a clear cooling of institutional commitment at elevated price levels.