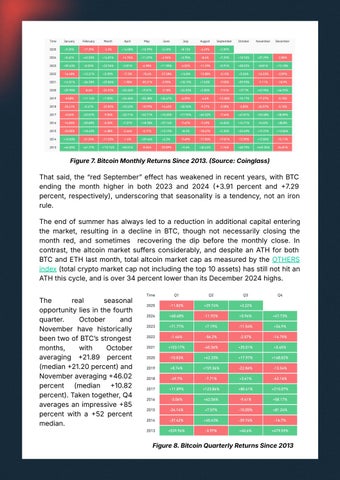
Figure 7. Bitcoin Monthly Returns Since 2013. Source: Coinglass)
That said, the “red Septemberˮ effect has weakened in recent years, with BTC ending the month higher in both 2023 and 2024 3.91 percent and 7.29 percent, respectively), underscoring that seasonality is a tendency, not an iron rule. The end of summer has always led to a reduction in additional capital entering the market, resulting in a decline in BTC, though not necessarily closing the month red, and sometimes recovering the dip before the monthly close. In contrast, the altcoin market suffers considerably, and despite an ATH for both BTC and ETH last month, total altcoin market cap as measured by the OTHERS index (total crypto market cap not including the top 10 assets) has still not hit an ATH this cycle, and is over 34 percent lower than its December 2024 highs. The real seasonal opportunity lies in the fourth quarter. October and November have historically been two of BTCʼs strongest months, with October averaging 21.89 percent (median 21.20 percent) and November averaging 46.02 percent (median 10.82 percent). Taken together, Q4 averages an impressive 85 percent with a 52 percent median. Figure 8. Bitcoin Quarterly Returns Since 2013