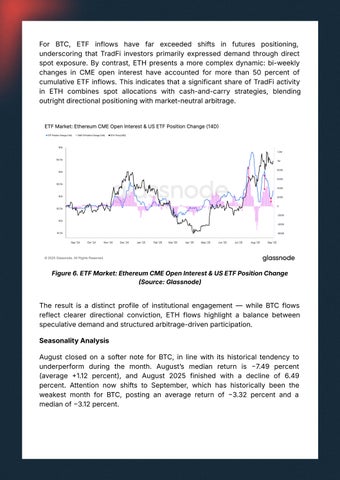
For BTC, ETF inflows have far exceeded shifts in futures positioning, underscoring that TradFi investors primarily expressed demand through direct spot exposure. By contrast, ETH presents a more complex dynamic: bi-weekly changes in CME open interest have accounted for more than 50 percent of cumulative ETF inflows. This indicates that a significant share of TradFi activity in ETH combines spot allocations with cash-and-carry strategies, blending outright directional positioning with market-neutral arbitrage.
Figure 6. ETF Market: Ethereum CME Open Interest & US ETF Position Change Source: Glassnode)
The result is a distinct profile of institutional engagement — while BTC flows reflect clearer directional conviction, ETH flows highlight a balance between speculative demand and structured arbitrage-driven participation. Seasonality Analysis August closed on a softer note for BTC, in line with its historical tendency to underperform during the month. Augustʼs median return is 7.49 percent (average 1.12 percent), and August 2025 finished with a decline of 6.49 percent. Attention now shifts to September, which has historically been the weakest month for BTC, posting an average return of 3.32 percent and a median of 3.12 percent.