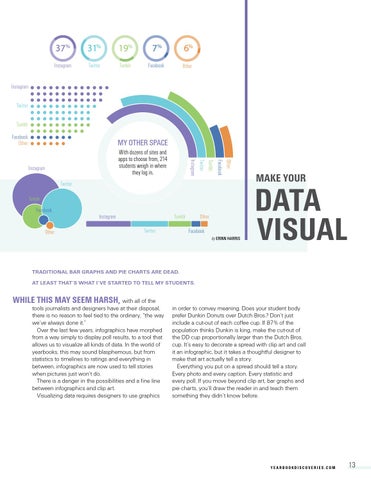
37%
31%
19%
7%
6%
Tumblr
Other
Instagram Twitter Tumblr Facebook Other
MY OTHER SPACE Other
Tumblr
With dozens of sites and apps to choose from, 214 students weigh in where they log in. Twitter
Tumblr Facebook
Other
Tumblr Twitter
Other Facebook by ERINN HARRIS
MAKE YOUR
DATA VISUAL
TRADITIONAL BAR GRAPHS AND PIE CHARTS ARE DEAD. AT LEAST THAT´S WHAT I´VE STARTED TO TELL MY STUDENTS.
WHILE THIS MAY SEEM HARSH, with all of the
tools journalists and designers have at their disposal, there is no reason to feel tied to the ordinary, “the way we’ve always done it.” Over the last few years, infographics have morphed from a way simply to display poll results, to a tool that allows us to visualize all kinds of data. In the world of yearbooks, this may sound blasphemous, but from statistics to timelines to ratings and everything in between, infographics are now used to tell stories when pictures just won’t do. There is a danger in the possibilities and a fine line between infographics and clip art. Visualizing data requires designers to use graphics
in order to convey meaning. Does your student body prefer Dunkin Donuts over Dutch Bros.? Don’t just include a cut-out of each coffee cup. If 87% of the population thinks Dunkin is king, make the cut-out of the DD cup proportionally larger than the Dutch Bros. cup. It’s easy to decorate a spread with clip art and call it an infographic, but it takes a thoughtful designer to make that art actually tell a story. Everything you put on a spread should tell a story. Every photo and every caption. Every statistic and every poll. If you move beyond clip art, bar graphs and pie charts, you’ll draw the reader in and teach them something they didn’t know before.
YE ARBOOKDISCOVERIES.COM
13