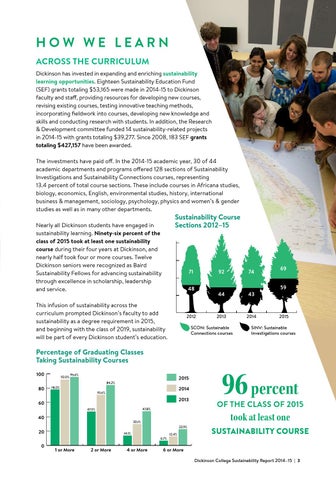
HOW WE LEARN ACROSS THE CURRICULUM Dickinson has invested in expanding and enriching sustainability learning opportunities. Eighteen Sustainability Education Fund (SEF) grants totaling $53,165 were made in 2014-15 to Dickinson faculty and staff, providing resources for developing new courses, revising existing courses, testing innovative teaching methods, incorporating fieldwork into courses, developing new knowledge and skills and conducting research with students. In addition, the Research & Development committee funded 14 sustainability-related projects in 2014-15 with grants totaling $39,277. Since 2008, 183 SEF grants totaling $427,157 have been awarded. The investments have paid off. In the 2014-15 academic year, 30 of 44 academic departments and programs offered 128 sections of Sustainability Investigations and Sustainability Connections courses, representing 13.4 percent of total course sections. These include courses in Africana studies, biology, economics, English, environmental studies, history, international business & management, sociology, psychology, physics and women’s & gender studies as well as in many other departments. Nearly all Dickinson students have engaged in sustainability learning. Ninety-six percent of the class of 2015 took at least one sustainability course during their four years at Dickinson, and nearly half took four or more courses. Twelve Dickinson seniors were recognized as Baird Sustainability Fellows for advancing sustainability through excellence in scholarship, leadership and service.
150
Sustainability Course Sections 2012–15
SCON SINV
120
90
71
60
48 30
This infusion of sustainability across the curriculum prompted Dickinson’s faculty to add sustainability as a degree requirement in 2015, and beginning with the class of 2019, sustainability will be part of every Dickinson student’s education.
0
2012
92
74
44
43
2013
2014
SCON: Sustainable Connections courses
69 59
2015
SINV: Sustainable Investigations courses
Percentage of Graduating Classes Taking Sustainability Courses 100
92.0%
95.6%
2015
84.2%
80
78.0%
2014
70.6%
2013
60 47.8%
47.5%
40
22.9% 14.1% 6.7%
0
1 or More
2 or More
4 or More
OF THE CLASS OF 2015
took at least one
30.1%
20
96 percent
12.4%
SUSTAINABILITY COURSE
6 or More Dickinson College Sustainability Report 2014–15 | 3