1 minute read
NORMAN CENTER FOR URBAN FARMING SITE ANALYSIS


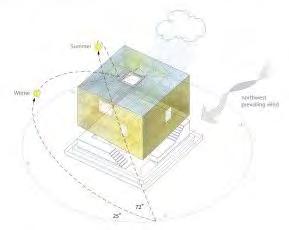
CLIMATE DIAGRAM: A building must be a certain rigidity because it will be facing with ever changing weather depending on the location it is placed. Weather is such a dynamic element to display, but I believe this diagram shows climate very well. The sun can be show in the arched dotted line that continues around in di erent path or positions. This diagram also includes the wind, which can be show with an arrow showing the direction in which it is prevailing.
Advertisement
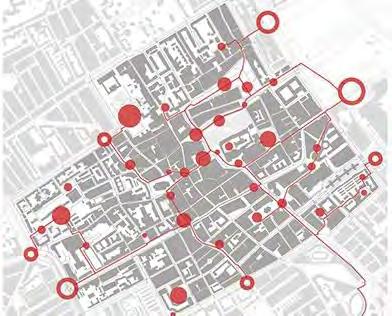
SENSORY DIAGRAM: Our senses can be perceived di erently depending on the space that we are in. One sense that always present is noise. This diagram displays the concentration of noise and the way that it can be altered throughout a site. Looking at the diagram it seems to show the primary sound in large, thick red lines. The secondary or smaller noise can be show in the thin lines forming circles. All these lines take the shape of the site and display the way sounds travels e ciently.

HUMAN AND CULTURAL DIAGRAM: A building is dictated by the amount of people that it will be occupied by. I chose this human population density diagram to show that site can be connected even if they are far away. The diagram illustrates paths, which then further connect groups of people from a distance. I imagine this diagram displaying a higher concentration of people with larger red circles and lower concentrations with smaller, possibly unfilled, circles.