Prepare Your Farmers for 2026 Now!
Presented by
Joe Jennings, CEO & Founder, Daitaas & Tilley
James Brown, President, Tilley
Lucas Wilds, Cole & Short Agency
October 6, 2025


Presented by
Joe Jennings, CEO & Founder, Daitaas & Tilley
James Brown, President, Tilley
Lucas Wilds, Cole & Short Agency
October 6, 2025


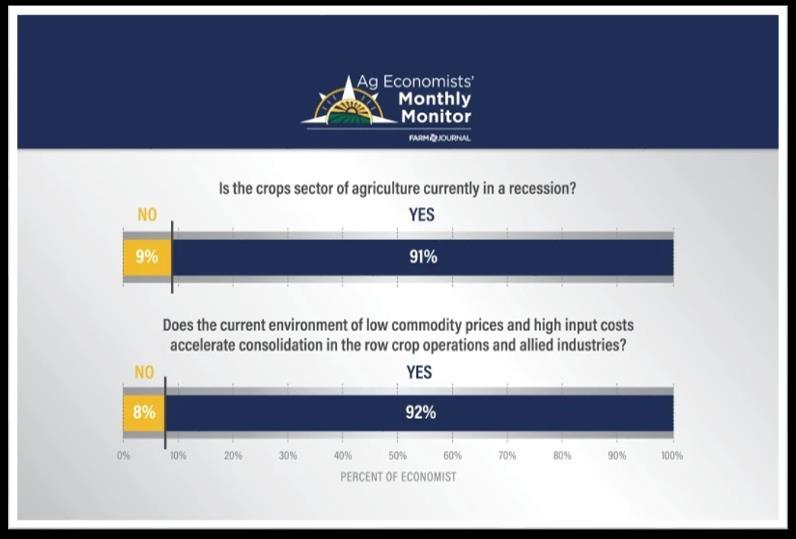
September: Ag Economists’ Monthly Monitor


2025 disaster relief payments will provide temporary relief
With ARC/PLC collateral needs lower than feared: ~$200 vs $1,000 per acre
ECO/SCO + underlying ARC/PLC = protection for next season

Occurs when:
in a certain range such that it causes 2-3 of these programs to trigger simultaneously
Understanding
Are a Must!
1 st) Understand break evens
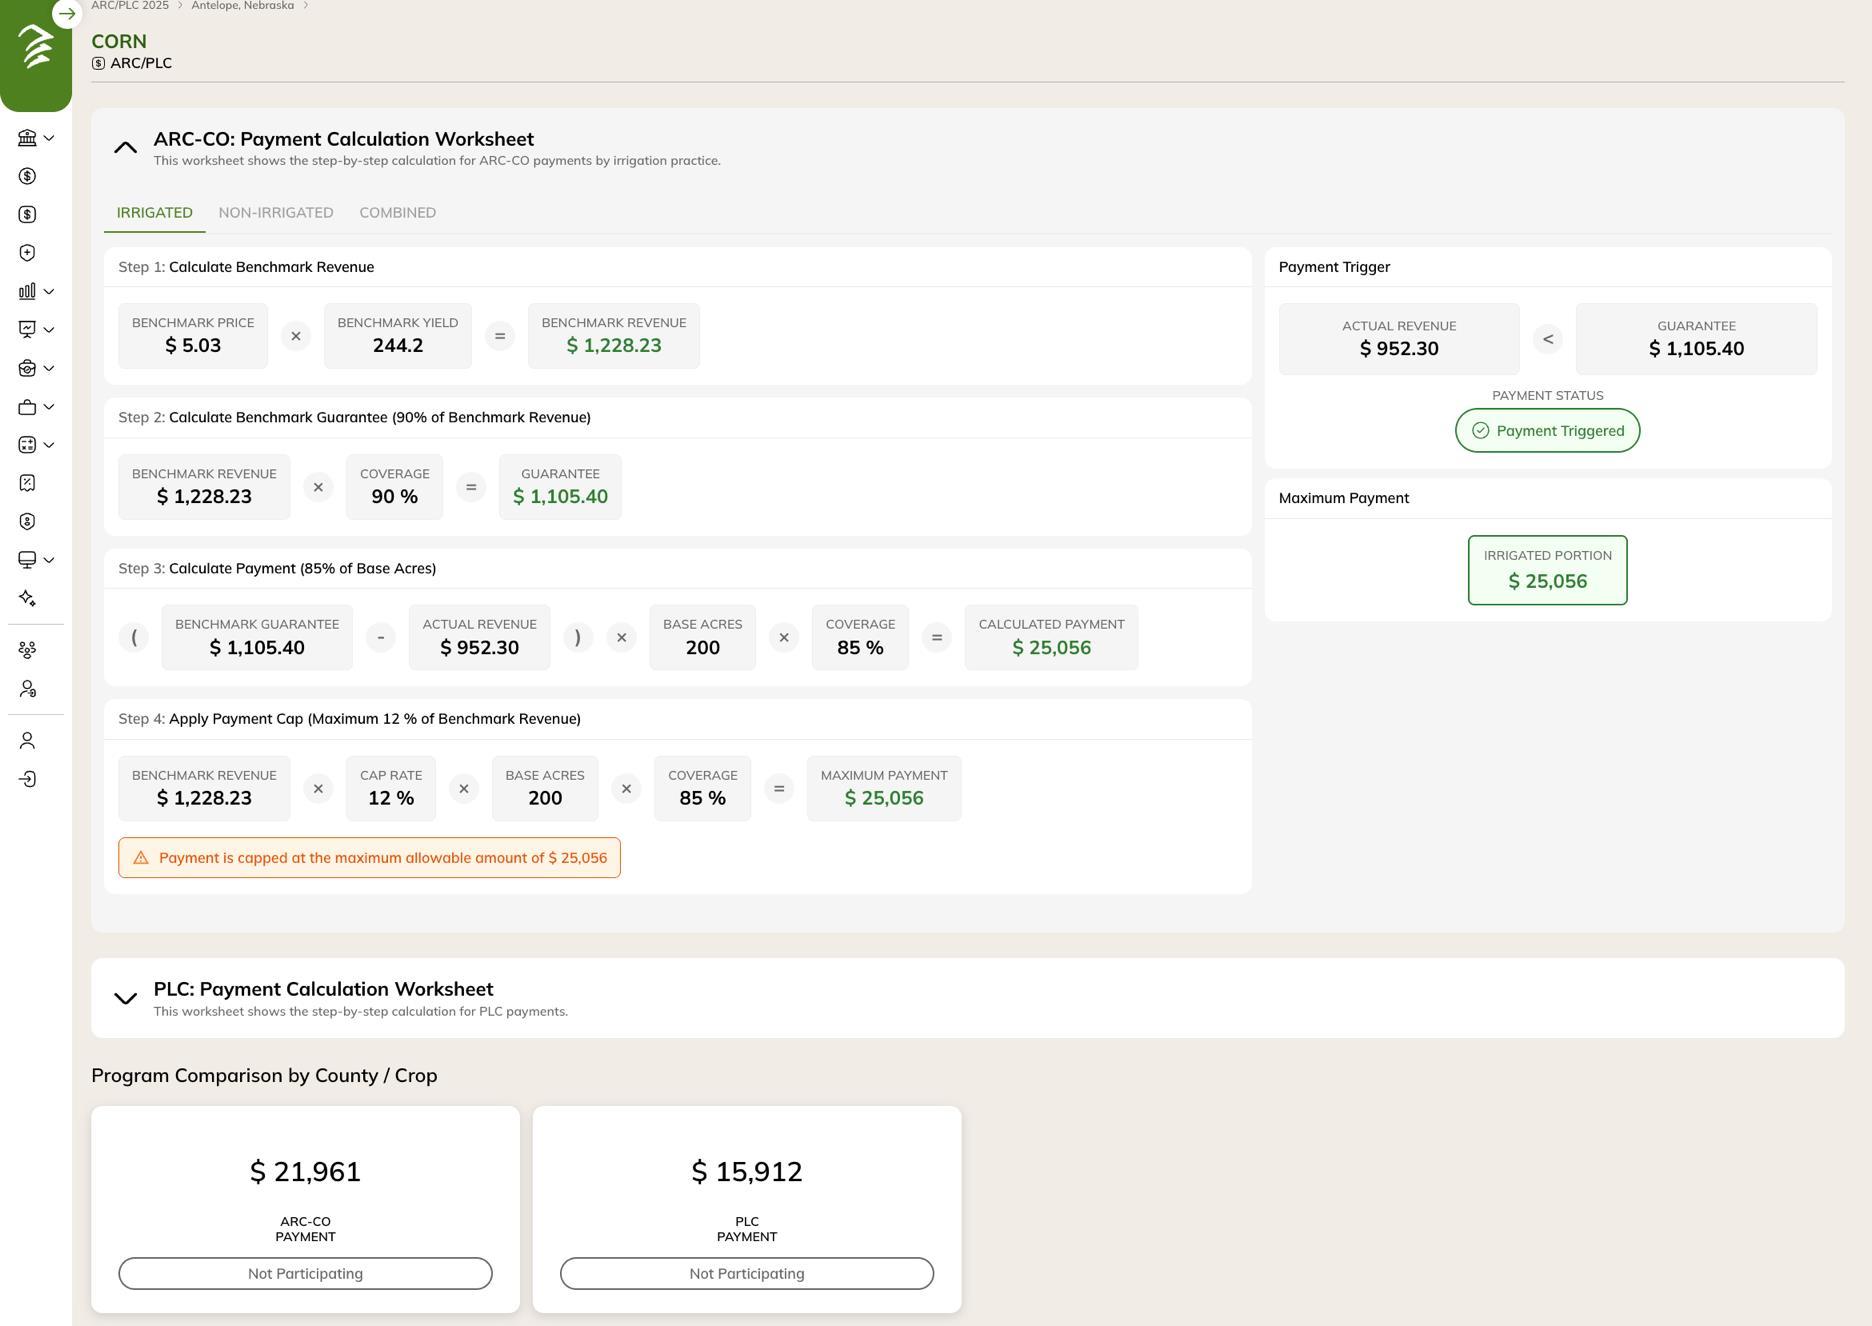
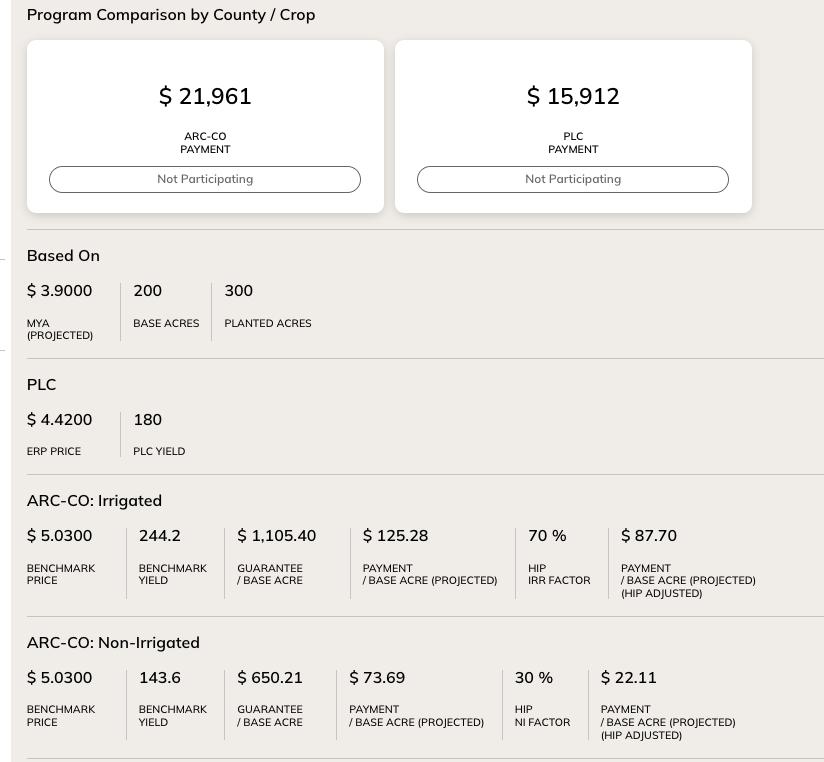
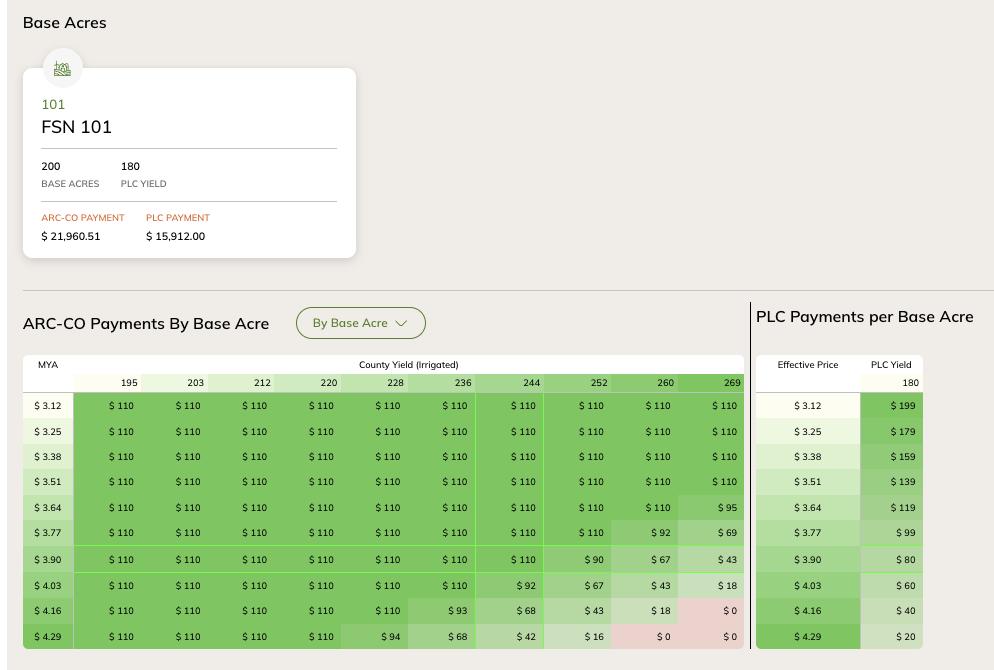
2nd) FSA Programs (ARC /PLC)
• Stakes of getting wrong are higher
• Need accurate farm break evens
3rd) Area Plans (ECO/SCO)
• Can take ARC-CO and SCO together
• Key driver of overlapping coverage
• 1st decision to make (independent)
4th) Underlying Coverage (MPCI)
• Subsidies increased from 65% to 80%
• SCO coverage level increasing from 86% to 90% for '27
• Minimal: Subsidies increased 3 to 5%
• Will results in increased overlapping coverage
• Will be easiest products to sell in '26 and no brainer (especially ECO) for growers in many situations
Note: See RMA and FSA websites for comprehensive summary of changes.
• Biggest lever determining degree of overlapping coverage
• Focus for optimization. Likely lower levels given ECO and SCO


This RP 80% example shows the potential for overlapping coverage when a farm’s APH is higher than their county’s average yields
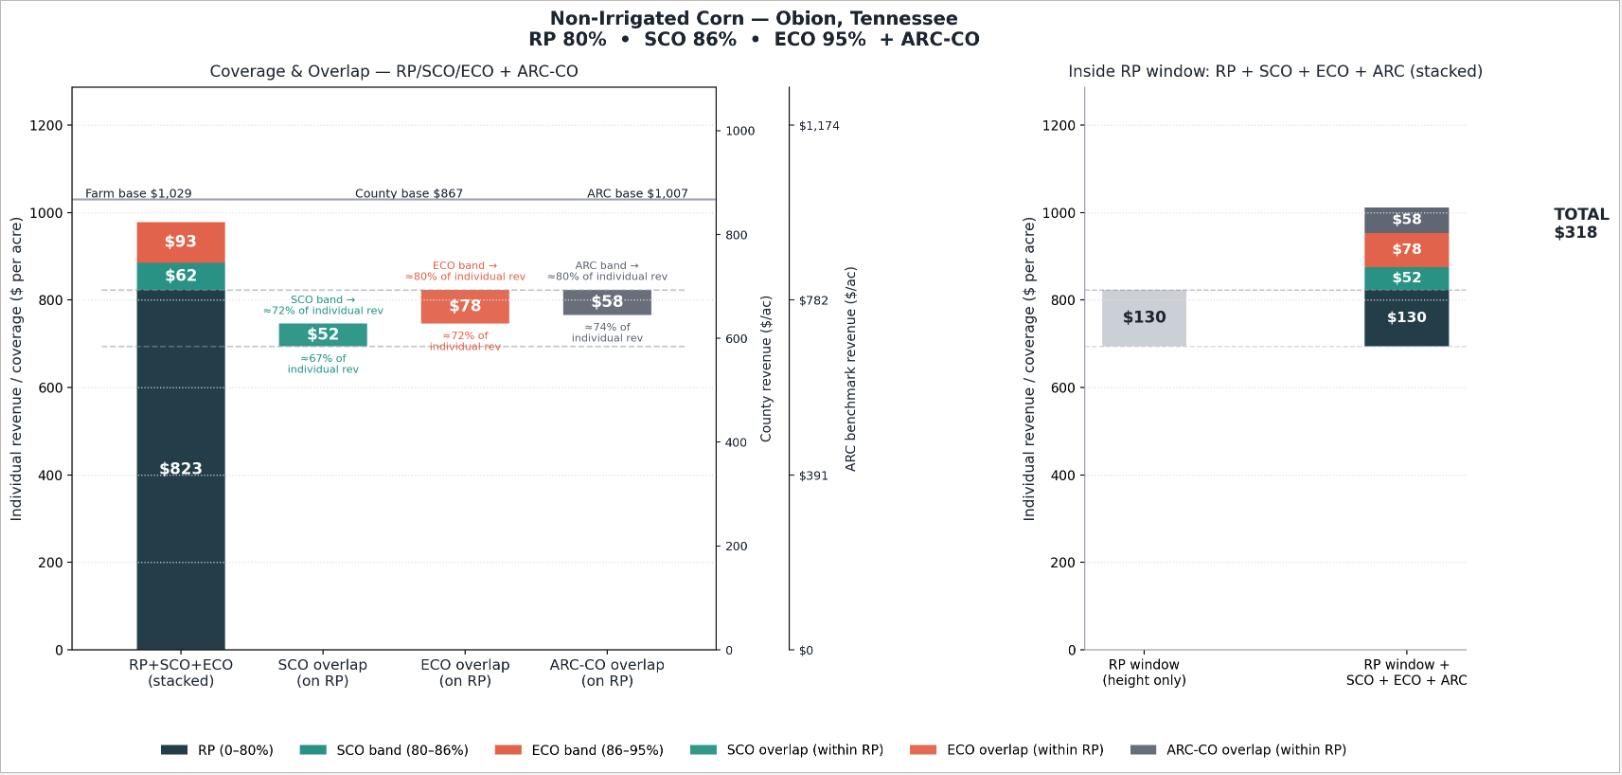
Thischartshowsacoveragebandbetween$689 and$823 peracre,where overlappingSCO,ECO,andARC-COprograms increase protectionfrom$130toapotentialof$318peracre.Note:Actualresultsdependonhowthe farm’s APHcomparestothe county‘s average yield(inthisexample:APH= 215,Countyyield= 185,ARCbenchmarkyield=183).
This RP 75% example shows how the potential for overlapping coverage starts to decline as the level of underlying coverage declines

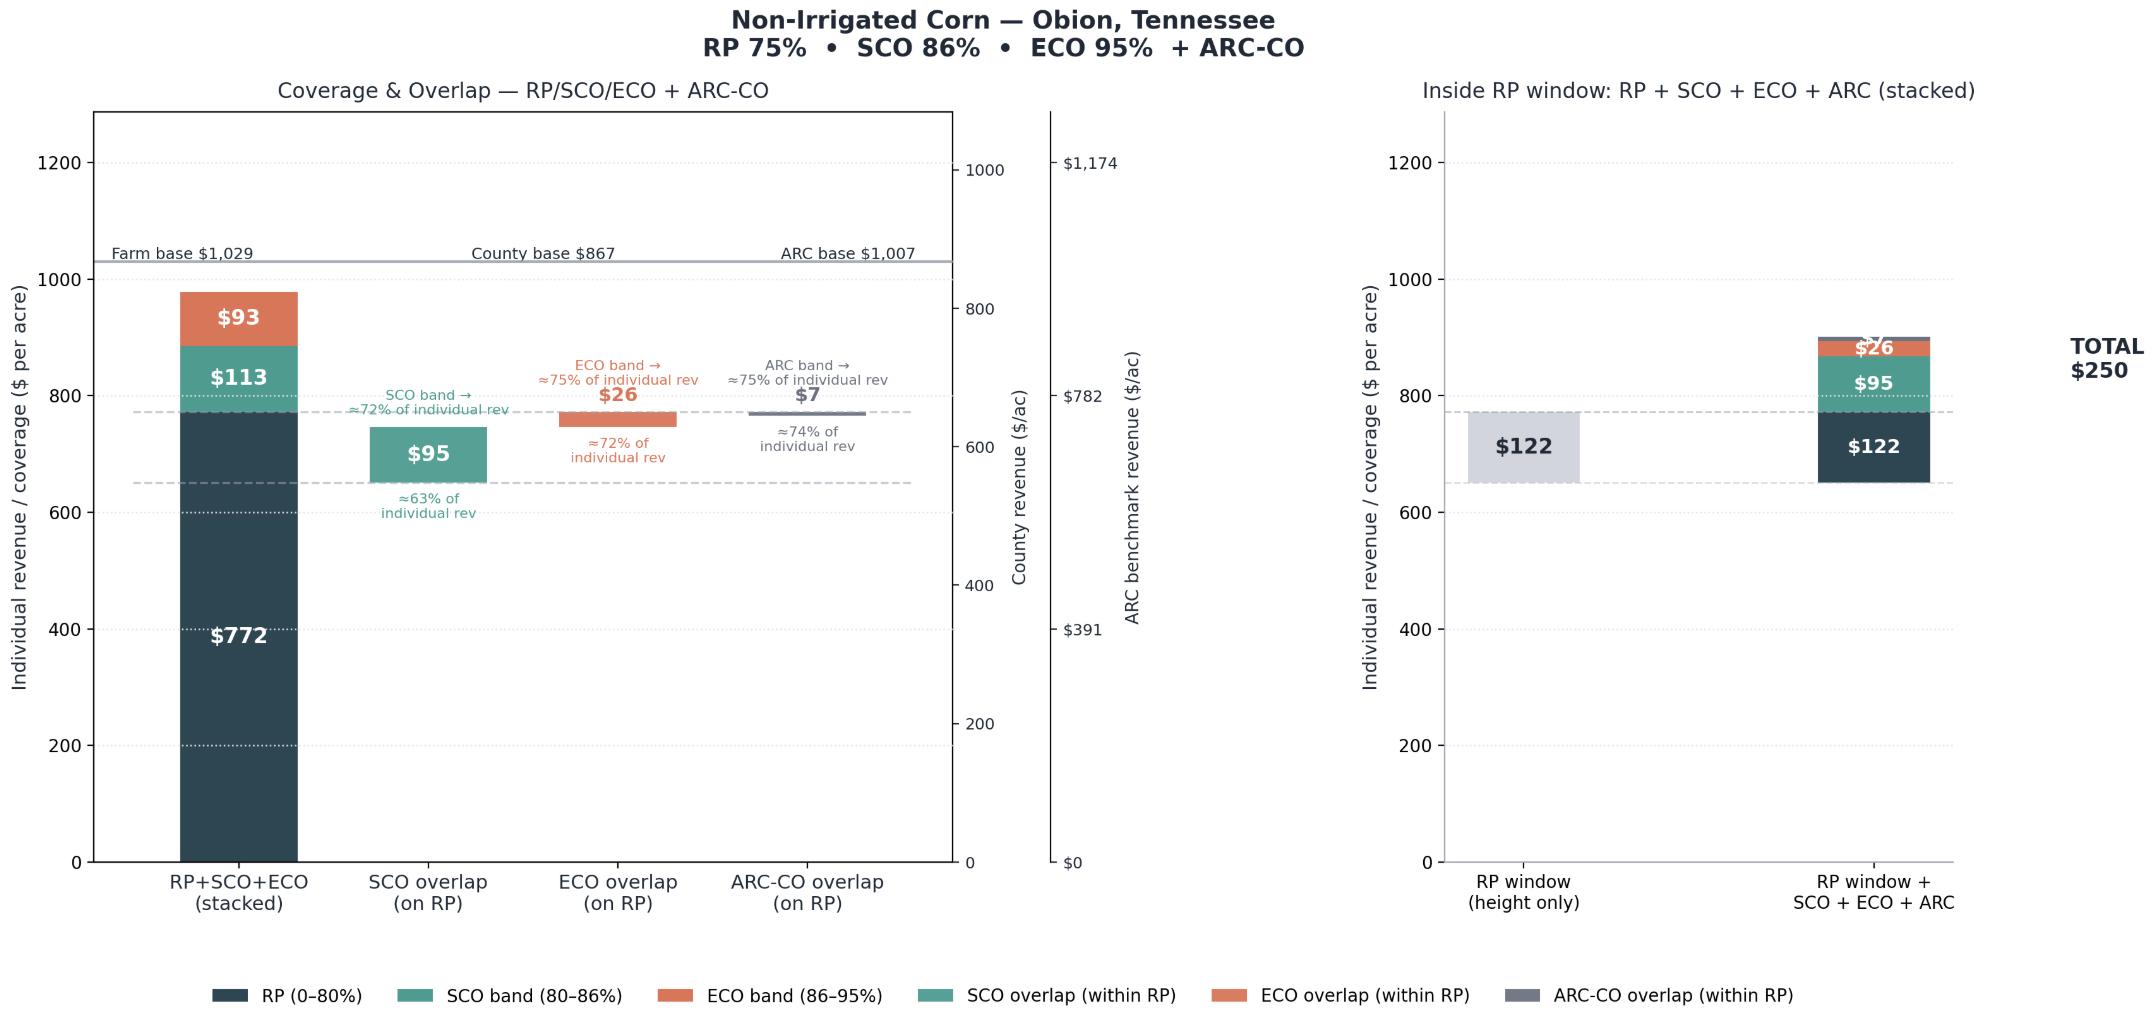
Thischartshowsacoveragebandbetween$648 and$772 peracre,where overlappingSCO,ECO,andARC-COprograms increase protectionfrom$122underRP75%to$250 peracre.Note:theexactgaindependsonhowthe farm’sAPHcomparestothe county's average yield(inthisexample,APH= 215,Countyyield= 185,andARCbenchmark yield= 183).
This RP 70 % example shows that the opportunity for overlapping coverage decreases as the underlying MPCI coverage declines, but still exists

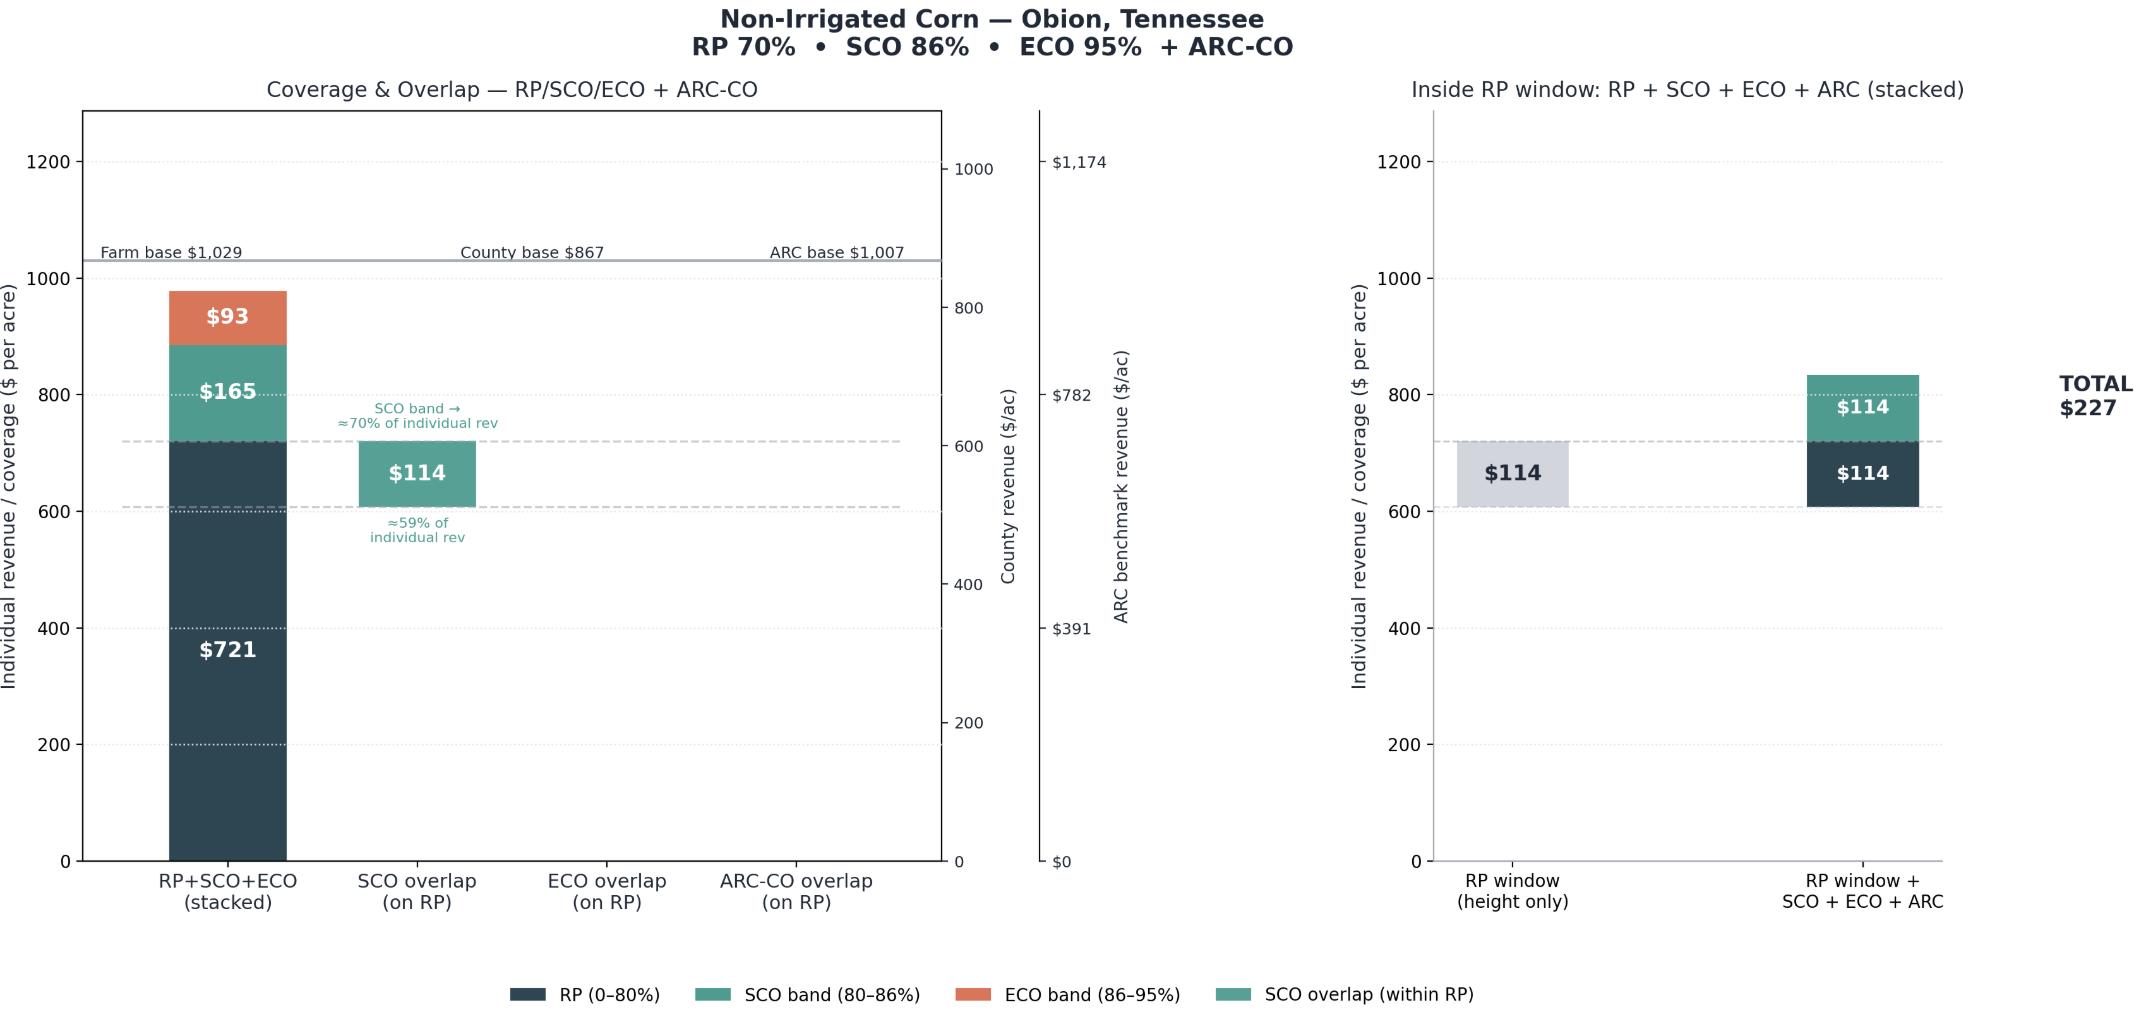
Thischartshowsacoveragebandbetween$607 and$720 peracre,where overlappingSCOcoverageincreasesprotectionfrom $114underRP 70% to$227per acre.Theexactgaindependsonhowthefarm’sAPHcomparestothecounty‘s averageyield(in thisexample,APH=215,Countyyield=185,andARCbenchmark= 183).
Start Preparing Your Growers for '26 Now!
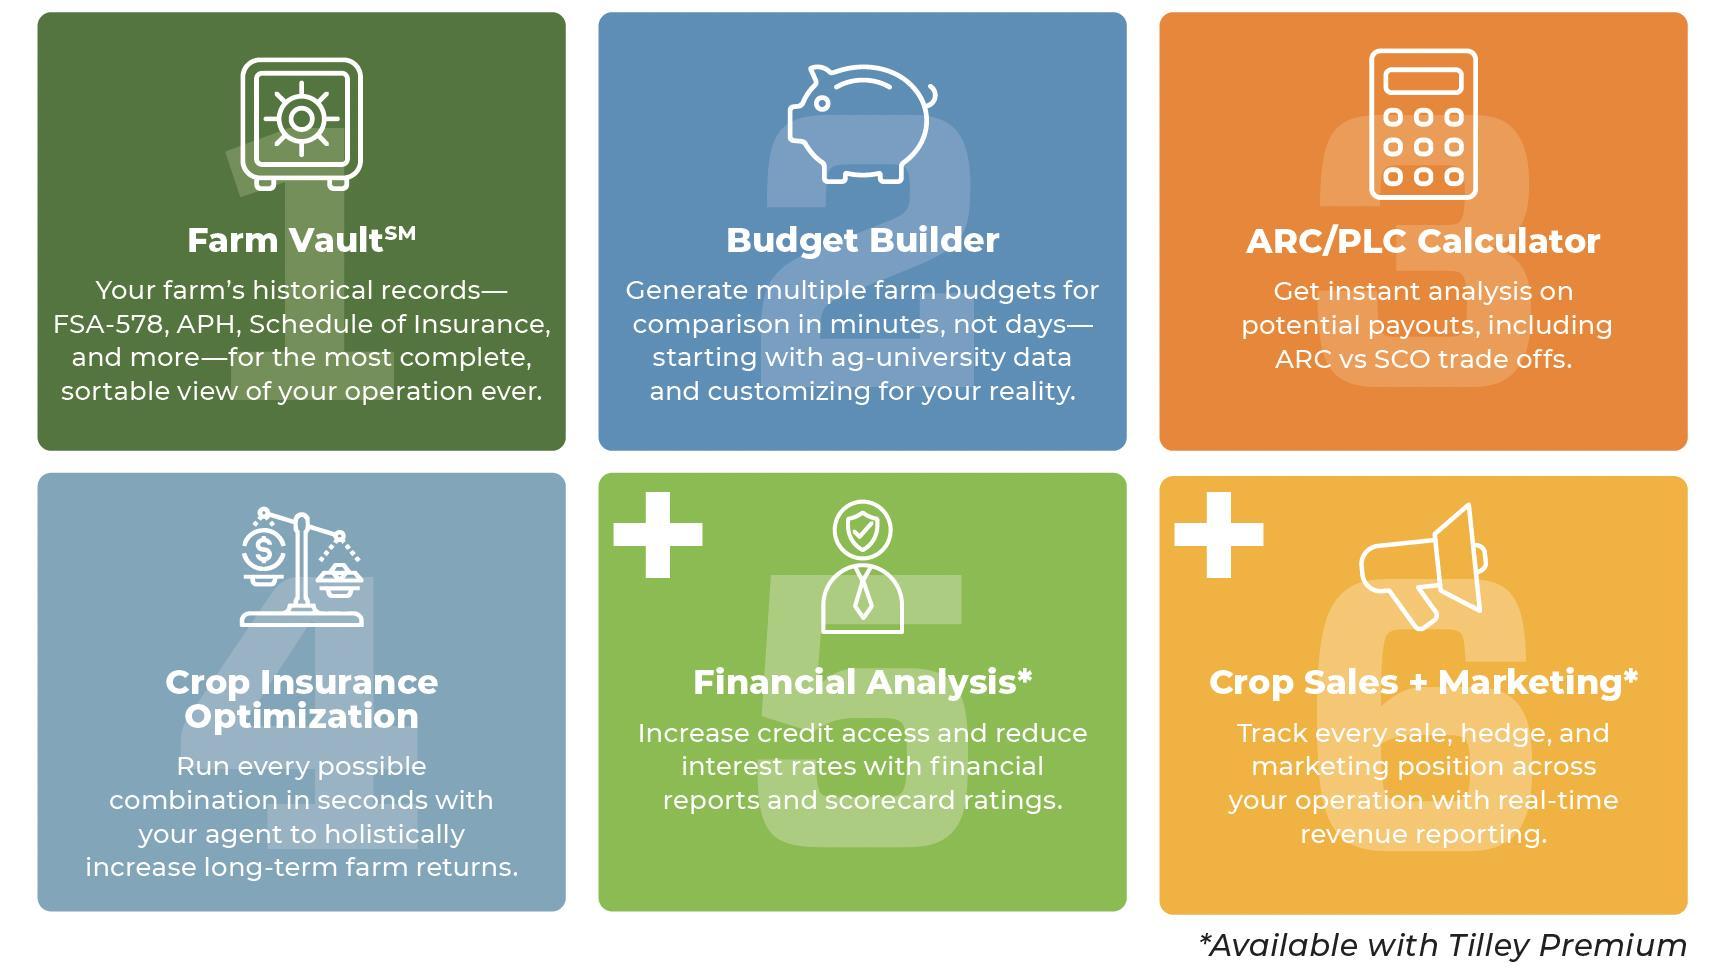
Follow Tilley’s Six Steps:
Steps 1 to 4
Required to design optimal risk management plan
• Data organization
• Budgets (i.e., break-evens)
• ARC/PLC
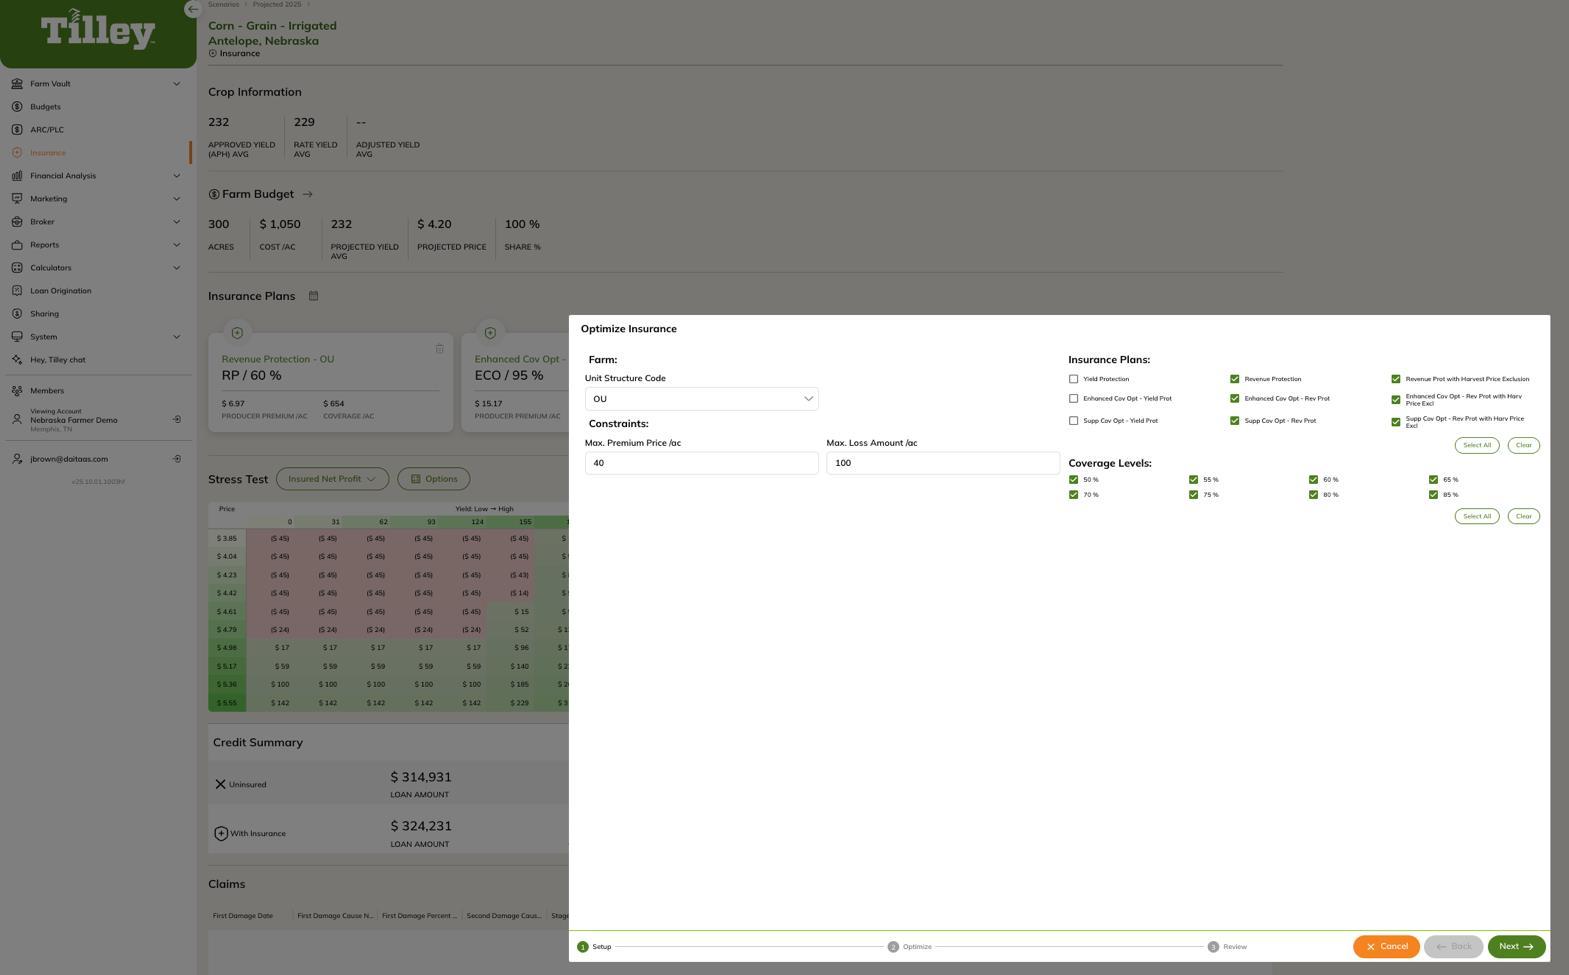
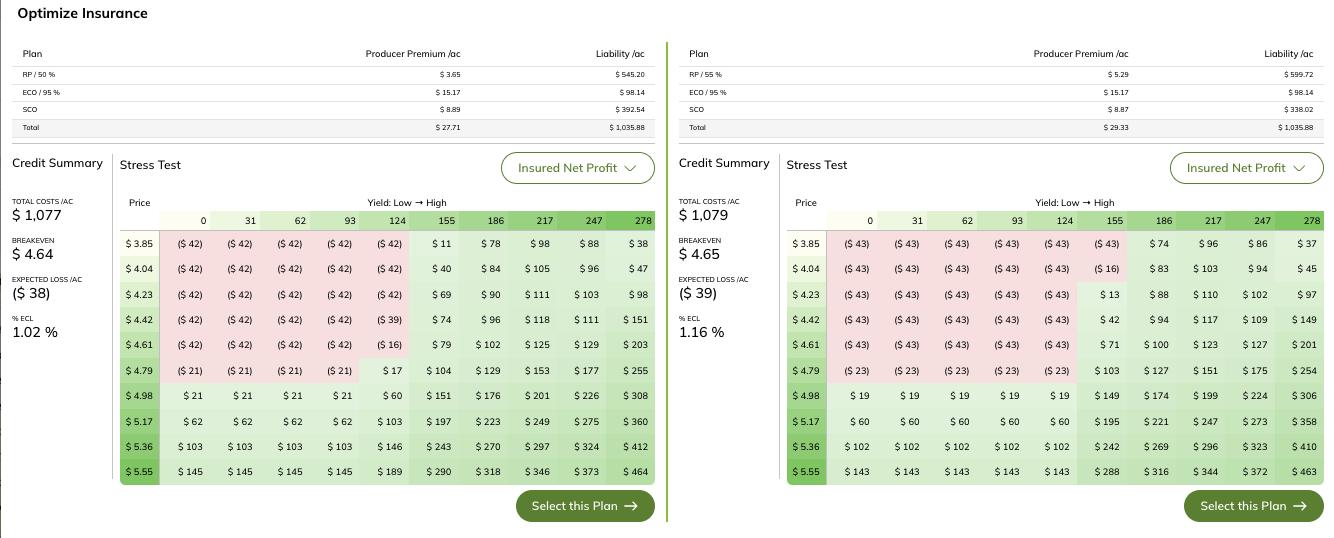
• Insurance optimization
Make A Plan:
Steps 5 to 6
Shows your support of your grower’s ecosystem
• Financing
• Grain marketing
1. Prepare to explain how overlapping MPCI, ECO/SCO, and ARC/PLC coverages affect cash flow.
2. Create a process to communicate results and impact on cashflow to growers, lenders, and grain marketing advisors.
3. Run one example of overlapping coverage by 12/1.


Data must be loaded by 12/1/2025 to qualify. Limit to 1 per agency.
Thank you!