
CSCE 2021 Annual Conference Whistler, British Columbia May 25th – 28th, 2022


WATER MODEL DEVELOPMENT FOR FREEZE PROTECTED WATER SYSTEM IN IQALUIT, NUNAVUT
Fanjoy, Marilyn2, Johnson, Ken1,5, Lafleur, Marc3, Bell, Eric2, and Doiron, Simon4
1 EXP Services Inc, Edmonton, Alberta, Canada
2 EXP Services Inc, Fredericton, New Brunswick, Canada
3 EXP Services Inc, Ottawa, Ontario, Canada
4 City of Iqaluit, Nunavut, Canada
5 ken.johnson@exp.com cryofront@gmail.com
Abstract: Water for the City of Iqaluit, the capital city of the Canadian territory of Nunavut, is supplied from a nearby lake which feeds by gravity to a water treatment plant. Treated water is stored in a 2-cell reservoir prior to distribution into seven independent water districts through an insulated and buried piping network. The water districts are unique because, in addition to insulated piping, each district has an independent recirculating water supply and water reheat system to provide freeze protection. This makes the hydraulic configurations of each district more complicated than a water system in warmer climates. Two of the districts are pressurized with independent booster pumphouses and the remaining five districts are supplied by gravity from the reservoir. The City is advancing a project to develop a water model of its water distribution network which will provide a detailed understanding of the current system operations, and provide a tool for system troubleshooting as well as planning for system upgrades and expansions. Model results will also be utilized for thermal analysis of the water districts. This will provide opportunities for optimization of the heat addition to the water supply to be explored which may provide some significant cost savings on the energy used to reheat the recirculating water. The first phase of the project has been completed with the objective of developing a working water model using all the system data based upon records of construction and operational data available for each of the seven water districts. This stage of the work has identified system deficiencies for maintenance and repairs. Phase 2 of the project will complete hydrant flow tests throughout the distribution system required to calibrate the water model.
1 INTRODUCTION
The City of Iqaluit engaged EXP Services Inc. (EXP) to develop a water model of the City’s water distribution network to gain an understanding of the current system operations, and provide a tool for system troubleshooting, system expansion planning, system upgrade planning, as well as for the design of expansions and upgrades. The water model will ultimately become an essential tool for a wide variety of planning and operational water distribution improvements.
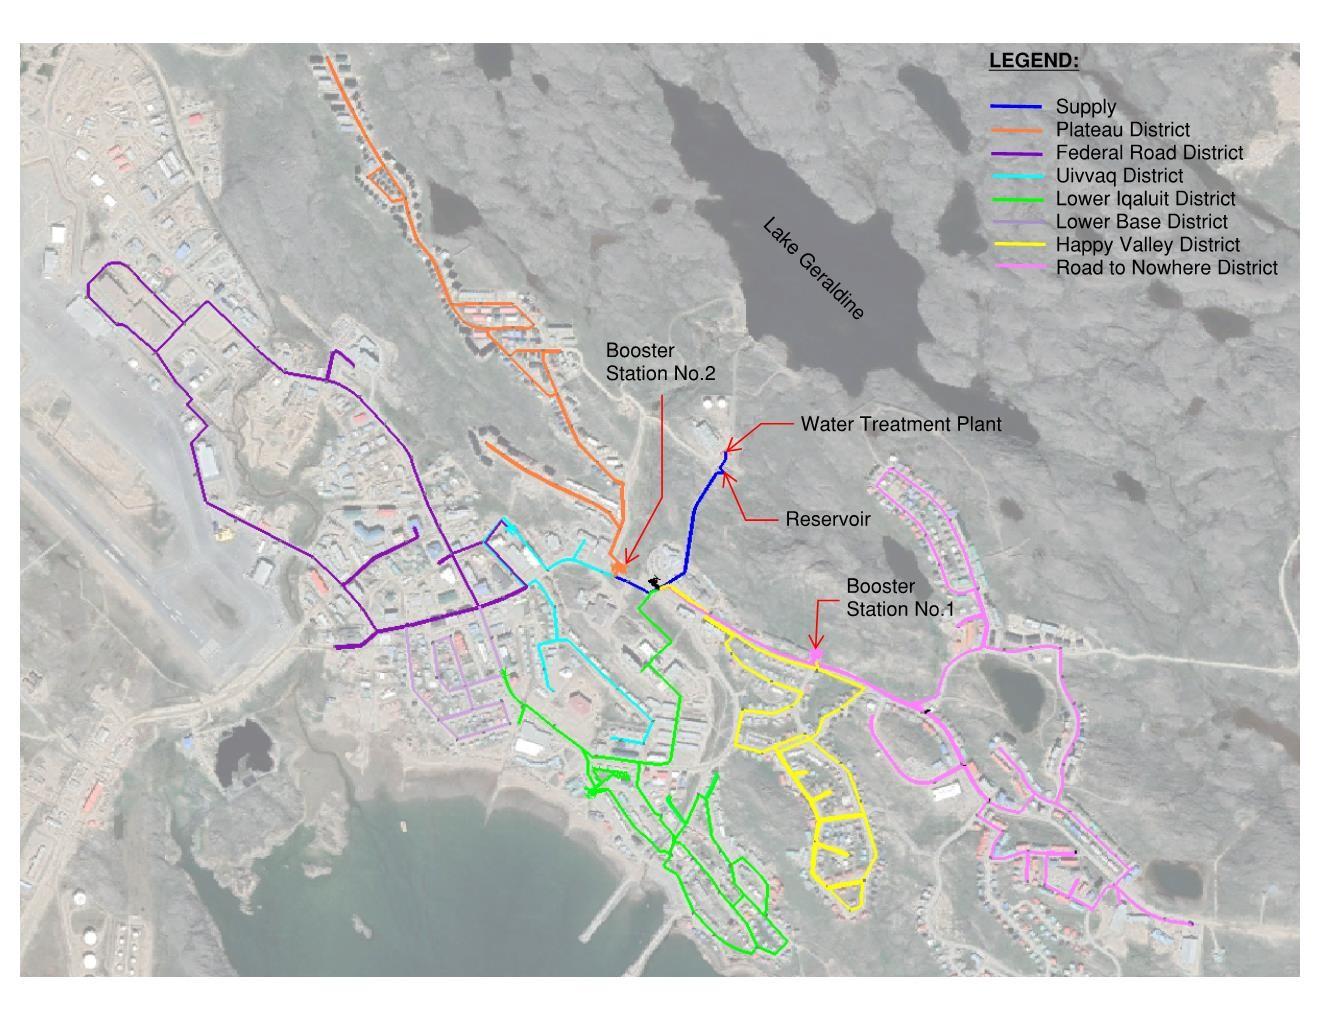
Water for the City is supplied from Lake Geraldine to the Water Treatment Plant and stored in a nearby reservoir prior to being distributed into seven service loops or districts. Two districts are pressurized via separate booster stations. The remaining five districts are supplied by gravity from the reservoir. The
reservoir consists of two equal-size tanks with a combined capacity of 4.1 million litres. An overview of the water distribution system is provided in Figure 1.
Figure 1: City of Iqaluit Water Distribution System Overview
The objective of the project was to collect all the system data necessary to develop a fully calibrated hydraulic and thermal model of Iqaluit’s water system. At this point in the project a working model has been developed and the field-testing program is ongoing. Results from field tests along with current system operations details will be utilized for model calibration in the next phase of the project. The calibrated model will then be utilized for the identification and prioritization of recommended improvements to the Iqaluit water system as well as plan for system upgrades and future expansion potential. Other potential uses for the water model include determination of system wide operating pressures and flowrates, calculation of available fire flows, trouble shooting water system issues, water age analysis, flushing program development and contaminant tracing.
2 METHODOLOGY
The first task undertaken was to gather and review all background information provided by the City including reports, guidelines, codes, regulations, maps, drawings, planning documents, flow tests and available measured data. Of particular interest in the background information was the data being recorded by the City SCADA system, which provides real time information on the water system operation. A gap analysis was then carried out to identify missing information required for development of the water model and communicated to all parties involved in the project.
2.1 Water model Development
The water model was created in the AutoCAD version of Bentley WaterGEMS software using drawings of the water distribution system provided by the City for the physical layout. Additional physical attributes such as pipe material, diameter, valve status, pump curves and operational parameters were then included in the model from additional background information and record drawings.
2.1.1 Physical Attributes
The pipe lengths throughout the water model were determined by scale from the 2019 Overall Utility Atlas drawing except for buildings such as the booster stations and reheat buildings. Record drawings were used at building locations to determine the piping layout, length, diameter, material and installation date. Physical attributes such as pipe diameter, material, and installation date were acquired using the Iqaluit Water Distribution Network schematics for each district This information also provided the locations of valves as well as the intended operational status (i.e. open or closed).
Elevations in the model throughout the distribution system were determined using a combination of extracted elevations from the contour mapping in the model as well as record drawings for water and sewer construction.
Hazen Williams coefficients for calculating head loss through each pipe section were initially assigned according to standard published values for various pipe materials from the Material Library provided in the software. These values represent new pipe conditions which reduce over time from the date of installation due to potential corrosion, tuberculation, biofilm, and scaling inside the pipe. Initial Hazen Williams head loss coefficients for the various pipe materials in the water model based on the Bentley WaterGEMS software defaults for brand new pipe are summarized in Table 1 below.
Table 1: Hazen Williams Head Loss Coefficient based on Pipe Material
Pipe Material Hazen Williams Head Loss Coefficient for Brand New Pipe (C)
Asbestos Cement 140
The Hazen Williams head loss coefficient values will be adjusted during calibration of the model to account for variations in nominal versus actual inside pipe diameter, fittings and pipe age based on comparisons of model predicted to collected field data. The unique service connections required in Iqaluit to provide freezing protection (i.e. two connections to the main and a recirculation pump) will increase the head loss throughout the system more than for similar systems in warmer climates. Therefore, lower Hazen Williams coefficients are expected for pipe materials in the Iqaluit system than for published estimates for pipes with similar age in southern geographic locations.
In addition, nominal pipe diameters are used throughout the water model as opposed to the actual inside diameter and minor losses attributed to fittings and valves are not explicitly defined. Common water modeling practice allows for adjustments to the Hazen Williams coefficients to account for the head loss attributed to these parameters as it dramatically reduces the level of effort required to define them throughout the entire hydraulic model.
2.1.2 Operational Parameters
Operational parameters for the system such as pump curves, operating tank levels and operating setpoints were acquired through a variety of sources as follows:
1. 2004 Process Operation and Maintenance Manual for the Iqaluit Water Treatment Plant with 2018 Updates,
2. Record drawings for Boosters Stations No. 1 and 2, water treatment plant and reservoir,
3. Shop drawings for Booster Stations No. 1 and 2 pumps and control valves,
4. Site inspections from previous work in Iqaluit,
5. Discussions with system operators, and
6. SCADA data collection obtained in cooperation with the City’s SCADA consultant.
2.1.3 Water Demand
The allocation of user demands throughout the distribution system was based on the 2020 City of Iqaluit’s Estimated Sanitary Flow data spreadsheet prepared by EXP. The information from this flow data is considered a conservative assumption for domestic demand rates. The sanitary sheet also details the location throughout the network in which demands are imposed on the system. An overall assumption is that the average water supply throughout the City is approximately equal to the sanitary flow collected. This approximation was used as metered data for users is not readily available for a consistent time period. The sanitary flow also includes fixed flows at constant bleed locations in the system which encourage flow to prevent freezing of the watermain or sewer system. Bleed locations were provided by the City and included within the system demands. The total estimated daily average flows based on the sanitary data is 5.25 ML/day (1,916,250 m³/year).
Water demands in the model are based on average user consumption. In reality, water usage varies over time and generally follows a repeating 24-hour cycle referred to as a diurnal demand pattern. Each municipality often has its own unique pattern based on time of day, climate, user types and usage patterns. The diurnal pattern is useful in the water model for identifying peak times of usage and fluctuations in flows and pressures throughout the system over time.
SCADA data of the flows being discharged from the reservoir on June 11, 2021 were used to develop the diurnal pattern for the City of Iqaluit. The date was selected as a recent typical weekday without any large non-typical user demands such as flow testing or known system breaks. The discharge flow recorded in the SCADA system at 2-minute intervals was compared to the average discharge flow for that day to develop multipliers for the pattern. These usage trends were applied to all the user demands in the water model except for known fixed demands at bleed locations. The total measured average flow was 3.54 ML/day (extrapolated to 1,292,100 m³/year) on June 11, 2021.
Historical data for raw water consumption for the City of Iqaluit indicates that the water usage measured on June 11, 2021 is likely more representative than the assumed values from the 2020 sanitary flow data which was expected to be conservative. Therefore, the user demands in the water model developed from sewer flows were adjusted by a factor of 67.0% (1,292,100 m³/year / 1,916,250 m³/year) for 2021.
The City provided a list of structures within the network which are imposing a water bleed to prevent system freezing. Water recirculation and heating are the preferred means of freeze protection; however, certain systems configurations, such as piping dead ends require water bleeds to maintain constant flow through the watermain. Operational bleeds are usually coupled with a flowmeter to determine rates and quantities. The collection of operational flow rates is still in progress and for model advancement a flow rate of 0.15 L/s has been assumed at each bleed location. Flowrates will be updated in the water model as they come available.
Considerations for the impact of COVID-19 restrictions are necessary to determine the City’s true average day usage and trending for 2020 and 2021. For example, the effect of travel restrictions imposed in Nunavut have likely changed the City’s current water usage patterns. These trends shall be revisited later once a more typical average day condition is imposed.
2.1.4 Water Model Field Calibration Plan
A field execution plan was developed to gather system data for calibration of the water model via hydrant flow testing in all 7 districts of the system. The flow testing plan was adjusted in consultation with the City of Iqaluit staff as conducting fire flow testing at the desired locations was deemed unachievable due to the identification of broken or frozen hydrants which required repair. The total number of hydrant flow tests recommended for the field calibration plan was 16.
Operational data retrieved through the SCADA system was also extracted for analysis. Instrument readings from within the two booster stations, which record pressure, temperature, and flow are essential for calibration as well as troubleshooting. Upon approval from the City, and working closely with the City’s SCADA consultant, data collection activities were expanded to include EXP read-only access to the City SCADA system to assist with defining critical operational parameters needed for model calibration.
As noted above, the calibration plan relies heavily upon determining the appropriate Hazen Williams coefficient for each pipe. Although theoretical Hazen Williams Coefficient (C) value ranges are provided based on each pipe type, they don’t account for age and years in service as well as inside pipe diameter and system minor losses. Appurtenances such as valves (and disk status), bends, tees, service saddles, reducers, etc. have a considerable effect on performance especially under high flow conditions (i.e. fire flow). Therefore, the applicable C values will vary depending on the local system schematic and details. Estimates for C value ranges from calibration are based on typical published values for different pipe material, diameter, age and level of attack on the pipe which compensates for changes in internal pipe diameter. Internal pipe diameter can be affected by tuberculation, build up in the pipe or by ice formation in cold climates.
The planned calibration strategy started with the Plateau district loop to determine initial Hazen Williams coefficient values. This district was the ideal starting point because of the available instrumentation within the booster pumphouse serving the district (Booster Station 2 referred to as BS2) and the simplicity of the district piping. The use of parameters and conditions which are verified/quantified through instruments from BS2 is preferred to the alternative of relying on assumptions regarding the City’s current system operation. The details of the physical infrastructure within the Plateau network are available in relatively recent as builtgreat detail, especially when compared to all other City districts. The level of detail incorporated within the model with respect to pump curves and on/off status, elevations, pipe age, pipe size, pipe length, bends, valves, etc. drastically reduces the margin of error due to assumptions. Through SCADA, data is available from BS2 on pressure, flow and temperature for both the supply and return piping entering/exiting BS2. Therefore, quantifying the difference between output and input parameters for both flow and pressure which influence the calculation of a C value reflective for the distribution system. The C values determined for Plateau would be considered as a high-end benchmark value when comparing to other districts simply based on the pipe age and years in service. Plateau is a network entirely composed of HDPE pipe which has been in service for approximately 10 years. This will be beneficial for comparison when analyzing other water districts which have larger information gaps coupled with a lack of available instrumentation to confirm operating conditions. Relying on data from the Plateau network will enhance the accuracy of any assumptions necessary in the other districts throughout the City. The results of recent assignments in the Plateau network have confirmed the operation of various distribution system components, and it is believed that linear network is functioning as intended.
The goal for achieving an acceptable level of model calibration from field data is based on the calibration criteria recommended in Chapter 7 of Advanced Water Distribution Modeling and Management by Bentley Systems. It states that the model should predict the hydraulic grade line (HGL) to within 1.5 to 3 meters at calibration data points for a water system with pipe diameters of 600 mm and smaller during fire flow tests and to the accuracy of the elevation and pressure data during normal demands.
It also recommends the model be able to reproduce water tank fluctuations to within 1 to 2 meters for extended period scenarios (EPS) and match water treatment plant and/or pump station flows to within 10 to 20 percent. These initial targets may be difficult to achieve due to the lack of instrumentation throughout the water network. Therefore, focusing on portions of Iqaluit’s network with instruments such as the Plateau district is desired to validate the calibration results. Acceptable calibration may be achieved and the model is deemed to be a reasonable representation of the system when the cost of performing additional field tests exceeds the value of further calibration efforts.
2.2 Thermal Model Development
The thermal model was created using Microsoft Excel spreadsheets for each of the water districts in Iqaluit and flow data from the water model. Heat loss calculations used in the thermal model development incorporate methods given in Chapter 4 of the Cold Climate Utilities Manual (1996).
2.2.1 Model Structure and Input
The thermal model has a “Master” spreadsheet where inputs are imported from the water model for the entire water distribution network during the critical low flow period where the system is most vulnerable to freezing. The spreadsheets for each individual water district are automatically populated with inputs from the “Master” spreadsheet, using the Excel VLOOKUP function. The data from the water model can be simply exported from the water model and pasted into the “Master” spreadsheet within the thermal model. The input hydraulic (flow) data required for each pipe segment to model the thermals of the water system are summarized as follows:
Pipe Label
Pipe Start Node
Pipe Stop Node
Pipe Diameter
Pipe Material
Pipe Length
Flow Rate in Pipe Segment
The collection of information relating to the physical attributes of the pipes throughout the distribution network were described in the previous section on water model development.
Flow rates of the circulating pumps at the re-heat stations is vital for the development of the thermal model for each district. The recirculation rates, together with the thermal capacity of the boilers, must be capable of adding sufficient tempered water to replace the heat loss within the distribution system. Adequate hydraulic capacity is required to ensure that water returns to the re-heat station prior to cooling below 5°C. Information on the existing circulation rates and boiler capacities of the re-heat stations was provided by the City.
Another important input required for the thermal model analysis is the location and flow rate of existing bleeds within the distribution system. In certain water districts, due to phasing of development or condition of existing infrastructure, bleeds are utilized to maintain sufficient circulation during low flow periods to prevent watermains from freezing. The City intended to provide the location and flowrates of all existing bleeds for thermal analysis of the existing network condition. The locations have been provided but flow rates are still being compiled. Without this information, the thermal model will estimate the minimum bleed flow rates required to mitigate the risk of freeze.
2.2.2 Flow Scenario and Assumptions
The flow scenario used for analysis in the thermal model is the assumed lowest flow period throughout the City’s diurnal consumption pattern. Trending data indicates this occurs around 3am daily and would be the period where the greatest heat loss occurs within the distribution network. This is due to minimal water demands and low flow rates throughout the network. The lower velocities through the pipes
correspond to greater time and thus heat loss in the distribution system before the water returns to a reheat station or to a water bleed location.
Several assumptions are necessary for developing estimates on heat loss. Critical piping norms applied are:
All pipes are wrapped in 50-mm of polyurethane insulation.
The pipes are assumed to have no resistance to heat loss; only the insulation is assumed to provide any thermal resistance.
Outside pipe diameters were calculated based on schedule pipe sizes.
Service connections typically consist of 25-mm service and re-circulation lines installed inside a 100 mm insulated HDPE duct. For heat loss estimates, the two lines were treated as a single 50-mm diameter pipe, 20 m in length.
The total number of service connections was estimated using City mapping for each water district.
On an annual basis, the ground temperature below the active layer in Iqaluit marginally varies, thus in theory pipes appropriately buried, are encased in a steady state temperature within permafrost. The ambient temperature selected for heat loss calculations in Iqaluit is –10°C. The thermal conductivity (K) value of 0.024 W/m/°C was selected from the Cold Climate Utilities Manual (1996) for typical polyurethane insulation. Greater conductivity values are used to simulate insulation deterioration, based on the year of pipe installation.
2.2.3 Thermal Model Calibration Plan
The calibration plan for the thermal model was to rely on values obtained from existing instruments to validate the assumptions utilized for the unknowns within the heat loss calculations. Thermal modeling started with Plateau network and analyzed logged temperature depressions from Booster Station No.2’s (BS2) instruments. BS2 actively logs the output (supply) as well as the input (return) temperatures from the Plateau distribution network. Comparing these temperature depressions with output (supply) and input (return) flow rates enables the validation of assumptions used for heat loss calculation. Thus, with all the known details of the Plateau network the parameters assumed in the heat loss calculations would be appropriately adjusted to reflect the real time temperate readings, the thermal conductivity of polyurethane insulation (K) and ambient temperature surrounding the pipe.
As mentioned for the hydraulic analysis, Plateau is the desired benchmarking point as there are minimal gaps in information on the current distribution system parameters for thermal modelling. Therefore, thermal values determined as part of the Plateau analysis would be considered as optimum values due to the age of the materials (newer) and the construction practices applied, meaning Plateau’s distribution piping is likely the most thermally efficient distribution district. For older parts of the City’s network, it is anticipated that factors such as increased insulation deterioration over time as well as shallower burial depths increasing exposure to lower ambient temperatures would further increase the rate of heat loss throughout those districts. Thus, applying scaled assumptions derived from the Plateau district’s results for heat loss could be used for reasonably estimating heat loss in other districts which lack instrumentation.
The ultimate City-wide thermal model entirely relies on flow data from the water model. Therefore, calibration of the water model is required before the complete thermal model can be properly calibrated.
3 FINDINGS/OBSERVATIONS
It is important to understand that interpreting the results of the data gathered in the field requires considerable assumptions around the wholistic system functionality. Validation of these assumptions will enhance the accuracy of the model during the calibration stage. Confirming the operational functionality of key infrastructure such as normally closed valves, Pressure Reducing Valves (PRV), pump status, system bleeds/demands, known frozen sections, etc. is essential when calibrating the system with the data collected. For example, the cause for unanticipated flow test results could be a function of a wide variety of variables such as pump failure/inefficiency, incorrect post design system modifications, or excessive
system head loss caused by a partially closed valve. To collect additional information, the fire flow testing program was modified to include additional monitoring locations along the supply line. The City’s Public Works Department provided two resources to monitor pressure or pump operation during the flow tests of critical infrastructure for further analysis and interpretation of the flow test results.
3.1 Water Model Comparisons to SCADA Trends
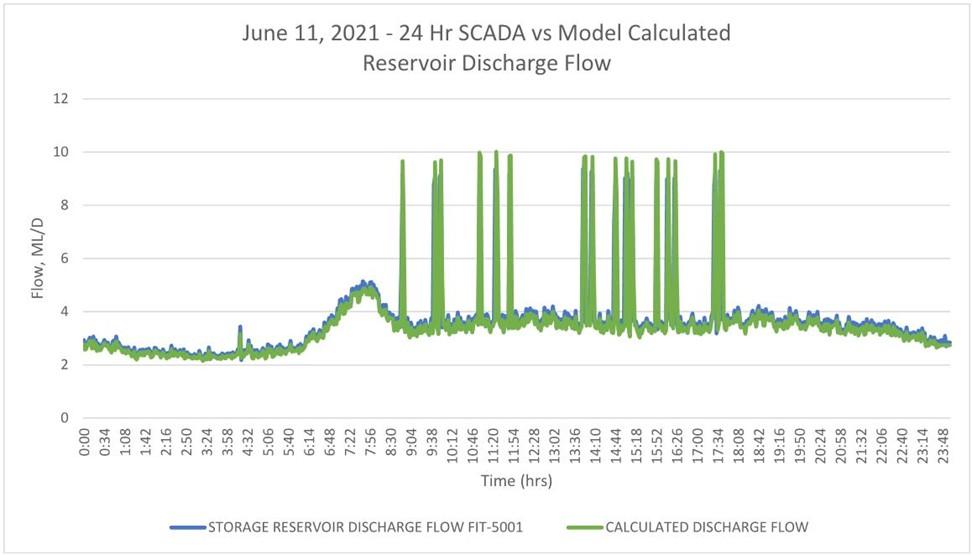
A comparison of the measured reservoir discharge flow from the SCADA system to the calculated reservoir discharge flow from the water model over a 24-hour period is shown in Figure 2. The measured flow data for the same 24-hour period that was used to develop the diurnal pattern for the model was used in the comparison to evaluate the difference in actual versus predicted flow from the reservoir. The graphical illustration in Figure 2 indicates that the discharge flow in the model is predicted to be on average 0.1 ML/day lower than measured by the SCADA on that date during low demand time from 12 AM to 6AM. A possible explanation is that all the fixed flows from bleeds have not been accounted for in the model due to inaccurate flow data for operational bleeds or that the bleed rates are operating at significantly higher flow rates than assumed. There are also 16 peaks in flow which coincide with the truck fills at Booster Station No.1. The time, duration and flowrate for the truck fill consumption pattern was derived directly from the measured SCADA data. It indicated that each truck is filled at a rate of 73.6 L/s (1,167 USgpm) for approximately 3 minutes. It should be noted the BS1 station was designed to have truck fill operations flow at a rate of approximately 25 L/s.
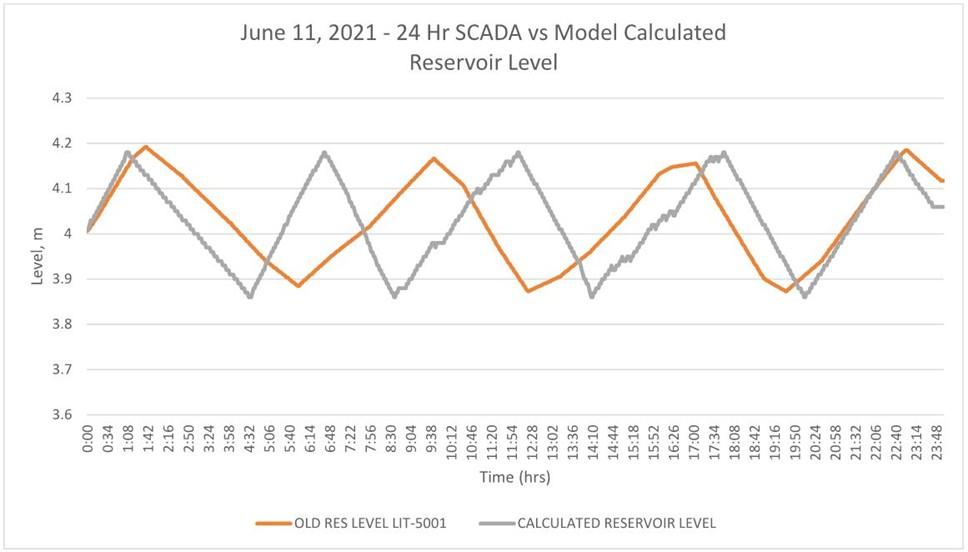
The measured and calculated reservoir levels for the same time period are shown in Figure 3. It indicates that the model predicts the initial filling of the reservoir at a similar rate as the measured data. However, the model predicts the reservoir will initially fill faster than the measured data and one extra fill cycle is required than measured. This is an indication that model user demands may be too high between approximately 12 am and 8 am. It is anticipated that the misalignment between model predicted and actual operational measurements of the tank level trends is a combination of these factors. Thus, incorporating unidentified system bleeds operating in the field coupled with modifications to the user demand pattern during that time period would improve the alignment of model calculated versus measured tank level trends
Figure 2: SCADA Measured versus Model Calculated Reservoir Discharge FlowFigure 3: SCADA Measured versus Model Calculated Reservoir Level
3.2 Field Tests
A contractor was engaged to execute the field calibration plan throughout the Iqaluit water network. Upon reviewing the data of the first few flow tests in March 2021, there were concerns regarding the contractor’s results as all tests were significantly less than anticipated in both districts tested, Plateau and Federal Road. EXP was not present during the testing and had not previously worked with this contractor, thus there was concern for human error. As a means of quality control, the subsequent flow test was scheduled in the presence of EXP in June 2021. It was assumed there were two potential causes for the poor flow test results experienced on March 8th, 2021 within the Plateau network. The first, the contractor did not properly complete the tests, or alternatively, the emergency pump within Booster Station No. 2 (BS2) did not engage during the tests. By collecting and reviewing SCADA data from the period when the tests were completed, it was uncovered that the flow experienced during the tests at the hydrants was appropriate with the flows recorded through BS2’s flow meters. This also confirms the in-field test results and therefore procedure. Data logged from within BS2 also confirmed the City’s emergency pump within BS2 did not automatically engage during the test conditions, and solely the booster and jockey pumps were operational for these results. This was immediately flagged to the City and it is EXP’s understanding this problem has been resolved.
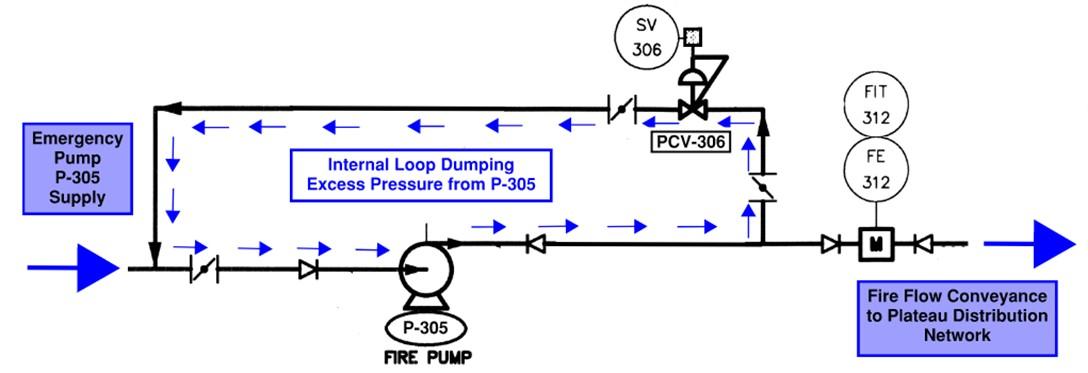
A subsequent field test confirmed that the fire pump (P-305) automatically engaged and ran during the test. Review through SCADA of the flowmeter (FIT-312) immediately downstream of P-305 confirmed there was no discharge from the pump conveyed throughout the Plateau network. Reviewing the schematics and logic control it was suggested the City investigate a solenoid & pressure control valve (SV 306 & PCV-306) pairing used for pressure relief downstream of the pump. Upon pump P-305 start up, PCV-306 is in the open position, and after a period of time SV-306 is energized to close PCV-306 forcing all water through FIT 312 and out to the demand in the Plateau Network. If high output pressures are experienced PCV-306 activates to relieve pressure build up. See Figure 4 below illustrating the suspected conditions experienced during the flow testing within the Plateau network, water was circulating within the Fire Pumps pressure relief system as SV306 & PCV-306 may not be functioning or set properly.
Figure 4: Schematic Water Flow from P-305 during Flow Test
The City was also immediately notified, and it is our understanding the City is investigating and planning to repair the problem. Upon correction of the issues noted above, the fire flow testing in Plateau may be attempted again. The current test results within the Plateau district are not valid for model calibration. Upon investigation and repair, all flow testing in Plateau will need to be repeated once the fire pump and solenoid valve are confirmed to be working properly and discharging higher system flow rates to the district network.
3.3 Plateau District and Booster Station No.2 Thermal Findings
Temperature data was collected from the SCADA system from the treated water storage discharge at the Water Treatment Plant and BS2. Upon review, several irregularities were identified which indicated that the system is not operating as intended, and ultimately the data could not be relied on to validate assumptions necessary for calibration of the thermal model. Figure 5 below presents the temperature data recorded from July 21st to July 28th, 2021. The irregularities identified in the data, which suggests potential operational issues within the system, are summarized as follows:
Water temperatures leaving Booster BS2 are excessively high. The stations heating system is intended to operate and maintain a maximum output temperature setpoint of +/- 10°C. Water temperature leaving the Water Treatment Plant (WTP) was increasing beyond the optimal maximum set point as well.
Temperature data indicates minimal temperature depression is occurring between the supply and return flow of BS2 (i.e. average depression recorded is less than 0.5°C).
A short circuit between the supply and return distribution mains is suspected to be the cause for the lack of temperature depression between output (supply) and input (return) flows. All services supply and return piping needs to be connected to the same distribution main (supply or recirculation). A short circuit is created when services are connected to both mains.
3.4 Overall System Findings
The water model can be further refined to closer reflect measured data by quantifying the fixed flow from bleeds during the low demand period between 12AM and 6AM. As noted above, EXP has requested this information.
For information purposes, the measured water temperature variation at the reservoir discharge location over the same 24-hour period has been provided in Figure 6. It indicates very little variation throughout the day and an average water temperature of 7.5°C. This average water temperature will be useful for future heat loss calculations.
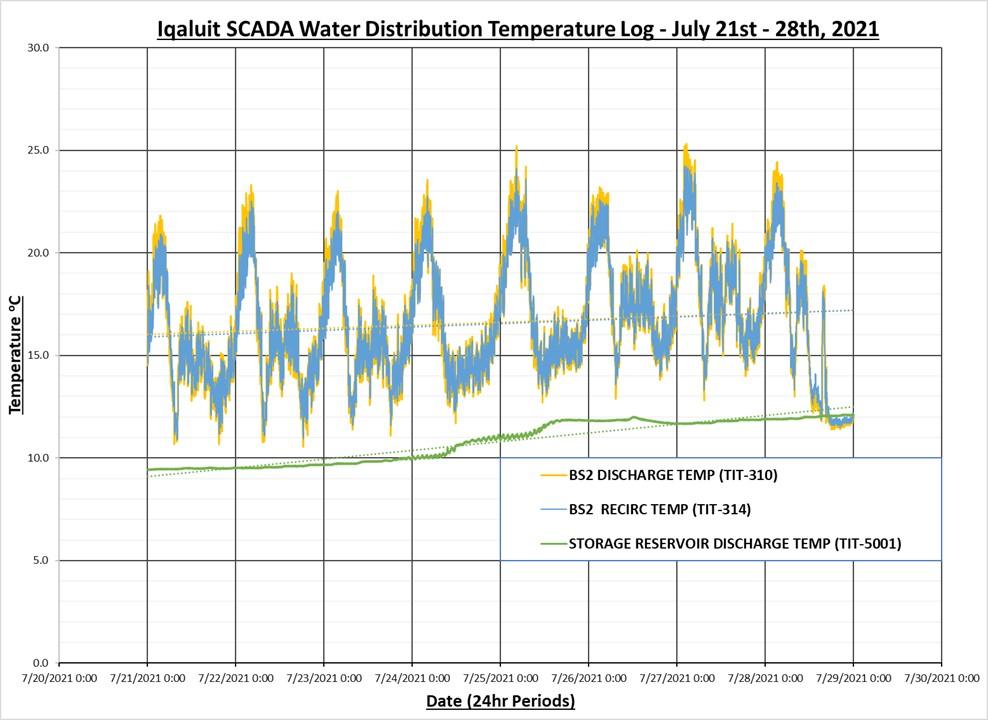
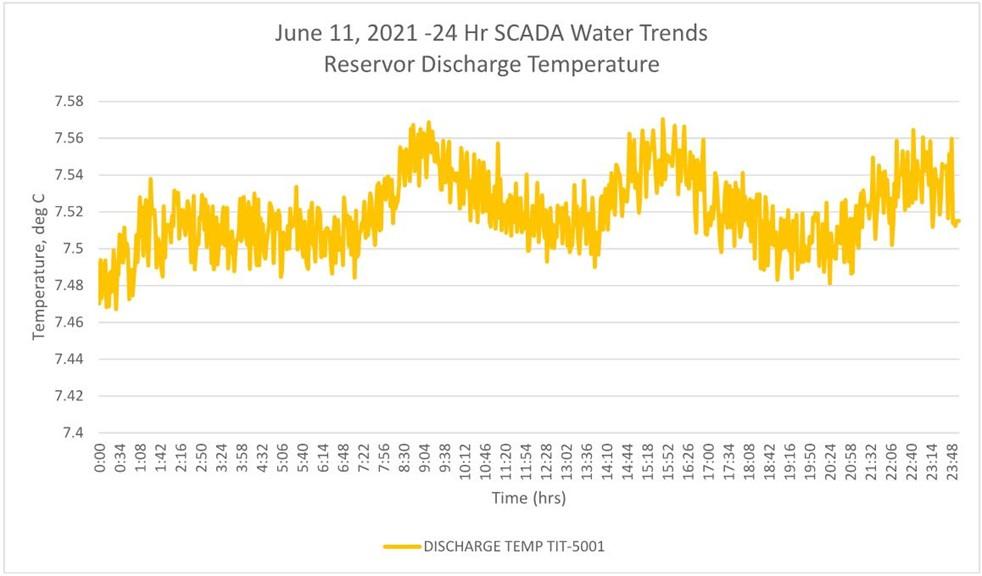 Figure 5: Booster Station No.2 Temperature Trending
Figure 6: Reservoir Discharge Temperature Trend
Figure 5: Booster Station No.2 Temperature Trending
Figure 6: Reservoir Discharge Temperature Trend
In addition, recent maintenance activities by the City discovered the presence of a butterfly valve located inside AV306 where the disc was seized in a partially closed/open position creating unnecessary head loss. The valve has been replaced therefore reducing head loss through this location. The system performance downstream, particularly during high flow events, would be negatively impacted to a degree dependent on the angle in which the disc was positioned relative to the distribution main. This is to highlight that there are likely other unnecessary head losses occurring throughout the network.
4 CONCLUSIONS AND RECOMMENDATIONS
A working water model has been established for the City of Iqaluit water distribution system. However, an acceptable level of calibration of the water model has not been achievable as recommended by published guidelines due to results of the field test data. Operational issues were identified by comparing field test results to SCADA collected operational data.
In addition, bleed locations throughout the system were identified by the City but flow measurements have not been provided at each location. In the absence of this data, assumed flows are required to be simulated in the water model. Therefore, any available flow data at bleed locations will assist calibration efforts. Similarly, it is recommended that flow data from Sewage Lift Station No.2 (LS#2) be captured as a means of validating the Lower Iqaluit water demands since LS#2 only collects sewage from within Lower Iqaluit. Since it is not connected to the City’s SCADA system, flow data is requested directly from the City.
The plan moving forward is to repeat flow tests in the Plateau district once operational issues in Booster Station No.2 are resolved. The field results will be used to calibrate the Plateau district in the model since the physical attributes of the infrastructure as well as operational data are known in greater detail in this district compared to the remainder of the system. The Hazen Williams C values, which are a function of head losses throughout the piping network, determined for Plateau would be considered as a high-end benchmark when comparing to other districts simply based on the pipe age and years in service. Flow testing can proceed with the resolution of operational issues.
This paper summarizes Phase 1 of the project with the objective of a working model achieved. The objective of a calibrated model remains outstanding because system operational issues need to be addressed prior to conducting further field flow tests required for model calibration. Phase 2 will resume model calibration in conjunction with the City’s efforts towards restoring and resolving the identified operational issues identified throughout the flow testing conducted in each district.
Once acceptable calibration of the Plateau district is achieved in the water model, subsequent districts will be evaluated utilizing Plateau’s C values as a guideline for calibration or field troubleshooting. It is anticipated that the majority of the flow tests will need to be conducted again. Resolution of the outstanding operational items noted in Phase 1 in addition to flow data requested will increase the likelihood of successfully calibrating the remaining water districts.
Continuation of thermal modeling is dependent on flow data from the calibrated water model along with the resolution of operational items noted in Phase 1. Therefore, thermal modeling will continue in Phase 2.
The calibrated water model will then be used to identify and prioritize potential improvements to the overall distribution system. It will also be a valuable tool for assisting the City with trouble shooting and maintenance activities as well as plan for system upgrades and future expansion potential.
References
Bentley Systems. 2007. Advanced Water Distribution Modeling and Management. First Edition, Bentley Institute Press, Exton, Pennsylvania, USA, 7: 287-289.
Smith, D.W. 1996. Cold Regions Utilities Monograph. Third Edition, ASCE, New York, NY, USA, 4:19-48.