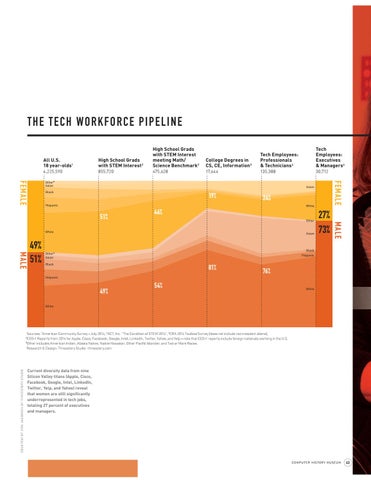
TH E T EC H WO R K F O R C E P IP E L INE All U.S. 18 year-olds1
High School Grads with STEM Interest 2
High School Grads with STEM Interest meeting Math/ Science Benchmark 2
4,225,590
855,720
475,628
College Degrees in CS, CE, Information 3
Tech Employees: Professionals & Technicians 4
Tech Employees: Executives & Managers 4
17,644
135,388
30,712
Asian
Black
19%
24%
Hispanic
White
51%
46% Asian
27% 73%
MALE
Other
White
MALE
49% 51%
FEMALE
FEMALE
Other 5 Asian
Black Other 5 Asian
Hispanic
Black
81%
76%
Hispanic
49%
54%
White
White
Sources: 1American Community Survey - July 2014, 2ACT, Inc. “The Condition of STEM 2014”, 3CRA 2014 Taulbee Survey (does not include non-resident aliens), EEO-1 Reports from 2014 for Apple, Cisco, Facebook, Google, Intel, LinkedIn, Twitter, Yahoo, and Yelp – note that EEO-1 reports include foreign nationals working in the U.S. 5 Other includes American Indian, Alaska Native, Native Hawaiian, Other Pacific Islander, and Two or More Races. Research & Design: Threestory Studio · threestory.com
COURTESY OF ERIK JACOBSEN OF THREESTORY STUDIO
4
Current diversity data from nine Silicon Valley titans (Apple, Cisco, Facebook, Google, Intel, LinkedIn, Twitter, Yelp, and Yahoo) reveal that women are still significantly underrepresented in tech jobs, totaling 27 percent of executives and managers.
C O M P U T E R H I S TO R Y M U S E U M
43