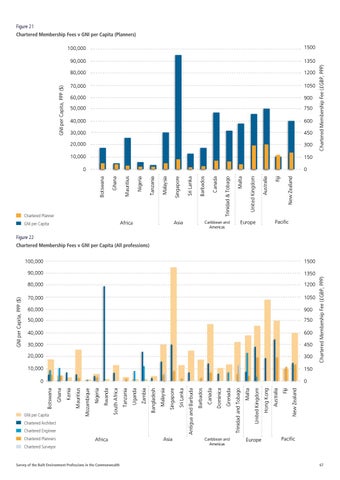
Figure 21
100,000
1500
90,000
1350
80,000
1200
70,000
1050
60,000
900
50,000
750
40,000
600
30,000
450
20,000
300
10,000
150
Chartered Planner
Asia
Africa
GNI per Capita
Caribbean and Americas
New Zealand
Fiji
Australia
United Kingdom
Malta
Trinidad & Tobago
Canada
Barbados
Sri Lanka
Singapore
Malaysia
Tanzania
Nigeria
Mauritius
Ghana
0 Botswana
0
Chartered Membership Fee (ÂŁGBP, PPP)
GNI per Capita, PPP ($)
Chartered Membership Fees v GNI per Capita (Planners)
Pacific
Europe
Figure 22
100,000
1500
90,000
1350
80,000
1200
70,000
1050
60,000
900
50,000
750
40,000
600
30,000
450
20,000
300
10,000
150
Chartered Planners
Africa
Chartered Surveyor
Survey of the Built Environment Professions in the Commonwealth
Asia
Europe
New Zealand
Fiji
Australia
Hong Kong
United Kingdom
Malta
Grenada
Dominica
Barbados
Canada
Caribbean and Americas
Trinidad and Tobago
Chartered Engineer
Antigua and Barbuda
Chartered Architect
Sri Lanka
Singapore
Malaysia
Bangladesh
Zambia
Uganda
Tanzania
South Africa
Rwanda
Nigeria
Mauritius
Kenia
Mozambique
GNI per Capita
Ghana
0 Botswana
0
Chartered Membership Fee (ÂŁGBP, PPP)
GNI per Capita, PPP ($)
Chartered Membership Fees v GNI per Capita (All professions)
Pacific
67