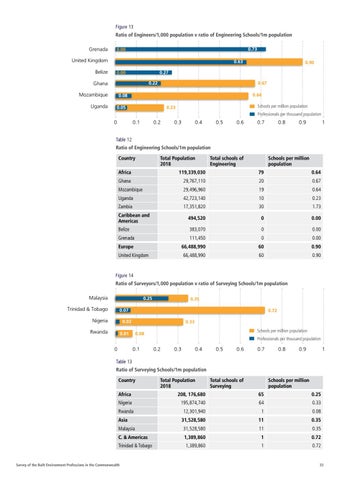
Figure 13 Ratio of Engineers/1,000 population v ratio of Engineering Schools/1m population Grenada
0.73
0.00
United Kingdom Belize
0.63 0.00
0.27 0.22
Ghana Mozambique Uganda
0.90
0.67 0.64
0.08 0.05
Schools per million population
0.23
Professionals per thousand population
0
0.1
0.2
0.3
0.4
0.5
0.6
0.7
0.8
0.9
1
Table 12 Ratio of Engineering Schools/1m population Country
Total Population 2018
Total schools of Engineering
Schools per million population
Africa
119,339,030
79
0.64
Ghana
29,767,110
20
0.67
Mozambique
29,496,960
19
0.64
Uganda
42,723,140
10
0.23
Zambia
17,351,820
30
1.73
Caribbean and Americas
494,520
0
0.00
Belize
383,070
0
0.00
Grenada
111,450
0
0.00
Europe
66,488,990
60
0.90
66,488,990
60
0.90
United Kingdom
Figure 14 Ratio of Surveyors/1,000 population v ratio of Surveying Schools/1m population Malaysia
0.25
Trinidad & Tobago
0.35
0.25
0.07
Nigeria
0.72
0.02
Rwanda
0.33
0.01
0
Schools per million population
0.08
0.1
Professionals per thousand population
0.2
0.3
0.4
0.5
0.6
0.7
0.8
0.9
1
Table 13 Ratio of Surveying Schools/1m population Country
Total Population 2018
Total schools of Surveying
Schools per million population
Africa
208, 176,680
65
0.25
Nigeria
195,874,740
64
0.33
Rwanda
12,301,940
1
0.08
Asia
31,528,580
11
0.35
Malaysia
31,528,580
11
0.35
C. & Americas
1,389,860
1
0.72
1,389,860
1
0.72
Trinidad & Tobago
Survey of the Built Environment Professions in the Commonwealth
33