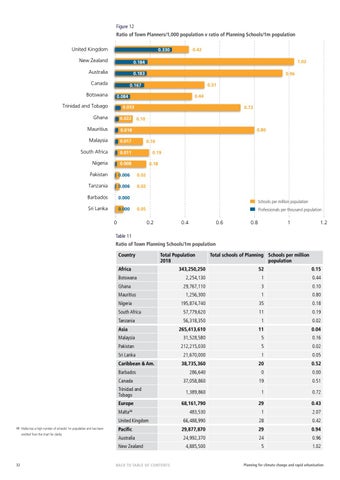
Figure 12 Ratio of Town Planners/1,000 population v ratio of Planning Schools/1m population United Kingdom
0.330
New Zealand
0.184
Australia
0.183
Canada Botswana
0.42 1.02 0.96 0.51
0.167 0.44
0.084
Trinidad and Tobago
0.033
Ghana
0.022
Mauritius
0.018
Malaysia
0.017
South Africa
0.011
Nigeria
0.008
0.72 0.10 0.80 0.16 0.19 0.18
Pakistan
0.006
0.02
Tanzania
0.006
0.02
Barbados
0.000
Sri Lanka
0.000
Schools per million population 0.05
0
Professionals per thousand population
0.2
0.4
0.6
0.8
1
1.2
Table 11 Ratio of Town Planning Schools/1m population Country
Total Population 2018
Africa Botswana Ghana Mauritius
0.15
2,254,130
1
0.44
29,767,110
3
0.10
1
0.80
35
0.18
South Africa
57,779,620
11
0.19
Tanzania
56,318,350
1
0.02
265,413,610
11
0.04
Malaysia
31,528,580
5
0.16
Pakistan
212,215,030
5
0.02
Sri Lanka
21,670,000
1
0.05
38,735,360
20
0.52
Caribbean & Am. Barbados
286,640
0
0.00
37,058,860
19
0.51
1,389,860
1
0.72
68,161,790
29
0.43
483,530
1
2.07
66,488,990
28
0.42
Pacific
29,877,870
29
0.94
Australia
24,992,370
24
0.96
4,885,500
5
1.02
Canada Trinidad and Tobago Europe Malta
30
United Kingdom
New Zealand
32
52
1,256,300
Asia
omitted from the chart for clarity
343,250,250
195,874,740
Nigeria
30 Malta has a high number of schools/ 1m population and has been
Total schools of Planning Schools per million population
BACK TO TABLE OF CONTENTS
Planning for climate change and rapid urbanisation