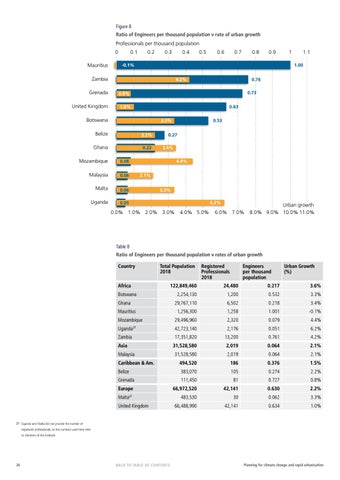
Figure 8 Ratio of Engineers per thousand population v rate of urban growth Professionals per thousand population 0 Mauritius
0.1
0.2
0.3
0.4
0.5
0.6
0.7
0.8
0.9
-0.1% 4.2% 0.8%
United Kingdom
1.0%
0.76 0.73 0.63
Botswana
3.3%
Belize
2.2%
Ghana
0.22
Mozambique
0.08
Malaysia
0.06
Malta
0.06
Uganda
0.05
1.1 1.00
Zambia Grenada
1
0.53
0.27 3.4% 4.4%
2.1% 3.3% 6.2%
0.0% 1.0% 2.0% 3.0%
4.0% 5.0%
6.0% 7.0%
Urban growth 8.0% 9.0% 10.0% 11.0%
Table 8 Ratio of Engineers per thousand population v rates of urban growth Country
Total Population 2018
Africa
Registered Professionals 2018
Engineers per thousand population
Urban Growth (%)
122,849,460
24,480
0.217
3.6%
2,254,130
1,200
0.532
3.3%
29,767,110
6,502
0.218
3.4%
1,256,300
1,258
1.001
-0.1%
Mozambique
29,496,960
2,320
0.079
4.4%
Uganda27
42,723,140
2,176
0.051
6.2%
Zambia
17,351,820
13,200
0.761
4.2%
31,528,580
2,019
0.064
2.1%
Botswana Ghana Mauritius
Asia Malaysia
31,528,580
2,019
0.064
2.1%
Caribbean & Am.
494,520
186
0.376
1.5%
Belize
383,070
105
0.274
2.2%
Grenada
111,450
81
0.727
0.8%
Europe
66,972,520
42,141
0.630
2.2%
483,530
30
0.062
3.3%
66,488,990
42,141
0.634
1.0%
Malta
27
United Kingdom 27 Uganda and Malta did not provide the number of
registered professionals, so the numbers used here refer to members of the institute.
26
BACK TO TABLE OF CONTENTS
Planning for climate change and rapid urbanisation