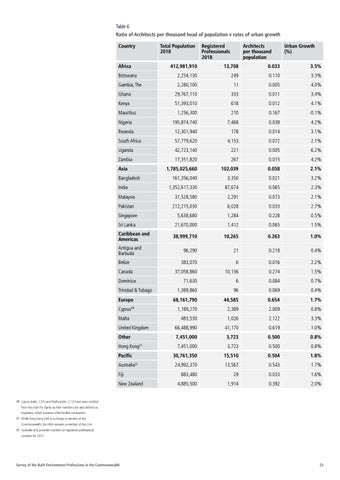
Table 6 Ratio of Architects per thousand head of population v rates of urban growth Country
Total Population 2018
Africa
Registered Professionals 2018
Architects per thousand population
Urban Growth (%)
412,981,910
13,708
0.033
3.5%
Botswana
2,254,130
249
0.110
3.3%
Gambia, The
2,280,100
11
0.005
4.0%
Ghana
29,767,110
333
0.011
3.4%
Kenya
51,393,010
618
0.012
4.1%
1,256,300
210
0.167
-0.1%
Nigeria
195,874,740
7,468
0.038
4.2%
Rwanda
12,301,940
178
0.014
3.1%
South Africa
57,779,620
4,153
0.072
2.1%
Uganda
42,723,140
221
0.005
6.2%
Zambia
17,351,820
267
0.015
4.2%
1,785,025,660
102,039
0.058
2.1%
161,356,040
3,350
0.021
3.2%
1,352,617,330
87,674
0.065
2.3%
Malaysia
31,528,580
2,291
0.073
2.1%
Pakistan
212,215,030
6,028
0.033
2.7%
Singapore
5,638,680
1,284
0.228
0.5%
Sri Lanka
21,670,000
1,412
0.065
1.5%
38,999,710
10,265
0.263
1.0%
96,290
21
0.218
0.4%
383,070
6
0.016
2.2%
37,058,860
10,136
0.274
1.5%
71,630
6
0.084
0.7%
1,389,860
96
0.069
0.4%
68,161,790
44,585
0.654
1.7%
1,189,270
2,389
2.009
0.8%
483,530
1,026
2.122
3.3%
United Kingdom
66,488,990
41,170
0.619
1.0%
Other
7,451,000
3,723
0.500
0.8%
7,451,000
3,723
0.500
0.8%
30,761,350
15,510
0.504
1.8%
24,992,370
13,567
0.543
1.7%
883,480
29
0.033
1.6%
4,885,500
1,914
0.392
2.0%
Mauritius
Asia Bangladesh India
Caribbean and Americas Antigua and Barbuda Belize Canada Dominica Trinidad & Tobago Europe Cyprus
20
Malta
Hong Kong
21
Pacific Australia22 Fiji New Zealand
20 Cyprus (ratio: 2.01) and Malta (ratio: 2.12) have been omitted
from the chart for clarity as their members are also defined as engineers, which prevents a like-for-like comparison 21 While Hong Kong SAR is no longer a member of the
Commonwealth, the HKIA remains a member of the CAA 22 Australia only provided numbers of registered professional
numbers for 2017
Survey of the Built Environment Professions in the Commonwealth
23