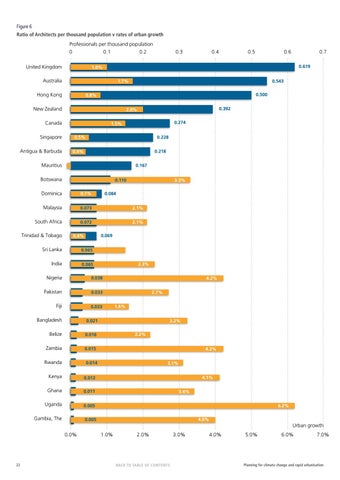
Figure 6 Ratio of Architects per thousand population v rates of urban growth Professionals per thousand population 0
0.1
United Kingdom
0.2
0.6
0.7 0.619
0.543 0.500
0.8%
New Zealand
0.392
2.0%
Canada
0.274
1.5% 0.5%
0.228 0.218
0.4%
Mauritius
0.167
Botswana
0.110
3.3%
Dominica
0.7%
Malaysia
0.073
2.1%
South Africa
0.072
2.1%
Trinidad & Tobago
0.5
1.7%
Hong Kong
Antigua & Barbuda
0.4
1.0%
Australia
Singapore
0.3
0.084
0.069
0.4%
Sri Lanka
0.065
India
0.065
2.3%
Nigeria
0.038
Pakistan
0.033
Fiji
0.033
Bangladesh
0.021
Belize
0.016
Zambia
0.015
Rwanda
0.014
Kenya
0.012
Ghana
0.011
Uganda
0.005
Gambia, The
0.005
4.2% 2.7% 1.6% 3.2% 2.2% 4.2% 3.1% 4.1% 3.4% 6.2% 4.0%
Urban growth 0.0%
22
1.0%
2.0%
BACK TO TABLE OF CONTENTS
3.0%
4.0%
5.0%
6.0%
7.0%
Planning for climate change and rapid urbanisation