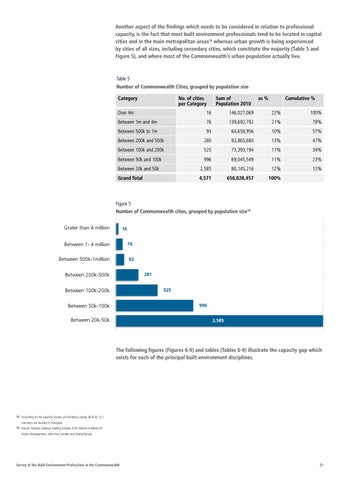
Another aspect of the findings which needs to be considered in relation to professional capacity, is the fact that most built environment professionals tend to be located in capital cities and in the main metropolitan areas18 whereas urban growth is being experienced by cities of all sizes, including secondary cities, which constitute the majority (Table 5 and Figure 5), and where most of the Commonwealth’s urban population actually live.
Table 5 Number of Commonwealth Cities, grouped by population size Category
No. of cities per Category
Sum of Population 2010
as %
Cumulative %
Over 4m
16
146,027,069
22%
100%
Between 1m and 4m
76
139,692,792
21%
78%
Between 500k to 1m
93
64,658,956
10%
57%
Between 200k and 500k
280
83,865,680
13%
47%
Between 100k and 200k
525
73,393,194
11%
34%
Between 50k and 100k
996
69,045,549
11%
23%
Between 20k and 50k
2,585
80,145,216
12%
12%
Grand Total
4,571
656,828,457
100%
Figure 5 Number of Commonwealth cities, grouped by population size19 Grater than 4 million
16 76
Between 1- 4 million Between 500k-1million
92 281
Between 200k-500k
525
Between 100k-200k
996
Between 50k-100k Between 20k-50k
2,585
The following figures (Figures 6-9) and tables (Tables 6-9) illustrate the capacity gap which exists for each of the principal built environment disciplines.
18 According to the Uganda Society of Architects, nearly all of its 221
members are located in Kampala. 19 Source: Nicolas Galarza, Visiting Scholar, NYU Marron Institute of
Urban Management, with Ana Camelo and Maria Bernal.
Survey of the Built Environment Professions in the Commonwealth
21