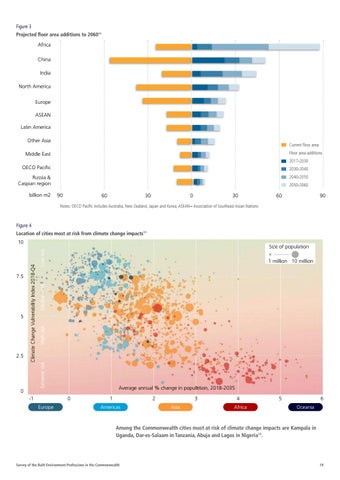
Figure 3 Projected floor area additions to 206011 Africa China India North America Europe ASEAN Latin America Other Asia
Current floor area Floor area additions
Middle East
2017-2030
OECO Pacific
2030-2040
Russia & Caspian region
2040-2050
billion m2
2050-2060
90
60
30
0
30
60
90
Notes: OECD Pacific includes Australia, New Zealand, Japan and Korea; ASEAN= Association of Southeast Asian Nations
Figure 4 Location of cities most at risk from climate change impacts11
2.5
0
Low risk Medium risk
1 million 10 million
High risk
5
Size of population
Extreme risk
7.5
Climate Change Vulnerability Index 2018-Q4
10
Average annual % change in population, 2018-2035 0
-1 Europe
1
2
Americas
3 Asia
4 Africa
5
6 Oceania
Among the Commonwealth cities most at risk of climate change impacts are Kampala in Uganda, Dar-es-Salaam in Tanzania, Abuja and Lagos in Nigeria12.
Survey of the Built Environment Professions in the Commonwealth
19