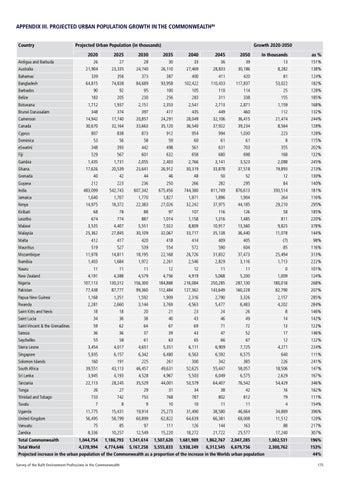
appendix iii. PROJECTED URBAN POPULATION GROWTH IN THE COMMONWEALTH86 Country Antigua and Barbuda Australia Bahamas Bangladesh Barbados
Projected Urban Population (in thousands)
Growth 2020-2050
2020
2025
2030
2035
2040
2045
2050
In thousands
as %
26
27
28
30
33
36
39
13
151%
21,904
23,335
24,740
26,110
27,469
28,833
30,186
8,282
138%
339
356
373
387
400
411
420
81
124%
64,815
74,838
84,689
93,958
102,422
110,433
117,837
53,022
182%
90
92
95
100
105
110
114
25
128%
183
205
230
256
283
311
338
155
185%
1,712
1,937
2,151
2,353
2,541
2,713
2,871
1,159
168%
348
374
397
417
435
449
460
112
132%
Cameroon
14,942
17,740
20,857
24,291
28,049
32,106
36,415
21,474
244%
Canada
30,670
32,164
33,663
35,120
36,540
37,922
39,234
8,564
128%
807
838
873
912
954
994
1,030
223
128%
Belize Botswana Brunei Darussalam
Cyprus Dominica
53
56
58
59
60
61
61
8
115%
eSwatini
348
393
442
498
561
631
703
355
202%
529
567
601
632
658
680
698
168
132%
Gambia
Fiji
1,435
1,731
2,055
2,403
2,766
3,141
3,523
2,088
245%
Ghana
17,626
20,539
23,641
26,912
30,319
33,878
37,518
19,893
213%
40
42
44
46
48
50
52
12
130%
Grenada Guyana India Jamaica Kenya
212
223
236
250
266
282
295
84
140%
483,099
542,743
607,342
675,456
744,380
811,749
876,613
393,514
181%
1,640
1,707
1,770
1,827
1,871
1,896
1,904
264
116%
14,975
18,372
22,383
27,026
32,242
37,975
44,185
29,210
295%
Kiribati
68
78
88
97
107
116
126
58
185%
Lesotho
674
774
887
1,014
1,158
1,316
1,485
811
220%
Malawi
3,535
4,407
5,551
7,022
8,809
10,917
13,360
9,825
378%
Malaysia
25,362
27,845
30,109
32,067
33,717
35,138
36,440
11,078
144%
Malta
412
417
420
418
414
409
405
(7)
98%
Mauritius
519
527
539
554
572
590
604
85
116%
11,978
14,811
18,195
22,168
26,726
31,832
37,473
25,494
313%
1,403
1,684
1,972
2,261
2,546
2,829
3,116
1,713
222%
Mozambique Namibia Nauru
11
11
11
12
12
11
11
0
101%
4,191
4,388
4,579
4,756
4,919
5,068
5,200
1,009
124%
Nigeria
107,113
130,312
156,300
184,888
216,084
250,285
287,130
180,018
268%
Pakistan
77,438
87,777
99,360
112,484
127,362
143,649
160,228
82,790
207%
New Zealand
Papua New Guinea
1,168
1,351
1,592
1,909
2,316
2,790
3,326
2,157
285%
Rwanda
2,281
2,660
3,144
3,769
4,563
5,477
6,483
4,202
284%
Saint Kitts and Nevis
18
18
20
21
23
24
26
8
146%
Saint Lucia
34
36
38
40
43
46
49
14
142% 122%
Saint Vincent & the Grenadines
59
62
64
67
69
71
72
13
Samoa
36
36
37
39
43
47
52
17
146%
Seychelles
55
58
61
63
65
66
67
12
122%
Sierra Leone
3,454
4,017
4,651
5,351
6,111
6,909
7,725
4,271
224%
Singapore
5,935
6,157
6,342
6,480
6,563
6,592
6,575
640
111%
Solomon Islands South Africa
160
191
225
261
300
342
385
226
241%
39,551
43,113
46,457
49,631
52,625
55,447
58,057
18,506
147%
Sri Lanka
3,945
4,193
4,528
4,967
5,503
6,049
6,575
2,629
167%
Tanzania
22,113
28,245
35,529
44,001
53,579
64,407
76,542
54,429
346%
Tonga Trinidad and Tobago Tuvalu
26
27
29
31
34
38
42
16
162%
733
742
753
768
787
802
812
79
111%
7
8
9
10
10
11
11
4
154%
Uganda
11,775
15,431
19,914
25,273
31,490
38,580
46,664
34,889
396%
United Kingdom
56,495
58,799
60,899
62,822
64,639
66,381
68,008
11,512
120%
75
85
97
111
126
144
163
88
217%
Vanuatu
8,336
10,257
12,549
15,220
18,272
21,722
25,577
17,240
307%
Total Commonwealth
Zambia
1,044,754
1,186,793
1,341,614
1,507,620
1,681,989
1,862,767
2,047,285
1,002,531
196%
Total World
4,378,994
4,774,646
5,167,258
5,555,833
5,938,249
6,312,545
6,679,756
2,300,762
153%
Projected increase in the urban population of the Commonwealth as a proportion of the increase in the Worlds urban population Survey of the Built Environment Professions in the Commonwealth
44% 175