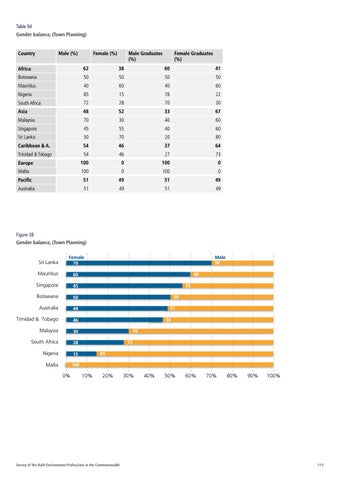
Table 94 Gender balance, (Town Planning)
Country
Male (%)
Female (%)
Male Graduates (%)
Female Graduates (%)
Africa
62
38
60
41
Botswana
50
50
50
50
Mauritius
40
60
40
60
Nigeria
85
15
78
22
South Africa
72
28
70
30
Asia
48
52
33
67
Malaysia
70
30
40
60
Singapore
45
55
40
60
Sri Lanka
30
70
20
80
Caribbean & A.
54
46
37
64
Trinidad & Tobago
54
46
27
73
Europe
100
0
100
0
Malta
100
0
100
0
Pacific
51
49
51
49
Australia
51
49
51
49
Figure 38 Gender balance, (Town Planning)
Sri Lanka
Female 70
Mauritius
60
Singapore
45
Botswana
50
Australia
49
Trinidad & Tobago
46
Malaysia
30
South Africa
28
Nigeria
15
Malta
100
0%
Male 30 40 55 50 51 54 70 72 85
10%
20%
Survey of the Built Environment Professions in the Commonwealth
30%
40%
50%
60%
70%
80%
90%
100%
113