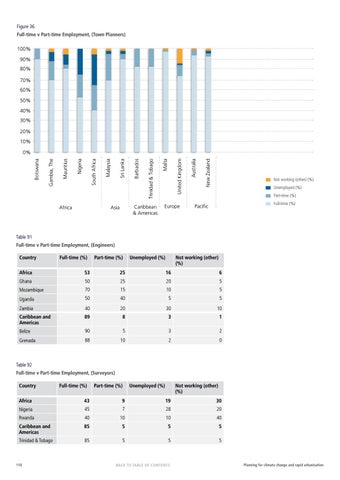
Figure 36 Full-time v Part-time Employment, (Town Planners) 100% 90% 80% 70% 60% 50% 40% 30% 20% 10%
Africa
Caribbean & Americas
Asia
Europe
New Zealand
Australia
United Kingdom
Malta
Trinidad & Tobago
Barbados
Sri Lanka
Malaysia
South Africa
Nigeria
Mauritius
Gambia, The
Botswana
0%
Not working (other) (%) Unemployed (%) Part-time (%) Full-time (%)
Pacific
Table 91 Full-time v Part-time Employment, (Engineers) Country
Full-time (%)
Part-time (%)
Unemployed (%)
Not working (other) (%)
Africa
53
25
16
6
Ghana
50
25
20
5
Mozambique
70
15
10
5
Uganda
50
40
5
5
Zambia
40
20
30
10
Caribbean and Americas
89
8
3
1
Belize
90
5
3
2
Grenada
88
10
2
0
Table 92 Full-time v Part-time Employment, (Surveyors) Country
Full-time (%)
Part-time (%)
Unemployed (%)
Not working (other) (%)
Africa
43
9
19
30
Nigeria
45
7
28
20
Rwanda
40
10
10
40
Caribbean and Americas
85
5
5
5
Trinidad & Tobago
85
5
5
5
110
BACK TO TABLE OF CONTENTS
Planning for climate change and rapid urbanisation