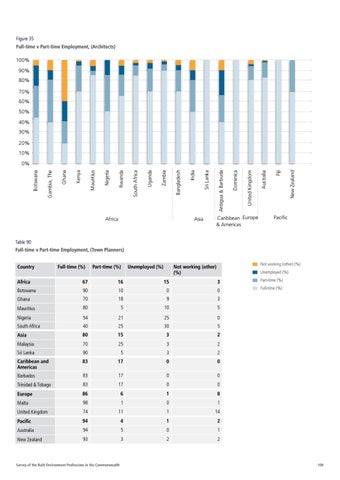
Figure 35 Full-time v Part-time Employment, (Architects) 100% 90% 80% 70% 60% 50% 40% 30% 20% 10%
Africa
Asia
Caribbean Europe & Americas
New Zealand
Fiji
Australia
United Kingdom
Dominica
Antigua & Barbuda
Sri Lanka
India
Bangladesh
Zambia
Uganda
South Africa
Rwanda
Nigeria
Mauritius
Kenya
Ghana
Gambia, The
Botswana
0%
Pacific
Table 90 Full-time v Part-time Employment, (Town Planners) Country
Full-time (%)
Part-time (%)
Unemployed (%)
Not working (other) (%)
Not working (other) (%)
Unemployed (%)
Africa
67
16
15
3
Part-time (%)
Botswana
90
10
0
0
Full-time (%)
Ghana
70
18
9
3
Mauritius
80
5
10
5
Nigeria
54
21
25
0
South Africa
40
25
30
5
Asia
80
15
3
2
Malaysia
70
25
3
2
Sri Lanka
90
5
3
2
Caribbean and Americas
83
17
0
0
Barbados
83
17
0
0
Trinidad & Tobago
83
17
0
0
Europe
86
6
1
8
Malta
98
1
0
1
United Kingdom
74
11
1
14
Pacific
94
4
1
2
Australia
94
5
0
1
New Zealand
93
3
2
2
Survey of the Built Environment Professions in the Commonwealth
109