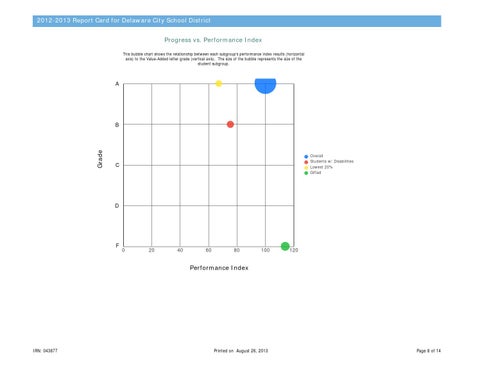
2012-2013 Report Card for Delaware City School District Progress vs. Performance Index This bubble chart shows the relationship between each subgroup's performance index results (horizontal axis) to the Value-Added letter grade (vertical axis). The size of the bubble represents the size of the student subgroup.
A
Grade
B
Overall Students w/ Disabilities Lowest 20% Gifted
C
D
F
0
20
40
60
80
100
120
Performance Index
IRN: 043877
Printed on August 26, 2013
Page 8 of 14