c Between which two readings was the greatest temperature change? d Estimate the temperature at 10 am. e When the outside temperature at the weather station goes above 13°C, the heating stops inside the building. For how long does the heating stop on this day?
Grade 4 2
AO2
Jon goes to a pub quiz once a week for eight weeks. The table shows his scores. Week
1
2
3
Score (out of 100)
35
47
54
4
5
6
7
8
68
74
78
82
a Draw a line graph for the data. b Jon could not remember his score on the fourth week. Use your graph to estimate Jon’s score on the fourth week. c Explain the trend in Jon’s scores. What reasons can you give to explain this trend?
3
d Explain why it would be a mistake to use your graph to estimate Jon’s score in the 12th week of the pub quiz.
AO3
The table shows how much tourists spent in the UK between 1998 and 2018.
AO2
Total spending (£ billions) Year
6.2
7.9
12.3
12.8
13.0
16.3
1998
2002
2006
2010
2014
2018
a Draw a line graph for the data. b Use your graph to estimate tourist spending in 2022. c Explain the trend in tourist spending. What reasons can you give to explain this trend? d Explain why many people think that tourist spending in 2022 will be much higher than your answer to part b.
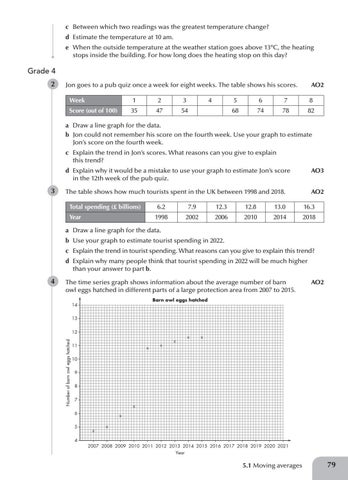
4
The time series graph shows information about the average number of barn owl eggs hatched in different parts of a large protection area from 2007 to 2015. 14
AO2
Barn owl eggs hatched
13
Number of barn owl eggs hatched
12 11 10 9 8 7 6 5 4
2007 2008 2009 2010 2011 2012 2013 2014 2015 2016 2017 2018 2019 2020 2021 Year
5.1 Moving averages
59713_078_083.indd 79
79
27/08/19 12:43 PM