
34 minute read
Chapter 3


Gasification
3.1 Gasification theory
Advertisement
Gasification process allows the conversion of a solid or liquid feedstock into a gaseous fuel which can be employed for energy purposes, as introduced in the first chapter. Typical steps involved in a gasification process are [13]: Drying; Pyrolysis; Partial combustion of the released gases an char; Gasification of the products of the previous steps.
The drying phase takes place thanks to the heat coming from the oxidation zone downstream. It must be highlighted the fact that, in order to achieve satisfying heating values in the syngas, usually the employed systems are fed with feedstock characterized by moisture content in the range 10-20% [13]. Pyrolysis phase involves the thermal cracking of hydrocarbon molecules of the feedstock producing smaller gaseous molecules which can be condensable or not. Condensable part of this product brings to the formation of tars which could create problems in the plant management, thus the produced gas is treated for their reduction (further considerations concerning tars control will be explained in next pages). Fig.18 shows a generic scheme of a downdraft gasifier.
Figure 18Generic scheme of a downdraft gasifier and its temperature profile[13]
Partial combustion of char is necessary to sustain most of the reaction of the process which are endothermic. Most important oxidation steps involves the reaction of carbon with the production of CO2 and CO. As will be explained in the next paragraphs concerning the gasifier employed in the laboratory, the control of the secondary air is crucial for the control of the
char conversion. The conversion of carbon into CO or CO2 could be described using a partition coefficient, whose expression was proposed by Arthur (1951) [13]:
����+��2 →2(��−1)����+(2−��)����2 (3.1)
Where �� can be estimated according to Arthur as:
[����] [����2] =2400��
6234 �� ) (3.2)
T is the temperature of the char surface. Finally, gasification reactions follows pyrolysis, bringing to the final conversion pf the products of the previous steps into CO, H2, CO2 and H2O. Between all the possible reactions, the ones involving char are the most important and listed below. The typical reactions involved during gasification process are [13]:
Carbon reactions
�������������� ��+����2 ↔2����+172����/������ ����������−���������� ��+��2�� ↔����+��2 +131����/������ ���������������������������������� ��+2��2 ↔����4 −74,8����/������ ��+0,5��2 →����−111����/������
Oxidation reactions
Shift reaction
��+��2 →����2 −394����/������ ����+0,5��2 →����2 −284����/������ ����4 +2��2 ↔����2 +2��2��−803����/������ ��2 +0,5��2 →��2��−242����/������
����+��2�� ↔����2 +��2 −41,2����/������
Methanation reactions 2����+2��2 →����4 +����2 −247����/������ ����+3��2 →����4 +��2��−206����/������ ����2 +4��2 →����4 +2��2��−165����/������
Steam reforming reactions ����4 +��2�� ↔����+3��2 +206����/������ ����4 +0,5��2 →����+2��2 −36����/������
Possible gasifying mediums are air, pure oxygen or water steam. The choice of the medium has a strong influence on the final characteristics of the obtained syngas in terms of heating value (steam and pure oxygen gasification ensure much higher energy dense syngas), but from the technical and economic point of view, air gasification is much more easier to be achieved.
3.2 Gasification equipment
The plant adopted for the laboratory test is a small scale open top gasifier placed at the Free University of Bolzano (Fig.19) and developed at the Indian Institute of Science, Bangalore (India)
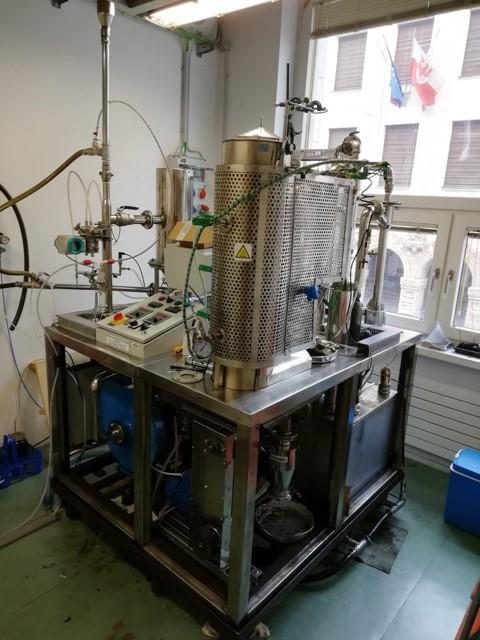
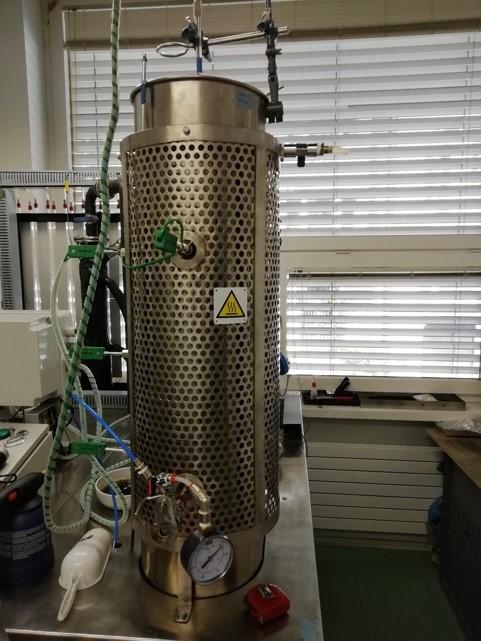
Figure 19Picture of the open top gasifier in Free University of Bolzanoand on the right, themain reactor
The system is characterized by a downdraft open top structure, which presents a cylindrical reactor (Fig.19, right), with the following geometrical main dimensions: Diameter: 120 mm; Height: 1000 mm.
The reactor has a double-stage air feeding, meaning that primary air is fed from the upper part of the gasifier (and controlled thanks to the presence of an inverter connected to the blower motor), while the secondary air flowrate can be controlled by means of the presence of nozzle placed at 670 mm from the reactor top (blue tube shown in Fig.19). This configuration allows to achieve an higher burn out of the char (which is placed in the bottom section of the reactor) [30]. The presence of a screw conveyor in the lowest section allows to control manually the char discharge.
Cyclone for the particle removement (Fig.20, left); Two water scrubbers for tars and particle removement; Condenser for water vapor removement; Fabric filter for particle removement (contained in the component shown in Fig 20,right).
Figure 20On the left side, the cycloneseparatorduring maintenance operations, on the right figure, the fibric filter container
The water used in the scrubbers is recirculated by means of a pump and passes through a dedicated tank (Fig. 21), which is periodically filled during the gasification tests also with ice with the aim to increase the effectiveness of the scrubbers (according to Henry’s law, the solubility decreases with temperature).
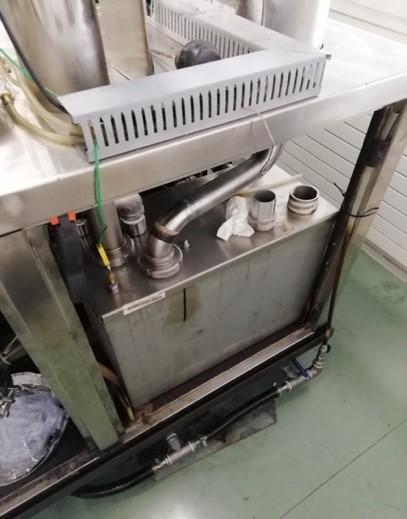
Figure 21Dedicated tank for the scrubbers water (containing water+ice)
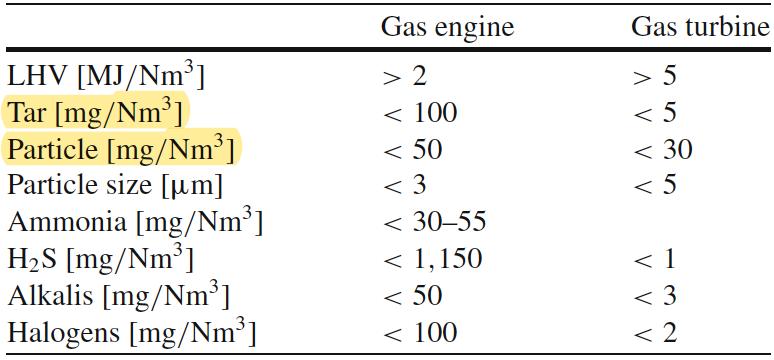
The equipment mentioned for tars and particles removement is of course adopted also at industrial level. Typical limits admitted by internal combustion engines and turbines are shown in Table 19.
Table 19Limits of tars and particles concentrations for syngas utilization in ICE and turbines [12]
A torch (shown in Fig.22, above) is directly connected to the producer gas line and in particular, if no ICE (internal combustion engines) are coupled with the plant, the entire flowrate (apart from the quantity sampled and sent to the gas chromatographer) is sent to the combustion in the torch.
The temperatures in different parts of the reactor and the system are measured by means of K-type thermocouples, connected with the acquisition system. The latter is managed by means of a LabView interface. Fig.22 shows a schematic representation of the plant employed for the gasification test in the LabView interface.
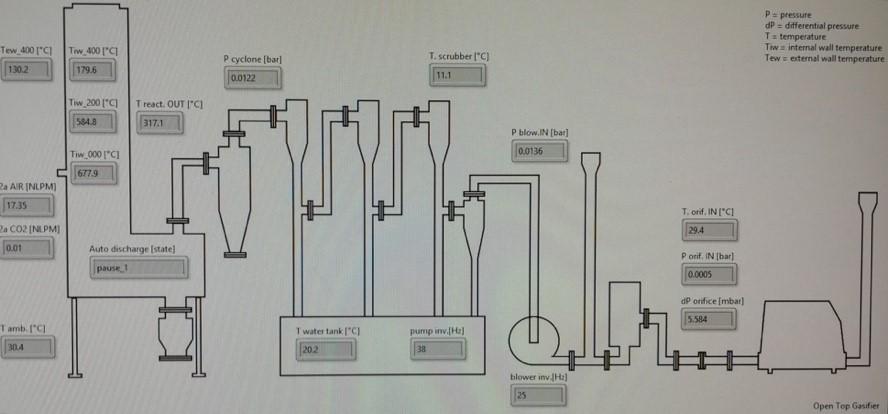
Figure 22Torch employed for the direct combustion of the syngas(above) and scheme of the plant from the software LabView interface
The gas composition during the tests is performed by coupling the gasifier with a gas chromatographer (3000 microGC, SRA Instruments). Before entering into the gas chromatographer, it must be ensured the absence of any tar particle or steam, thus a column of bubblers (Fig.23) filled with propanol (for tars solubilization) and a filter containing silica gel to ensure the complete absence of water in the syngas. Note that Fig.23 (right) shows the bubblers columns submerged in a ice tank needed to avoid the evaporation of the propanol.
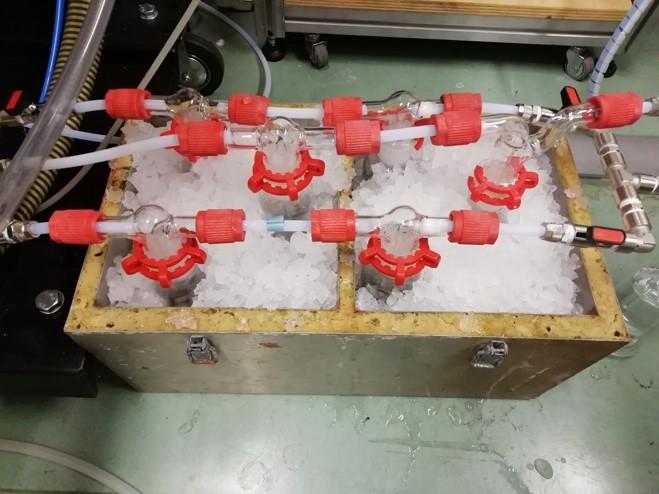
Figure 23Column of bubblers filled with propanol(ice is used to avoid evaporation of the propanol)
Starting from data obtained from the measurements on the systems it is possible to compute the characteristic parameters of the process. The first step is the determination of the cycles of biomass charging. Fig. 24 shows schematically the reactor behavior.
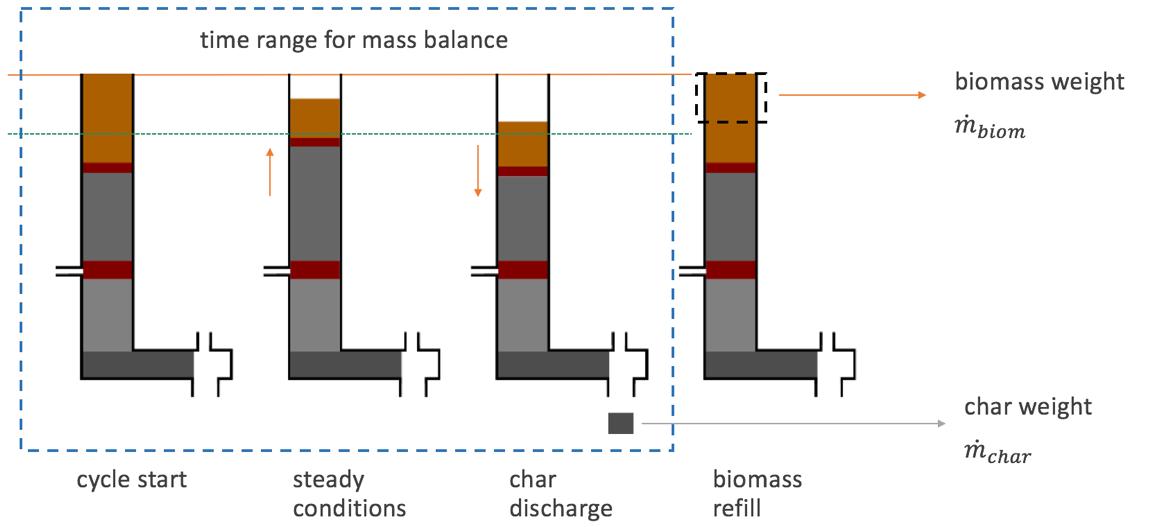
Figure 24Schematic behaviour of the open top small scale gasifier [31]
Thus, the biomass flowrate can be computed according to Eq.3.3 (with the same relation, also the char flowrate can be computed):
(3.3)
where: ����������������,���������� is the weight of the biomass sample charged at the end of the cycle in [g]; ������������ −�������� is the time interval between starting instant and ending instant of the cycle [h]
The following parameters are measured in the system in order to compute the syngas density (and consequently the volume flowrate of syngas) and the syngas composition from which its LHV is derived: Ambient temperature in the gasifier room ��������[°C]; Temperature at the orifice inlet ����,�������������� [°C]; Temperature at the reactor outlet ����,������ [°C]; Pressure difference between inlet and outlet section of the orifice ΔP [mbar]; Syngas composition by means of the gas chromatographer.
The syngas flowrate can be computed by means of the measurement of its temperature and the pressure difference ΔP at the orifice. The flowrate of produced gas (on dry base) is computed according to Eq. 3.4:
�������������� =��0 ���������������� √2����/�� (3.4)
where the product ��0 ���������������� has been estimated by means of a calibration with an anemometer gas flow meter and found to be equal to 1.28. The density �� of the syngas has been estimated starting from the composition on dry base given by the µGC (gas chromatographer), which detects the molar fraction of H2, N2, CO, CO2, O2, CH4 and C2H6. The average density of the syngas for each cycle can be computed as :
�� �� ̂ �� (3.5)
where: P is the pressure of the gas in [Pa]; T is the temperature of the gas equal to ����,�������������� in [K] �� ̂ is the gas constant [J/kg K] computed as:
����)∗1000 (3.6)
With R= 8,31446 [J g-1 K-1 ] and ���� is the molar mass of the syngas in [g mol-1] computed as the weighted average of the single molar masses of each measured species, weighted on the molar fraction.
Finally, the mass flowrate of the syngas in [kg/s] can be computed as:
1 3600 (3.7)
With the same approach used for the density, also the low heating value (LHV) can be computed as the weighted average of the LHV of each oxidable species:
������������������ = ∑�������� ���� (3.8)
�������� [��2,������]= �������������� [��2,������������] (3.9)
where: [��2,������] is the mass fraction of nitrogen in the air (76,7%); [��2,������������] is the mass fraction of nitrogen in the syngas (from µGC).
A global mass balance can instead be done according to the Eq. 3.10:
����������������,�������������������� + �������� = �������������� + ����2��+��������+������������������,������������ + ����ℎ����(3.10)
where ����2��+��������+������������������,������������ is the water, tar and particle content of the syngas (that are not measured separately).
Considering now the characteristic parameters of the gasification process, we have:
Equivalence ratio
���� =��2,������������/��2,����������ℎ���������������� (3.11)
Where the actual content of oxygen and the stoichiometric one are computed according to the equations 3.12 and 3.13 respectively:
��2,������������ = �������� [��2,������] (3.12)
��2,����������ℎ���������������� =���������������� (2,667��+8��+��−��) (3.13)
In which, C,H,N,S and O are the mass fractions of carbon, hydrogen, nitrogen, Sulphur and oxygen in the feedstock.
Cold Gas Efficiency
(3.14)
Specific Producer Gas energy
Char yield
����ℎ ] (3.15)
����ℎ���� =
����ℎ���� ���������������� (3.16)
Of course, all these parameters can be considered to be an index of the efficiency of the reactor. For what regards the char yield, a small value is wanted since its presence at the end of the gasification represent a loss in terms of energy potential, and moreover it must be disposed, producing a cost. A global char yield has been computed for each typology of gasified biomass (i.e. pellets and woodchips+bark) as the average of the single yields measured at each char discharge during all the tests with the same type of material and process conditions.
3.4 Performed gasification tests
Gasification tests have been performed with the aim of understanding the effect of bark content during a gasification process. The focus of this work is in fact to evaluate the possibility of implementation of biomass residues in a gasification plants, achieving in this way savings in terms of input biomass purchase. Moreover, the results of the gasification tests have been exploited for the calibration of a thermodynamic model used to simulate the gasification process of the compost out of specification (second residue evaluated).
The gasification tests have been performed with two different feedstock typology: woodchips and pellets. Pure woodchips have been used as reference material in order to have a comparison with the results in the case of different bark contents (pure woodchip, 30% bark content and 80% bark content) and moreover to understand the general behavior of the system. As mentioned in previous chapters, the torrefaction process has been evaluated as possible pretreatment process with the aim of enhancing the characteristics of a residual biomass.
This evaluation has been performed by means of performing gasification tests starting from standard pellets and successively with torrefied pellets. Torrefied pellets at two different torrefaction temperature have been employed during gasification tests (i.e at torrefaction temperatures equal to 250 and 270°C respectively).
During all the tests also the possibility of modulation of the air has been investigated, in order to find the best working conditions for the employed plant. For this purpose the secondary air (responsible for the conversion rate of the CO) has been set at four different values (i.e. 0, 17, 28 and 32 Nl m-1).
3.4.1 Woodchip and bark tests
First gasification tests have than been performed with woodchips and bark. The first test has been done using pure woodchip (with a bark content of 8%) in order to obtain a reference to be compared with the tests performed with bark blends. The other two cases analyzed have been performed with a total bark content of 30% and 80%. It must be said in advance that during the test performed with pure woodchips, the limits of the employed reactor have been found. From one side in fact, the lowest value of secondary air (i.e. 11 Nl/min) gave the worst results in terms of performances (CGE, char yield, LHV of the syngas and SGE), while the cycle performed at 26 Nl/min gave the best conditions in terms of CGE, SGE and LHV of the produced gas, but the fast char consumption detected suggested a dangerous condition in the combustion zone of the reactor. The characteristics of the feedstocks obtained by means of the weighted average of bark and woodchips for the different tests are shown in Table 20.
Table 20Characterization of the samples employed during the gasification tests (woodchips, woodchips with 30% and 80% bark content)
Woodchips Woodchips + Bark (30% blend)
Woodchips + Bark (80% blend)
moisture %wt 10.90 10.70 7.87 ash %wt 0.62 1.35 3.07
C %wt 43.83 44.16 46.12 H %wt 5.52 5.41 5.30 O %wt 38.83 38.02 37.16 N %wt 0.10 0.16 0.28 S %wt 0.20 0.20 0.19
HHV MJ/kg 17.44 17.51 18.13 LHV MJ/kg 15.97 16.06 16.78
Figure 25From left to right, samples of wood fraction without bark, 30% blend, 80% blend
The analysis of the measured parameters can start from the syngas composition in the different secondary air conditions, for each feedstock. Fig.26-28 show the syngas composition in terms of volumetric fraction for the pure woodchip, the 30% bark content and the 80% bark content respectively.
Pure woodchip

Figure 26Syngas composition in different secondary air conditions for the pure woodchip
Woodchips and 30 % barks blend
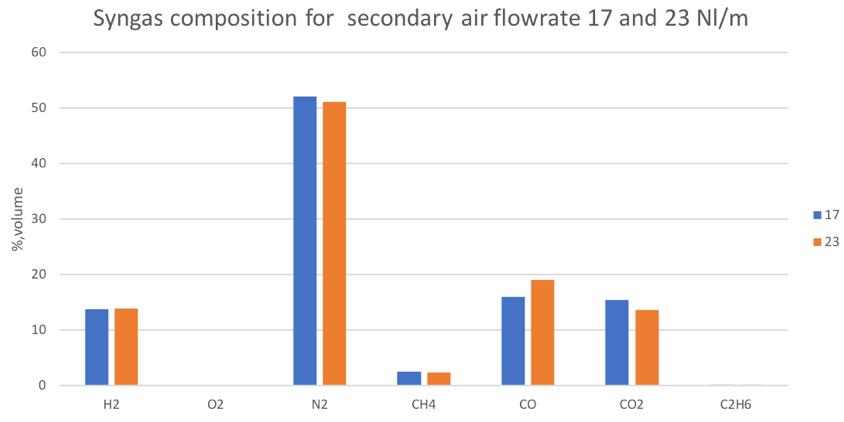
Figure 27Syngas composition in different secondary air conditions for the mix of woodchip and 30% bark
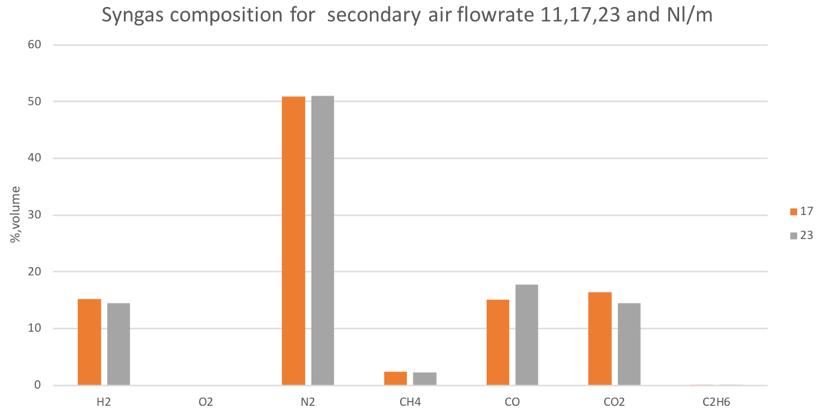
Figure 28Syngas composition in different secondary air conditions for the mix of woodchip and 80% bark
The general trend shown by each feedstock with the secondary air modulation is similar. A comparison of the syngas compositions between the three feedstocks in the same conditions is shown in Fig. 29-33 for the CO, H2,CH4,CO2 and N2 volume fractions respectively.
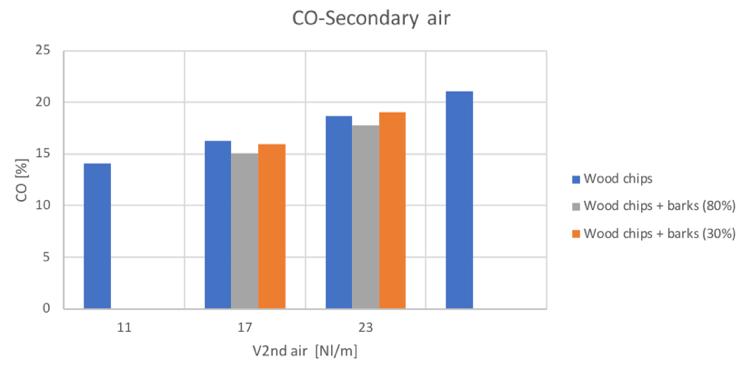
Figure 29CO volume percentage for different secondary air and feedstocks
Figure 30H2 volume percentage for different secondary air and feedstocks
Figure 31CH4 volume percentage for different secondary air and feedstocks
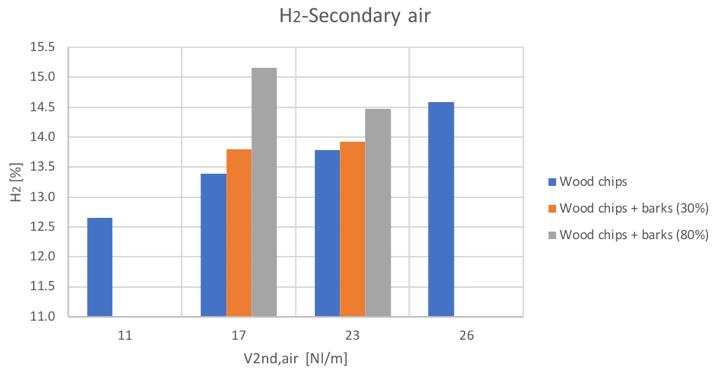
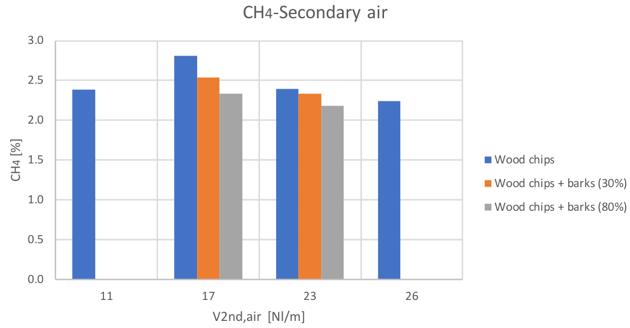
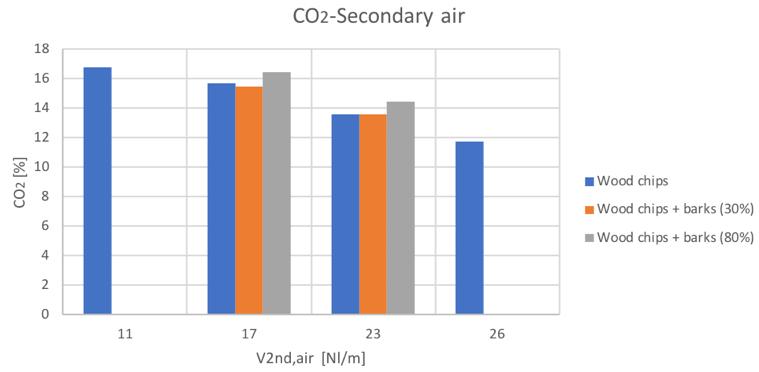
Figure 32CO2volume percentage for different secondary air and feedstocks
Figure 33N2volume percentage for different secondary air and feedstocks
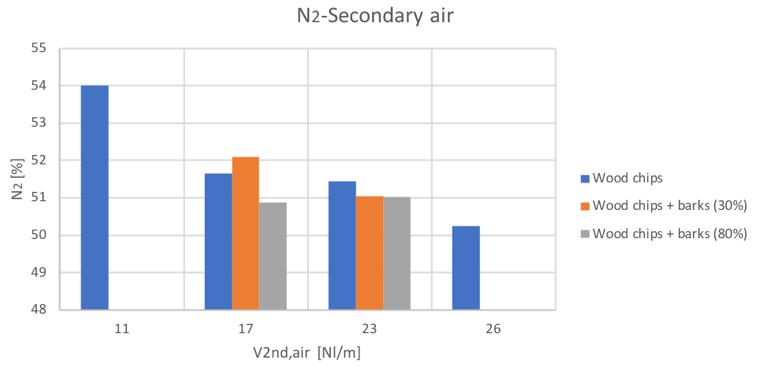
The general trends are comparable with the only exception of the hydrogen content in the case of the 80% bark content blend. Anyway, it can be seen a general increase of hydrogen and carbon monoxide with secondary air increase, while a decreasing conversion with higher secondary air feeding can be instead noticed for CH4 and CO2.
The equivalence ratio behavior respect to the secondary air flowrate presents a general increasing trend. From equation 3.11 it is in fact easy to understand that an increase of the air flowrate in the char conversion zone produces an increase of the actual fed oxygen. This behavior is shown in Fig.34:
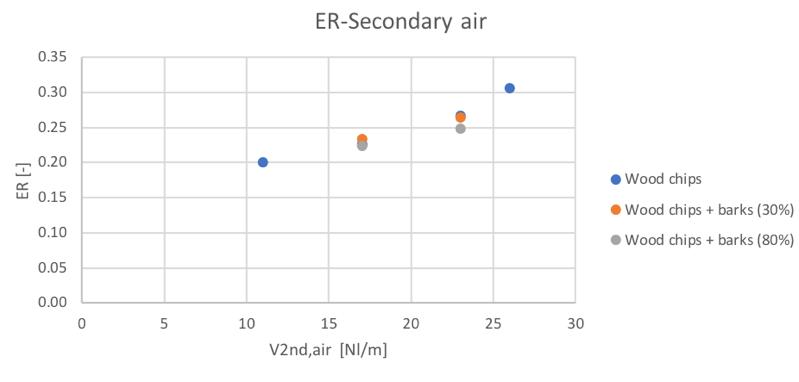
Figure 34Variation of the equivalence ratio with the secondary air
The similar composition of the three feedstocks ensure similar ER values in each secondary air condition, with a slightly smaller value in the case of 80% bark
As shown in Fig.35-36, the low heating value tends to increase together with the higher conversion into oxidable components in the producer gas.
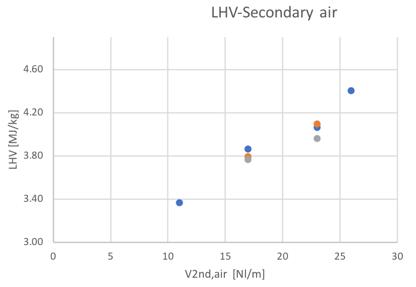
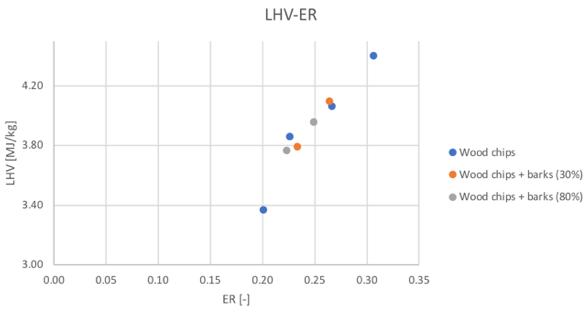
Figure 35and 36Low heating value for different feedstocks and Secondary air flowrate and ER
Considering the best detected condition of 23 Nl/min a slight increase of the LHV value can be noticed passing from the pure woodchip to the 30% content of bark (1%),while a reduction of the 2% have been obtained passing to the 80% bark content. The variability seems to be really negligible between tests.
As mentioned in the introduction paragraph of this chapter, the global performances of the gasification system can be evaluated on the base of the CGE, SGE and char yield. The results obtained during the gasification tests performed with woodchips and barks are reported in Fig.37-41.
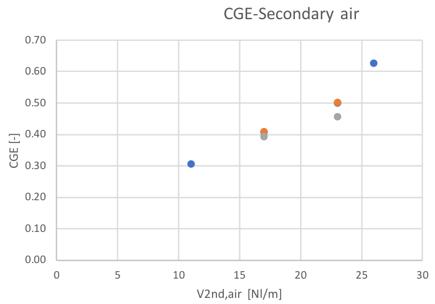

Figure 37and 38Cold gas efficiency value for different feedstocks and secondary air flowrate
The trends shown by the three different materials/blends are the same, and the only noticeable difference in terms of CGE can be seen in the case of the 80% content of bark for the 23 Nl/min condition, where a reduction of the 8% can be noticed. The increasing trend shown with the ER suggest a possible increase also for the bark with higher feeding of air.

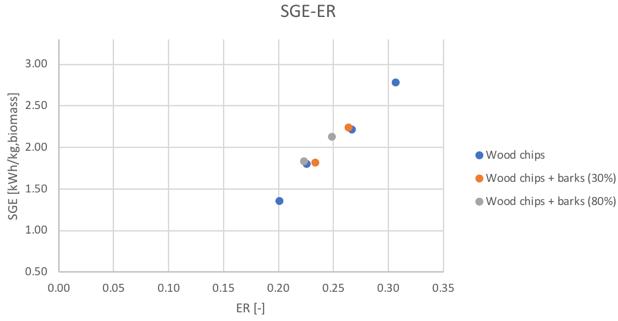
Figure 39and 40Specific producer gas energy value for different feedstocks and secondary air flowrate and ER
For what regards all the CGE, SGE and LHV parameters, a clear difference can be noticed in the case of the two “limit” conditions of the plant (i.e. 11 and 26 Nl/min secondary air flowrate). Finally, the trend of the char yield for the three feedstocks is shown in Fig. 41.

Figure 41Char yield obtained from the gasification tests for each feedstock at different secondary air flowrates
The char yield obtained during the tests seems to be comparable for the three feedstocks in the same plant conditions. In all the cases, an increase of the air feeding in the char conversion zone is translated in a smaller char yield. Thus a global decreasing trend has been obtained. A noticeable difference occurs in the optimal case of 23 NL/min flowrate in which an increase of the 61% can be found passing from the pure woodchip to the 80% bark content.
In order to compute a power balance for the gasification system, the gas cooling power can be computed according to Eq. 3.17:
− ����,��������������) (3.17)
where the ����,������������ is computed as the weighted average of the single values of each species. Moreover the energy not valorized by means of the char disposal can be than computed as the product of the char mass flowrate multiplied for an average value of LHV equal to 23 MJ/kg. Finally it is possible to access by difference, the thermodynamic losses through the reactor wall.
The Sankey diagrams in Fig.42-44 show the mass and power balances computed respectively according to Eq.3.10 and as indicated in paragraph 3.4.1.
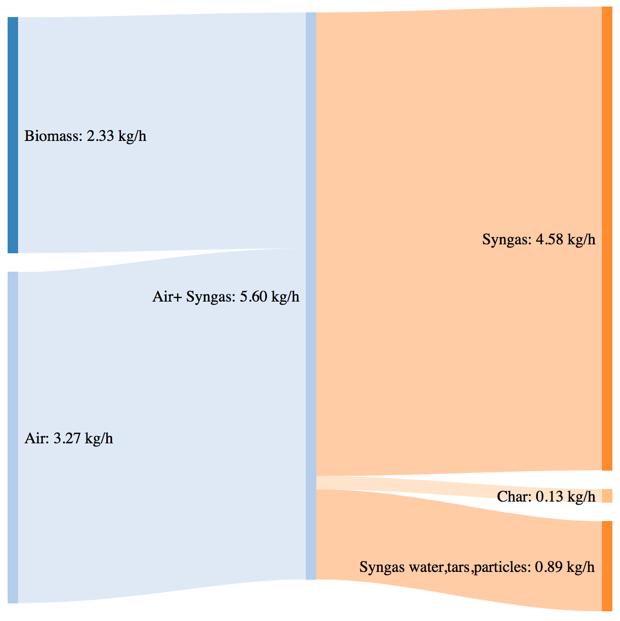
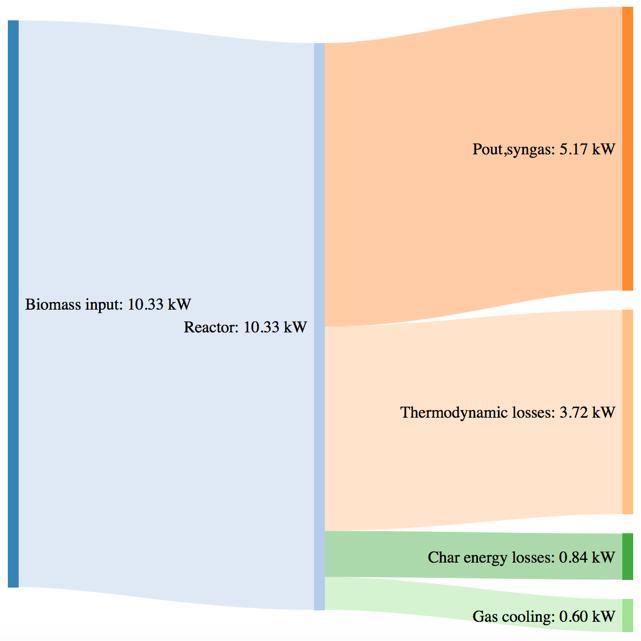
Figure 42Mass and power balance for the pure woodchip gasification tests
Figure 43Mass and power balance for the mix of woodchip and bartk at 30% blend gasification tests
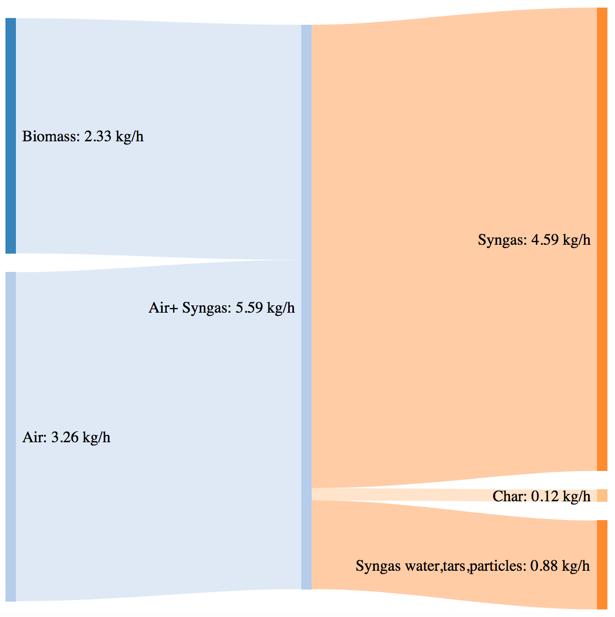

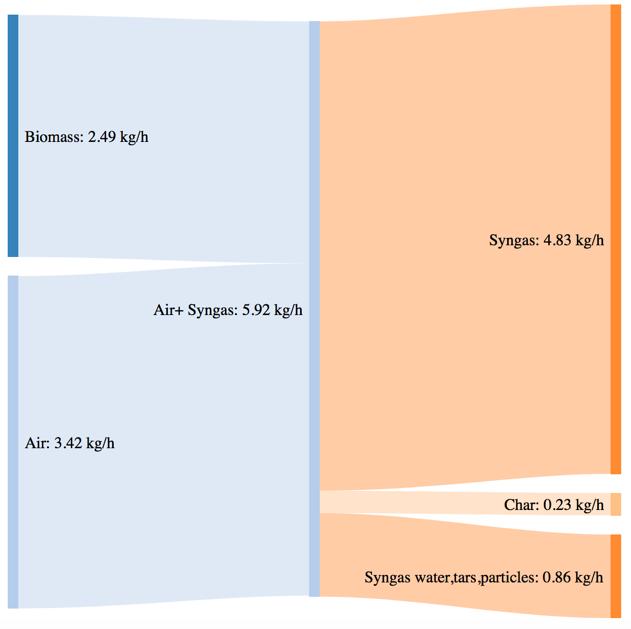
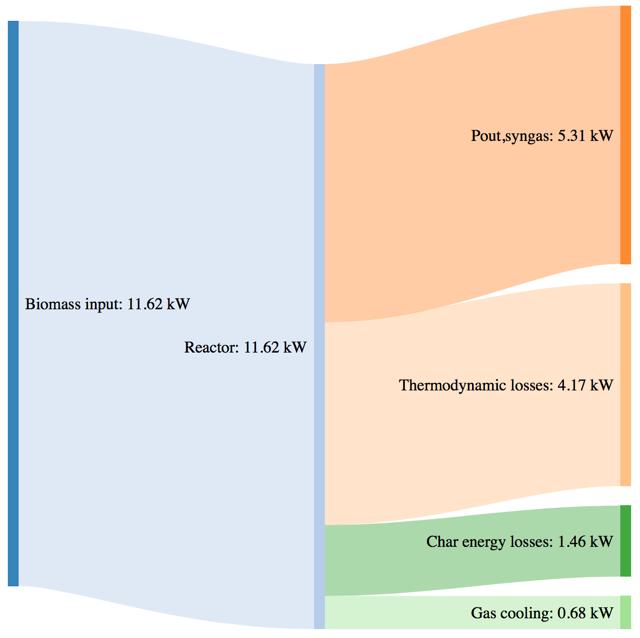
Figure 44Mass and power balance for the mix of woodchip and bartk at 80% blend gasification tests
As shown by CGE in the previous paragraph, the three performances of the system are comparable in the same secondary air feeding conditions. The noticeable difference in terms of char yield in the case of the 80% bark content is translated in a higher power loos due to the not valorized char energy content. The biomass consumption in the best working conditions tends to increase with an higher content of bark, but the power output of the syngas is not characterized by a proportional increase. This phenomenon is translated in a smaller value of CGE. Thermodynamic losses through the reactor wall are comparable for the three feedstocks utilization (corresponding to roughly 36% of the input power).
A resume of the performed tests with woodchips, 30% bark content blend and 80% content blend is shown in Table 21.
As mentioned in the introduction paragraph, the effect of the torrefaction pretreatment has been investigated by means of gasification of standard pellet (use as reference condition) proceding with torrefied pellets. The characteristics of the feedstock used for the tests (LHV and the elemental characterization) of the feedstocks are reported in Chapter 2 for the dry material, while the moisture content during the test (as received) and the LHV relative to this condition are shown in Table 22.
Table 22Characteristics of the pellet and torrefied pellet samples employed in the gasification tests
Standard pellet Torrefied perllet (Ttorrefaction 250°C) Torrefied perllet (Ttorrefaction 270°C)
moisture %wb 7.88 4.48 LHV MJ/kg 16.01 17.09 4.10 17.67
An example of the samples used during the tests is shown in Fig.45:
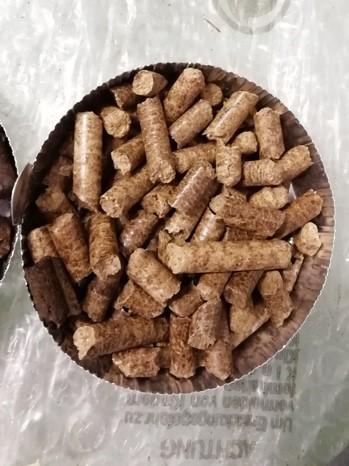
Figure 45Samples of a standard pellet and a torrefied pellet
The first noticeable effect of this secondary air modulation is the different conversion of ���� and ��2. Fig.46-48 shows the different syngas composition for each feedstock for different secondary air feeding.
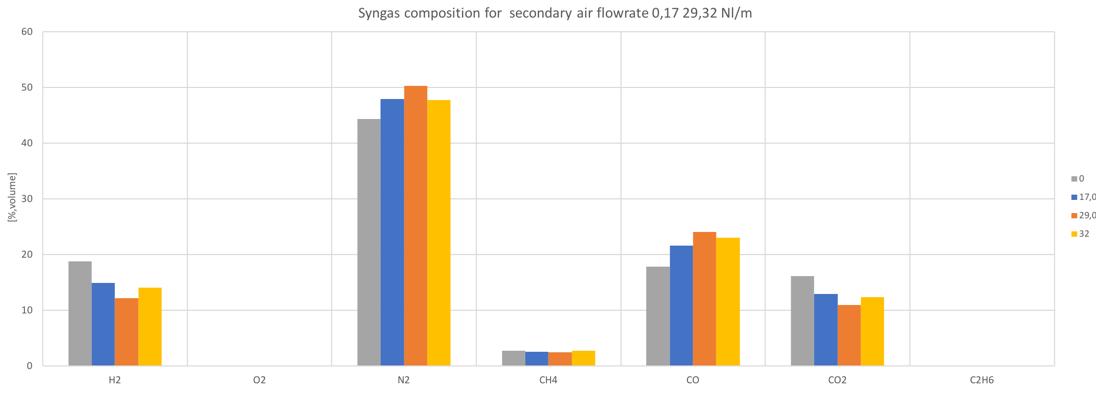
Figure 46 Syngas composition in different secondary air conditions for the standard pellet
Torrefied pellet (250°C)
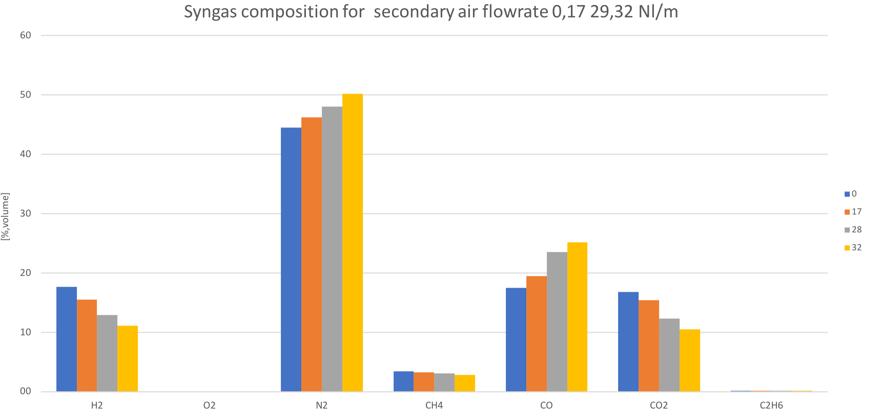
Figure 47Syngas composition for different secondary air, of torrefied pellet (Ttorrefaction=250°C)
Torrefied pellet (270°C)

Figure 48Syngas composition for different secondary air, of torrefied pellet (Ttorrefaction=270°C)
In all the cases, apart from the first one, similar trends for ���� and ��2 can be noticed. In particular, by increasing the secondary air flowrate, the conversion into ���� increases, while the ��2 decreases.
A first comparison between the three samples can be shown by means of the CO, H2, CO2, CH4 and N2 volume percentage as shown in Fig.49-52.
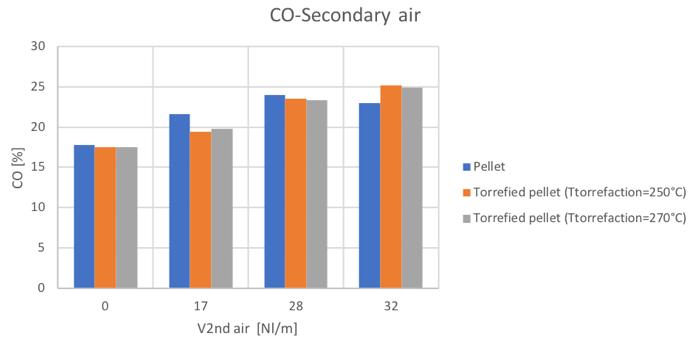
Figure49CO volume percentage for different secondary air and feedstocks
Figure 50H2volume percentage for different secondary air and feedstocks
Figure 51CO2volume percentage for different secondary air and feedstocks
Figure 52CH4volume percentage for different secondary air and feedstocks
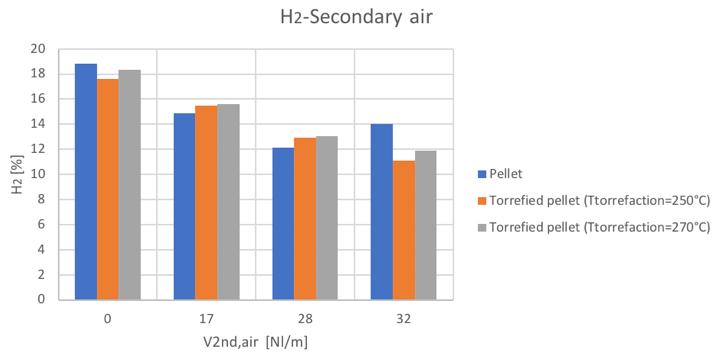
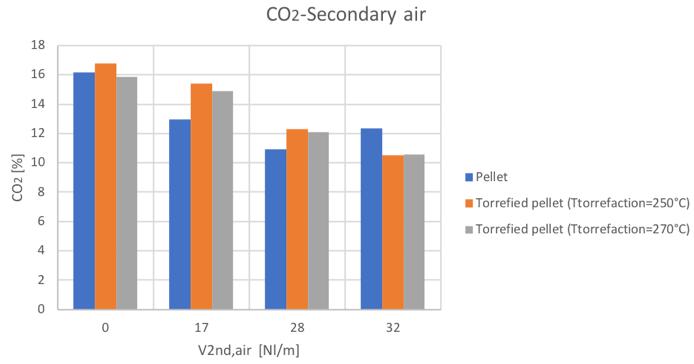
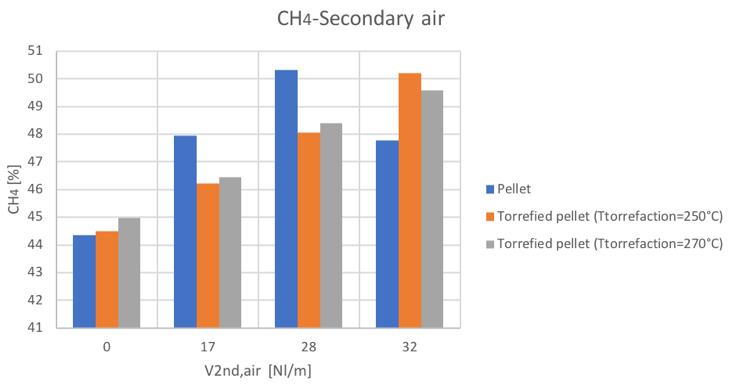
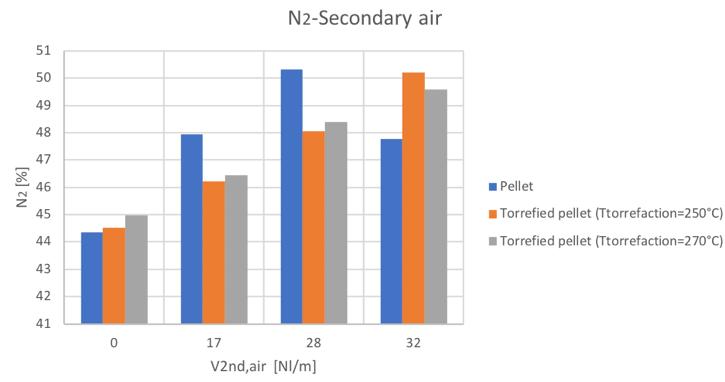
Figure 53N2volume percentage for different secondary air and feedstocks
As mentioned, the general increase of CO content in the syngas can be noticed by increasing the secondary air feeding. Also the CH4 tends to increase with secondary air feeding, not to mention the N2 whose presence is directly connected to air flowrate. A decreasing trend is instead shown by the H2 and CO2.
For what regards the equivalence ratio behavior respect the secondary air flowrate, a general increasing trend can be noticed (Fig.54).
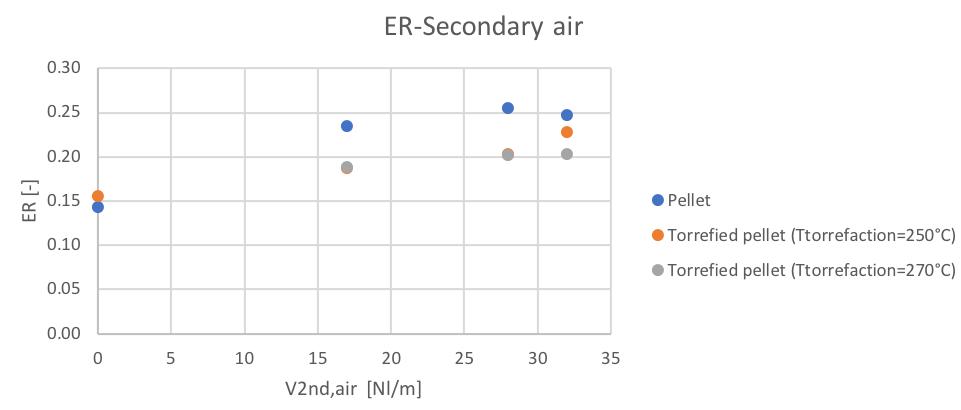
Figure 54Variation of the equivalence ratio with the secondary air
The low heating value obtained in the different conditions can be seen in Fig.55 and Fig.56:
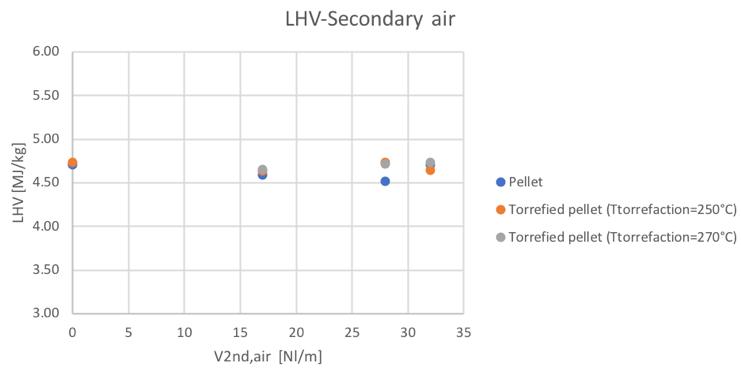
Figure 55Low heating value for different feedstocks and Secondary airflowrate
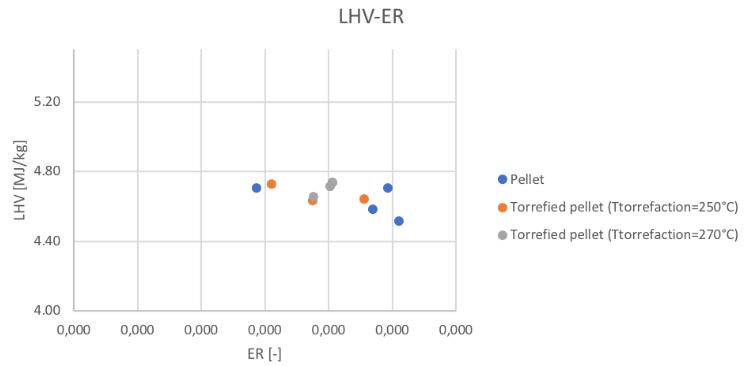
Figure 56Low heating value for different feedstocks and ER
It can be noticed the fact that no significant differences in the LHV value have been obtained. Considering now the parameters that give a representation of the efficiency of the reactor, Fig.57,58,59 and 60 show the trends of the cold gas efficiency and the specific producer gas energy with respect to the secondary air and ER value.
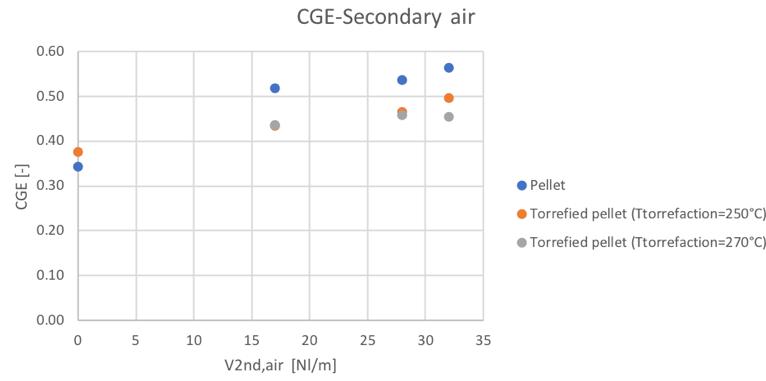
Figure 57Cold gas efficiency value for different feedstocks and secondary air flowrate
Figure 58Cold gas efficiencyvalue for different feedstocks and equivalence ratio
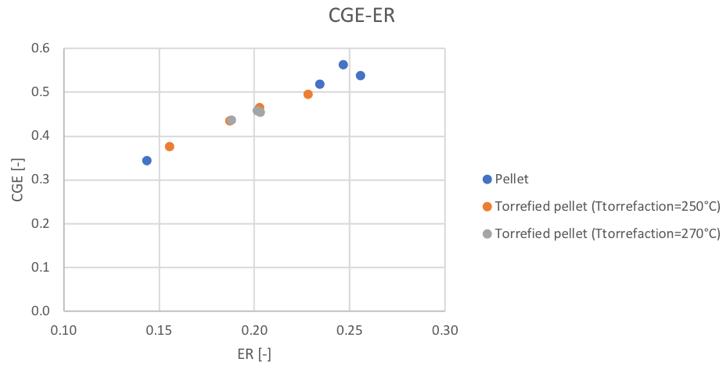
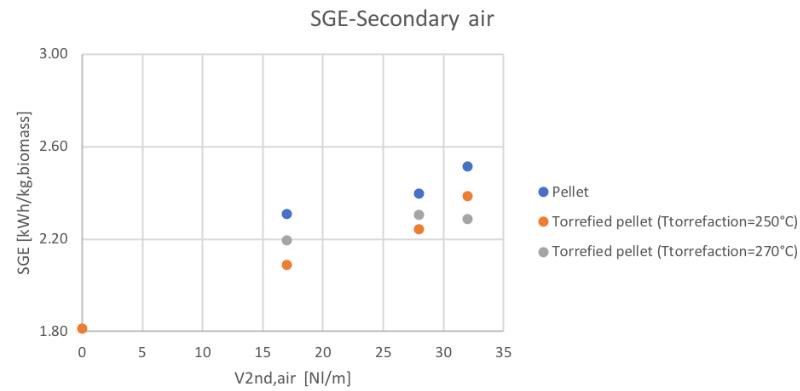
Figure 59Specific producer gas energy for different feedstocks and secondary air flowrate
Figure 60Specific producer gas energy for different feedstocks and equivalence ratio
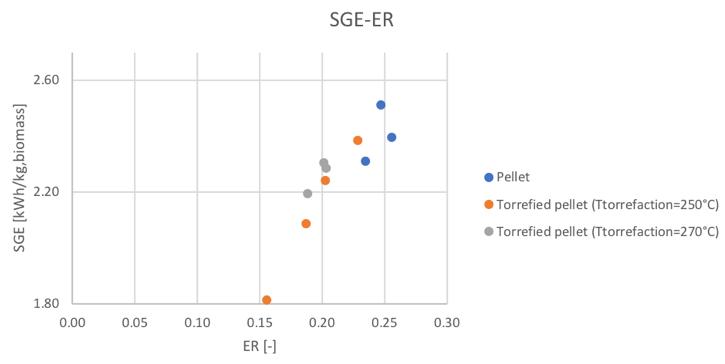
It can be noticed how the torrefaction pretreatment seems to produce not the desired effect during the gasification process. In particular, in the same condition of secondary air feeding, the CGE and SGE are smaller for the pre-treated pellets. But looking at the behavior respect the ER (considering that also the ER is different in the same secondary air conditions for the different materials) the linear trends suggest the fact that going toward higher values of equivalence ratios, also in the case of the torrefied materials, higher values of cold gas efficiency and specific gas energy could be reached.
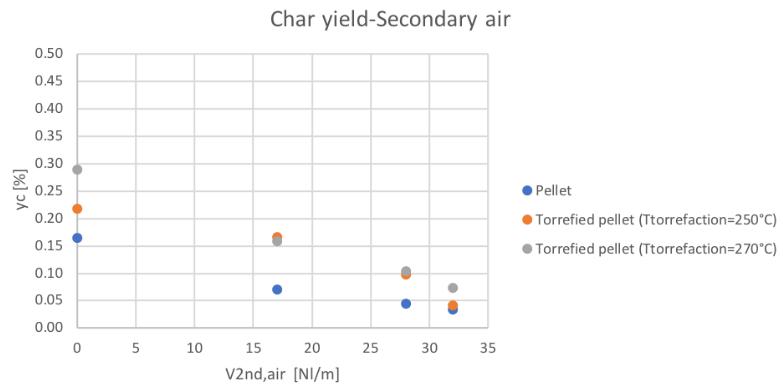
Figure 61Char yield for different feedstocks and secondary air conditions
Even the char yield is higher in the case of the pre-treated material producing from the practical point of view a management problem of the plant, since char disposal represents a cost. By the way, a global decreasing trend (opposite to the CGE and SGE) has been found increasing the secondary air feeding and thus the char conversion.
The mass and power balance for each feedstock are reported in Fig.62, 63 and 64 for the standard pellet, the torrefied pellet at 250°C and the torrefied pellet at 270°C respectively.

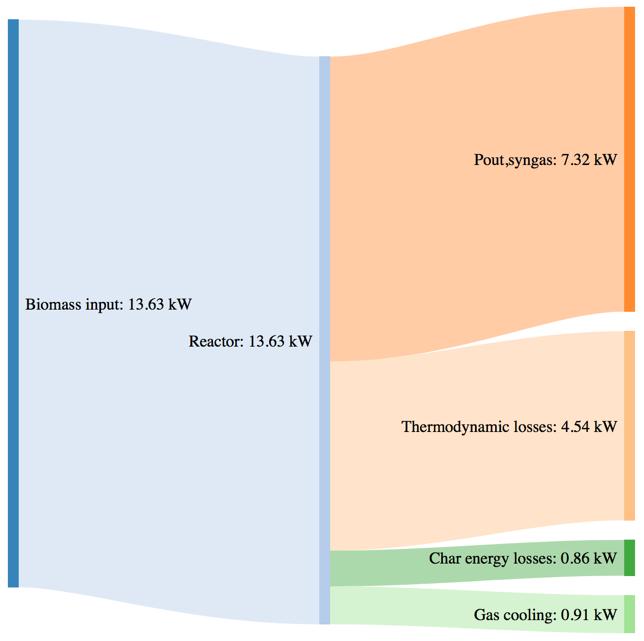
Figure 62Massand powerbalance for the standard pellet gasification tests
Figure 63Mass and power balance for the 250°C torrefied pellet gasification tests
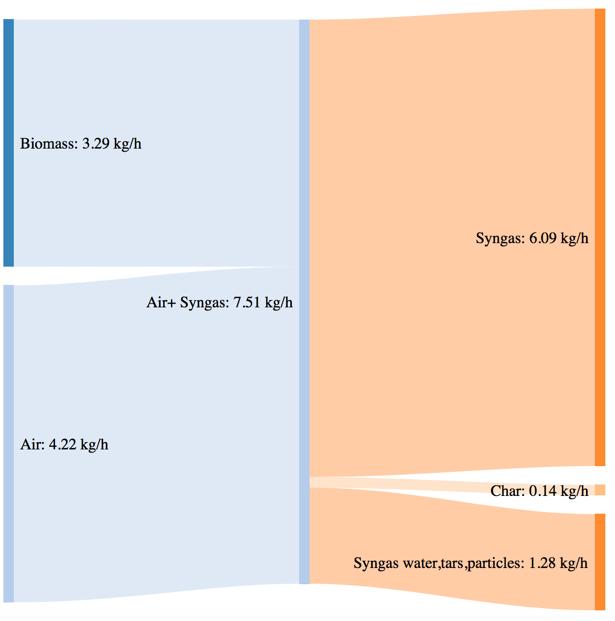
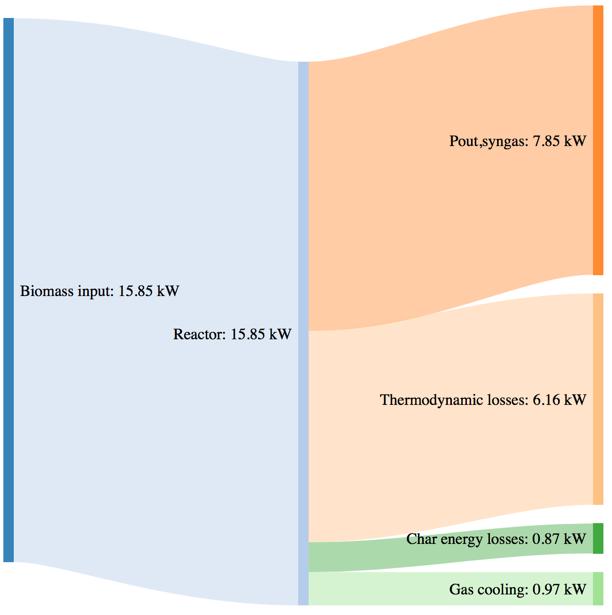
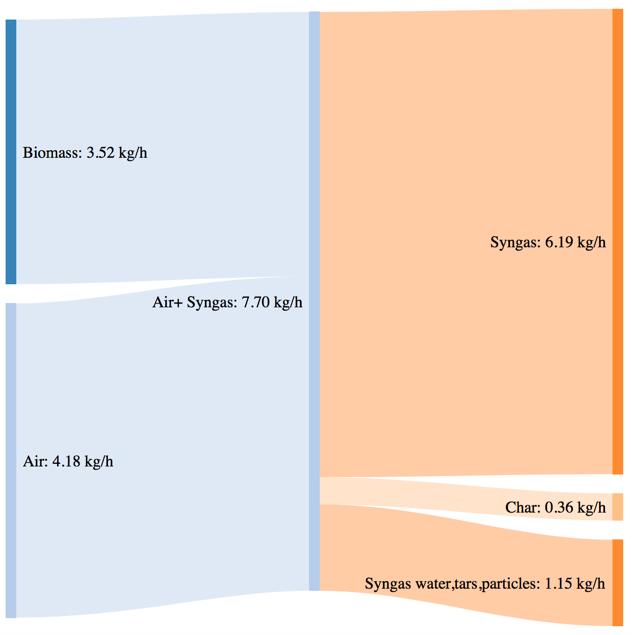
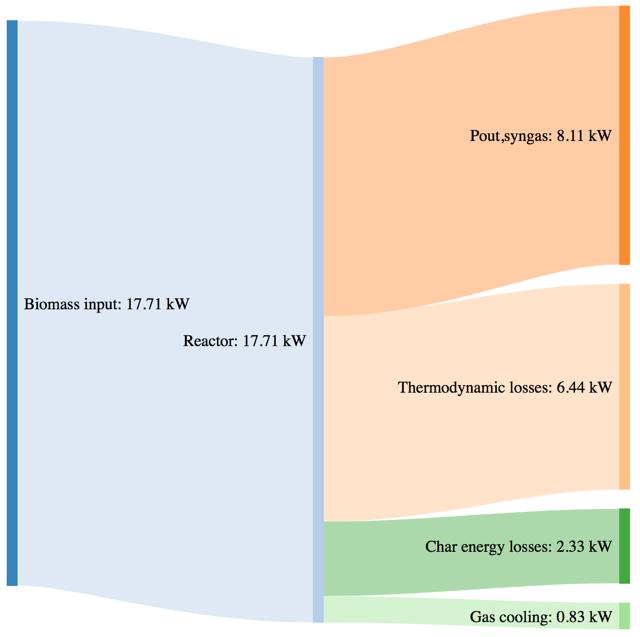
Figure 64Mass and power balance for the 270°C torrefied pellet gasification tests
The biomass consumption in the best working condition (corresponding to the highest value of CGE in each case), tends to increase passing from the standard pellet to the pretreated ones. As expressed by the CGE behavior, that is smaller in the case of torrefied pellets in the same working conditions (i.e. same secondary air flowrate) the higher energy input provided by the torrefied pellets in terms of higher LHV value is not translated in a proportional output power of the syngas. Moreover, the higher char yield leads, in the case of the pretreated samples, to an higher loss due to the not valorized energy content of the char.
The thermodynamic losses are in general comparable with the tests performed with woodchips and barks, but a slight variation can in this case be noticed passing from 33,3% (with respect to the input power) for the standard pellet, going to the 38,8% for the torrefied pellet at 250°C and 36,4% for the torrefied pellet at 270°C.
A resume of the performed tests with standard pellet and torrefied pellets is shown in Table 23.
A periodic formation of "bridges” in the reactor has been noticed with intervals of few minutes. The formation of this structures in the biomass bed may be related to the local pyrolysis of the biomass and can produce important issues for the correct air flow in the reactor and the obstruction of the piping for syngas transportation [28].
Possible solutions could involve the use of pneumatic hummers (employed at industrial level to avoid fouling of the boundle tubes in waste do energy plants); Maintenance operations performed on the system have shown that tars removement is not perfectly effective. The employment of diesel-fed scrubbers could increase the syngas cleaning effectiveness from this point of view.
Gasification tests with over-sieve fraction from anaerobic digestion plants (compost out of specification) have not been performed. Nonetheless, in order to have a preliminary assessment of the possible utilization of this material as feedstock in a gasification process, a thermodynamic equilibrium approach has been applied. The approach has been applied by means of the use of the software Cantera (through the commercial software MATLAB®). The model developed in Cantera, by means of the application of the equilibrium approach (briefly described in the section 3.5.1) has been calibrated on the base of the results obtained during the gasification tests performed with woodchips and pellets.
3.5.1 Equilibrium approach theory
As mentioned, the equilibrium approach is applied by means of the employment of the software Cantera. A brief description of the theory behind the equilibrium is presented in this section.
Considering a general reaction:
����+���� →����+���� (3.18)
where a, b, c and d are the stoichiometric coefficients, two rate of reactions can be considered (r1 and r2). In any case, the rate of the reaction r1 depends on the concentration of the reactants ( ���� �� ���������� ��) by means of a relation like the (3.19) [13]:
��1 =������������������ ���� �� ���� �� (3.19)
By considering the opposite direction for the reaction, we can consider a second rate r2 which will depend on the concentration of C and D:
��2 =������������������ ���� �� ���� �� (3.20)
Naturally, at the beginning of the reaction, the concentration of A and B is high, thus r1>r2 since the product concentration is still low. We can thus say that in these conditions, the reaction is not at equilibrium. Going on with the reaction (and the production of C and D) the condition of r1=r2 will be reached. In this conditions (equilibrium): Concentration of reactants and products is constant; r1=r2; The Gibbs free energy of the system is at the minimum;
Under equilibrium conditions we can write:
������������������ ���� �� ���� �� = ������������������ ���� �� ���� �� (3.21)
By means of the Arrhenius formula, the dependency of the constant k on the temperature T can be expressed:
�� =��0 exp(−
�� ����) (3.22)
Where A0 is a pre exponential constant, E is the activation energy for the reaction and R is the universal gas constant.
At this point, the equilibrium constant, given by the ratio of the foreword and backward constants can be writes an:
���� �� ���� �� ���� �� ���� �� (3.23)
The Gibbs free energy can be expressed as:
���� = ����− ������ (3.24)
Thus the variation of the Gibbs free energy can be computed as the enthalpy difference minus the product of the entropy difference multiplied for the temperature. By using the Gibbs free energy (which can be computed for each of the species in a gas mixture) it is possible to compute the equilibrium constant ����for a given temperature:
���� = exp(−
���� ����) (3.25)
The theory shown above is applied by means of the use of the software Cantera. The simulation of a gasification can be performed by means of the creation of a mixture of air in a quantity around 30% of the stoichiometric air and the biomass. The software finds the equilibrium of the mixture at the chosen temperature (750°C). The chosen temperature have been set according to the similarity of the obtained syngas compositions with respect to the experimental results (obtained with woodchip and pellet). As mentioned, the results of the equilibrium have been calibrated by means of the application of correction coefficients. The coefficients have been computed as the ratio between the molar fraction of each specie (H2, N2, CO, CO2, O2, CH4 and C2H6) obtained from the experimental tests and the one obtained from the simulation with the software.
3.5.2 Simulation cases
In this section, the syngas composition obtained by means of the application of the procedure described in the section 3.5.1 is presented for the over sieve material. Starting from the analysis of the different fractions of the over-sieve material (compost out of specification) shown in Table 16, different cases have been evaluated. In particular, the possibility of the separation of some of the fractions starting from raw material have been considered. The aim of the separation could be the possibility to achieve a better quality in terms of higher LHV and smaller content of ashes (as explained in the chapter relative to the characterization of the materials, some of the fractions present in the compost out of specification exhibit an high value of ash content, some are instead completely inert). The characteristics of each configuration have been obtained starting from the initial weight fraction of each single material. The weight fractions have been recomputed for each specific case according to the separation of one or more material fraction. The cases, evaluated starting from the separation of different fractions are the following ones:
Case 1: simulation of the gasification of the material as it is
(compost out of specification)
The first analyzed case for the energy valorization of the compost out of specification has been the one of the material as it is (composed by a lignocellulosic fraction, an inert fraction, a plastic fraction and a fine fraction). The composition of the material as it is, is reported in Table 24.
Table 24Elemental characterization of the compost out of specification as it is
Material as it is
moisture %wb 13.73 ash %wt 37.27
C %wt 28.54 H %wt 3.83 O %wt 15.71 N %wt 0.71 S %wt 0.21
LHV MJ/kg 9.48
The results of the gasification simulation obtained starting from the composition shown in Table 24 by means of the application of the procedure described in the section 3.5.1 are shown in Table 25.
Table 25 Syngas composition obtained from the equilibrium simulation for the compost out of specification as it is
H2 O2 N2 CH4 CO CO2 C2H6 14.67 0.00 52.64 2.97 17.29 11.92 0.18
The LHV of the syngas obtained as the weighted average (weighting on the mass fractions) of each oxidable specie is equal to 4.31 MJ/kg.
Case 2: separation of the plastic and the fine fractions
In this case it has been considered the possibility of separation of both the plastic fraction and the fine fractions. The composition of the material obtained from the separation of those fractions is shown in Table 26:
Ligno cell with inerts
moisture %wt 12.80 ash %wt 40.32
C %wt 27.30 H %wt 3.55 O %wt 15.22 N %wt 0.52 S %wt 0.28
LHV MJ/kg 8.63
The composition of the syngas obtained from the gasification simulation starting from the elemental characterization in Table 26 is shown in Table 27.
Table 27Syngas composition obtained from the equilibrium simulation for the compost out of specification without fine and plastic fraction
H2 O2 N2 CH4 CO CO2 C2H6 14.43 0 52.62 2.98 17.62 12.00 0.18
The value of the LHV, computed according to the same procedure proposed for case 1, is in the case 2 equal to 4.31 MJ/kg.
Case 3: separation of the plastic fraction It must be highlighted the fact that the separation of the plastic fraction could just have the aim of obtaining a material admitted for the production of RDF “End of Waste” (CSS-combustibile) minimizing the possibility of presence of Cl (chlorine), whose presence must be strongly limited since it is precursor of PCDD/F. The composition of the material obtained from the separation of the plastic fraction is shown in Table 28.
Table 28Elemental characterization of the compost out of specification without plastic fraction
Ligno cell with inert and fine
moisture %wt 13.40 ash %wt 39.90
C %wt 27.04 H %wt 3.50 O %wt 15.26 N %wt 0.61 S %wt 0.29
LHV MJ/kg 8.48
As expected, a reduction of the LHV value can be noticed in Table 28 in comparison with the case 1 (material as it is). Table 29 shows the composition of the syngas obtained from the gasification simulation for the material considered in Case 3.
Table 29 Syngas composition obtained from the equilibrium simulation for the compost out of specification without plastic fraction
H2 O2 N2 CH4 CO CO2 C2H6 14.55 0.00 52.40 2.85 17.36 12.29 0.16
The obtained LHV is in Case 3 equal to 4.3 MJ/kg.
Case 4: Material as it is without inert
The material in this case is supposed to be obtained with just the separation, by means of a ballistic separator, of the heaviest inert. The aim of this procedure is to avoid the presence of an inert material during a gasification process (whose presence is responsible for a reduction of the LHV of the material). The separation of the inert fraction have been evaluated also from economic point of view in Chapter 4. The composition of the material obtained from the separation of the inert fraction is shown in Table 30.
Table 30Elemental characterization of the compost out of specification without inert fraction
Material without inert
moisture %wt 17.69 ash %wt 18.53
C %wt 37.14 H %wt 4.98 O %wt 20.45 N %wt 0.92 S %wt 0.28
LHV MJ/kg 12.34
In Table 30, it can be noticed how an evident increase of the material (after the separation) have been obtained. Table 31 shows the composition of the syngas obtained from the gasification simulation for the material considered in Case 4.
H2 O2 N2 CH4 CO CO2 C2H6 14.20 0.00 53.09 3.23 18.09 11.42 0.22
The obtained LHV for the syngas composition obtained in Case4 is equal to 4.42 MJ/kg.
Case 5: Separation of the plastic and inert fraction
By means of the combined effect of a ballistic separator and an aeraulic separator, the plastic fraction and the heaviest inert should be taken away. The aim of the separation of the plastic fraction s explained in the Case 3. The same stands for the separation of the inert fraction as in Case 4. The composition of the material obtained from the separation of the plastic and inert fractions is shown in Table 32.
Table 32Elemental characterization of the compost out of specification without inert and plastic fraction
Ligno cellulosic + fine fraction
moisture %wt 18.55 ash %wt 20.75
C %wt 35.15 H %wt 4.55 O %wt 19.84 N %wt 0.79 S %wt 0.37
LHV MJ/kg 11.18
Table 33 shows the composition of the syngas obtained from the gasification simulation for the material considered in Case 5.
Table 33Syngas composition obtained from the equilibrium simulation for the compost out of specification without inert and plastic fraction
H2 O2 N2 CH4 CO CO2 C2H6 14.20 0.00 52.79 3.06 17.99 11.84 0.20
The obtained value of LHV of the syngas obtained in Case 5 is equal to 4.34 MJ/kg.
The best conditions in terms of ash content and heating value seems to be obtained in Case 4 and 5, thus the ones created by separating the inert fraction of bigger dimensions. Of course this separation of some fraction in the material needs to be evaluated from the economic point of view.
It is crucial to highlight the fact that the analysis proposed in sections 3.5.1 and 3.5.2 are purely theoretical. The real utilization of this material (compost out of specification) in a gasification plant should be evaluated on the base of experimental tests in order to draw more reliable conclusions from. In particular, the high ash content often represents a plant management problem in existing plants. This aspect could be investigated also by means of deeper analysis performed on the ashes present in the material. Moreover, the heterogeneous nature of the material, coupled with the presence of plastics could lead to the necessity of further gas cleaning systems (i.e. Scrubbers for SOx treatment, fabric filters for the predictable high particle filtration etc).
80


