10 minute read
Chapter 4


4.1 Economic analysis
A technical and economic analysis is proposed in this chapter, with the aim of an evaluation of the feasibility of the energy valorisation of the residues under investigation. The calculation procedure has been performed by means of using a tool developed by the IDM-Alto Adige (Innovation Development Marketing) for the project “Wood up” concerning the possibility of the char valorisation downstream of the gasification plants already existing in South Tyrol [32]. The tool implements all the benchmark data collected in the already existing plants in the region, thus the economic analysis have been performed considering the possibility of exploiting an existing configuration. Three technologies, using woodchip as input fuel, have been considered.
Advertisement
4.2 Calculation procedure adopted for the economic evaluation
A common methodology has been applied in the case of all the residues in order to have an estimation of the input parameter needed by the employed tool (i.e.
kgbiomass/kWhel). As first step, the actual average biomass flowrate in [kg/s] has been computed from the benchmark data of annual consumption of biomass (������������������������������������[��]) and yearly working hours ℎ��������:
ℎ�������� 1000 3600 [���� �� ] (4.1)
Imposing a cold gas efficiency CGEactual for a medium size plant equal to 0.8 and considering a low heating value of the woodchip ������������������ of the actual plant equal to 16 MJ/kg, the input power for the benchmark case and the electric efficiency can be computed:
������,��������������,������������ = ����������������,������������ ������������������ [����] (4.2)
(4.3)
The need syngas mass flowrate can be computed, assuming an heating value equal to 4.5 MJ/kg, as:
������ ������������������ 1000 [
���� �� ] (4.4)
In order to keep the same plant output and considering (from the gasification tests performed with a biomass residue) a reduction of the CGE of 8% respect the benchmark case, the residue (mix of bark and woodchip and sieving material from digestor) flowrate to be fed to the plant is:
���� �� ] (4.5)
Thus the annual residue request is:
ℎ�������� 1000 3600 [��/��������] (4.6)
And finally the input parameter expressing the needed feedstock biomass to feed the plant per unit of electric kWh is:
���� ����ℎ
����������,�������������� ����,����,������������ (4.7)
Where ����,����,������������ is the annual electric energy produced by the plant.
Having this parameters, the economic analysis can be performed with the aim of the calculation is to obtain the net cash flow, composed by the following voices:
Annual incomes
Incetivated electric energy; Electric energy sold without incentives; Thermal energy sold.
Investment: total cost of the plant, computed starting from the specific cost of the chosen technology and accounting for the number of modules used plus the cost of added technologies (dryers and ballistic separator for the case study of the compost out of specification).
Annual operational costs
Personnel cost: it is computed starting from the benchmark data obtained from plant interviews and expressed in terms of €/kWhel produced; Insurance: from benchmark data and expressed in terms of €/year; GSE (gestore servizi elettrici) administration procedures: from benchmark data and expressed in terms of €/year; Maintenance: expressed as specific cost per unit of produced electric energy €/kWhel; Fuel cost: expressed as €/t;
Mortgage cost: accounting for the fact that each instalment is composed by a capital component and an interest one. Interests are computed on the base of a constant rate, multiplied in each period for the remaining mortgage amount to be payed.
It must also be highlighted the fact that each year, the costs sustained by the plant and the price of the sold energy (earnings) are actualized by means of the consideration of an inflation rate as:
����������������,�� =����������������������∗(1+������������������������)
Where ���������� is the annual inflation rate and n the year (thus accounting for a compound interest).
The following data have been taken constant for all the considered cases: Percentage of own capital (equity) 50% Bank rate 3.5% Mortgage duration 10 years; Inflation rate 1.5% Heat power sale price 80 €/MWh (and 40 % of the produced heat valorisation); Electric energy sale price 56 €/MWh (average weighted value in the three national hour slots); Duration of the investment 20 years.
For the production of ash/char after the gasification process, the char yield declared in the benchmark dates has been considered as starting value. The amount of ashes has than been added to that value. Thus the annual char production has been estimated as the sum of the ash content of the mixture and the part given by the char yield percentage considered. In the case of the bark utilization instead, the char yield declared by the plant has been increased of the 60% according to the gasification results obtained in the laboratory and accounting for the fact that no modification in the plant would be made inserting barks.
The analyzed cases are: Introduction of barks in an existing plant switched on in 2012, after the end of incentives (15 years); Gasification of bark and woodchips from the beginning in the case of incentive absence; Gasification of the over-sieve material (compost out of specification) with and without the separation of the inert fraction (by means of a ballistic separator).
In this section, the minimum amount of incentive needed to reach an economic attractive investment condition for each technology and each material have been also evaluated.
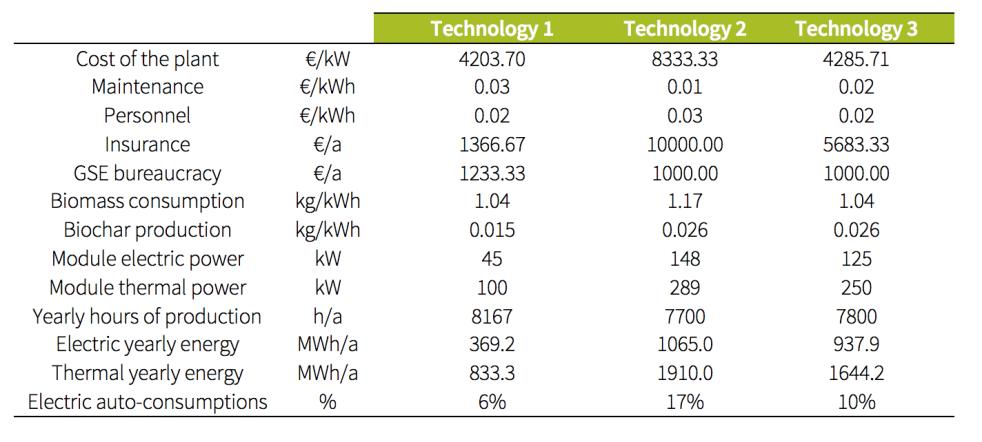
Table 34 shows the benchmark data for each considered technology.
Table 34Benchmark data for each type of technology chosen for the analysis [31]
The cost of biochar disposal is considered equal to 150 €/t, while according to data reported in the IDM paperwork an average price of the biomass equal to 94 €/t is considered (accounting for the purchase of a high quality and already dried woodchip).
4.3 Results of the analysis
The case of bark introduction after incentives ending with the aim of obtaining strong savings for the fuel purchase during the years of incentives absence have been evaluated. Fig. 65,66 and 67 show the results of the economic analysis performed according to the methodology described in the section 4.2, in terms of cumulated cash flow, for the technologies 1,2 and 3 respectively:

Figure 65Technology1
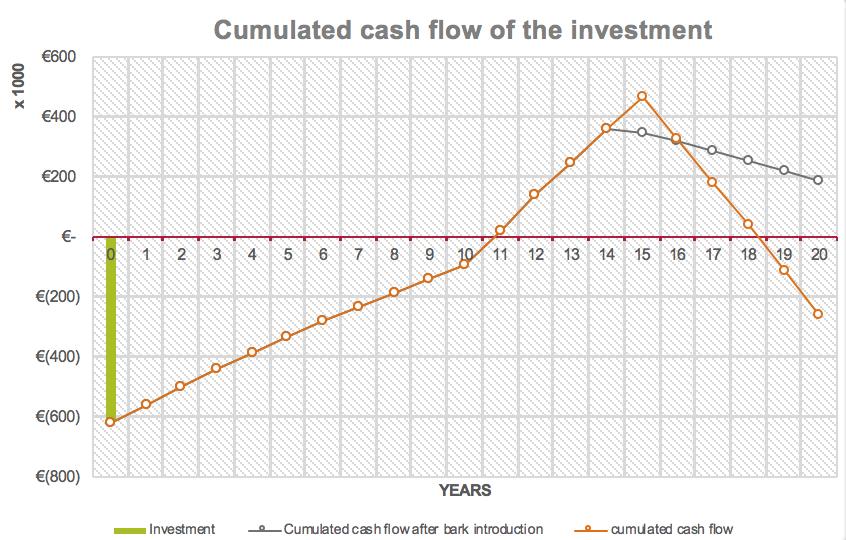
Figure 66Technology 2
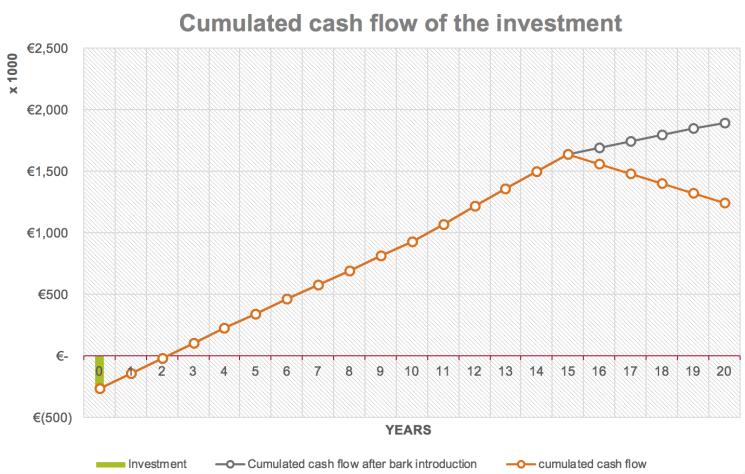
Figure 67Technology 3
It can be noticed how, in presence of incentives (that for the chosen class of power of the plant was equal to 280 €/MWh) with all the technologies, the plant is payed back. In particular, technology 1 and 3 seems to be really competitive and attractive (Fig.65 and 67). The high cost of maintenance, biochar disposal and biomass cost produce a strong reduction of the incomes and thus a decreasing trend can be noticed during the last five years of plant expected life. For this purpose, the introduction of a 80% bark+ woodchip blend in the last five years of plant life, thus decreasing drastically the fuel cost seems to have a beneficial effect even if an additional investment for a dryer is needed (whose cost have been estimated starting from a unitary cost of 800 €/kWel according to information directly received from the company Spanner Re). As already explained, the biochar production has been increased in order to take into account the different biomass nature starting from the data obtained in the laboratory.
In next case study the possibility of employment of the bark and woodchip mixture in a plant from the beginning of his life has been considered. The
evaluation has been performed considering the fact that at the state of the art no incentives are present. For this reason, the value of minimum incentives that could guarantee a reasonable payback time has been also found.
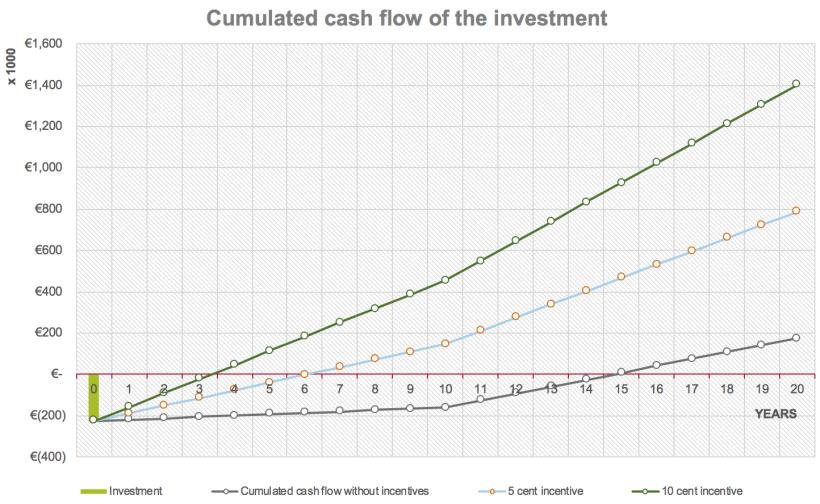
Figure 68Case of residues introduction from the beginning, technology 1
Figure 69Case of residues introduction from the beginning, technology 2
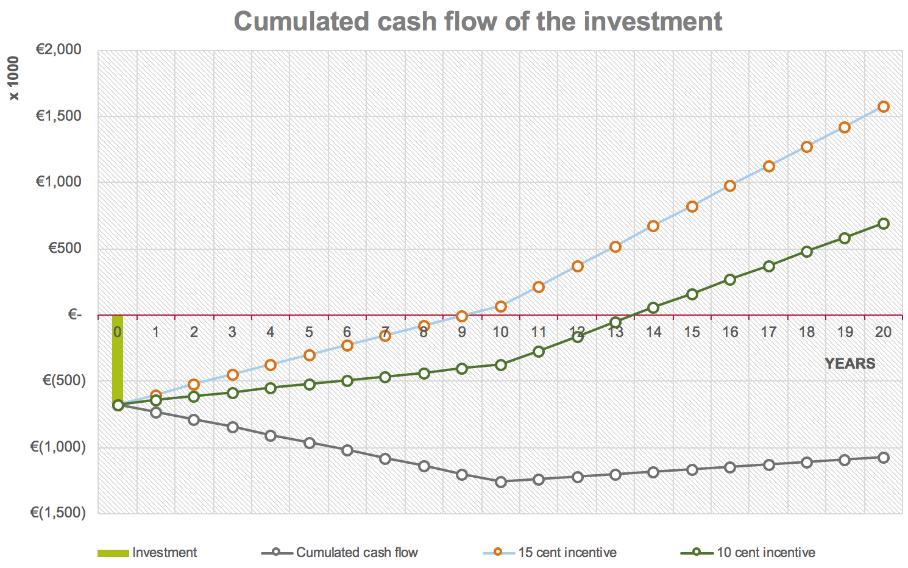
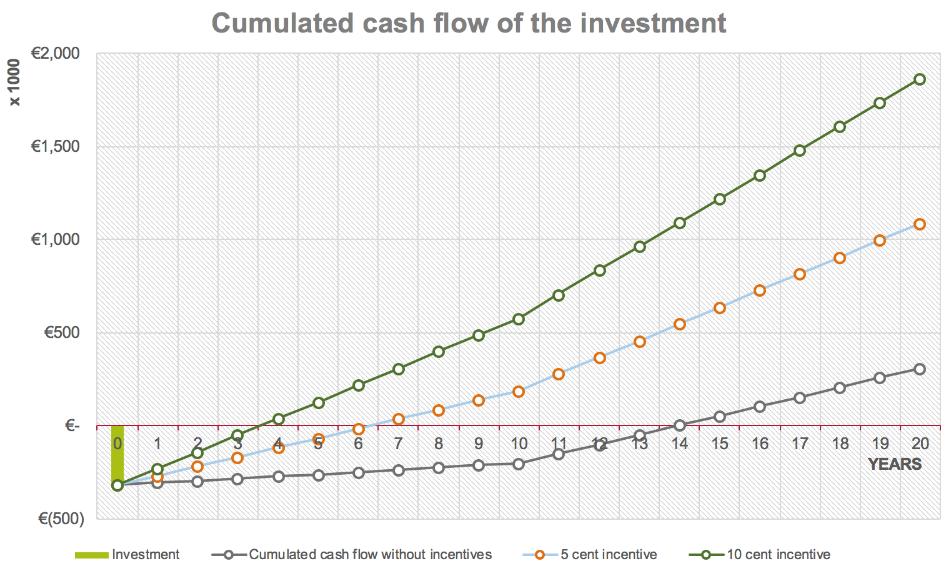
Figure 70Case of residues introduction from the beginning, technology 3
Even in this case a strong difference between two of the three technologies has been found (technology 2 is never payed back during the plant life without incentives). The result of the analysis shows how in the case of the employment of a residual biomass, 2 of the 3 technologies ensure the payback of the plant, which anyway occurs in the last years of the plant useful life. The introduction of a much more smaller incentive respect last years (0,05 and 0.10 €/kWhel have been considered for the most favorable technologies and up to 0.15 for the most expensive one) ensures instead the possibility of a reasonable payback time. In the case of an incentive of 0.05 €/kWh the payback occurs for 6-7 years and going up to 0.1 €/ kWhel the payback time becomes comparable with the actual condition of existing plants already exploiting incentives (0.28 €/ kWhel). It can be noticed how most expensive technologies ensure reasonable investment conditions just with higher values of incentives (Fig. 69).
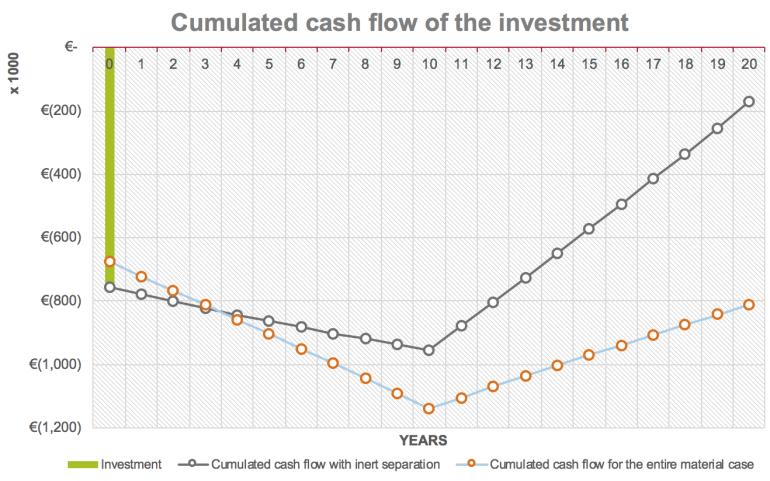
Compost out of specification employment case
As shown in the previous chapter, the most convenient case (from the energetic point of view) in the utilization of this material seems to be the one of inert separation. Thus the economic evaluation has been performed considering in the first case the entire material, and in the second case the separation of just the inert fraction. A first comparison between the two cases is shown in Fig.71-73.
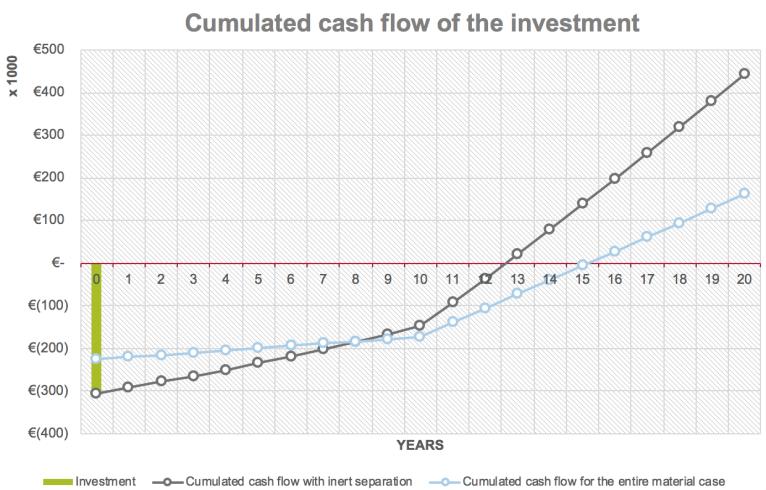
Figure 71Comparison between entire material and inert separation case with technology 1
Figure 72Comparison between entire material and inert separation case with technology 2
Figure 73Comparison between entire material and inert separation case with technology 3
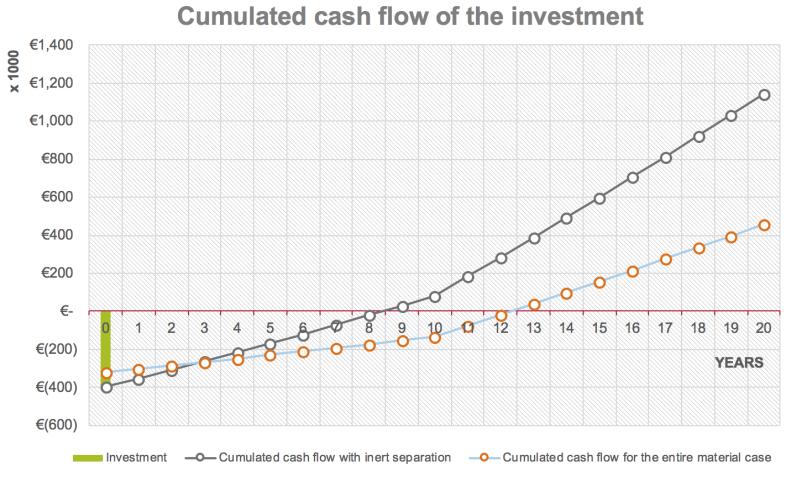
The separation of the inert part has been considered by means of the employment of a ballistic separator. The analysis considers a separator (with a unitary cost for the entire module of 160,000 €).
It can be noticed how, according to the analysis, the separation of the inert fraction is always positive in terms of economic results. This could be explained by the following main reasons: The inert separation ensures an increase of the LHV and a decrease of the ashes; The smaller ash presence (ashes in terms also of inert component) produces a reduction of the final biochar disposal. It must be taken into account in fact that although the separation have a cost in terms of initial investment and power supply, the disposal of the separated inert have a cost of 50 €/t, while if the inert fraction takes part into the gasification process, the final disposal will cost 150 €/t.
The consideration of minimum incentives that could be ensured to this plants have been applied also in the case of this residue. The results of the economic analysis are shown, in terms of cumulated cash flow, in Fig.74,75 and 76 for the technologies 1,2 and 3 respectively.
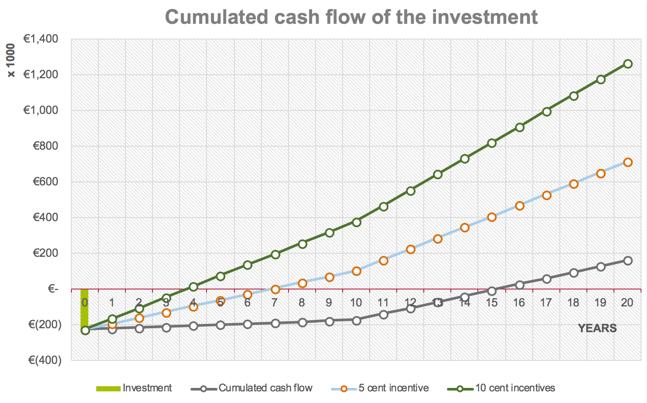
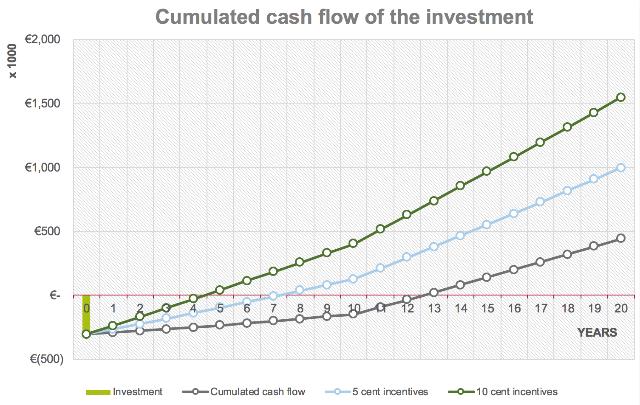
Figure 74Investment results in the case of entire material (left) and material without inert fraction (right) with technology 1 considering minimum incentives
Figure 75Investment results in the case of entire material (left) and material without inert fraction (right) with technology 2 considering minimum incentives
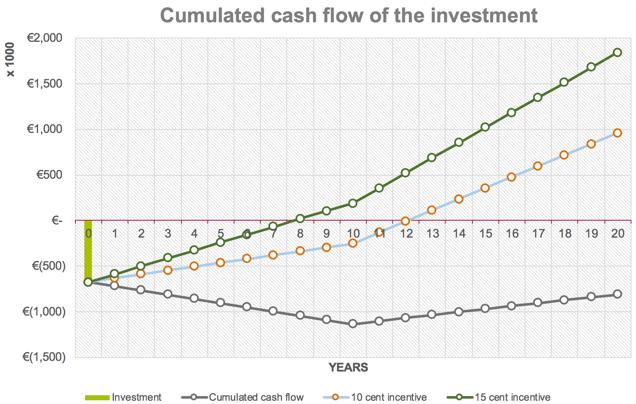
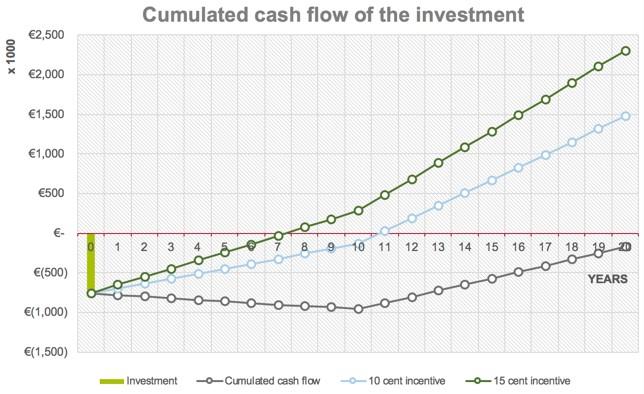
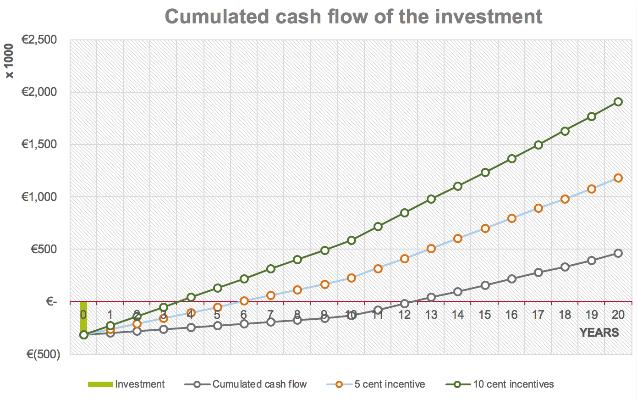
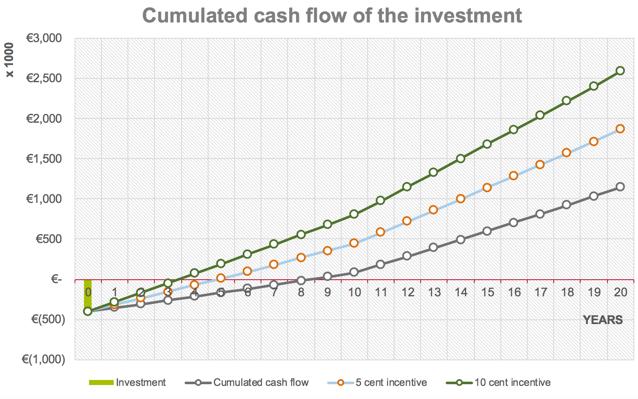
Figure 76Investment results in the case of entire material (left) and material without inert fraction (right) with technology 3 considering minimum incentives
It can be noticed how the considerations expressed for the bark mixture stands also in this case. The two cases (with or without inert separation) are comparable on the long term. The introduction of small incentives (0.05 and 0.10 €/kWhel) would produce drastic reduction of the payback periods in the case of technologies 1 and 3, which could anyway be profitable (but not attractive). Technology 2 seems to be affordable just in the case of higher incentives values (0.15 €/ kWhel).
Finally, it must be highlighted the fact that this material is actually a waste product disposed in landfill, thus this kind of energy valorization could produce not only economic advantages for anaerobic digestion plants owners treating the municipal organic fraction, but could also drastically reduce the amount of landfill disposal of more than 50%.
91


