Table 24: Clarence Valley population projections by growth scenario and small area Low Small area
2021
2041
Medium Growth 2021
2041
High Growth 2021
2041
Growth
Angourie - Yamba
7,115
7,424
309
7,108
7,994
886
7,051
8,562
1,511
Ashby - Iluka - Woombah & District
3,929
4,013
84
3,935
4,177
242
3,982
4,370
388
Clarenza - South Grafton
6,553
6,703
150
6,556
6,983
427
6,584
7,394
810
Glenreagh - Lanitza - Rural South West & District
2,789
2,855
66
2,790
2,980
190
2,793
3,100
307
10,689
10,799
110 10,697 11,009
312
10,761 11,394
633
Gulmarrad - Townsend
3,592
3,844
252
3,595
4,316
721
3,614
4,839
1,225
Junction Hill - Southgate & District
2,428
2,577
149
2,426
2,854
428
2,412
3,129
717
Lawrence & District
2,105
2,169
64
2,104
2,289
185
2,101
2,396
295
Maclean
2,613
2,696
83
2,614
2,850
236
2,622
3,049
427
Rural North West
2,319
2,365
46
2,318
2,451
133
2,312
2,523
211
Waterview Heights - Seelands & District
4,064
4,116
52
4,064
4,214
150
4,067
4,319
252
Wooli - Tucabia - Ulmarra & District
3,651
3,796
145
3,773
4,185
412
4,811
5,658
847
51,848
53,358
1,510 51,981 56,301
4,320
53,110 60,735
7,625
Grafton
Total Source: HillPDA, Profile.id
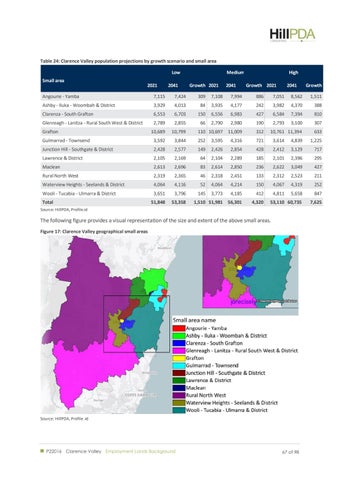
The following figure provides a visual representation of the size and extent of the above small areas. Figure 17: Clarence Valley geographical small areas
Source: HillPDA, Profile .id
P22016 Clarence Valley Employment Lands Background
67 of 98