CITY OF SOUTHLAKE, TEXAS

FOR THE FISCAL YEAR ENDED
SEPTEMBER 30, 2024


FOR THE FISCAL YEAR ENDED
SEPTEMBER 30, 2024
Annual Comprehensive Financial Report
For the Fiscal Year Ended September 30, 2024

As Prepared by: The
Finance Department
Sharen Jackson, CPA, Chief Financial Officer
Nicole Bradshaw, CPA, Deputy Director of Finance

Annual Comprehensive Financial Report
For the Fiscal Year Ended September 30, 2024 Table of Contents
INTRODUCTORYSECTION
LetterofTransmittalv CertificateofAchievementxviii OrganizationalChartxix
ListofPrincipalOfficialsxx
FINANCIALSECTION
IndependentAuditor’sReport3 Management'sDiscussionandAnalysis9
BasicFinancialStatements
Government-WideFinancialStatements
StatementofNetPosition125 StatementofActivities226
FundFinancialStatements
GovernmentalFundsFinancialStatements
BalanceSheet330 ReconciliationoftheGovernmentalFundsBalanceSheet totheStatementofNetPosition432 StatementofRevenues,Expenditures,andChangesinFundBalance534 ReconciliationoftheGovernmentalFundsStatementofRevenues,Expenditures andChangesinFundBalancetotheStatementofActivities636
ProprietaryFundsFinancialStatements
StatementofNetPosition738 StatementofRevenues,Expenses,andChangesinNetPosition840 StatementofCashFlows941
FiduciaryFundFinancialStatements StatementofFiduciaryNetPosition1045 StatementofChangesinFiduciaryNetPosition1146 NotestotheBasicFinancialStatements49
RequiredSupplementaryInformation
BudgetaryComparisonSchedule-GeneralFundA-192
BudgetaryComparisonSchedule-SouthlakeParksDevelopmentCorporation OperatingFundA-293 BudgetaryComparisonSchedule-CommunityEnhancementDevelopment CorporationSpecialRevenueFundA-394 NotestoBudgetaryComparisonSchedules95 ScheduleofChangesinNetPensionLiabilityandRelatedRatios-TMRSA-498 ScheduleofPensionContributions-TMRSA-5100 ScheduleofChangesinNetOPEBLiability(Asset)andRelatedRatiosSouthlakeNetOPEBLiability(Asset)forHealthInsuranceA-6102 ScheduleofContributions-SouthlakeNetOPEBLiability(Asset)forHealthInsuranceA-7104 ScheduleofChangesintheTotalOPEBLiabilityandRelatedRatios-TMRSSupplementalDeathBenefitsA-8106 ScheduleofOPEBContributions-TMRS-SupplementalDeathBenefitsA-9108 ConditionRatingofStreetSystemA-10110
Annual Comprehensive Financial Report
For the Fiscal Year Ended September 30, 2024 Table of Contents – Continued
CombiningandIndividualFundFinancialStatementsandSchedules
MajorGovernmentalFunds
ExhibitPage
BudgetaryComparisonSchedule-GeneralObligationDebtServiceFundB-1113 NonmajorGovernmentalFunds
CombiningBalanceSheet-NonmajorGovernmentalFundsC-1116
CombiningStatementofRevenues,Expenditures,andChangesinFundBalanceNonmajorGovernmentalFundsC-2120
BudgetaryComparisonSchedule-PoliceSpecialRevenueFundC-3124
BudgetaryComparisonSchedule-ParksandRecreationSpecialRevenueFundC-4125
BudgetaryComparisonSchedule-ParksDedicationSpecialRevenueFundC-5126
BudgetaryComparisonSchedule-CrimeControlDistrictSpecialRevenueFundC-6127
BudgetaryComparisonSchedule-HotelOccupancySpecialRevenueFundC-7128
BudgetaryComparisonSchedule-StormWaterUtilitySpecialRevenueFundC-8129
BudgetaryComparisonSchedule-CourtSecuritySpecialRevenueFundC-9130
BudgetaryComparisonSchedule-CourtTechnologySpecialRevenueFundC-10131
BudgetaryComparisonSchedule-LibrarySpecialRevenueFundC-11132
BudgetaryComparisonSchedule-RedLightCameraSpecialRevenueFundC-12133
BudgetaryComparisonSchedule-CommercialVehicleEnforcementC-13134
BudgetaryComparisonSchedule-TaxIncrementFinancingDistrict SpecialRevenueFundC-14135
BudgetaryComparisonSchedule-SouthlakeParksDevelopment CorporationDebtServiceFundC-15136
BudgetaryComparisonSchedule-CommunityEnhancementDevelopment CorporationDebtServiceFundC-16137
TablePage
StatisticalSection
NetPositionByComponent1142 ChangesinNetPosition2144 FundBalances,GovernmentalFunds3146 ChangesinFundBalances,GovernmentalFunds4148 AssessedValueandEstimatedActualValueofTaxableProperty5150 DirectandOverlappingPropertyTaxRates6151 PrincipalPropertyTaxPayers7152 AdValoremTaxLeviesandCollections8153 RatiosofOutstandingDebtByType9154 RatiosofGeneralBondedDebtOutstanding10155 DirectandOverlappingGovernmentalActivitiesDebt11156 Pledged-RevenueCoverage-SouthlakeParksDevelopmentCorporation12157 Pledged-RevenueCoverage-SouthlakeCommunityEnhancementand DevelopmentCorporation13158 DemographicandEconomicStatistics14159 PrincipalEmployers15160
Full-TimeEquivalentCityGovernmentEmployeesByFunction/Program16161 OperatingIndicatorsByFunction/Program17162 CapitalAssetStatisticsByFunction/Program18163

February 21, 2025
To the Honorable Mayor, Councilmembers and Citizens of the City of Southlake, Texas:
It is with pleasure that we submit to you the Annual Comprehensive Financial Report (ACFR) of the City of Southlake for the fiscal year ended September 30, 2024. This report was prepared by the Finance Department in accordance with the Southlake Charter, statutes, and generally accepted accounting principles for governments. In addition to meeting legal requirements, this report reflects the City’s commitment to full financial disclosure. We encourage you to thoroughly read this report and take the opportunity to discuss some of the important items it addresses.
In developing and evaluating the City’s accounting system, consideration is given to the adequacy of internal accounting controls. These controls are designed to provide reasonable, butnotabsolute,assurance regarding thesafeguardingof assets against lossfromunauthorized use or disposition, and the reliability of financial records for preparing financial statements and maintaining accountability for assets. The concept of reasonable assurance recognizes that the cost of a control should not exceed the benefits likely to be derived, and the evaluation of costs and benefits requires estimates and judgments by management. We believe that the City’s current system of internalcontrols adequately safeguards assets and provides reasonable assurance of proper recording of financial transactions.
Responsibility for both the accuracy of the presented data and the completeness and fairness of the presentation, including all disclosures, rests with the City. To the best of our knowledge and belief, the data, as presented, is accurate in all material respects and is reported in a manner designed to present fairly the financial position and results of operations. All disclosures necessary to enable the reader to gain an understanding of the City’s financial activities have been included.
Weaver & Tidwell, LLP, Certified Public Accountants, has issued an unmodified (“clean”) opinion on the City’s financial statements for the fiscal year ended September 30, 2024. The Independent Auditor’s Report is located at the front of the financial section of this report.
Management’s discussion and analysis (MD&A) immediately follows the Independent Auditor’s Report and provides a narrative introduction, overview, and analysis of the basic financial statements. The MD&A complements this letter of transmittal, and the two should be read in conjunction with each other.
Although Southlake has been a high-growth community for years, when the first settlers arrived in 1845, they found only a vast area of land and trees where the Grand Prairie and Cross Timbers merged. As the site of the first permanent settlement in Tarrant County, a portion of presentday Southlake was homesteaded in 1866, which consisted of 360 acres. Keeping with the time, the primary industry was agriculture. Farmers grew peanuts, grains, and cotton, and families raised their own livestock.
The area that would become Southlake remained a rural farming community for more than 100 years until the U.S. Army Corps of Engineers built Lake Grapevine in 1952. The lake spurred much of the area’s early growth and was the beginning of dramatic change. The city was officially incorporated on September 25, 1956, by a public vote of 30 in favor and 24 against. The original city contained 1.62 square miles and had a population of just over 100. The residents chose to call this new town Southlake because it was… south of Lake Grapevine! The Southlake Fire Department was launched in 1965, and the first piece of fire equipment was a 1950 Diamond TMilitary unit with a tank capacity of 1,000 gallons and an auxiliary pump. The first police chief was hired in 1966, and the city purchased its first patrol car in 1967.
The opening of the Dallas-Fort Worth International Airport in 1974 served as the next catalyst of growth in the area. Southlake residents adopted a home-rule charter in April 1987, which created the current council-manager form of government. Six Council Members and a Mayor are elected at large on a nonpartisan basis for staggered three-year terms. However, the most crucial event in bringing residential subdivision development to Southlake was the completion of water and sewer lines in the city's southern portion in the early 1990s.
By the 2000s, Southlakehadbecomea boom-burb,with the population tripling to almost22,000, and was well known for its picturesque countryside, exemplary school district, and luxury neighborhoods. Today, the City’s population is just over 33,000 and is estimated to reach just over 34,000 residents by the year 2050.
Since then, much like the area’s first settlers were attracted to the area with its endless possibilities, Southlake has continued attracting the suburban settlers desiring a high quality of life and the small-town charm preserved from Southlake’s past.
The City provides a full range of municipal services established by statute or charter, including providing police, fire, and ambulance services, planning, zoning and development services, engineering, streets and storm drainage infrastructure construction and maintenance, parks operations and maintenance, recreation programming and facilities, library services, and other general administrative services.
Water and sewer services and solid waste collection are provided under an enterprise fund concept, with user charges set by the City Council to ensure adequate coverage of operating expenses and payments of outstanding debt.

The financial reporting entity includes all the funds of the primary government, as well as all its component units in accordance with GASB Codification of Governmental Accounting and Financial Reporting Standards, Section 2100, “Defining the Reporting Entity.” Component units are legally separate entities for which the primary government is financially accountable and for which the nature and significance of their relationship with the primary governmentare such thatexclusionwouldcausetheCity’sbasicfinancialstatementstobemisleadingorincomplete. The City’s financial statements include the following blended component units:
The Southlake Parks Development Corporation (“SPDC”) was formed in January 1994 pursuant to a successful election in November 1993 to adopt an additional half-cent sales tax for park and recreation facility development. SPDC is organized exclusively to act on behalf of the City for the financing, development and operation of parks and recreation facilities.
Also included in this report is financial information for the Southlake Crime Control and Prevention District (the “District”). In November 1997, voters approved an additional half-cent sales tax for Crime Control and Prevention initiatives. The District is organized exclusively to act on behalf of the City for the financing, development, and crime control throughout the City.
In May 2015, Southlake voters overwhelmingly approved the reallocation of a portion of the District's half-cent sales tax for the purpose of constructing and operating a recreation center through the Southlake Community Enhancement and Development Corporation (“CEDC”). The District’s half-cent sales tax was reduced to a one-eighth cent tax, and the remaining threeeighths was reallocated to address recreational and economic development needs for the City, as permitted by State law, through CEDC.
This report also includes financial information for the Tax Increment Financing District (the “TIF”), which was created in 1997 to encourage quality commercial growth. The TIF was formed to financeandmakepublic improvementsunder theauthorityoftheTaxIncrementFinancingAct.
Additional information on these legally separate entities can be found in the notes to the financial statements (see Note 1).
The City is in a prime location in Northeast Tarrant County, 5 minutes west of Dallas/Fort Worth International Airport and 10 minutes east of the Alliance Airport, a commercial aviation and industrial complex in north Fort Worth. State Highway 114, FM 1709, and FM 1938, the regional road arterials, serve the City.
The City of Southlake is currently 92% developed and made up of over 2,600 businesses, including 52 new businesses for FY 2024. Businesses from many industries, including professional, scientific, and technical services, healthcare and social services, hospitality, retail, and banking and financial services, have come together to make Southlake a full-service business community.
Sabre, home of Travelocity.com, is the City’s largest employer, with approximately 2,400 employees.CarrollI.S.D.andCharlesSchwabarethenextmostsignificantemployers,eachwith approximately 1,100 employees.
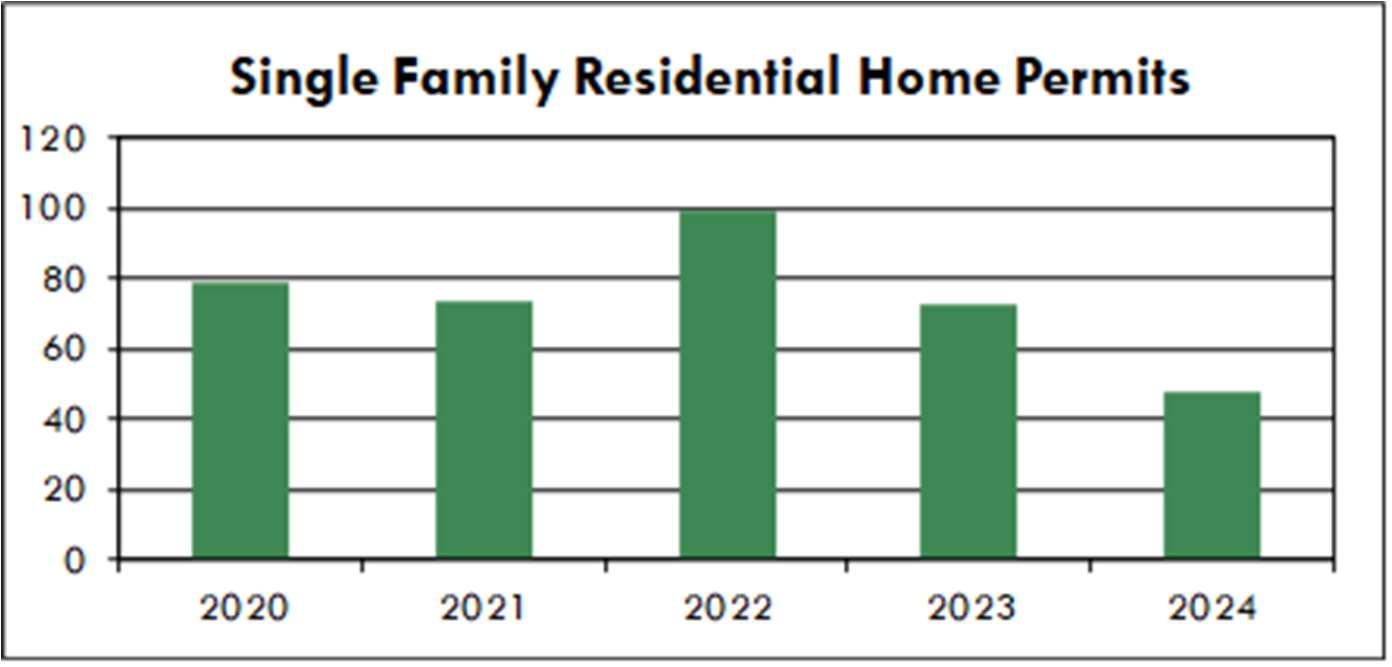
There were 48 single-family residential permits issued in FY 2024 with an average new home construction value, excluding land value, of approximately $2,160,000. As noted in the chart below, the City experienced decreased residential home construction.
Total certified taxable value for commercial and residential property was $11.36 billion, an increase of $954 million and a 9.2 percentincrease from the prior year. Newconstruction added $172 million to the tax roll.
Tax rate management and tax relief have been guiding financial management principles that Southlake has strategically implemented over time, beginning in 2009 with adopting a homestead exemption. Since that time, Southlake has annually implemented tax relief, first in the form of the homestead exemption and then beginning in2019 with tax rate reductions. New development and strong sales tax revenues combined with expenditure management have made it possible to implement thirteen relief initiatives since 2009.
In FY 2024, the City incorporated a total tax rate of $0.319 per $100 valuation, reducing the rate by $0.041 from FY 2023. The taxrate of $0.319 is split between GeneralFund operations and debt service. The allocation for FY 2024 is $0.264 for general operations and $0.055 for debt service.
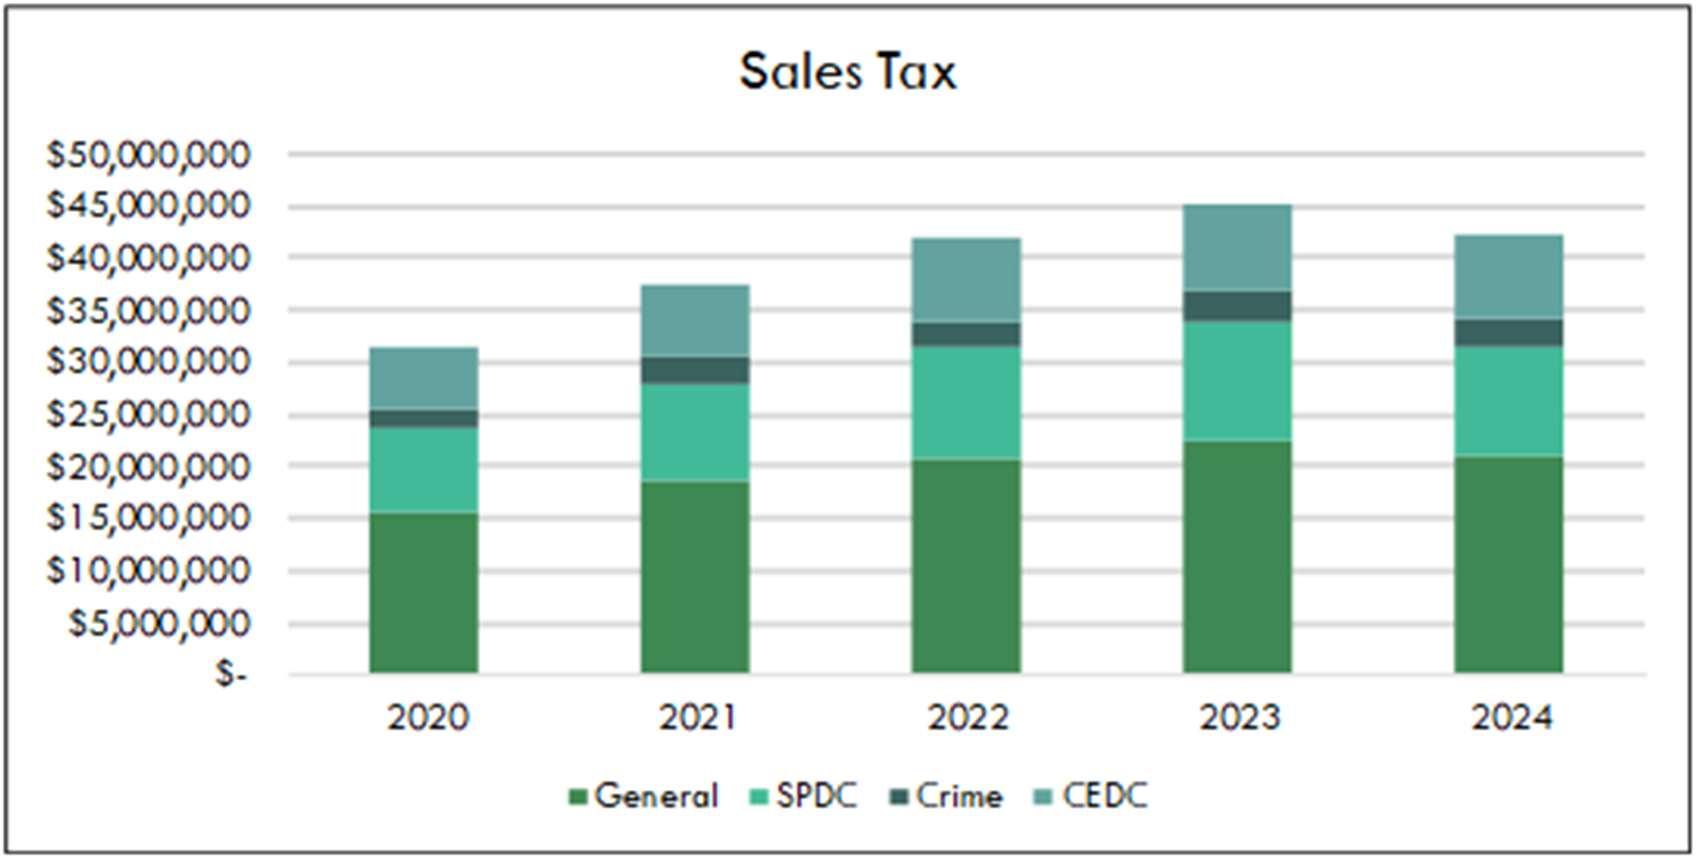
In Southlake, the total sales tax rate is 8.25%. The City receives $0.02 of sales tax for every dollar spent in our city limits (the remainder goes to the State). One of those pennies goes to the General Fund and can be spent on general operating costs, like supplies, salaries, and general maintenance. The other penny is split between our Crime Control and Prevention District (“CCPD”), the Southlake Parks Development Corporation (“SPDC”), and the Community Enhancement and Development Corporation (“CEDC”).
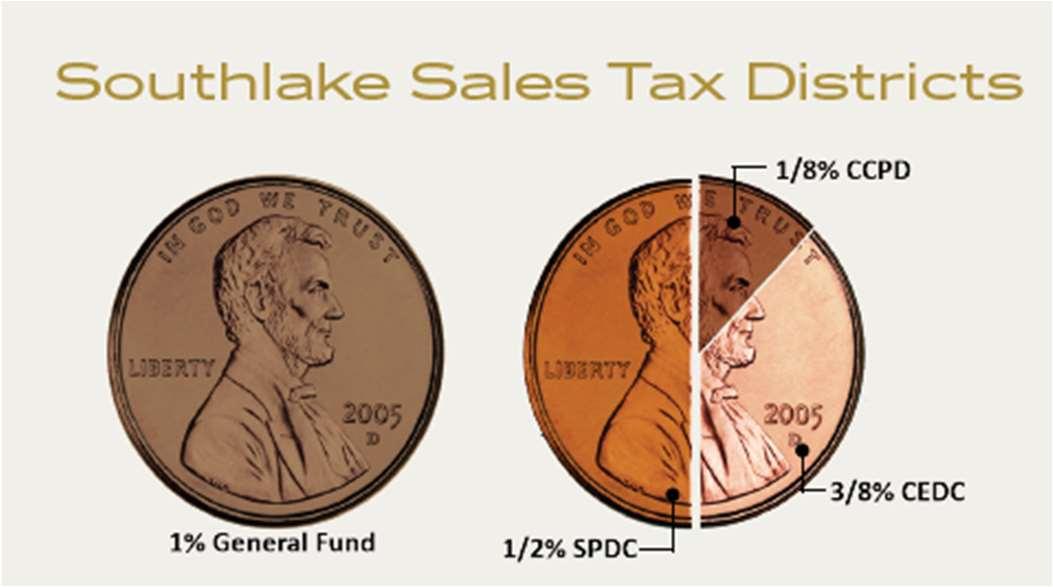
Sales taxes are an essential source of revenue for the City, making up approximately 29% of total revenues. It is estimated that non-residents who shop and dine in Southlake generate up to 70% of the sales tax revenue. These monies are used to support the City’s general operations, fund parks development, crime prevention and safety initiatives, construction and operations of The Marq, and economic development, and pay off the debt for these funds. Utilizing special sales tax districts has allowed the City of Southlake to maintain excellent financial conditions and reduce the property tax burden.
.
The City of Southlake experienced a decrease in sales tax collections during the fiscal year, as indicated on the chart. Sales tax collections exceeded $42 million in FY 2024, a 7.23% decrease from the previous year. This decrease was expected, however, as the City received significant one-time audit adjustments at the end of FY 2023. These adjustments caused that year to appear particularly unusual.
Generating economic development is a significant consideration in the City of Southlake's future economic outlook. To that end, the City has developed the following policy statement related to public investment in economic development.
The City of Southlake is committed to improving the quality of life for its citizens through the attraction and retention of high-quality development that drives a dynamic and sustainable economicenvironment.Ona case-by-casebasis,Southlakewillconsider providinginducement packages as a stimulus for economic development activity, including business attraction, relocation, and retention.
In carrying out its economic development objectives, the City of Southlake will adhere to the following guiding investment principles to best determine the strategic investment of its resources in eligible projects:
Project supports comprehensive plan implementation
Project will retain, expand, or attract targeted industries
Project will contribute to a top-tier workforce by retaining or expanding the daytime population and preferred job types
Project includes preferred quality of life benefits such as open space preservation and project enhancements
Public investment is performance-based and considers reasonable return on investment via direct financial return and other indirect benefits
Investments will be made into projects sponsored by a financially viable company in good legal standing with the City and State
Project will make a unique or unequaled contribution to development or redevelopment efforts in the City of Southlake due to its magnitude, significance to the community, or aesthetic quality
Criteria
Investment recommendations will be based on the evaluation of criteria, including the following:
What is the estimated total value of capital investment for buildings, other real property improvements, furniture, fixtures, and equipment?
Fiscal Impact
Employment Impact
What is the value of the Real and Business Personal Property that will be added to the tax rolls?
How much direct sales tax will be generated?
Will infrastructure construction be required?
Will the project generate overnight stays in the community? If so, how many annually?
What is the estimated return on public investment?
How many jobs will be brought to Southlake?
How many jobs will be retained?
What types of jobs will be created?
What will the total annual payroll be?
What is the average annual salary of jobs created and/or retained?
How compatible is the project with the City's comprehensive plan goals?
Community Impact
Project Eligibility
How does the project support goals related to the preferred quality of life benefit, such as preservation of open space and project enhancements?
Does the project meet the following minimum preferred thresholds?
o Capital investment: $5,000,000
o Jobs created or retained: 1OO
o Average annual total compensation of jobs created or retained: $50,000
o Average education level: 4-year degree
o Target industry alignment
If the project does not meet the preferred thresholds, will it make a unique or unequaled contribution to the development or redevelopment efforts in the City? How?
The Southlake 2035 Economic Development Master Plan specifies these target industries:
Full-service and limited-service restaurants (unique, independent, farm-to-table, chef-driven, etc.)
Specialty grocery (organic/local, specialty foods, dine-in or takeaway house-made prepared foods, artisanal cafe, wine and cheese from around the globe)
House & home retail (furnishings and appliances, home design showrooms, smart home technology)
Health, beauty and wellness (salons, spas, fitness training/gyms, yoga studios)
Culinary Hub (farm-to-table, farmers market, specialty food retailers, commercial grade kitchens, culinary business incubator)
Corporate headquarters and regional offices (large-scale, buildto-suit campus office)
Multi-tenant garden-style (professional services: accountants, engineers/planners/architects, information technology, lawyers, advertising and media, management consulting, actuary)
Health, beauty, and wellness (specialized facilities for cosmetic procedures, healthy living, etc.)
Specialized pediatric and senior clinic/outpatient facilities
Finance, Insurance and Wealth
Management
Information Technology and Media
Biotechnology and Pharmaceuticals
Specialized medical facilities for surgical procedures (implanted medical devices, bariatric, etc.)
Medical/wellness hub along SH 114
Research & Development Center
Corporate headquarters and regional offices
Professional services
Corporate headquarters and regional offices
Professional services
Telecommunications
Corporate headquarters and regional offices
Research and development
Investment funds may be used for one or more of the following eligible activities to assist a targeted industry in locating in the City or to facilitate a redevelopment project:
Capital investments related to real property construction and acquisition
Improvements to an existing building
On-site and/or off-site infrastructure
Site enhancements that the City may support to encourage upgraded aesthetics or amenities.
Other purposeswhich bring value to the community as determined by the Southlake City Council
Even though a project might meet all the minimum project qualifications, it will not be considered for public investment if any of the following factors apply:
If the project would, for any reason, result in a net reduction of the ad valorem tax valuation of all facilities in the City owned by the company or its parent, subsidiary, or affiliated companies, assistance will not be provided.
Investment will not be provided to companies not in good legal standing with the state or that have not met their obligations as businesses in the City of Southlake.
No prior commitment to investment shall be binding if the company originally receiving the assistance assigns it to another company unless the City has consented to such assignment in writing, as specified in an approved investment agreement.
The financial condition of the company receiving the assistance must not make its ability to meet its obligations uncertain.
Available Investment Tools
Tax Abatement
Chapter 380 Economic Development Grants
Infrastructure Participation
Tax Increment Reinvestment Zone
Public Improvement Districts (PID)
Fee Waivers or Reimbursement
This is a tool whereby all or a portion of the increase in the value of real and/or business personal property can be exempted from taxation. The legal authority for tax abatements comes from Chapter 312 of the Texas Property Tax Code; therefore, cities must meet the provisions of the Code when using abatements.
This incentive option is authorized under Chapter 380 of the Texas Local Government Code. It is an agreement between the taxpayer and taxing entity to offer a variety of fee-based or tax-based incentives, grants (which may or may not be repaid), or rebates. This is a flexible option, but there are certain state law requirements that must be met in all cases.
TheCity ofSouthlake hasa trackrecord offacilitating developmentthrough enhancement of water, sewer, and roadway infrastructure relevant to sites selected for significant projects as needed.
Tax Increment Financing is a tool to finance public improvements within a defined area. The improvements should enhance the environment and attract new investment. The statutes governing tax increment financing are in Chapter 311 of the Texas Tax Code.
A PID is a defined geographical area established to provide specific types of improvements or maintenance within the area which are financed by assessmentsagainstthepropertyownerswithin thearea.Chapter 372 ofthe Texas Local Government Code authorizes the creation of PIDs by cities.
The City of Southlake will consider a waiver or reimbursement of development fees on eligible projects.
The City entered into no new incentive agreements for FY 2024. Allprojects undergo this rigorous vetting process before the City enters into any agreements. Agreements also undergo periodic monitoring after inception to ensure that performance targets are being met.
In 2024, the following projects have been approved for development in the City:
Brumlow East will include a 32.8-acre mixed-use development encompassing a singlefamily residential componentwith 56 residential homes and approximately 71,000 square feet of office and office/warehouse buildings.
WellBinionwillincludea newapproximately5,960sq.ft.multi-tenantcommercialbuilding on an existing pad site.
The Overlook and Willowtree Gardens will include a single-family residential component and an office building component.
Lambert Homes will include an approximate 10,570 sq. ft. two-story building (serving as Lambert Homes’ primary office, retail, and storage space), and an approximate 2,800 sq. ft. one-story building intended for future retail use.
Southlake Municipal Service Center will support the City of Southlake Public Works Operations.ThesitewillalsoincludeaTrainingTowerfortheDepartmentofPublicSafety’s use.
Tom Thumb Gas Station—The project will convert the former Texaco establishment into a Tom Thumb Gasoline Service Station and Convenience Store at the northwest corner of the W. Southlake Blvd. and N. White Chapel Blvd. intersection.
Tommy’s Car Wash - Northeast Corner of W. Southlake Boulevard and N. Pearson Ln. will include a self-service car wash with a conceptual future retail component.
The City has the following development projects under construction:
Southlake Marketplace will include lighting improvements, landscape improvements, and the construction of an approximately 2,600 sq. ft. drive-thru restaurant.
The Wheelhouse will include 2 single-story buildings totaling approximately 19,461 sq. ft. forofficeshowroomwithretailsalesandautomobileandmotorcyclesalesand/orservice uses. Additionally, The Wheelhouse will include 3 single-story buildings totaling approximately 47,629 sq. ft. with garage and storage uses, maintenance of personal vehicles, and hobby shop for personal use.
Mustang Business Park will include 3 distribution warehouse buildings totaling approximately 340,180 sq. ft. on approximately 26.27 acres.
The Garden District Residences will include 58 residential units in 2 four-story buildings on approximately 2.24 acres.
Next CenturyHealth CarePlazawill include6single-storymedicalofficebuildings totaling approximately 50,000 sq. ft.
Carillon Parc Residential will include 79 residential lots and 3 commercial lots.
Constellation will include 4 large warehouse buildings totaling approximately 546,330 sq. ft.
Kirkwood East will include 8 buildings totaling approximately 50,000 sq. ft. at build out - 2 under construction.
During FY 2024, the following significant projects were completed, which will have an impact on the local economy in the future:
Capital Grille - E. State Highway 114 - Capital Grille includes a 9,447 sq. ft. restaurant.
GranitePlacePhaseTwoincludesafive-story,approximately151,000sq.ft.officebuilding adjacent to the existing Granite Place One building. The project will also include a fivelevel parking structure.
GMI Southlake includes 3 flex light industrial/corporate office buildings totaling approximately 58,780 sq. ft.
Methodist Southlake Hospital Emergency Department Expansion includes a one-story, approximately 6,000 sq. ft. addition to the existing hospital building to provide new nuclear medicine facilities.
Primrose Office II includes 3 two-story office buildings totaling 25,660 sq. ft. on approximately 1.84 acres. – 2 buildings complete/1 building remaining for construction.
Mustang Business Park will include 3 distribution warehouse buildings totaling approx. 340,180 sq. ft. on approximately 26.27 acres.
The City’s dedication to quality development, sound fiscal policies, and effective strategic management has made it an exemplary community in the Dallas-Fort Worth region. With impeccably built neighborhoods, a successful downtown, and a diverse business community, the City offers residents, businesses, and visitors an enhanced quality of life.
The City has strong financial management principles that provide the framework for financial sustainability.
Tax rate management - The tax rate is allocated properly between maintenance /operations and debt service.
Structural balance - The City’s ability to weather potential economic downturns or other financial challenges is critical. The City does not use reserves to balance the operating budget.
Reserve management - The City’s fund balance policy requires a minimum of 15% and an optimum of 25%. The City uses “excess” reserves to fund one-time, “pay-as-you-go” projects.
Multi-year financial plan - The long-term effect of today’s decisions on tomorrow’s financial situation is important during the budget process.
Quality service delivery - The City is committed to meeting the needs of our community through high-quality service delivery.
Risk management - The City supports ongoing initiatives to safeguard public trust through internal audits and other initiatives to maintain a strong control environment.
Executive leaders evaluate the operational impact of all identified projects and include those costs in future budget projections. The Executive Leadership Team has also begun a more formalized 5-year financial roadmap that reflects known and planned expenditures to create further predictability for future budgets.
Staff monitors trends that depict the City's long-term financial health and uses these trends to make decisions to reach financial and service goals. Thoroughly understanding economic conditions is critical for proper planning.
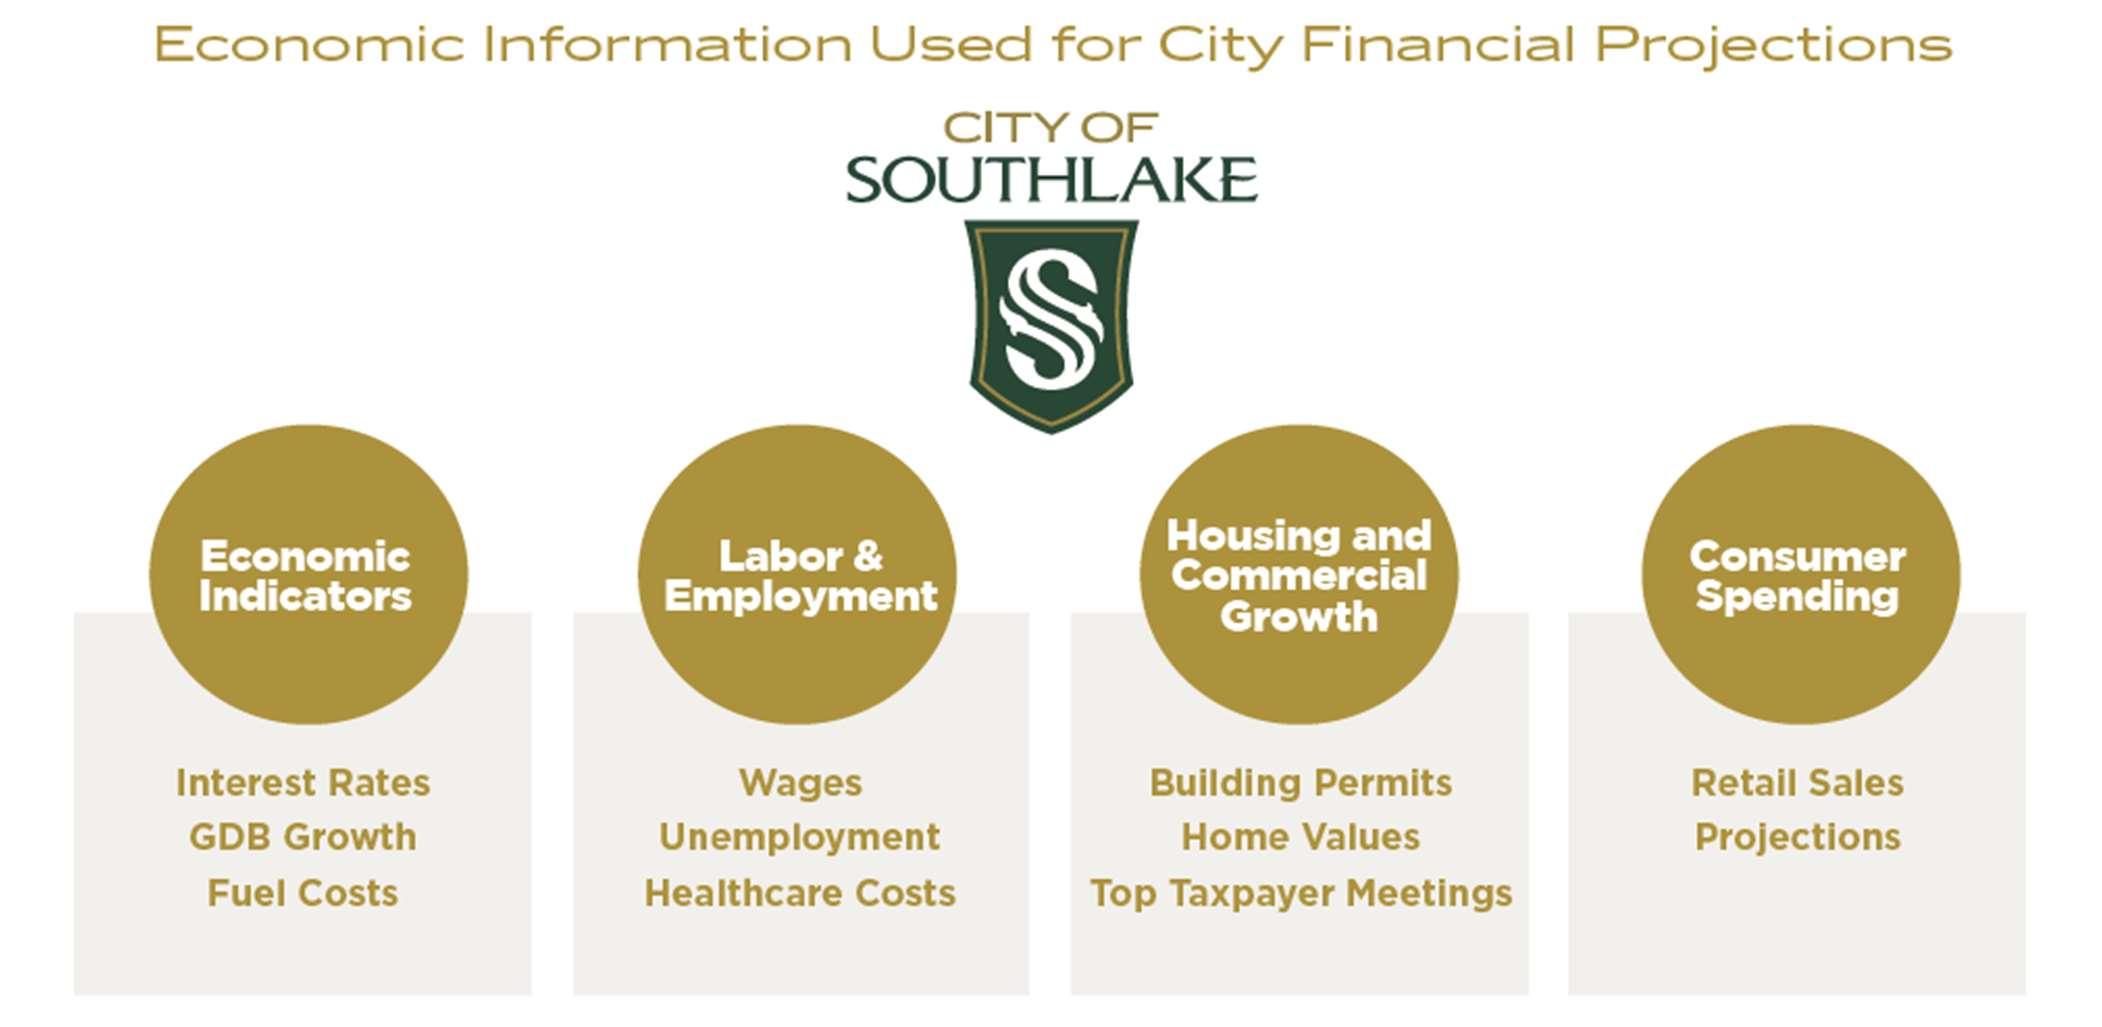
The City has taken an additional formal step to understand and plan for the organization’s financial future by adopting the Southlake Sustainability Plan as an element of the Southlake ComprehensivePlan.Itcontainsformalrecommendationstoensurepositivefinancialoutcomes for the City. Management is working with the City Council to update this plan, with formal adoption scheduled for FY 2025.
The City Charter requires an annual audit of the financial status of the City by independent Certified Public Accountants selected by the City Council. This requirement has been met, and the auditor’s report has been included in this report. Additionally, the City has an Audit Committee as a subcommittee of the City Council, which hears and reviews all recommendations made by the independent auditors.
The Government Finance Officers Association of the United States and Canada (GFOA) awarded a Certificate of Achievement for Excellence in Financial Reporting to the City of Southlake for its Annual Comprehensive Financial Report for the fiscal year ended September 30, 2023. This was the 24th consecutive year that the City has received this prestigious national award. To earn the Certificate of Achievement, the City published an easy-to-read and efficiently organized Annual Comprehensive Financial Report with contents that conformed to program standards. This report must satisfy both GAAP and applicable legal requirements.
A Certificate of Achievement is valid for one year. The City believes that the current Annual Comprehensive Financial Report continues to meet the Certificate of Achievement Program's requirements and thus is submitting it to GFOA to determine its eligibility for another certificate.
GFOAnamed theCityof Southlakea 2023 Triple Crownwinner.GFOA's TripleCrowndesignation recognizes governments who have received GFOA's Certificate of Achievement for Excellence in Financial Reporting,Popular Annual Financial Reporting Award, and theDistinguished Budget Presentation Award for a fiscal year. The City has received this designation 5 years in a row.
This report could not have been prepared without the dedication and efficiency of the entire staffand our independent auditor.Iwant toexpressappreciation toCity employees throughout the organization, especially those staff members in the Finance Department, who were instrumental in the successful completion of this report. I would also like to thank the Mayor and members of the City Council for their support in planning and conducting the City's financial operations in a responsible and efficient manner.
Respectfully submitted,
Sharen Jackson
Sharen Jackson Chief Financial Officer


List of Principal Officials
September 30, 2024
Shawn McCaskill Mayor
Randy Williamson Mayor Pro Tem
Kathy Talley Deputy Mayor Pro Tem
Randy Robbins Council Member
Frances Scharli Council Member
Ronell Smith Council Member Vacant* Council Member
Alison Ortowski City Manager
Stacey Black Assistant City Manager/Senior Director of Human Resources
James Brandon Assistant City Manager
Amy Shelley City Secretary
Sharen Jackson Chief Financial Officer
Daniel Cortez Economic Development & Tourism Director
Lauren LaNeave Interim Public Works Director
David Miller Community Services Director
Dennis Killough Planning & Development Services Director
Pilar Schank Communications Director
Blair Halbert Information Technology Director
Ashleigh Casey Police Chief
Jeremy Wilson Interim Fire Chief
* As of January 21, 2025
To the Honorable Mayor and Members of City Council and Management of the City of Southlake, Texas
ReportontheAuditoftheFinancialStatements
Opinions
We have audited the financial statements of the governmental activities, the business-type activities, each major fund and the aggregate remaining fund information of the City of Southlake, Texas (City), as of and for the year ended September 30, 2024, and the related notes to the financial statements, which collectively comprise the City’s basic financial statements as listed in the table of contents.
In our opinion, the accompanying financial statements present fairly, in all material respects, the respective financial position of the governmental activities, the business-type activities, each major fund and the aggregate remaining fund information of the City, as of September 30, 2024, and the respective changes in financial position and, where applicable, cash flows thereof for the year then ended in accordance with accounting principles generally accepted in the United States of America.
We conducted our audit in accordance with auditing standardsgenerally accepted in the United States of America (GAAS) and the standards applicable to financial audits contained in Government Auditing Standards issued by the Comptroller General of the United States (Government Auditing Standards). Our responsibilities under those standards are further described in the Auditor’s Responsibilities for the Audit of the Financial Statements section of our report. We are required to be independent of the City and to meet our other ethical responsibilities, in accordance with the relevant ethical requirements relating to our audit. We believe that the audit evidence we have obtained is sufficient and appropriate to provide a basis for our audit opinions.
As discussed in Note 13 tothe basic financial statements, during the year ended September 30, 2024, the City implemented Governmental Accounting Standards Board (GASB) Statement No. 100, Accounting Changes and Error Corrections. Beginning fund balance has been restated as a result of the implementation of this statement. Our opinions are not modified with respect to this matter.
TheCity’smanagementisresponsibleforthepreparationandfairpresentationofthefinancialstatements in accordance with accounting principles generally accepted in the United States of America, and for the design, implementation, and maintenance of internal control relevant to the preparation and fair presentation of financial statements that are free from material misstatement, whether due to fraud or error.
In preparing the financial statements, management is required to evaluate whether there are conditions or events, considered in the aggregate, that raise substantial doubt about the City’s ability to continue as a going concern for twelve months beyond the financial statement date, including any currently known information that may raise substantial doubt shortly thereafter.
The Honorable Mayor and Members of City Council and Management of the City of Southlake, Texas
Our objectives are to obtain reasonable assurance about whether the financial statements as a whole are free from material misstatement, whether due to fraud or error, and to issue an auditor’s report that includes our opinions. Reasonable assurance is a high level of assurance but is not absolute assurance and therefore is not a guarantee that an audit conducted in accordance with GAAS and Government Auditing Standards will always detect a material misstatement when it exists. The risk of not detecting a material misstatement resulting from fraud is higher than for one resulting from error, as fraud may involve collusion, forgery, intentional omissions, misrepresentations, or the override of internal control. Misstatements are considered material if there is a substantial likelihood that, individually or in the aggregate, they would influence the judgment made by a reasonable user based on the financial statements.
In performing an audit in accordance with GAAS and Government Auditing Standards, we:
Exercise professional judgment and maintain professional skepticism throughout the audit.
Identify and assess the risks of material misstatement of the financial statements, whether due to fraudorerror,anddesignandperformauditproceduresresponsivetothoserisks.Suchprocedures include examining, on a test basis, evidence regarding the amounts and disclosures in the financial statements.
Obtain an understanding of internal control relevant to the audit in order to design audit procedures that are appropriate in the circumstances, but not for the purpose of expressing an opinion on the effectiveness of the City’s internal control. Accordingly, no such opinion is expressed.
Evaluate the appropriateness of accounting policies used and the reasonableness of significant accounting estimates made by management, as well as evaluate the overall presentation of the financial statements.
Conclude whether, in our judgment, there are conditionsor events, consideredin the aggregate, that raise substantial doubt about the City’s ability to continue as a going concern for a reasonable period of time.
We are required tocommunicate with those charged with governance regarding, among other matters, the plannedscope and timing of the audit, significant audit findings, and certain internalcontrol–related matters that we identified during the audit.
Accounting principles generally accepted in the United States of America require that management’s discussion and analysis and the required supplementary information, as listed in the table of contents, be presented to supplement the basic financial statements. Such information is the responsibility of managementand,althoughnotapartofthebasicfinancialstatements,isrequiredbytheGovernmental AccountingStandardsBoardwhoconsidersitto bean essentialpart offinancialreportingfor placingthe basic financial statements in an appropriate operational, economic, or historical context. We have appliedcertainlimitedprocedurestotherequired supplementaryinformation in accordancewithGAAS, which consisted of inquiries of management about the methods of preparing the information and comparing the information for consistency with management’s responses to our inquiries, the basic financial statements, and other knowledge we obtained during our audit of the basic financial statements. We do not express an opinion or provide any assurance on the information because the limited procedures do not provide us with sufficient evidence to express an opinion or provide any assurance.
The Honorable Mayor and Members of City Council and Management of the City of Southlake, Texas
Ourauditwasconductedforthepurposeofformingopinionsonthefinancialstatementsthatcollectively comprise the City’s basic financial statements. The Combining and Individual Nonmajor Fund Financial Statements and Schedules are presented for purposes of additional analysis and are not a required part of the basic financial statements.
The Combining and Individual Nonmajor Fund Financial Statements and Schedules are the responsibility of management and was derived from and relates directly to the underlying accounting and other records used to prepare the basic financial statements. The information has been subjected to the auditing procedures applied in the audit of the basic financial statements and certain additional procedures, includingcomparingandreconciling such information directly tothe underlyingaccounting and other records used to prepare the basic financial statements or to the basic financial statements themselves, and other additional procedures in accordance with GAAS. In our opinion, the other supplementary information is fairly stated, in all material respects, in relation to the basic financial statements as a whole.
Management is responsible for the other information included in the ACFR. The other information comprises the introductory and statistical sections but does not include the basic financial statements and our auditor's report thereon. Our opinions on the basic financial statements do not cover the other information, and we do not express an opinion or any form of assurance thereon.
In connection with our audit of the basic financial statements, our responsibility is to read the other information and consider whether a material inconsistency exists between the other information and the basic financial statements, or the other information otherwise appears to be materially misstated. If, based on the work performed, we conclude that an uncorrected material misstatement of the other information exists, we are required to describe it in our report.
In accordance with Government Auditing Standards, we have also issued our report dated February 21, 2025 our consideration of the City’s internal control over financial reporting and on our tests of its compliance with certain provisions of laws, regulations, contracts, and grant agreements and other matters. The purpose of that report is solely to describe the scope of our testing of internal control over financial reporting and compliance and the results of that testing, and not to provide an opinion on the effectiveness of the City’s internal control over financial reporting or on compliance. That report is an integral part of an audit performed in accordance with Government Auditing Standards in considering the City’s internal control over financial reporting and compliance.
WEAVER AND TIDWELL, L.L.P.
Dallas, Texas February 21, 2025
The City of Southlake’s Management’s Discussion and Analysis (MD&A) is designed to provide an objective and easy-to-read analysis of the City’s financial activities based on currently known facts, decisions, andconditions. It is intended toprovide a broad overviewand short-term analysis of the City’s activities based on information presented in the financial statements. Specifically, this information is designed to assist the reader in focusing on significant financial issues, provide an overview of the City’s financial activity, identify changes in the City’s financial position (its ability to address the next and subsequent years’ challenges), identify material deviations from the approved budget, and identify individual fund issues.
The City presents its financial statements in accordance with the reporting model required by Governmental Accounting Standards Board Statement 34, Basic Financial Statements and Management’s Discussion and Analysis for State and Local Governments. This reporting model significantly changes not only the presentation of financial data but also the manner in which the information is recorded.
The information contained within this MD&A is only a component of the entire financial statement report. Readers should consider the information presented here in conjunction with additional information that we have furnished in our letter of transmittal, which can be found on pages v‐xvii of this report.
The assets and deferred outflows of resources of the City of Southlake exceeded its liabilities and deferred inflows of resources on September 30, 2024, by $829,662,667 (net position). Of this amount, $158,939,609(unrestricted net position) may be used tomeet the government’s ongoing obligations to citizens and creditors.
The net position of the City’s governmental activities increased by $33,994,334 while the net position of business-type activities increased by $10,690,031.
As of September 30, 2024, the City’s governmental funds reported combined ending fund balances of $206,393,821. Of this amount, $44,905 is reported as nonspendable, $111,358,465 is restricted by outside sources, $2,092,186 is committed for future uses, $75,878,532 is assigned by management for specified purposes, and $17,019,733 is available for spending at the government’s discretion (unassigned fund balance).
At the end of the current fiscal year, unassigned fund balance for the General Fund was $17,019,733, or 30.9% of total General Fund expenditures.
Attheendofthecurrentfiscalyear,theCityofSouthlake'soutstandingdebttotaled$122,696,656, a net decrease of $6,384,463 from the previous year.
Thisdiscussion and analysisisintended toserve as an introduction to the City’sbasic financialstatements. The reporting focus is on the City as a whole and on individual major funds. It is intended to present a more comprehensive view of the City’s financial activities.
The basic financial statements are comprised of three components: 1) government-wide financial statements,2)fundfinancialstatements,and3)notestothefinancialstatements. Thisreportalsoincludes supplementary information intended to furnish additional detail to support the basic financial statements themselves.
The government-wide financial statements include the Statement of Net Position and the Statement of Activities. These statementsaredesignedtoprovidereaders withabroadoverviewof theCity’s finances in a manner similar to a private-sector business. Both are prepared using the economic resources measurement focus and the accrual basis of accounting, meaning that all the current year’s revenues and expenses are included regardless of when cash is received or paid.
The Statement of Net Position presents information on all of the City’s assets and deferred outflows of resources, and liabilities and deferred inflows of resources, including capital assets and long-term obligations. The difference between the two is reported as net position. Over time, the increases or decreases in net position may serve as a useful indicator of whether the financial position of the City is improving or deteriorating. Other indicators of the City’s financial position should be taken into consideration, such as the change in the City’s property tax base and the condition of the City’s infrastructure (i.e., roads, drainage systems, water and sewer lines, etc.), to assess the overall financial condition of the City more accurately.
The Statement of Activities presents information showing how the City’s net position changed during the most recent fiscal year. It focuses on both the gross and net costs of the government’s various activities and thus summarizes the cost of providing specific government services. This statement includes all current year revenues and expenses.
The Statement of Net Position and the Statement of Activities divide the City’s activities into two types:
Governmental activities - Most of the City’s basic services are reported here, including general administration, debt services, public safety, public works, parks and community services, public library, publiceventsandfacilities,planninganddevelopment,andfinance. Property,sales,andfranchisetaxes provide most of the financing for these activities.
Business-type activities - These are activities for which the City charges customers a fee to pay most or all of the costs of a service it provides. The City’s business-type activities include water distribution, wastewater collection, and solid waste collection and disposal.
The government-wide financial statements are found on pages 25-26 of this report.
The City of Southlake, like other state and local governments, uses fund accounting to ensure and demonstrate compliance with finance-related legal requirements. A fund is a grouping of related accountsthatisusedto maintain controloverresourcesthathavebeen segregatedforspecific activities or objectives. These statements focus on the most significant funds and may be used to find more detailed information about the City’s most significant activities. All the City's funds can be divided into two categories: governmental funds and proprietary funds.
Governmental Funds - These funds account for the majority of the City’s activities, which are essentially the same functions reported as governmental activities in the government-wide statements. However, unlikethegovernment-widefinancialstatements, governmentalfundfinancialstatementsfocuson nearterm inflows and outflows of spendable resources and spendable resources available at the end of the fiscal year for future spending. Such information may be useful in evaluating a government’s near-term financing requirements.
The focus of the governmental funds financial statements is narrower than that of the government-wide financial statements. Therefore, it is useful to compare the information presentedfor governmental funds with similar information presented for governmental activities in the government-wide financial statements. Bydoingso, readersmay betterunderstandthelong-termimpactofthegovernment’snear-
term financing decisions. Both the governmental fund Balance Sheet and the governmental fund Statement of Revenues, Expenditures, and Changes in Fund Balances provided a reconciliation to facilitate this comparison. The reconciliation explains the differences between the government’s activities as reported in the government-wide financial statements and the information presented in the governmental fund financial statements.
The City maintains 26 individual governmental funds. Information is presented separately in the governmental fund Balance Sheet and in the governmental fund Statement of Revenues, Expenditures, and Changes in Fund Balances for the General Fund, General Obligation Debt Service Fund, General Capital Projects Fund, Southlake Parks Development Corporation Capital Projects Fund, Southlake Parks Development Corporation Special Revenue Fund, and Community Enhancement Development Corporation Special Revenue Fund, all of which are considered to be major funds. Data for the other governmentalfundsarecombinedintoasingle,aggregatedpresentation. Individualfunddatafor each of the nonmajor governmental funds is provided in the form of combining statements elsewhere in this report.
The basic governmental funds financial statements can be found on pages 30-36 of this report.
Proprietary Funds - When the City charges customers for services it provides, the activities are generally reported in proprietary funds. The City of Southlake maintains two different types of proprietary funds: enterprise and internal service funds.
Enterprise funds are used to report the same functions presented as business-type activities in the government-wide financial statements. The City uses enterprise funds to account for its water and sewer operations and solid waste. These services are primarily provided to outside or non-governmental customers.
Internalservicefunds areanaccountingdeviceusedtoaccumulateandallocatecostsinternallyamong the City’s various functions. The City uses internal service funds to account for vehicle and equipment replacement. Because these servicespredominantly benefit the governmental rather than business-type functions, they have been included within the governmental activities in the government-wide financial statements.
Proprietary funds financial statements provide the same type of information as the government-wide financial statements, only in more detail. The proprietary funds financial statements can be found on pages 36-39 of this report.
Fiduciary funds - the City presents one trust fund, the Southlake OPEB Liability Trust Fund, which accounts for the funding of post-employment healthcare benefitsfor retirees of the City andtheir dependents. The financial statements for the fiduciary funds can be found on pages 45-46 of this report.
Notes to the Financial Statements
The Notes provide additional information that is essential to a full understanding of the data provided in thegovernment-wideandfundfinancialstatements.TheNotestothe FinancialStatementscanbe found on pages 49-87 of this report.
As noted earlier, net position over time may be a useful indicator of the City’s financial position. As of September30,2024,theCity’sassetsanddeferredoutflowsofresourcesexceededliabilitiesanddeferred inflows of resources by $829,662,667 (net position) at the close of the most recent fiscal year.
The largest portion of the City’s net position, $547,115,657, reflects its investment in capital assets (land and improvements, buildings, infrastructure, machinery and equipment, and right-to-use assets, net of accumulated depreciation and amortization), less any related debt used to acquire those assets that is still outstanding. The City uses these assets to provide services to its citizens; consequently, these assets are not available for future spending. Although the City reports its capital assets net of related debt, the resources needed to repay this debt must be provided from other sources since the capital assets themselves cannot be used to liquidate these liabilities.
The following analysis highlights the net position as of September 30, 2024, and 2023:
Currentand otherassets234,247,365$228,001,169$98,781,086$79,307,211$333,028,451$307,308,380 $ Capitalassets532,406,280516,100,28596,335,54498,690,072628,741,824614,790,357 Totalassets766,653,645744,101,454195,116,630177,997,283961,770,275922,098,737
Deferredoutflowsof
resources8,572,28113,228,194726,4631,081,7239,298,74413,995,534 Long-termliabilities87,183,147101,619,38635,513,50927,461,733122,696,656129,081,119 Otherliabilities13,050,02414,759,3563,358,1995,304,62416,408,22320,063,980
Totalliabilities100,233,171116,378,74238,871,70832,766,357139,104,879149,145,099
Deferredinflowsof resources2,022,6731,975,158278,800310,0952,301,4731,970,870
Netposition: Netinvestment
incapitalassets472,883,752450,639,46174,231,90575,167,644547,115,657525,807,105 Restricted111,948,381121,858,26411,659,0208,464,094123,607,401130,322,358 Unrestricted88,137,94966,478,02370,801,66062,370,816158,939,609128,848,839
Totalnetposition672,970,082$638,975,748$156,692,585$146,002,554$829,662,667$784,978,302 $
The following analysis highlights the changes in net position for the years ended September 30, 2024 and 2023:
Revenues: Programrevenues: Chargesforservices12,298,382$11,629,939$35,597,701$37,630,965$47,896,083$49,260,904 $ Operatinggrants andcontributions375,784825,770--375,784825,770 Capitalgrants andcontributions4,890,1502,382,7701,734,3882,064,2966,624,5384,447,066
Generalrevenues: Taxes91,590,42893,889,807--91,590,42893,889,807 Investmentearnings11,116,6647,934,3013,839,8682,594,30814,956,53210,528,609 Miscellaneous151,752512,725--151,752512,725
Gainonsaleof capitalassets143,1464,15696,269-239,4154,156
Totalrevenues120,566,306117,179,46841,268,22642,289,569161,834,532159,469,037
Expenses:
Generalgovernment26,994,34126,292,171--26,994,34126,292,171 Publicsafety27,798,59826,658,917--27,798,59826,658,917 Publicworks10,709,56312,108,564--10,709,56312,108,564 Cultureandrecreation19,939,37118,657,110--19,939,37118,657,110 Promotionofculture andtourism871,217---871,217Interestonlong-termdebt1,867,7372,071,867--1,867,7372,071,867 Waterandsewer--28,969,34028,506,29228,969,34028,506,292
Totalexpenses88,180,82785,788,62928,969,34028,506,292117,150,167114,294,921
Increasesinnetposition beforetransfers32,385,47931,390,83912,298,88613,783,27744,684,36545,174,116 Transfers1,608,8551,336,469(1,608,855)(1,336,469)--
Changeinnetposition33,994,33432,727,30810,690,03112,446,80844,684,36545,174,116
Netposition,beginning638,975,748606,248,440146,002,554133,555,746784,978,302739,804,186
Netposition,ending672,970,082$638,975,748
Governmental activities net position increased by $33,994,334. This can be largely attributed to the City’s total revenues of $120,566,306 exceeding total expenses of $88,180,827 by $32,385,479. Significant changes in revenues and expenses between FY 2024 and FY 2023 include the following:
The City received $4.8 million in public works-related capital grants and contributions for FY 2024, including donated capital assets of $1.1 million and grant funding related to replacing the North White Chapel Bridge for over $3.2 million. The total increase from FY 2023 was over $2.5 million.
There was also a $3.2 million increase in interest income received by the City for FY 2024, largely due to increased interest rates and the City's ability to reinvest lower-yielding investments, at maturity, into higher-yielding securities that much better reflect current market conditions.
Tax revenues decreased by almost $2.3 million. Sales taxes decreased by over $3.2 million. This decreasewasexpected asFY2023appearedhigherduetoone-timeauditadjustmentsreceived from the state. Property taxes increased by almost $1 million. Property tax rates were reduced to the no-new-revenue rate, so this increase was related to additional properties being added to the tax roll and increases in total assessed property values.
Public safety expenses increased by over $1.1 million for FY 2024. Salary and benefit-related costs were the driving factors for this increase, which resulted from scheduled raises and increased overtime needs.
Public works had a decrease of almost $1.4 million. This decrease can be attributed to reduced non-capital project costs for FY 2024.
Culture and recreation increased by almost $1.4 million. This increase can be attributed to the purchase of replacement non-capital equipment, salary and benefit costs resulting from scheduled raises, and staffing the Southlake Pickleball Complex, which opened in FY 2024.
The net position of business-type activities increased by $10,690,031. While revenues also consistently outpace expenses in business-type activities, there were some significant increases and decreases in revenues and expenses for FY 2024.
Charges for services declined by just over $2 million in FY 2024 as rainfall increased in some of the hottest and highest water usage months, including June, July, and September. Investment earnings increased by over $1.25 million, again, largely due to increased interest rates and the City's ability to reinvest loweryielding investments, at maturity, into higher-yielding securities that much better reflect current market conditions.
Expenses increased by almost $500,000, the largest contributor being the rising cost of wastewater treatment. The cost of wastewater plant expansion is passed through to all participating municipalities and governments within the region of the Trinity River Authority (“TRA”). As the DFW metroplex has continued to grow, the need for more capacity at these plants also continues to grow. Additionally, the City saw a reduction in the cost of purchased water. This reduction offset a significant portion of this increase from wastewater treatment. This reduction in water costs would be directly related to the charges for services revenues and would also be a result of the rainfall received in FY 2024.
Governmental Funds - The focus of the City of Southlake’s governmental funds is to provide information on near-term inflows, outflows and balances of spendable resources. Such information is useful in assessing the City’sfinancing requirements. In particular, unassigned fund balance may serve asa useful measure of a government’s net resources available for spending at the end of the fiscal year.
As of the end of the current fiscal year, the City’sgovernmental funds reported combined fund balances of $206,393,821. Approximately 8.2% or $17,019,733 constitutes unassigned fund balance, which is available for spending at the government’s discretion. Other portions of the fund balance are either nonspendable, restricted, committed, or assigned to indicate that it is (1) not in spendable form, $44,905; (2) restricted for particular purposes, $111,358,465; (3) committed for particular purposes, $2,092,186; or (4) assigned for particular purposes, $75,878,532.
The General Fund isthe chief operating fund of the City. At the end of the current fiscal year, unassigned fund balance of the General Fund was $17,019,733. As a measure of the General Fund’s liquidity, it may be useful to compare both the unassigned fund balance and total fund balance to total fund expenditures. Unassigned fund balance represents 30.9% of total General Fund expenditures, while total fund balance represents 86.3% of total General Fund expenditures.
The fund balance of the General Fund decreased by $1,426,858 during the current fiscal year. This net decrease was the result of several factors, including:
Property tax revenues increased by over $600,000 as additional properties were added to the tax roll, and total assessed property values continued to rise.
Sales tax revenues decreased by over $1.7 million. This decrease was expected as FY 2023 appeared higher due to one-time audit adjustments received from the state.
There was also an over $650,000 increase in interest income received in the General Fund for FY 2024; this was largely due to high interest rates.
Expenditures related to Support Services increased by over $870,000 for FY 2024. A majority of this was for maintenance projects, including elevator remodeling, HVAC upgrades, flooring, and various other projects at City facilities.
Public Safety expenditures increased by over $1 million for FY 2024. Salary and benefit-related costswerethedrivingfactorsforthisincrease,whichresultedfromscheduledraisesandincreased overtime needs.
The General Obligation Debt Service Fund has a fund balance of $2,268,218, all of which is restricted for debt service payment. The fund balance decreased during the year by $725,045. This decrease was expected as reserves, property tax collections and future debt service requirements were all considered when determining the current property tax rate.
The fund balance in the General Capital Projects Fund ended the year at $70,061,339, an increase of $7,655,979.Thisincreasecanbeattributedto(1)interfundtransfersof$9.25milliontocash-fundupcoming roadway, drainage, and other infrastructure projects, (2) intergovernmental revenues of $3.5 million receivedtofundinfrastructureprojects, and(3)investment earningsalso increasedinthisfundfor FY 2024 byover$1.2millionbecause ofhighinterestrates. These inflowsofresourceswere made availabletofund various capital projects for the City and in FY 2024, the City spent $8.8 million of available project funding on capital outlays in the General Capital Projects Fund.
TheSouthlakeParksDevelopmentCorporationCapitalProjectsFundsignificantlyincreasedexpenditures, by approximately $11.5 million, for FY 2024 related to turf projects. In FY 2023, the City Council approved these projects to install new artificial turf on several sports fields at both Bicentennial and Bob Jones Park to improve safety, drainage, and maintenance. Also, $5.5 million transfer was made from the Southlake Park Development Corporation Special Revenue Fund to provide additional funding for future park capital projects.
The Southlake Parks Development Corporation Special Revenue Fund increased its fund balance by $367,967. This increase was primarily due to consistency in revenues from FY 2023 to FY 2024 overall, with sales tax decreasing from one-time audit adjustments received in FY 2023, increased charges for services received as the Southlake Pickleball Complex opened, and increased investment earnings from consistently high interest rates. Operating expenditures also increased for the fund because of the opening of the Pickleball Complex.
The Community Enhancement Development Corporation Special Revenue Fund increased its fund balance by $4,156,989. Revenues outpaced expenditures for the year, but expenditures did increase by almost $1 million. This expenditure increase was related to scheduled salary and benefit increases and purchases of equipment following the capital replacement schedule.
The City’s proprietary funds provide the same information found in the government-wide financial statements but in more detail.
Unrestricted net position reported in the Proprietary Funds included $70,801,660 in the Water and Sewer Fund and $13,086,009 in the Vehicle and Equipment Replacement Fund. The total net position in the Water and Sewer Fund increased by $10,690,031 while the net position of the Vehicle and Equipment Replacement Fund increased by $1,870,132. Revenues consistently outpace expenses in the Water and Sewer Fund, so even though revenues decreased by just over $2 million because of higher rainfall and expenses increased by almost $500,000 because of wastewater treatment, the growth of net position still remained strong. Transfers of $2.6 million to fund vehicle and equipment purchases, net of depreciation, resulted in an increase in net position in the Vehicle and Equipment Replacement Fund.
The City made revisions to the original budget approved by the City Council. Management’s estimate of the General Fund’s budgeted revenues increased $1,982,930 or 3.5% from the original budget based on year-to-date experience. Actual revenues exceeded budget by $1,484,374. The General Fund expenditure budget was amended by $1,060,005 to account for increases in legal settlements, property and liability insurance, and vehicle maintenance. Actual expenditures, in total, were $1,920,404 less than final budget. This favorable variance in conjunction with the revenue variance allowed actual ending fund balance to exceed ending budgetary fund balance by $4,501,478.
CapitalAssets—As of September 30, 2024, The City’s investment in capital assets for itsgovernmental and business-type activities amounts to $628,741,824 (net of accumulated depreciation and amortization). This investment includes land, buildings, improvements, machinery and equipment, infrastructure, construction in progress, and right-to-use assets.
TheCityhaselectedto usethe modifiedapproach foritsstreetsystem inlieuofthedepreciation method. An up-to-date inventory of these infrastructure assets was performed, and the annual costs to maintain and preserve these assets were established and disclosed through administrative policy. The current condition level of the street system meets the target condition level established by the City. There were no significant changes in the condition levels of infrastructure assets, and the differences between the estimated amounts necessary to maintain and preserve the street system at target condition levels and the actual amount of expense incurred for that purpose for 2024 were not material.
Major capital projects completed during the current year included the following:
Southlake Pickleball Complex
Drainage improvements at Dove Creek Trail, Highland Creek Crossing, and Creekside Drive
Kirkwood Intersection Improvements
Bob Jones Nature Center Barn
Various water line improvements
202420232024202320242023
Landandimprovements109,622,983$111,367,374$21,646,232$21,447,795$131,269,215$132,815,169 $ Constructioninprogress30,310,49517,195,8814,701,6875,519,58035,012,18222,715,461 Buildingsand improvements108,497,159106,641,26777,325107,643108,574,484106,748,910 Improvements--69,697,53471,571,27369,697,53471,571,273 Infrastructure269,447,100265,723,506--269,447,100265,723,506 Machineryandequipment11,783,46212,358,011173,79643,78111,957,25812,401,792 Right-to-useassets: Leasebuildings234,031---234,031Leaseequipment569,408447,330--569,408447,330 Subscriptions1,941,6422,366,91638,970-1,980,6122,366,916
Total532,406,280$516,100,285$96,335,544$98,690,072
Additional information on the City’s capital assets can be found in Note 4 on pages 66-67 of this report.
Long-term Debt - At the end of the current fiscal year, the governmental activities had $66,351,332 total bonds outstanding which were issued to finance capital improvements for roadway, parks and recreation, public buildings and infrastructure. The business-type activities had $34,118,969 of total bonds outstanding which were issued to finance projects to increase capacity of the utility system.
BondsPayable66,351,332$76,946,956$34,118,969$25,805,211$100,470,301$102,752,167 $ TotalOPEBliability803,422728,30664,59059,591868,012787,897 Netpensionliability14,056,52918,318,2441,214,7481,498,37715,271,27719,816,621 Compensatedabsences3,132,3082,703,25281,15098,5543,213,4582,801,806 Financedpurchases208,476308,329--208,476308,329 Leaseliabilities813,519448,904--813,519448,904 Subscriptionliabilities1,817,5612,165,39534,052-1,851,6132,165,395
$87,183,147101,619,386$35,513,509$27,461,733$122,696,656$129,081,119 $ GovernmentalActivitiesBusiness-typeActivitiesTotals
The City takes its debt obligation very seriously. Several years ago, the City Council, working with City staff, set goals to reduce the debt as a percentage of assessed valuation over the total long-term debt.
As seen in the figure below, the City has reduced the percentage from 3.01% in 2003 to 0.28% in 2024, during a time of growth for the City. Our debt management strategies receive a rigorous annual review from bondrating agenciestasked with letting potential borrowersknowhow credit-worthy the City is. The City has three AAA ratings — a strong external endorsement of the City’s financial management.
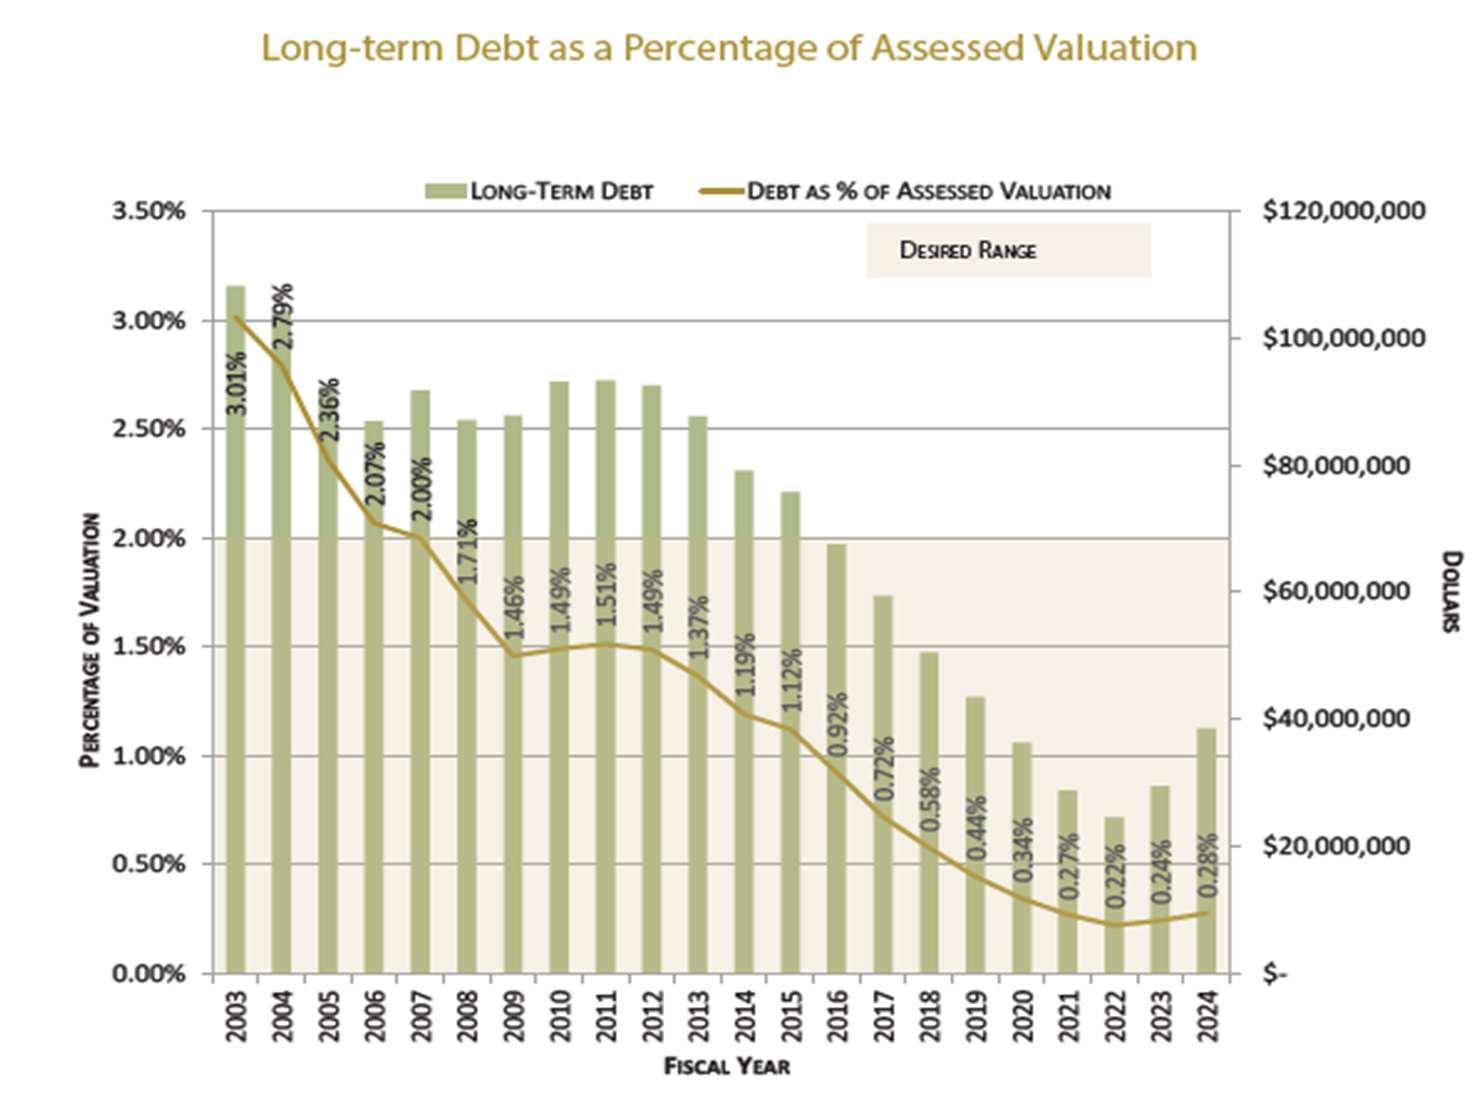
Through the City’s use of cash and aggressive amortization schedules when debt is issued, the City has reduced the property tax-supported debt per capita from $3,506 in 2010 to $1,179 in 2024.
The City ispermitted by Article XI, Section 5, of the State of TexasConstitution to levy taxes up to$2.50 per $100 of assessed valuation for general governmental services including the payment of principal and interest on general obligation long-term debt.
Additional information on the City’s long-term debt can be found in Note 5 on pages 67-73 of this report.
TheStateof Texasdoesnothave apersonalincometaxbyconstitution,so itoperatesprimarilyusingsales and gasoline taxes. Local governments rely primarily on property and sales taxes and fees to fund their government activities.
Whilepropertytaxesareimportanttothe City, they represent36.5%oftotalgovernmentalrevenue. Sales tax has grown to the largest governmental resource, representing 37.8% of total governmental revenue. The City monitors all of its resources and determines the need for program adjustment or fee increases accordingly.
The FY 2025 adopted budget incorporates a tax rate of $0.305 per $100 valuation, reducing the rate by just over one cent. The tax rate of $0.305 is split between General Fund operations and debt service. The allocationforFY 2025 is$0.250forgeneraloperationsand $0.055 fordebt service.The reduction has been taken from the operations part of the rate.
The ongoing use of the 20% homestead exemption will complement the current over-65 exemption of $75,000,disabledexemption of$75,000,andtheover-65taxfreeze.Thecontinuationoftheseexemptions offers additional tax relief. A 20% homestead exemption will reduce the taxable value of an averagevalued home in Southlake by $218,883.
The property owner of an average-valued home will see the equivalent of a tax rate reduction of approximately 6.4 cents per $100 valuation with the exemption applied. With the homestead exemption inplace,andconsideringthetaxratereduction,theequivalentresidentialtaxrateonanaverage-valued home is $0.241.
More than 70% of the City’s General Fund budgeted expenditures are related to personnel costs. It is the City’s goal to continue to provide for a fair compensation and benefits program to ensure a stable and high-performing workforce. The FY 2025 budget recognizes and addresses the competitive labor market and the need to recruit and retain strong talent.
Multi-year financial planning is another budget development consideration, one of the most important. Executive leaders evaluate the operational impact of all identified projects and include those costs in future budget projections. Staff monitors trends that depict the long-term financial health of the City and uses these trends to make decisions to reach financial and service goals.
TheCityhastakenanadditionalformalsteptounderstandandplanforthe organization’sfinancialfuture by adopting the Sustainability Master Plan as an element of the Southlake Comprehensive Plan. It contains formal recommendations to ensure positive financial outcomes for the City.
This financial report is designed to provide a general overview of the City of Southlake’s finances for all those with an interest in the government’s finances. Questions concerning any of the information provided in this report or requests for additional financial information should be addressed to the Office of the Chief Financial Officer, 1400 Main Street, Suite 420, Southlake, Texas 76092.
Statement of Net Position
September 30, 2024
GOVERNMENTALBUSINESS-TYPE ACTIVITIESACTIVITIESTOTAL ASSETS
Cashandinvestments219,376,288$67,515,787$286,892,075 $ Receivables(netofallowanceforuncollectibles)9,513,4626,801,61216,315,074 Prepaiditems2,197,532-2,197,532 Inventories31,529-31,529 Restrictedassets
Cashandcashequivalents2,262,93624,193,27526,456,211 Restrictedcashforcustomerdeposits-270,412270,412 OPEBasset865,618-865,618 Capitalassets:
Notbeingdepreciated/amortized363,476,41426,347,919389,824,333 Netofdepreciation/amortization168,929,86669,987,625238,917,491 Totalassets766,653,645195,116,630961,770,275
DEFERREDOUTFLOWSOFRESOURCES
Deferredlossonrefunding321,049141,549462,598 Deferredoutflows-TMRSpension7,495,410572,0888,067,498 Deferredoutflows-TMRSOPEB165,69812,826178,524 Deferredoutflows-OPEBHealth590,124-590,124
Totaldeferredoutflowsofresources8,572,281726,4639,298,744
LIABILITIES
Accountspayable6,826,3232,452,7889,279,111 Accruedliabilities2,024,382302,5792,326,961 Accruedinterestpayable-138,552138,552 Retainagepayable930,72919,187949,916 Depositspayable798,361-798,361 Unearnedrevenue2,155,302174,6812,329,983 Liabilitiespayablefromrestrictedassets Accruedinterest314,927-314,927 Customermeterdeposits-270,412270,412 Non-currentliabilities:
Duewithinoneyear12,024,8512,528,89214,553,743 Dueinmorethanoneyear75,158,29632,984,617108,142,913
Totalliabilities100,233,17138,871,708139,104,879
DEFERREDINFLOWSOFRESOURCES
Deferredgainonrefunding63,266232,776296,042 Deferredinflows-leases680,315-680,315 Deferredinflows-TMRSpension331,45722,059353,516 Deferredinflows-TMRSOPEB330,37423,965354,339 Deferredinflows-OPEBHealth617,261-617,261
Totaldeferredinflowsofresources2,022,673278,8002,301,473
NETPOSITION
Netinvestmentincapitalassets472,883,75274,231,905547,115,657 Restrictedfor: Debtservice4,776,366-4,776,366 OPEBAsset865,618-865,618 Capitalprojects24,660,776-24,660,776 Municipalcourt920,494-920,494 Reinvestmentzone11,565,009-11,565,009 Police7,323,201-7,323,201 Parksandrecreation55,441,867-55,441,867 Library21,403-21,403 Stormwater2,150,530-2,150,530 Promotionofcultureandtourism4,223,117-4,223,117 Impactfees-11,659,02011,659,020 Unrestricted 88,137,94970,801,660158,939,609
TOTALNETPOSITION
$672,970,082156,692,585$829,662,667 $
of Activities
For the Fiscal Year Ended September 30, 2024
Functions/ProgramActivities
PRIMARYGOVERNMENT:
GovernmentalActivities:
ChangesinNetPosition
Net(Expense)Revenueand PrimaryGovernment ProgramRevenues
ChargesforOperatingGrantsCapitalGrantsGovernmentalBusiness-Type ExpensesServicesandContributionsandContributionsActivitiesActivitiesTOTAL
Generalgovernment26,994,341$2,271,472$161,195$-$(24,561,674)$-$(24,561,674) $ Publicsafety27,798,5981,081,451125,414-(26,591,733)-(26,591,733) Publicworks10,709,5633,337,594-4,890,150(2,481,819)-(2,481,819) Cultureandrecreation19,939,3715,607,86589,175-(14,242,331)-(14,242,331) Promotionofcultureandtourism871,217---(871,217)-(871,217) Interestonlong-termdebt1,867,737---(1,867,737)-(1,867,737)
Totalgovernmentalactivities88,180,82712,298,382375,7844,890,150(70,616,511)-(70,616,511)
Business-typeActivities:
Waterandsewer28,969,34035,597,701-1,734,388-8,362,7498,362,749
Totalbusiness-typeactivities28,969,34035,597,701-1,734,388-8,362,7498,362,749
TOTALPRIMARYGOVERNMENT $117,150,16747,896,083$375,784$6,624,538$(70,616,511)8,362,749(62,253,762)
Generalrevenuesandtransfers: Generalrevenues
Propertytaxes,leviedforgeneralpurposes43,315,203-43,315,203 Salestaxes 44,830,166-44,830,166 Franchisetaxes3,445,059-3,445,059 Investmentincome11,116,6643,839,86814,956,532 Gainondisposalofcapitalassets143,14696,269239,415 Miscellaneous151,752-151,752 Transfers1,608,855(1,608,855)-
Totalgeneralrevenuesandtransfers104,610,8452,327,282106,938,127 Changeinnetposition33,994,33410,690,03144,684,365
Netposition,beginningofyear638,975,748146,002,554784,978,302
NETPOSITION,endofyear $672,970,082156,692,585$829,662,667 $
The Notes to the Financial Statements are an integral part of this statement.
Balance Sheet – Governmental Funds
September 30, 2024
ASSETS
Cashandinvestments49,342,043$2,262,936$72,861,483$14,348,812 $ Receivables,netofallowancesforuncollectibles: Taxes3,528,3615,754-Interest68,4262,36176,02314,971 Leases726,746--Other813,24428-Inventories31,529--Prepaiditems13,376--TOTALASSETS
LIABILITIES,DEFERREDINFLOWSOFRESOURCES, ANDFUNDBALANCES
LIABILITIES
$72,937,506$14,363,783 $
Accountspayable3,327,135$-$973,261$538,108 $ Accruedliabilities1,699,290--Retainagepayable--313,104569,590 Depositspayable67,476-659,635Unearnedrevenue781,384-930,167TOTALLIABILITIES 5,875,285-2,876,1671,107,698 DEFERREDINFLOWSOFRESOURCES Unavailableresources425,5182,861-Deferredinflows-leases680,315---
1,105,8332,861--
Nonspendable44,905--Restricted-2,268,21824,660,77613,256,085 Committed---Assigned30,477,969-45,400,563Unassigned17,019,733--TOTALFUNDBALANCES 47,542,6072,268,21870,061,33913,256,085
TOTALLIABILITIES,DEFERREDINFLOWSOF
SPECIALREVENUE
SOUTHLAKECOMMUNITY
PARKSENHANCEMENTNONMAJORTOTAL DEVELOPMENTDEVELOPMENTGOVERNMENTALGOVERNMENTAL CORPORATIONCORPORATIONFUNDSFUNDS
$12,980,90324,777,718$34,174,694$210,748,589 $ 1,732,7681,283,532671,1637,221,578 13,55825,94535,626236,910 ---726,746
38,456204,058261,2241,317,010 ---31,529 ---13,376
$14,765,68526,291,253$35,142,707$220,295,738 $
$92,963713,463$1,181,398$6,826,328 $ 30,292133,801160,9992,024,382 --48,035930,729 -71,250-798,361 -443,751-2,155,302
123,2551,362,2651,390,43212,735,102
25,637-32,484486,500 ---680,315
25,637-32,4841,166,815 ---44,905 14,616,79324,928,98831,627,605111,358,465 --2,092,1862,092,186 ---75,878,532 ---17,019,733
14,616,79324,928,98833,719,791206,393,821
$14,765,68526,291,253$35,142,707$220,295,738 $
Reconciliation of the Governmental Funds Balance Sheet to the Statement of Net Position September 30, 2024
Totalfundbalances-governmentalfunds206,393,821 $
Amountsreportedforgovernmentalactivitiesinthestatementofnetpositionaredifferentbecause: Capitalassetsusedingovernmentalactivitiesarenotcurrentfinancialresourcesandtherefore,arenot
reportedinthegovernmentalfundsbalancesheet(less$6,803,707inassetsallocatedto governmentalactivitiesfromtheinternalservicefund).
525,602,573
Interestpayableonlong-termdebtdoesnotrequirecurrentfinancialresources;therefore,interest (314,927)
payableisnotreportedasaliabilityinthegovernmentalfundsbalancesheet.
Internalservicefundsareusedbymanagementtochargethecostofcertainactivities,suchasfleet
management,toindividualfunds.Thisamountrepresentstheassetslesstheliabilitiesoftheinternal servicefundallocatedtogovernmentalactivities.
19,889,716
OPEBassethasnotbeenincludedinthegovernmentalfundfinancialstatements,astheseassetsdo notrepresentcurrentfinancialresources.865,618
Revenuesearnedbutnotavailablewithinsixtydaysoftheyearendarenotrecognizedasrevenueon thefundfinancialstatements.486,500
Fordebtrefundings,thedifferencebetweentheacquisitionpriceandnetcarryingamountofthedebt
hasbeendeferredandamortizedinthegovernment-widefinancialstatements.Thisamountisthenet ofdeferredlosses,$321,049,andgains($63,266)onrefundings.
257,788
DeferredoutflowsofresourcesrelatedtotheCity'spensionandOPEBliabilitiesresultinanincreasein netpositioninthegovernment-widefinancialstatements.8,251,232
DeferredinflowsofresourcesrelatedtotheCity'spensionandOPEBliabilitiesresultinadecreasein netpositioninthegovernment-widefinancialstatements.(1,279,092)
Long-termliabilities,includingbondspayableandnetpensionandOPEBliabilities,arenotdueand payableinthecurrentperiodandthereforearenotreportedinthefundfinancialstatements.(87,183,147)
NETPOSITIONOFGOVERNMENTALACTIVITIES $672,970,082
Statement of Revenues, Expenditures, and Changes in Fund Balances – Governmental Funds
For the Fiscal Year Ended September 30, 2024
REVENUES
Advaloremtaxes,penaltiesandinterest27,190,295$5,690,222$-$$ Franchisetaxes3,445,059--Municipalsalesandmixedbeveragetaxes21,278,207--Licenses,permitsandfees1,924,639--Chargesforservices2,373,061--Finesandforfeitures860,634--Intergovernmentalrevenue433,490-3,573,901Capitalrecoveryfees--143,101Investmentincome(losses)2,747,448168,4303,544,673879,060 Contributions31,505-1,481Miscellaneous134,402--Totalrevenues60,418,7405,858,6527,263,156879,060 EXPENDITURES
Current Generalgovernment Citysecretary/mayor618,645--Citymanager'soffice1,226,412--Humanresources905,101--Supportservices5,762,333--Economicdevelopment441,221--Finance2,117,153--Municipalcourt790,601--Teencourt164,960--Informationtechnology3,479,999--Publicsafety Policeservices8,904,349--Fireservices12,192,174--Publicsafetysupport1,702,592--Publicworks Publicworksadministration2,775,504--Streetsanddrainage1,479,051-1,656,983Planning1,221,947--Buildinginspection1,266,686--Culturalandrecreation Communityservices1,649,823--Parksandrecreation4,407,542-1,096Libraryservices1,224,652--Promotionofcultureandtourism---Intergovernmental---Capitaloutlay1,685,400-7,199,09813,968,342 Debtservice: Principalretirement1,003,9615,771,358-Interestandfiscalcharges53,2721,209,680-Totalexpenditures55,073,3786,981,0388,857,17713,968,342 Excess(deficiency)ofrevenuesover(under)expenditures5,345,362(1,122,386)(1,594,021)(13,089,282) OTHERFINANCINGSOURCES(USES) Issuanceoflease752,937--Issuanceofsubscriptions333,898--Saleofcapitalassets43,351--Transfersfromotherfunds 3,131,080397,3419,250,0005,500,000 Transferstootherfunds (11,033,486)--Totalotherfinancingsources(uses)(6,772,220)397,3419,250,0005,500,000 Netchangeinfundbalances(1,426,858)(725,045)7,655,979(7,589,282) Fundbalances,beginningofyear,aspreviouslypresented48,969,4652,993,26362,405,360Changewithinfinancialreportingentity(nonmajortomajor)---20,845,367 Fundbalances,beginningofyear,asrestated48,969,4652,993,26362,405,36020,845,367 FUNDBALANCES,ENDOFYEAR $47,542,6072,268,218$70,061,339$13,256,085 $
SOUTHLAKECOMMUNITY
PARKSENHANCEMENTNONMAJORTOTAL DEVELOPMENTDEVELOPMENTGOVERNMENTALGOVERNMENTAL CORPORATIONCORPORATIONFUNDSFUNDS
$--$10,470,200$43,350,717 $ ---3,445,059 10,661,7257,897,5744,992,66044,830,166 --342,3102,266,949 255,3894,541,8741,613,0768,783,400 --101,507962,141 --7,0604,014,451 ---143,101 599,7931,111,6591,562,17510,613,238 -14,84043,02990,855 -1,10416,246151,752 11,516,90713,567,05119,148,263118,651,829
---618,645 ---1,226,412 ---905,101 --529,6946,292,027 ---441,221 ---2,117,153 --71,208861,809 ---164,960 ---3,479,999
--2,880,54311,784,892 --7,06012,199,234 ---1,702,592 ---2,775,504 --602,9473,738,981 ---1,221,947 ---1,266,686
2,337,9096,181,16231,32710,200,221 ---4,408,638 --7,8891,232,541 --871,217871,217 --6,849,9516,849,951 72,236-1,756,01724,681,093
-13,0164,213,14111,001,476 -1,0731,221,8862,485,911 2,410,1456,195,25119,042,880112,528,211 9,106,7627,371,800105,3836,123,618
---752,937 --43,458377,356 ---43,351 --5,908,63224,187,053 (8,738,795)(3,214,811)(2,219,335)(25,206,427) (8,738,795)(3,214,811)3,732,755154,270 367,9674,156,9893,838,1386,277,888 14,248,82620,771,99950,727,020200,115,933 --(20,845,367)14,248,82620,771,99929,881,653200,115,933
$14,616,79324,928,988$33,719,791$206,393,821 $
Reconciliation of the Statement of Revenues, Expenditures, and Changes in Fund Balances of the Governmental Fund to the Statement of Activities
For the Fiscal Year Ended September 30, 2024
Netchangeinfundbalances-totalgovernmentalfunds6,277,888 $ Amountsreportedforgovernmentalactivitiesinthestatementofactivities aredifferentbecause:
Governmentalfundsreportcapitaloutlaysasexpenditures.However,inthestatementofactivities, 24,672,473
thecostofthoseassetsisallocatedovertheirestimatedusefullivesandreportedasdepreciationand amortizationexpense.Thisistheamountofcapitalassetsadditionsrecordedinthecurrentperiod(does notincludeadditionsof$1,758,809allocatedfrominternalservicefund).
Depreciationandamortizationexpenseoncapitalassetsarereportedinthestatementofactivities (10,024,229)
butdoesnotrequiretheuseofcurrentfinancialresources.Therefore,depreciationandamortization expensesarenotreportedasexpendituresinthegovernmentalfunds.(doesnotinclude$1,351,619 allocatedfrominternalservicefund).
funds,whiletherepaymentoftheprincipaloflong-termdebtconsumesthecurrentfinancialresourcesof governmentalfunds.Neithertransaction,however,hasanyeffectonnetposition.Also,governmental fundsreporttheeffectofpremiums,discounts,andsimilaritemswhendebtisfirstissued,whereasthe amountsaredeferredandamortizedinthestatementofactivities.Thisamountistheneteffectofthe followingitems:
Theissuanceoflong-termdebt(e.g.bonds)providescurrentfinancialresourcestogovernmental Issuanceofright-to-useleases(752,937) $ IssuanceofSBITAs(377,356) Principalpaymentsondebt9,900,211 Principalpaymentsonfinancedpurchases,leaseandsubscriptionliabilities1,101,265 Amortizationofpremiumsanddeferredgainsandlosses548,574 10,419,757
Thechangesinnetpensionliabilityanddeferredoutflows/inflowsfromTMRSarenotreportedinthe (223,377)
governmentalfunds.Thisistheneteffectofthedecreaseinthenetpensionliability,$4,261,714,increasein deferredinflowsofresources,($331,457),anddecreaseindeferredoutflowsofresources,($4,153,634).
ThechangesintotalOPEBliabilityanddeferredoutflows/inflowsfromTMRSarenotreportedin (18,186)
thegovernmentalfunds.ThisistheneteffectoftheincreaseinthetotalSDBFOPEBliability($75,116), decreaseindeferredinflowsofresources,$77,537,anddecreaseindeferredoutflowsofresources,($20,607).
ThechangesinnetOPEBliabilityanddeferredoutflows/inflowsforhealthcarearenotreportedin 120,767
thegovernmentalfunds.ThisistheneteffectoftheincreaseinthetotalhealthcareOPEBasset,$413,330, increaseindeferredinflowsofresources,($70,950),anddecreaseindeferredoutflowsofresources, ($221,613).
Currentyearchangesinthelong-termliabilityforcompensatedabsencesdonotrequiretheuseof currentfinancialresources;andtherefore,arenotreportedasexpendituresingovernmentalfunds.(429,055) Currentyearchangesinaccruedinterestpayabledonotrequiretheuseofcurrentfinancial resources;andtherefore,arenotreportedasexpendituresingovernmentalfunds.69,600 Internalservicefundsareusedbymanagementtochargethecostsofcertainactivities,suchas 1,870,132 Governmentalfundsdonotrecognizeassetscontributedbydevelopers.However,inthestatement 1,171,669
fleetmanagement,toindividualfunds.Thenetincomeoftheinternalservicefundisallocatedentirelyto governmentalactivities.
ofactivities,thefairvalueofthoseassetsisrecognizedasrevenue,thenallocatedovertheirestimated usefullivesandreportedasdepreciationexpense.
Gainondisposalofcapitalassetsresultsinanincreaseinnetposition,buttheneteffectisnot 5,654
reportedingovernmentalfunds.
Certainrevenuesinthegovernment-widestatementofactivitiesthatdonotprovidecurrentfinancial 81,241
resourcesarenotreportedasrevenueinthegovernmentalfunds.
September 30, 2024
BUSINESS-TYPEGOVERNMENTAL ACTIVITIESACTIVITIES
WATERANDSEWERVEHICLEANDEQUIPMENT ENTERPRISEREPLACEMENTINTERNAL FUNDSERVICEFUND
ASSETS
CURRENTASSETS
Cashandinvestments67,515,787$10,890,635 $ Receivables,netofallowanceforuncollectibles: Billedandunbilledtradeaccounts6,705,485Interest96,12711,218 Prepaidexpenses-2,184,156 Restrictedassets:
Cashrestrictedforcapital24,193,275Restrictedcashforcustomerdeposits270,412-
Totalcurrentassets98,781,08613,086,009
NON-CURRENTASSETS
Capitalassets: Land21,646,232Buildingsandimprovements935,501Distributionsystem159,003,927Equipment2,891,880703,246 Vehicles-14,731,413 Capacityrights9,190,988Constructioninprogress4,701,687SBITA87,316-
Totalcapitalassets198,457,53115,434,659
Less:accumulateddepreciationandamortization(102,121,987)(8,630,952) Capitalassets,netofaccumulateddepreciationandamortization96,335,5446,803,707
Totalnon-currentassets96,335,5446,803,707
Totalassets195,116,63019,889,716
DEFERREDOUTFLOWOFRESOURCES
Deferredlossonrefunding141,549Deferredoutflows-TMRSpension572,088Deferredoutflows-TMRSOPEB12,826Totaldeferredoutflowsofresources726,463$$
BUSINESS-TYPEGOVERNMENTAL ACTIVITIESACTIVITIES
WATERANDSEWERVEHICLEANDEQUIPMENT ENTERPRISEREPLACEMENTINTERNAL FUNDSERVICEFUND
LIABILITIES,DEFERREDINFLOWSOFRESOURCES,ANDNETPOSITION
CURRENTLIABILITIES
Accountspayable
$2,452,788$ Accruedliabilities302,579Retainagepayable19,187Accruedinterestpayable138,552Unearnedrevenue174,681Currentportionofcompensatedabsences20,686Currentportionofsubscriptionliability29,320CurrentportionoftotalOPEBliability1,192Currentportionofgeneralobligationdebt2,477,694Payablefromrestrictedassets: Customermeterdeposits270,412Totalcurrentliabilities5,887,091-
NON-CURRENTLIABILITIES
Compensatedabsences60,464Generalobligationdebt31,641,275Subscriptionliability4,732Netpensionliability1,214,748TotalOPEBliability63,398Totalnon-currentliabilities32,984,617Totalliabilities38,871,708-
DEFERREDINFLOWOFRESOURCES
Deferredgainonrefunding232,776Deferredinflows-TMRSpension22,059Deferredinflows-TMRSOPEB23,965Totaldeferredinflowsofresources278,800-
NETPOSITION
Netinvestmentincapitalassets74,231,9056,803,707 Restrictedforimpactfees11,659,020Unrestricted70,801,66013,086,009
TOTALNETPOSITION $156,692,58519,889,716 $
CityofSouthlake,Texas
Statement of Revenues, Expenses, and Changes in Net Position – Proprietary Funds For the Fiscal Year Ended September 30, 2024
OPERATINGREVENUES
Chargesforsalesandservices: Water,sewerandgarbage35,550,815 $ $Servicecharges46,886-
Totaloperatingrevenues35,597,701-
OPERATINGEXPENSES
Personnelservices2,917,911Contractualservices2,676,685Supplies303,645Utilities9,868,178Administrative10,087Maintenance7,084,1584,045 Professionalbenefits99,882Depreciationandamortization5,224,7401,351,619
Totaloperatingexpenses28,185,2861,355,664
7,412,415(1,355,664)
NON-OPERATINGREVENUES(EXPENSES)
Investmentincome3,839,868503,426 Gainondisposalofcapitalassets96,26994,141 Interestexpenseandbondadministrationexpense(784,054)-
Totalnon-operatingrevenues(expenses)3,152,083597,567
INCOME(LOSS)BEFORECAPITAL
CAPITALCONTRIBUTIONSANDTRANSFERS
Capitalcontributions-propertyowners1,471,706Contributions-impactfees262,682Transfersfromotherfunds-2,628,229 Transferstootherfunds(1,608,855)-
Totalcapitalcontributionsandtransfers125,5332,628,229
Changeinnetposition10,690,0311,870,132
Netposition,beginningofyear146,002,55418,019,584
NETPOSITION,ENDOFYEAR $156,692,58519,889,716 $
of Cash Flows – Proprietary Funds
For the Fiscal Year Ended September 30, 2024
BUSINESS-TYPEGOVERNMENTAL ACTIVITIESACTIVITIES
WATERANDSEWERVEHICLEANDEQUIPMENT ENTERPRISEREPLACEMENTINTERNAL FUNDSERVICEFUND
CASHFLOWSFROMOPERATINGACTIVITIES
Cashreceivedfromcustomersandusers36,279,967$$ Cashpaymentstosuppliers(21,601,529)(1,147,000) Cashpaymentstoemployees (2,919,238)-
Netcashprovidedby(usedin)operatingactivities11,759,200(1,147,000)
CASHFLOWSFROMCAPITALANDRELATED FINANCINGACTIVITIES
Acquisitionandconstructionofcapitalassets(1,717,392)(1,766,294) Principalpaymentsonbonds(2,488,643)Proceedsfromissuanceofbonds9,805,000Premiumonbondissuance1,279,193Principalpaymentsonsubscriptionliability(28,880)Interestpaidoncapitaldebt(1,004,881)Proceedsfromdisposalofcapitalassets96,26916,141 Contributions-impactfees262,682-
Netcashprovidedby(usedin)capitalandrelated financingactivities6,203,348(1,750,153)
CASHFLOWSFROMNON-CAPITALFINANCINGACTIVITIES
Transfersfromotherfunds-2,628,229 Transferstootherfunds(1,608,855)-
Netcashprovidedby(usedin)non-capital financingactivities(1,608,855)2,628,229
CASHFLOWSFROMINVESTINGACTIVITIES
Netinvestmentgains3,839,868503,426 Interestreceived(75,638)(8,235)
Netcashprovidedbyinvestingactivities3,764,230495,191
Netchangeincashandcashequivalents20,117,923226,267
CASHANDCASHEQUIVALENTS,beginningofyear 71,861,55110,664,368
RECONCILIATIONTOSTATEMENTOFNETPOSITION
Cashandcashequivalents67,515,787$10,890,635 $ Cashrestrictedforcapital24,193,275Restrictedcashforcustomerdeposits270,412Totalcashandcashequivalents $91,979,47410,890,635 $
RECONCILIATIONOFOPERATINGINCOME(LOSS)TONETCASH PROVIDEDBY(USEDIN)OPERATINGACTIVITIES
Operatingincome(loss)7,412,415$(1,355,664) $ Adjustmentstoreconcileoperatingincome(loss)tonetcash providedby(usedin)operatingactivities: Depreciationandamortization5,224,7401,351,619 Decrease(increase)inassetsanddeferredoutflows ofresources
Receivables719,686Prepaidexpenses-(1,142,955) Deferredoutflowsofresources-pensionsandOPEB277,809Increase(decrease)inliabilitiesanddeferredoutflows ofresources Payablesandaccruals(1,576,298)Customerdeposits(27,925)Deferredinflowsofresources-pensionsandOPEB16,898DecreaseinpensionandOPEBliabilities(278,630)Unearnedrevenue(9,495)-
Netcashprovidedby(usedin)operatingactivities11,759,200$(1,147,000) $
NON-CASHCAPITALANDRELATEDFINANCING: Contributionsofcapitalassetsfromdevelopers1,471,706$$
OPEB Liability Trust Fund
Statement of Fiduciary Net Position December 31, 2023
$ TOTALNETPOSITION $2,740,052
* The Southlake Other Post Employment Benefit (OPEB) Liability Trust Fund is reported as of December 31, 2023.
The City of Southlake (the City) operates under a Home Rule Council – Manager form of government. All powers of the City are vested in an elected council, which enables local legislation, adopts budgets, determines policies and appoints the City Manager. The City Manager is responsible for executing the laws and administering the government of the City.
The accounting and reporting policies of the City relating to the funds included in the accompanying basic financial statements conform to accounting principles generally accepted in the United States of America applicableto state andlocalgovernments. Generallyaccepted accountingprinciplesfor local governments include those principles prescribed by the Governmental Accounting Standards Board (GASB). The more significant accounting policies of the City are described below.
The City is governed by an elected mayor and six-member council. The accompanying financial statements present the government and its component units, entities for which the government is considered to be financially accountable. The criteria for including legally separate organizations as component units within the City’s reporting entity are set forth in Section 2100 of GASB’s Codification of Governmental Accounting and Financial Reporting Standards (GASB Codification).
Blended component units are, in substance, part of the primary government’s operations, even though they are legally separate entities. Thus, blended component units are appropriately presented as funds of the primary government.
Based on these criteria, the financial information of the following entities has been blended within the reporting entity. Individual financial statements are not available for these component units.
Southlake Parks Development Corporation (SPDC) – The SPDC is a nonprofit industrial development corporation formed in January 1994 under the Development Corporation Act of 1979. The SPDC is organized exclusively to act on behalf of the City for the financing, development and operation of parks and recreation facilities. The affairs of the SPDC are managed by a seven member board of directors, of which four are members of the City Council. The annual corporate budget andissuance of debt must be approved by the City Council. Since the Board of the SPDC is substantively the same as the City Council, the SPDC has been reported as a blended component unit.
Southlake Community Enhancement and Development Corporation (CEDC) – The CEDC was formed under the Development Corporation Act of 1979, as amended, Title 12, Subtitle C1 of the Texas Local Government Code. The CEDC isorganized topromote economic development within the City, including developing, implementing, providing and financing projects including a community entertainment and recreation center for the City. The CEDC is governed by a seven member board appointed by the City Council.Theannualbudgetandissuance ofdebtmustbeapprovedbytheCityCouncil.SincetheCEDC provides services entirely to the City, it has been reported as a blended component unit.
Southlake Tax Increment Financing District (TIF) – The TIF was formed to finance and make public improvements, under the authority of the Tax Increment Financing Act. The TIF is governed by a nine member board of directors consisting of the eight members appointed by the City Council, and one member appointed by Carroll Independent School District. Since the Board of the TIF is substantively the same as the City Council, the City has operational responsibility for the TIF and the City receives financial benefit from the TIF, the TIF has been reported as a blended component unit.
Southlake Crime Control and Prevention District (CCD) – The CCD was formed under Chapter 363 of the Texas Local Government Code, the Crime Control and Prevention Act. The CCD is organized exclusively to act on behalf of the City for the financing, development and crime control throughout the City. The CCD is governed by a seven member board appointed by the City Council. The annual budget and issuance of debt must be approved by the City Council. Since the CCD provides services entirely to the City, it has been reported as a blended component unit.
The government-wide financial statements (the statement of net position and the statement of activities) report information on all of the activities of the City, except for fiduciary funds. The effect of interfund activity, within the governmental and business-type activities columns, has been removed from these statements. Governmental activities, which normally are supported by taxes and intergovernmental revenues, are reported separately from business-type activities, which rely to a significant extent on fees and charges for support.
The statement of activities demonstrates the degree to which the direct expenses of a given program are offset by program revenues. Direct expenses are those that are clearly identifiable with a specific program.
Program revenues include 1) charges to customers or applicants who purchase, use, or directly benefit from goods, services, or privileges provided by a given program and 2) operating or capital grants and contributions that are restricted to meeting the operational or capital requirements of a particular program. Taxes and other items not properly included among program revenues are reported insteadas general revenues.
The City segregates transactions related to certain functions or activities in separate funds in order to aid financial management and to demonstrate legal compliance. Separate statements are presented for governmental funds and proprietary funds. These statements present each major fund as a separate column in the fund financial statements; all nonmajor funds are aggregated and presented in a single column.
Governmental funds are those funds through which most governmental functions typically are financed. The measurement focus of governmental funds is on the sources, uses and balances of current financial resources.
The City reports the following major governmental funds:
The General Fund is the general operating fund of the City. It is used to account for all financial resources not accounted for in other funds. All general tax revenues and other receipts that are not restrictedbylaworcontractualagreementtosomeotherfundareaccountedforinthisfund.General operatingexpenditures,fixedchargesandcapitalimprovementcoststhatarenotpaidthroughother funds are paid from the General Fund.
The General Obligation Debt Service Fund is used to account for the accumulation of financial resources for the payment of principal, interest and related costs on long-term debt paid primarily from taxes levied by the City. The fund balance of the General Obligation Debt Service Fund is restricted exclusively for debt service expenditures.
Notes to the Financial Statements
The General Capital Projects Fund is used to account for resources used for the acquisition and/or construction of capital facilities by the City, except those financed by proprietary funds and not accounted for by another capital projects fund.
The Southlake Parks Development Corporation Capital Projects (SPDCCP) Fund was established to fund the acquisition and construction of park recreational facilities as approved by the SPDC board of directors. The fund has been funded primarily through the issuance of general obligation debt.
The Southlake Parks Development Corporation (SPDC) Fund (Special Revenue) was established to accountforthe general operationsofthenon-profitcorporation establishedtofinance,developand operate park and recreational facilities. The SPDC is funded primarily through municipal sales taxes.
The Community Enhancement and Development Corporation (CEDC) Fund (Special Revenue) was established to account for the general operations of the non-profit corporation established to finance, develop and operate a community entertainment and recreation center. The CEDC is funded primarily through municipal sales taxes and user fees.
Proprietary Funds are accounted for using the economic resources measurement focus and the accrual basis of accounting. The accounting objectives are determinations of net income, financial position and cash flow. All assets, deferred outflows of resources, liabilities, and deferred inflows of resources are included in the Statement of Net Position.
The City reports the following major proprietary fund:
The Water and Sewer Enterprise Fund is used to account for the acquisition, operation and maintenanceofamunicipalwaterandsewerutility,supportedprimarilybyuserchargestothepublic.
Additionally,theCityreportsanInternalServiceFundwhichisusedtoaccountforvehicleandequipment replacement provided to departments of the City.
Proprietary funds distinguish operating revenues and expenses from non-operating items. Operating revenues and expenses generally result from providing services and producing and delivering goods in connection with a proprietary fund’s principal ongoing operations. Operating expenses for the proprietary funds include the cost of personnel and contractual services, supplies and depreciation on capital assets. All revenues and expenses not meeting this definition are reported as non-operating revenues and expenses.
TheCity alsopresents onetrustfund, SouthlakeOPEB Liability Trust Fund. TheCity’sOPEB LiabilityTrust Fund accounts for the funding of postemployment healthcare benefits for retirees of the City and their dependents which is presented as of December 31, 2023.
Measurement focus refers to what is being measured; basis of accounting refers to when revenues and expenditures are recognized in the accounts and reported in the financial statements. Basis of accounting relates to the timing of the measurement made, regardless of the measurement focus applied.
The government-wide statements and fund financial statements for proprietary and fiduciary funds are reported using the accrual basis of accounting. The government-wide, proprietary fund, and fiduciary trust fund financial statements are prepared using the economic resources measurement focus. The economic resources measurement focus means all assets and liabilities (whether current or non-current) are included in the statement of net position and the operating statements present increases (revenues) and decreases (expenses) in total net position. Under the accrual basis of accounting, revenues are recognized when earned, including unbilled water and sewer services which are accrued. Expenses are recognized at the time the liability is incurred.
Governmental fundfinancial statementsare reported using the current financial resourcesmeasurement focusandareaccountedforusingthemodifiedaccrualbasisofaccounting.Underthemodifiedaccrual basisofaccounting,revenuesare recognizedwhensusceptibletoaccrual;i.e.,when theybecomeboth measurable and available.
“Measurable” means the amount of the transaction can be determined and “available” means collectible within the current period or soon enough thereafter to be used to pay liabilities of the current period. The City considers all revenues as available if they are collected within 60 days after year end. Expenditures are recorded when the related fund liability is incurred, except for unmatured interest on long-term debt which is recognized when due, and certain compensated absences and claims and judgments which are recognized when the obligations are expected to be liquidated with expendable available financial resources.
Propertytaxes,salestaxes,franchisetaxesandinterestaresusceptibletoaccrual.Otherreceiptsbecome measurableandavailablewhencashisreceivedbytheCityandarerecognizedasrevenueatthattime.
In accordance with GASB Statement No. 31, the City’s general policy is to report money market investments and short-term participating interest-earning investment contracts at amortized cost and to report nonparticipating interest-earning investment contracts using a cost-based measure. However, if the fair value of an investment is significantly affected by the impairment of the credit standing of the issuer or by other factors, it is reported at fair value. All other investments are reported at fair value unless alegalcontractexistswhichguaranteesahighervalue.Theterm“short-term”referstoinvestments,which have a remaining term of one year or less at the time of purchase. The term “nonparticipating” means that the investment’s value does not vary with market interest rate changes. As of September 30, 2024, the investments held by the City had a remaining maturity of greater than one year from purchase and accordingly are carried at fair value.
TheCity’scashandcashequivalentsaredefinedascashonhand,cashandpooledinvestmentdemand depositsheld with financial institutions, and short-term investments with original maturitiesof three months or less from the date of acquisition. Cash and cash equivalents also includes long-term investments with maturity of greater than one year. The classification of the City’s cash and cash equivalentsis reported in Note 2.
The City pools idle cash from all funds for the purpose of increasing income through coordinated investment activities. Interest earnings are allocated to the respective funds based upon each fund’s relative balance in the pool.
Cash and cash equivalents reported as restricted are restricted for debt service, acquisition and construction of capital assets, and for utility deposits held by the City.
The City’s property tax is levied each October 1 on the assessed value listed as of the prior January 1 for all real and certain personal property located within the City. Appraised values are established by the CentralAppraisalDistrictsat100%ofestimatedmarketvalueandcertifiedbytheAppraisalReviewBoard. The assessed value upon which the 2023 levy was based on was $11,359,781,892. Taxes are due on October 1 and are delinquent after the following January 31.
The City is permitted by Article XI, Section 5 of the State of Texas Constitution to levy taxes up to $2.50 per $100 of assessed valuation for general governmental services, including the payment of principal and interest on general obligation long-term debt. The combined tax rate to finance general governmental services including the payment of principal and interest on long-term debt for the year ended September 30, 2024 was 0.319 per $100 of assessed valuation.
In Texas, countywide central appraisal districts are required to assess all property within the appraisal districton thebasisof100%ofitsappraisedvalueandareprohibitedfromapplyinganyassessmentratios. The value of property within the appraisal district must be reviewed every five years; however, the City may, at its own expense, require annual reviews of appraised values.
Activities between funds that are representative of lending/borrowing arrangements outstanding at the end of the fiscal year are referred to as “due to/from other funds.”
Any residual balances outstanding between the governmental activities and business-type activities are reported in the government-wide financial statements as “internal balances”.
Interfund services provided and used are accounted for as revenues, expenditures or expenses. Transactionsthatconstitutereimbursementstoafundforexpenditures/expensesinitiallymadefromitthat are properly applicable to another fund, are recorded as expenditures/expenses in the reimbursing fund and as a reduction of expenditures/expenses in the fund reimbursed. All other interfund transactions, except interfund services provided and used and reimbursements, are recorded as transfers. Interfund services provided and used are not eliminated in the process of consolidation.
Inventoriesarestatedatcost(first-in,first-out)andaredeterminedannuallybytakingaphysicalinventory. Inventory in the general fund consists of gasoline held for consumption and is reported on the consumptionmethod.Undertheconsumptionmethodthecostisrecordedasanexpenditureatthetime individual inventory items are utilized.
Certain payments reflect costs applicable to future periods and are recorded as prepaid items in the government-wide and fund financial statements. These items consist principally of postage and deposits for purchases and are reported on the consumption method.
Effective October 1, 2021, the City implemented GASB Statement No. 87, Leases, which required the recognition of certain lease assets and liabilities for leases that previously were classified as operating leases and recognized as inflows of resources or outflows of resources based on the payment provisions of the contract.
Lessee – The City recognizes a lease liability and an intangible right-to-use lease asset (lease asset) in the government-wide and proprietary funds financial statements.
At implementation of GASB Statement No. 87, the City initially measured the lease liabilitiesat thepresent value of payments expected to be made during the remaining lease term. Subsequently, the lease liability is reduced by the principal portion of lease payments made. The lease right-to-use asset was initiallymeasuredastheinitialamountoftheleaseliability,adjustedforleasepaymentsmadeatorbefore the lease commencement date, plus certain initial direct costs. Subsequently, the lease right-to use asset is amortized on a straight-line basis over its useful life.
Key estimates and judgments related to leases include how the City determines (1) the discount rate it uses to discount the expected lease payments to present value, (2) lease term and (3) lease payments.
• The City uses the interest rate charged by the lessor as the discount rate. When the interest rate charged by the lessor is not provided, the City generally uses its estimated incremental borrowing rate as the discount rate for leases.
• The lease term includes the noncancellable period of the lease. Lease payments included in the measurement of the lease liability are composed of fixed payments and purchase option price that the City is reasonably certain to exercise.
The City monitors changes in circumstances that would require a re-measurement of its lease and will remeasure the lease asset and liability if certain changes occur that are expected to significantly affect the amount of the lease liability.
Lease assets are reported with other capital assets and lease liabilities are reported with long-term debt on the Statement of Net Position.
Lessor – The City recognizes a lease receivable and deferred inflow of resources in the government-wide and governmental funds financial statements.
At implementation of GASB Statement No. 87, the City measured the lease receivable at the present value of payments expected to be received during the lease term. Subsequently, the lease receivable is reduced by the principal portion of lease payments received. The deferred inflow of resources is initially measuredastheinitialamountoftheleasereceivable,adjustedforleasepaymentsreceivedatorbefore the lease commencement date. Subsequently, the deferredinflow of resourcesis recognized asrevenue over the life of the lease term.
Keyestimatesandjudgmentsinclude howtheCitydetermines(1) thediscountrateit usestodiscountthe expected lease receipts to present value, (2) lease term and (3) lease receipts.
• The City uses its estimated incremental borrowing rate as the discount rate for leases.
• The lease term includes the noncancellable period of the lease. Lease receipts included in the measurement of the lease receivable is composed of fixed payments from the lessee.
The City monitors changes in circumstances that would require a re-measurement of its lease, and will remeasure the lease receivable and deferred inflows of resources if certain changes occur that are expected to significantly affect the amount of the lease receivable.
The City has noncancellable contracts with SBITA vendors for the right-to-use information technology (IT) software, alone or in combination with tangible capital assets (the underlying IT assets). The City recognizes a subscription liability, reported with long-term debt, and a right‐to‐use subscription asset (an intangible asset), reported with other capital assets, in the government‐wide and proprietary fund financial statements. The City recognizes subscription liabilities with an initial, individual value of $5,000 or more.
At the commencement of a SBITA, the City initially measures the subscription liability at the present value of payments expected to be made during the subscription term. Subsequently, the subscription liability is reduced by the principal portion of SBITA payments made. The subscription asset is initially measured as the initial amount of the subscription liability, adjusted for SBITA payments made at or before the SBITA commencement date, plus certain initial implementation costs. Subsequently, the subscription asset is amortizedonastraight‐linebasisovertheshorterofthesubscriptiontermortheusefullifeoftheunderlying IT assets.
Key estimates and judgments related to SBITAs include how the City determines (1) the discount rate it uses to discount the expected subscription payments to present value, (2) subscription term and (3) subscription payments.
The City uses the interest rate charged by the SBITA vendor as the discount rate. When the interest rate charged by the SBITA vendor is not provided, the City generally uses its estimated incremental borrowing rate as the discount rate for SBITAs.
The subscription term includes the noncancellable period of the SBITA.
Subscriptionpaymentsincludedinthemeasurementofthesubscriptionliabilityarecomposedoffixed payments, variable payments fixed in substance or that depend on an index or a rate, termination penalties if the City is reasonably certain to exercise such options, subscription contract incentives receivable from the SBITA vendor, and any other payments that are reasonably certain of being required based on an assessment of all relevant factors.
The City monitors changes in circumstances that would require a remeasurement of its SBITAs and will remeasure the subscription asset and liability if certain changes occur that are expected to significantly affect the amount of the subscription liability.
Capital assets, which include property, plant, equipment, right-to-use lease assets, and infrastructure assets, are reported in the applicable governmental or business-type activities columns in the government-wide financial statements and in the fund financial statements for proprietary funds. All capital assets are valued at historical cost or estimated historical cost if actual historical cost is not available. Donated assets are valued at acquisition value on the date donated.
The costs of normal repairs and maintenance that do not add to the value of the asset or materially extend the asset lives are not capitalized. Renewals and betterments are capitalized.
Assets capitalized have an original cost of $5,000 or more and over one year of useful life. Depreciation/amortization has been calculated on each class of depreciable property using the straight-line method. Estimated useful lives are as follows:
Buildings20-50Years
Waterandsewerdistributionsystem35-50Years
Waterhydrants10-15Years
Watertanks35Years
Computerequipment5Years
Heavyequipmentandvehicles10-20Years
Lightvehicles2-10Years
Vehicles5Years
Improvements25Years
Infrastructure10Years
The street network is not depreciated. The City has elected to use the modified approach in accounting for its street infrastructure. The modified approach allows governments to report as expenses in lieu of depreciation,infrastructureexpenditureswhichmaintaintheassetbutdonotaddtoorimprovetheasset.
Additions and improvements to the street network are capitalized. The City uses an asset management system to rate street condition and quantify the results of maintenance efforts.
The City has established the Vehicle and Equipment Replacement Internal Service Fund to account for City-owned vehicles and equipment. The fund receives transfers from other funds.
Right-to-use lease and subscription assets are amortized over the duration of the lease or subscription using the straight-line method.
City employees earn vacation and sick leave, which may either be taken or accumulated, up to certain amounts, until paid upon retirement or termination. Employees with 10 to 20 year tenures of continuous employment with the City are eligible to receive payment of their unused sick leave, within certain limitations. Upon termination or retirement, an employee is reimbursed up to a maximum number of hours of vacation pay based upon the years of service. All vacation is accrued in the government-wide and proprietary fund financial statements. A liability for these amounts is reported in the governmental funds only if they have matured.
In the government-wide financial statements and proprietary fund financial statements, long-term debt and other long-term obligations are reported as liabilities in the applicable governmental activities, business-type activities, or proprietary fund statement of net position. Bond premiums and discounts, as well as any deferred losses and gains on the refunding of bonds, are amortized over the life of the bonds using the effective interest method. Bonds payable are reported net of the applicable bond premium or discount. Issuance costs are recorded as expenses when incurred.
In the fund financial statements, governmental fund types recognize bond premiums and discounts, as well as bond issuance costs, during the current period. The face amount of debt issued is reported as other financing sources. Premiums and discounts received on debt issuances are reported as other financing sources or uses. Issuance costs, whether or not withheld from the actual debt proceeds received, are reported as debt service expenditures.
For purposes of measuring the net pension and net OPEB liabilities (assets), pension and OPEB related deferred outflows and inflows of resources and pension and OPEB expense, City specific information about its Fiduciary Net Position in the Texas Municipal Retirement System (TMRS) and additions to/deductions from TMRS’s Fiduciary Net Position have been determined on the same basis as they are reported by TMRS. For this purpose, plan contributions are recognized in the period that compensation is reported for the employee, which is when contributions are legally due. Benefit payments and refunds are recognized when due and payable in accordance with the benefit terms. Investments are reported at fair value.
Information regarding the City’s Total Pension Liability and Total OPEB Liability is obtained from TMRS through reports prepared for the City by TMRS consulting actuary, Gabriel Roeder Smith & Company, in compliance with Governmental Accounting StandardsBoard(GASB) Statement No. 68, Accounting and Financial Reporting for Pensions, and GASB Statement No. 75, Accounting and Financial Reporting for Postemployment Benefits Other Than Pensions.
Information regarding the City’s Total OPEB Liability of its Retiree Health Care Plan is obtained from Public Agency Retirement Services (PARS) through reports prepared for the City by PARS consulting actuary, Gabriel Roeder Smith & Company, in compliance with Governmental Accounting Standards Board (GASB) Statement No. 75, Accounting and Financial Reporting for Postemployment Benefits Other Than Pensions.
In addition to assets, the statement of financial position and/or balance sheet will sometimes report a separate section for deferred outflows of resources. This separate financial statement element, deferred outflows of resources, represent a consumption of net assets that applies to a future period(s) and so will notbe recognized as an outflow of resources(expense/expenditure)untilthen.TheCity hasthe following items that qualify for reporting in this category:
Deferred loss on refunding – these deferred outflows result from the difference in the carrying value of refunded debt and its reacquisition price. This amount is deferred and amortized over the shorter of the life of the refunded or refunding debt.
Pensions/OPEB – these deferred outflows result from pension/OPEB contributions after the measurement date (deferred and recognized as a reduction of the pension/OPEB liability in the following fiscal year); changes in actuarial assumptions and/or differences between expected and actual economic experience (deferred and amortized over the estimated average remaining lives of participants) and/or differences in projected and actual earnings on pension/OPEB assets (deferred and amortized over a closed five year period).
In addition to liabilities, the statement of net position and/or balance sheet will sometimes report a separate section for deferred inflows of resources, which represents acquisitions of net assets that apply to future periods.
Deferred gain on refunding – these deferred inflows result from the difference in the debt’s reacquisition price and its carrying value that was refunded. This amount is deferred and amortized over the shorter of the life of the refunded or refunding debt.
Pensions/OPEB – Differences in expected and actual experience and differences in assumption changes are deferred and amortized over a closed period equal to the estimated average remaining lives of all employees provided pensions through the plan, while investment experience differences are amortized over a closed 5-year period.
Collections of lease receivables are deferred in both the governmental fund and government wide financial statements. These amounts are recognized in a systematic manner over the life of the lease.
In addition to liabilities, the governmental funds balance sheet reports deferred inflows from receivables that were not collected within 60 days of year-end. The deferred inflow from receivables balances and changes are reported as a reconciling amount to the statements of net position and activities.
The City classifies governmental fund balances as follows:
1. Nonspendable fund balance –includesamounts thatarenotin a spendable form orare required to be maintained intact (example – inventory or permanent funds).
2. Restricted fund balance – includes amounts that can be spent only for the specific purposes stipulated by external resource providers either constitutionally or through enabling legislation (example – court technology and court security funds).
3. Committed fund balance – includes amounts that can only be used for specific purposes determined by City Council (example – capital projects and police expenditures).
4. Assigned fund balance – comprises amounts intended to be used by the City for specific purposes. Intent can be expressed by the City Council or their designee (Chief Financial Officer). In governmental funds other than the General Fund, assigned fund balance represents the amount that is not restricted or committed. This indicates that resources in other governmental funds are, at a minimum, intended to be used for the purpose of that fund (example – facility maintenance and economic investments).
5. Unassigned fund balance – is the residual classification of the General Fund and includes all amounts not contained in other classifications.
The City has also adopted the following policies:
Committed Fund Balance - The City Council is the City’s highest level of decision-making authority and approval by ordinance is required to establish, modify, or rescind a fund balance commitment. The ordinance must either be approved or rescinded, as applicable, prior to the last day of the fiscal year. The amount subject to the constraint may be determined in the subsequent period.
Assigned Fund Balance - The City Council has authorized the City’s Chief Financial Officer as the official authorized to assign fund balance to a specific purpose as approved by this fund balance policy.
UnassignedFundBalance-ItisthegoaloftheCitytomaintainafundbalanceintheGeneralFund,equal to a minimum of 15% of General Fund budgeted operating expenditures, with the optimum goal of 25%. The City considers a balance of less than 15% to be cause for concern, barring unusual or deliberate circumstances.
It is the goal of the City to maintain 60 days of working capital in the Water and Sewer Enterprise Fund, with the optimum goal of 90 days of working capital.
The City shall also maintain all reserve funds for all statutorily required reserve funds to guarantee debt service.
Order ofExpenditure of Funds-When multiplecategories of fund balance areavailableforexpenditures, the City will start with the most restricted category and spend those funds first before moving to the next category with available funds (restricted, committed, assigned and unassigned).
During fiscal year 2006, the City began assigning funds for strategic initiatives. The source of these funds is reserves in excess of 25% of General Fund expenditures. The funds will be used for one-time high impact projectsinvolvinginfrastructuremaintenance,community enhancementandcapitalacquisition andare reported as assigned fund balance in the General Fund. The City reported an assigned fund balance in itsGeneralCapitalProjectsFundof$45,400,563 on September30,2024.Thisfundbalanceisassigned with the intent to cash-fund future capital projects.
As of September 30, 2024, the City had the governmental fund balances categorized as follows:
FUNDBALANCES
Nonspendablefor: Inventories31,529$-$-$-$-$-$-$31,529 $ Prepaiditems13,376------13,376 Restrictedfor:Debtservice-2,268,218----2,783,8505,052,068 Capitalprojects--24,660,776----24,660,776 Municipalcourt------920,494920,494 Reinvestmentzone------11,565,00911,565,009 Parksandrecreation---13,256,08514,616,79324,928,9882,640,00155,441,867 Stormwater------2,150,5302,150,530 Police------7,323,2017,323,201 Library------21,40321,403 Promotionoftourism------4,223,1174,223,117 Committedfor:Police------2,031,8142,031,814 Parksandrecreation------60,37260,372 Assignedfor:TeenCourt23,161------23,161 SeniorCenter12,061------12,061 Recycling77,363------77,363 Reforestation160,358------160,358 Publicart539,053------539,053 Facilitymaintenance12,934,258------12,934,258 Economicinvestment3,541,789------3,541,789 Strategicinitiatives13,189,926------13,189,926 Capitalprojects--45,400,563----45,400,563 Unassigned17,019,733------17,019,733
$33,719,791$206,393,821 $
Net position represents the difference between assets plus deferred outflows of resources and liabilities plus deferred inflows of resources. Net investment in capital assets consists of capital assets, net of accumulated depreciation/amortization, reduced by the outstanding balances of any borrowing used for the acquisition, construction or improvement of those assets, and adding back unspent proceeds. Net position is reported as restricted when there are limitations imposed on their use either through the enabling legislations adopted by the City or through external restrictions imposed by creditors, grantors or laws or regulations of other governments.
Sometimes the City will fund outlays for a particular purpose from both restricted (e.g., restricted bond or grant proceeds) and unrestricted resources. In order to calculate the amounts to report as restricted net position and unrestricted net position in the government-wide and proprietary fund financial statements, a flow assumption must be made about the order in which the resources are considered to be applied. It is the City’s policy to consider restricted net position to have been depleted before unrestricted net position is applied.
The preparation of financial statements in conformity with accounting principles generally accepted in the United States of America requires management to make estimates and assumptions that affect the reported amounts of assets and liabilities and disclosure of contingent assets and liabilities at the date of the financial statements, and the reported amounts of revenues and expenses/expenditures during the reporting period. Actual results could differ from those estimates.
There are no deficit fund balances reported as of September 30, 2024.
The GASB pronouncements effective in fiscal year 2024 and beyond are listed as follows:
GASB Statement No. 100, Accounting Changes and Error Corrections – an amendment of GASB Statement No. 62, enhances the accounting and financial reporting requirements for accounting changes and error corrections to provide more understandable, reliable, relevant, consistent and comparable information for making decisions or assessing accountability. The requirements of this Statement are effective for accounting changes and error corrections made in fiscal years beginning after June 15, 2023, and all reporting periodsthereafter. The City has implementedthis Statement in fiscal year 2024.
GASB Statement No. 101, Compensated Absences, will better meet the information needs of financial statement users by updating the recognition and measurement guidance for compensated absences. Theobjective isachievedbyaligningtherecognitionandmeasurementguidanceunderaunifiedmodel andbyamendingcertainpreviouslyrequireddisclosures.TherequirementsofthisStatementareeffective for fiscal years beginning after December 15, 2023, and all reporting periods thereafter. The City is currently evaluating the impact of this Statement.
GASB Statement No. 102, Certain Risk Disclosures, will provide users of government financial statements with essential information about risks related to a government’s vulnerabilities due to certain concentrations or constraints. The requirements of this Statement are effective for fiscal years beginning after June 15, 2024, and all reporting periods thereafter. The City is currently evaluating the impact of this Statement.
GASB Statement No. 103, Financial Report Model Improvements, will establish new accounting and financial reporting requirements – or modify existing requirements – related to the following:
Management’s discussion and analysis
Unusual or infrequent items
Presentation of the proprietary fund statement of revenues, expenses, and changes in fund net position
Information about major component units in basic financial statements
Budgetary comparison information
Financial trends information in the statistical section
The requirements of this Statement are effective for fiscal years beginning after June 15, 2025, and all reporting periods thereafter. The City is currently evaluating the impact of this Statement.
GASBStatementNo.104, Disclosure of Certain Capital Assets, will establish requirements for certain types of capital assets to be disclosed separately in the capital assets note disclosures required by Statement No. 34, Basic Financial Statements – and Management’s Discussion and Analysis – for State and Local Governments. It will also establish requirements for capital assets held for sale, including additional disclosures for these capital assets. The requirements of this Statement are effective for fiscal years beginning after June 15, 2025, and all reporting periods thereafter. The City is currently evaluating the impact of this Statement.
The City has evaluated all events or transactions that occurred after September 30, 2024 through February 21, 2025, the date the financial statements were available tobe issued. During thisperiod, there were no subsequent events requiring disclosure.
The funds of the City must be deposited and invested under the terms of a contract, contents of which are set out in the Depository Contract Law. The depository bank places approved pledged securities for safekeeping and trust with the City's agent bank in an amount sufficient to protect City funds on a day-to-day basis during the period of the contract. The pledge of approved securities is waived only to the extent of the depository bank's dollar amount of Federal Deposit Insurance Corporation (FDIC) insurance.
At September 30, 2024, the carrying amount of the City's on demand deposits was $18,992,263 and the bank balance was $19,211,504. As of September 30, 2024, none of the City’s deposits were uncollateralized.
The following legal and contractual provisions govern deposits and investments:
The Public FundsInvestment Act (Government Code Chapter 2256) containsspecific provisions in the areas of investment practices, management reports and establishment of appropriate policies.
Among other things, the Public Funds Investment Act (PFIA) requires the City to adopt, implement, and publicize an investment policy. That policy must address the following areas: (1) safety of principal and liquidity, (2) portfolio diversification, (3) allowable investments, (4) acceptable risk levels, (5) expected rates of return, (6) maximum allowable stated maturity of portfolio investments, (7) maximum average dollar-weighted maturity allowed based on the stated maturity date for the portfolio, (8) investment staff quality and capabilities, and (9) and bid solicitation preferences for certificates of deposit.
Statutes and the City’s investment policy authorized the City to invest in the following investments as summarized in the table below:
U.S.Governmentsecurities5years100%
Municipalobligations5years50%
Repurchaseagreements90days50%
Certificatesofdeposit5years100%
Bankersacceptances270days20%
Commercialpaper365days20%
MoneyMarketMutualFunds60days*50%
EligibleinvestmentpoolsN/A100%
InsureddepositaccountsN/A20%
*dollarweightedaveragematurity
TheActalsorequirestheCitytohaveindependentauditorsperformtestproceduresrelatedtoinvestment practices as provided by the Act. The City is in substantial compliance with the requirements of the Act and with local policies.
Cash andinvestments as of September 30, 2024, are classified in the accompanying financial statements as follows:
PrimaryGovernment:
Cashandcashequivalents286,892,075 $
Restrictedcashandcashequivalents26,456,211
Restrictedcashforcustomerdeposits270,412
Totalprimarygovernment313,618,698
TrustFund:
Investmentsatfairvalue2,740,052
Totalfiduciaryfunds2,740,052
Totalcashandinvestments
$316,358,750
Cash and investments of the primary government as of September 30, 2024 consist of the following:
Cashonhand4,150 $
Depositswithfinancialinstitutions18,992,263
Investmentsatamortizedcost164,400,719
Investmentsatfairvalue130,221,566
Totalcashandinvestments
DisclosuresRelatingtoInterestRateRisk
$313,618,698
Interest rate risk is the risk that changes in market interest rates will adversely affect the fair value of an investment. Generally, the longer the maturity of an investment, the greater the sensitivity of its fair value to changes in market interest rates. One of the ways that the City manages its exposure to interest rate risk is by investing mainly in investment pools which purchase a combination of shorter term investments with an average maturity of less than 60 days, thus reducing the interest rate risk. The City monitors the interest rate risk inherent in its portfolio by measuring the weighted average maturity of its portfolio. The City has no specific limitations with respect to this metric.
As of September 30, 2024, the City didnot invest in any securities which are highly sensitive tointerest rate fluctuations.
DisclosuresRelatingtoCreditRisk
Generally, credit risk is the risk that an issuer of an investment will not fulfill its obligation to the holder of the investment. Thisis measured by the assignment of a rating by anationally recognized statistical rating organization. Presented below is the minimum rating required by (where applicable) the Public Funds Investment Act, the City’s investment policy, or debt agreements, and the actual rating as of year-end for each investment type.
InvestmentType
U.S.Governmentsecurities38,008,980$N/AAAA Mutualfunds92,212,586N/AAAAm TexStar59,445,962AAA/AAAmAAAm TexPool36,468,953AAA/AAAmAAAm LonestarInvestmentPool41,125,283AAA/AAAmAAAm TexasClass27,360,521AAA/AAAmAAAm
Total
$294,622,285
The investment policy of the City contains no limitations on the amount that can be invested in any one issuer. As of September 30, 2024, the City investments other than external investment pools that represent5%ormore ofthe City’sinvestmentsinclude mutualfunds, municipalbonds,commercialpaper and U.S. Government securities as described in the table in the following Custodial Credit Risk section.
Custodialcreditriskfordepositsistheriskthat,intheeventofthefailureofadepositoryfinancialinstitution, a government will not be able to recover its deposits or will not be able to recover collateral securities that are in the possession of an outside party. The custodial credit risk for investments is the risk that, in the event of the failure of the counterparty to a transaction, a government will not be able to recover the value of its investment or collateral securities that are in the possession of another party. The Public Funds Investment Act and the City’s investment policy do not contain legal or policy requirements that would limit the exposure to custodial credit risk for deposits or investments, other than the following provision for deposits:
ThePublic FundsInvestmentActrequiresthatafinancialinstitution securedepositsmadebystateorlocal governmental units by pledging securities in an undivided collateral pool held by a depository regulated under state law (unless so waived by the governmental unit).
The market value of the pledged securities in the collateral pool must equal at least the bank balance less the FDIC insurance at all times. As of September 30, 2024, none of the City’s cash deposits were uncollateralized.
The City categorizes its fair value measurements within the fair value hierarchy established by generally accepted accounting principles. GASB Statement No. 72, Fair Value Measurement and Application, provides a framework for measuring fair value which establishes a three-level fair value hierarchy that describes the inputs that are used to measure assets and liabilities.
• Level 1inputsare quoted prices(unadjusted) for identical assetsor liabilitiesin active markets that a government can access at the measurement date.
• Level 2 inputs are inputs—other than quoted prices included within Level 1—that are observable for an asset or liability, either directly or indirectly.
• Level 3 inputs are unobservable inputs for an asset or liability.
The fair value hierarchy gives the highest priority to Level 1 inputs and the lowest priority to Level 3 inputs. If a price for an identical asset or liability is not observable, a government should measure fair value using another valuation technique that maximizes the use of relevant observable inputs and minimizes the use of unobservable inputs. If the fair value of an asset or a liability is measured using inputs from more than one level of the fair value hierarchy, the measurement is considered to be based on the lowest priority level input that is significant to the entire measurement.
The City has recurring fair value measurements as presented in the table below. The City’s investment balances and weighted average maturity of such investments are as follows: Valueat 9/30/24Level1InputsLevel2InputsLevel3Inputs
InvestmentsnotsubjecttoFairValue InvestmentPools
TexPool36,468,953$-$-$-$13%28
TexStar59,445,962---20%30
LoneStar41,125,283---14%27
TexasCLASS27,360,521---9%29
InvestmentsbyFairValueLevel
U.S.TreasuryNotes&Bonds21,819,221-21,819,221-7%39
U.S.Governmentsecurities16,189,759-16,189,759-6%130
MutualFundsShort-TermInvestmentsTrust92,212,58692,212,586--31%28
Total
$294,622,28592,212,586$38,008,980$-$100%44
Mutual funds reported as level 1 are valued at the net asset value (NAV) of shares held by the City at year end. The NAV is a quoted price in an active market.
U.S. Government Securities, commercial paper and municipal bonds classified in Level 2 of the fair value hierarchy are valued using a matrix pricing technique. Matrix pricing is used to value securities based on the securities’ relationship to benchmark quoted prices.
Investmentin StateInvestmentPools
The City is a voluntary participant in four investment pools: TexPool, TexStar, Texas CLASS and Lone Star. StateComptrollerofPublicAccountsexercisesresponsibilityoverTexPool.Thisoversightincludestheability to significantly influence operations, designation of management, and accountability for fiscal matters. Additionally, the State Comptroller has established an advisory board composed of both participants in TexPool and other persons who do not have a business relationship with TexPool. TexPool operates in a manner consistent with the SEC’s Rule 2a7 of the Investment Company Act of 1940. TexPool uses amortizedcostsratherthan marketvaluetoreport netposition tocompute shareprices.Accordingly,the fair value of the position in TexPool is the same as the value of TexPool shares.
TexStar is administered by Hilltop Securities and JPMorgan Chase. TexStar is a local government investment pool created under the Interlocal Cooperation Act specifically tailored to meet Texas state and local government investment objectives of preservation of principal, daily liquidity, and competitive yield.TexStarusesamortizedcostsratherthanmarketvaluetoreportnetpositiontocomputeshareprices. Accordingly, the fair value of the position in TexStar is the same as the value of TexStar shares.
TexasCLASSisorganized under the Sixth AmendedandRestated Trust Agreement in accordance with all the requirements contained in section 2256.016 of the Public Funds Investment Act. Texas CLASS is administered by Public Trust Advisors, LLC and all funds are held by the custodial agent, Wells Fargo N.A. Texas CLASS may invest in obligations of the U.S. or its agencies and instrumentalities; repurchase agreements; SEC-registered money market funds rated in the highest rating category by at least one NRSRO; and commercial paper rated A-1, P-1 or equivalent by two nationally recognized rating agencies. Texas CLASS is measured at fair value (i.e., net asset value).
The Lone Star Investment Pool (the Pool) is organized in conformity with the Interlocal Cooperation Act, Chapter 791 of the Texas Government Code, and the Public Funds Investment Act, Chapter 2256 of the Texas Government Code. The Pool is governed by an 11 member Board of Trustees, consisting of individuals representing entities participating in the Pool. The fair value of the City’s position in the Pool is the same as the value of the Pool shares.
Receivables at September 30, 2024, for the government’s individual major, nonmajor, internal service, and fiduciary funds in the aggregate, including the applicable allowances for uncollectible accounts, consist of the following:
GeneralSPDC ObligationGeneralSPDCOperating DebtCapitalCapitalSpecial GeneralServiceProjectsProjectsRevenue
Receivables: Propertytaxes335,899$69,979$-$-$$ Salestaxes3,500,741---1,732,768 Accounts----38,456 Interest68,4262,36176,02314,97113,558 Leases726,746---Other813,24428---
Grossreceivables5,445,05672,36876,02314,9711,784,782 Less:allowance308,27964,225---
Nettotalreceivables
CEDCWaterPrimary SpecialNon-MajorandInternalGovernment RevenueGovernmentalSewerServiceTotal
Receivables: Propertytaxes-$-$-$-$405,878 $ Salestaxes1,283,532671,163--7,188,204 Accounts-262,9186,761,149-7,062,523 Interest25,94535,62696,12711,218344,255 Leases----726,746 Other204,058---1,017,330
Grossreceivables1,513,535969,7076,857,27611,21816,744,936
Less:allowance-1,69455,664-429,862
Nettotalreceivables$1,513,535968,013$6,801,612$11,218$16,315,074 $
TheWaterandSewerFundandtheStormWaterUtilityFundaccountsreceivableincludeunbilledcharges for services rendered through September 30, 2024, of $2,932,370.
LeaseReceivables
The City is a lessor for non-cancelable leases of the right-to-use of land, buildings, and infrastructure for which the City recognizes a lease receivable and a deferred inflow of resources in the government-wide and governmental fund financial statements. The interest rates for the leases approximate 2.9% annually, and the terms range from 5 to 25 years. The lease receivables that exist at September 30, 2024, relate to leases whose terms expire between December 2024 and January 2028.
At the commencement of a lease, the City initiallymeasures the lease receivable at the present value of paymentsexpected tobereceived during theleaseterm. Subsequently,thelease receivableisreduced by the principal portion of lease payments received. The deferred inflow of resources is initially measured asthe initialamount ofthelease receivable,adjustedforleasepayments receivedat or beforethe lease commencement date. Subsequently, the deferred inflow of resources is recognized as revenue over the life of the lease term. The City has $726,746 remaining in lease receivables and $680,315 remaining in deferred inflow as of September 30, 2024. The City recorded lease revenue including interest of $287,283 in the fiscal year.
As of September 30, 2024, the expected lease receipts through the expiration of all leases for which the City is a lessor is as follows:
$226,42220,247$246,669 $ 239,67013,331253,001 213,6366,016219,652 47,01828447,302 $726,74639,878$766,624 $ 2027 2028
Capital asset activity for the year ended September 30, 2024, was as follows: BeginningCapitalSalesorAdjustments/Ending BalanceAcquisitionsDisposalsTransfersBalance GovernmentalActivities: Capitalassetsnotbeing depreciated/amortized: Land97,313,799$247,447$-$-$97,561,246 $ Streetinfrastructure232,950,577488,881-2,165,215235,604,673 Construction-in-progress17,195,88122,858,010-(9,743,396)30,310,495
Totalcapitalassetsnot beingdepreciated/amortized347,460,25723,594,338-(7,578,181)363,476,414
Capitalassetsbeingdepreciated/amortized: Landimprovements42,070,435--(155,827)41,914,608 Buildingsandbuildingimprovements142,309,234--5,155,015147,464,249 Publicart1,956,720---1,956,720 Equipment41,808,3682,528,776(715,012)130,92043,753,052 Drainageinfrastructure65,810,992435,341-2,448,07368,694,406 Right-to-useassets: Leasebuildings-312,041--312,041 Leaseequipment755,549410,827(439,564)-726,812 Subscriptions3,071,032615,392(154,936)-3,531,488
Totalcapitalassetsbeing depreciated/amortized297,782,3304,302,377(1,309,512)7,578,181308,353,376
Accumulateddepreciation/amortization: Landimprovements(28,016,860)(1,836,011)--(29,852,871) Buildingsandbuildingimprovements(36,355,279)(3,190,823)--(39,546,102) Publicart(1,269,408)(108,300)--(1,377,708) Equipment(29,450,357)(3,234,245)715,012-(31,969,590) Drainageinfrastructure(33,038,063)(1,813,916)--(34,851,979) Right-to-useassets: Leasebuildings-(78,010)--(78,010) Leaseequipment(308,219)(130,075)280,890-(157,404) Subscriptions(704,116)(984,468)98,738-(1,589,846)
Totalaccumulated depreciation/amortization(129,142,302)(11,375,848)1,094,640-(139,423,510)
Totalcapitalassetsbeing depreciated/amortized,net168,640,028(7,073,471)(214,872)7,578,181168,929,866 Governmentalactivitiescapitalassets,net $516,100,28516,520,867$(214,872)$-$532,406,280 $
BusinessTypeActivities:
BeginningCapitalSalesorAdjustments/Ending BalanceAcquisitionsDisposalsTransfersBalance
Capitalassetsnotbeingdepreciated/amortized: Land21,447,794$198,438$-$-$21,646,232 $ Construction-in-progress5,519,5811,299,652-(2,117,546)4,701,687
Totalcapitalassetsnot beingdepreciated/amortized26,967,3751,498,090-(2,117,546)26,347,919
Capitalassetsbeingdepreciated/amortized:
Buildingsandbuildingimprovements935,501---935,501 Equipment3,024,29211,539(287,380)143,4292,891,880 Capacityrights9,190,988---9,190,988 Distributionsystem155,756,5431,273,267-1,974,117159,003,927 Subscriptions-87,316--87,316
Totalcapitalassetsbeing depreciated/amortized168,907,3241,372,122(287,380)2,117,546172,109,612
Accumulateddepreciation/amortization:
Buildingsandbuildingimprovements(827,858)(30,318)--(858,176) Equipment(2,980,511)(24,953)287,380-(2,718,084) Capacityrights(5,174,595)(183,820)--(5,358,415) Distributionsystem(88,201,663)(4,937,303)--(93,138,966) Subscriptions-(48,346)--(48,346)
Totalaccumulated depreciation/amortization(97,184,627)(5,224,740)287,380-(102,121,987)
Totalcapitalassetsbeing depreciated/amortized,net71,722,697(3,852,618)-2,117,54669,987,625
Businesstypeactivitiescapitalassets,net
$98,690,072(2,354,528)
Depreciation/amortization expenses were charged as a direct expense to functions of the primary government as follows:
Governmentalactivities: Generalgovernment2,831,058 $ Publicsafety2,426,103 Publicworks2,125,209 Cultureandrecreation3,993,478
Totaldepreciation/amortization expense-governmentalactivities11,375,848 $
Business-typeactivities: WaterandSewer5,224,740 $
The City issues general obligation bonds, combination tax and revenue certificates of obligation and tax notes to provide for the acquisition and construction of major capital facilities and infrastructure. Combination tax and revenue certificates of obligation are issued for both governmental and business-type activities. General obligation bonds, governmental revenue bonds and tax notes pledge the full faith and credit of the City. Combination tax and revenue certificates of obligation are payable from the net revenues of the water and sewer system and general debt service tax.
In prior years, the City has legally defeased certain outstanding general obligation and revenue debt by placing funds into irrevocable trusts pledged to pay all future debt service payments of the refunded debt.Accordingly, aliabilityforthedefeaseddebt issuesisnot includedin theCity’sfinancialstatements. As of September 30, 2024, the City had no additional outstanding bonds that were legally defeased.
As of September 30, 2024, the City had $9,881,821 in authorized but unissued general obligation bonds. The City does not anticipate the issuance of additional general obligation debt within the next twelve months.
General obligation bonds, certificates of obligation, tax notes, and governmental revenue bonds are as follows as of September 30, 2024: FinalInterestBusinessGeneralObligationBondsandCertificatesofObligationMaturityRatesGovernmentalType
$11,300,000Series2012,TaxandWaterworksandSewer System(LimitedPledge)CertificatesofObligation20323.0-4.25%2,770,000$1,300,000 $
$9,965,000Series2012,GeneralObligation RefundingBonds20263.0-4.25%1,610,000-
$14,250,000Series2013,TaxandWaterworksandSewer System(LimitedPledge)CertificatesofObligation20332.0-5.0%-1,320,000
$22,295,000Series2013,GeneralObligation RefundingBonds20262.0-5.0%4,255,000-
$21,330,000Series2014,GeneralObligation RefundingBonds20262.0-5.0%125,000235,000
$8,780,000Series2014,TaxandWaterworksandSewer System(LimitedPledge)CertificatesofObligation20342.0-3.5%-2,085,000
$3,295,000Series2015,TaxandWaterworksandSewer System(LimitedPledge)CertificatesofObligation20352.75-4.0%-2,520,000
$7,910,000Series2017,GeneralObligation RefundingBonds20283.0-4.0%1,716,4771,828,520
$5,400,000Series2017,TaxandWaterworksandSewer System(LimitedPledge)CertificatesofObligation20372.25-5.0%-4,005,000
$4,205,000Series2018,TaxandWaterworksandSewer System(LimitedPledge)CertificatesofObligation20383.0-4.0%-3,255,000
$17,290,000Series2019,GeneralObligation RefundingBonds20303.0-5.0%2,845,0003,695,000
$4,240,000Series2021,GeneralObligation RefundingBonds20311.21%1,434,0001,606,000
$8,595,000Series2022,TaxandWaterworksandSewer System(LimitedPledge)CertificatesofObligation20374.0-5.0%5,990,000-
$9,805,000Series2024,TaxandWaterworksandSewer20394.0-5.0%-9,805,000 System(LimitedPledge)CertificatesofObligation
$20,745,47731,654,520 $
FinalInterest GovernmentalRevenueBondsMaturityRatesGovernmental
$16,000,000Series2014,SouthlakeParksDevelopment Corporation,SalesTaxRevenueRefundingBonds20273%3,155,000 $
$24,450,000Series2016,SouthlakeCommunityEnhancement andDevelopmentCorporation,SalesTaxRevenueBonds20363.00-5.00%17,475,000
$9,945,000Series2017,SouthlakeCommunityEnhancement andDevelopmentCorporation,SalesTaxRevenueBonds20362.00-5.00%7,065,000
$27,695,000
FinalInterest GovernmentalTaxNotesMaturityRatesGovernmental
$3,753,000Series2021,TaxNotes20260.83%1,354,000 $ $13,397,000Series2023,TaxNotes20303.48%13,397,000
$14,751,000
During 2024, the City issued $9,805,000 of Water and Sewer Revenue Certificates of Obligation, Series 2024. The debt was issued for the purpose of improving, extending and equipping the City’s combined waterworks and sewer system.
The following is a summary of long-term liability transactions for the year ended September 30, 2024: Amount
BeginningEndingDuewithin BalanceAdditionsReductionsBalanceOneyear Governmentalactivities:
Generalobligationbondsand certificatesofobligation26,796,835$-$(6,051,358)$20,745,477$6,298,304 $ Salestaxrevenuebonds30,775,000-(3,080,000)27,695,0003,025,000 Taxnotes15,420,000-(669,000)14,751,000804,000 Bondpremiums(discounts)3,955,121-(795,266)3,159,855Totalbondspayable76,946,956-(10,595,624)66,351,33210,127,304
TotalOPEBliability-SDBF728,30675,116-803,42217,916 Netpensionliability18,318,244-(4,261,715)14,056,529Compensatedabsences2,703,2523,516,404(3,087,348)3,132,308725,807 Financedpurchaseliabilities308,329-(99,853)208,476102,748 Right-to-useleaseliability448,904752,937(388,322)813,519225,205 Subscriptionliability2,165,395377,356(725,190)1,817,561825,871
Totalgovernmentalactivities
$101,619,3864,721,813$(19,158,052)$87,183,147$12,024,851 $
Amount
BeginningEndingDuewithin BalanceAdditionsReductionsBalanceOneyear Business-typeactivities:
Generalobligationbondsand certificatesofobligation24,338,163$9,805,000$(2,488,643)$31,654,520$2,477,694 $ Bondpremiums1,467,0481,279,193(281,792)2,464,449-
Totalbondspayable25,805,21111,084,193(2,770,435)34,118,9692,477,694
TotalOPEBliability-SDBF59,5914,999-64,5901,192 Netpensionliability1,498,377-(283,629)1,214,748Compensatedabsences98,554198,898(216,302)81,15020,686 Subscriptionliability-62,932(28,880)34,05229,320
Totalbusiness-typeactivities
Typically, liquidation of the liabilities for compensated absences, total OPEB, and net pension occurs within the General Fund, Community Enhancement Development Corporation Special Revenue Fund, and the Water and Sewer Enterprise Fund where the payroll costs are incurred.
Typically, liquidation of bonds payable occurs from the General Obligation Debt Service Fund, Southlake Parks Development Corporation Debt Service Fund, and Community Enhancement Development Corporation Debt Service Fund.
The annual aggregate maturities for each bond type are as follows:
GeneralObligationBondsandCertificatesofObligation
GovernmentalActivities
FiscalYearEnding
September30,PrincipalInterestTotal
20256,298,304$675,6606,973,964 $ 20266,560,251419,7826,980,033 20271,632,198259,4701,891,668 20281,695,724197,1191,892,843 20291,292,000422,0061,714,006 2030-20342,627,00048,1142,675,114 2035-2039640,00040,025680,025
Total $20,745,4772,062,176$22,807,653 $
SalesTaxRevenueBonds
FiscalYearEnding
GovernmentalActivities
September30,PrincipalInterestTotal
20253,025,000$816,731$3,841,731 $ 20262,790,000706,2563,496,256 20272,640,000618,5063,258,506 20281,890,000550,5562,440,556 20291,950,000492,9562,442,956 2030-203410,665,0001,537,70612,202,706 2035-20394,735,000144,8974,879,897
Total $27,695,0004,867,608$32,562,608 $
Notes to the Financial Statements
TaxNotes
FiscalYearEnding
GovernmentalActivities
September30,PrincipalInterestTotal
2025804,000$472,395$1,276,395 $ 2026810,000462,2521,272,252 20273,115,000402,9673,517,967 20283,225,000292,6513,517,651 20293,339,000178,4373,517,437 2030-20343,458,00060,1693,518,169
Total
$14,751,0001,868,871$16,619,871 $
GeneralObligationBondsandCertificatesofObligation
Business-TypeActivities
FiscalYearEnding
September30,PrincipalInterestTotal
20252,477,694$1,156,152$3,633,846 $ 20263,060,7481,067,2444,127,992 20273,063,802944,5974,008,399 20283,183,276824,8004,008,076 20292,791,000713,8183,504,818 2030-203410,398,0002,338,96312,736,963 2035-20396,680,000648,6197,328,619
Total $31,654,5207,694,193$39,348,713 $
The City has entered into multiple arrangements for the purpose of financing the purchase of various equipment. The City’s arrangements incur interest at 2.9% annually, and have 5 year terms expiring in 2026.
The annual debt service requirement to amortize the financed purchase liabilities outstanding at September 30, 2024, are as follows:
FinancedPurchaseLiabilities
FiscalYearEnding
GovernmentalActivities
September30,PrincipalInterestTotal
2025102,7486,046108,794 2026105,7283,066108,794 Total $208,4769,112$217,588 $
The City has entered into multiple lease agreements as lessee for the right-to-use equipment over the term of the lease. The City is required to make periodic payments at its incremental borrowing rate or the interest rate stated or implied within the leases. Effective October 1, 2021, the City implemented GASB StatementNo.87, Leases.Atimplementationofthisstatement,theCityinitiallymeasuredtheleaseliability at the present value of payments expected to be made during the remaining lease term.
The City’s lessee arrangements incur interest at rates of approximately 2.9% annually; all of which are accounted for within the City's governmental activities. All such arrangements range between 3 and 5 years in length.
The annual debt service requirement to amortize the other lease liabilities outstanding at September 30, 2024, are as follows: LeaseLiabilities
FiscalYearEnding September30,PrincipalInterestTotal
2025225,205$19,085$244,290 $ 2026235,48513,073248,558 2027158,1287,487165,615 2028125,2823,719129,001 202969,41963770,056
The City has entered into multiple SBITAs that allow the right-to-use the SBITA vendor’s information technologysoftware overthesubscription term. TheCity isrequiredtomake annualormonthlypayments at its incremental borrowing rate or the interest rate stated or implied within the SBITAs. The SBITA rate, term and ending subscription liability are as follows:
InterestLiabilityatSBITATermEnding Rate(s)CommencementinMonthsBalance Governmentalactivities Software2.240%-3.257%3,638,15816-1051,817,561 $
The future principal and interest SBITA payments as of fiscal year end are as follows:
FiscalYear EndingPrincipalInterestTotal
2025825,871$54,517$880,388 $ 2026428,30129,069457,370 2027174,85616,620191,476 2028146,38411,589157,973 2029146,4577,217153,674 2030-203195,6922,86998,561
Totalgovernmentalactivities$1,817,561121,881$1,939,442 $
FiscalYear EndingPrincipalInterestTotal 202529,320$54,517$83,837 $ 20264,7322,8697,601
Totalbusiness-typeactivities$34,05257,386$91,438 $
The value of the governmental activities subscription assets as of the end of the current fiscal year was $3,531,488 with accumulated amortization of $1,589,846. The value of the business-type activities subscription assets as of the end of the current fiscal year was $87,316 with accumulated amortization of $48,346.
All interfund transfers between the various funds are approved supplements to the operations of those funds. Individual fund transfers for fiscal year 2024 were as follows:
Transfersin:
GeneralGeneralVehicleand ObligationCapitalSouthlakeParksNonmajorEquipment GeneralDebtServiceProjectsDevelopmentGovernmentalReplacementTotal FundFundFundCorp-CPFFundsFundtransfers Transfersout: GeneralFund-$-$8,400,000$-$100,000$2,533,486$11,033,486 $ SouthlakeParksDevelopment CorporationFund456,219--5,500,0002,782,576-8,738,795 CommunityEnhancementand DevelopmentCorporationFund523,255---2,691,556-3,214,811 NonmajorGovernmentalFunds637,494397,341850,000-334,500-2,219,335 WaterandSewerEnterpriseFund1,514,112----94,7431,608,855
Totaltransfers $3,131,080397,341$9,250,000$5,500,000$5,908,632$2,628,229$26,815,282 $
During the year, interfund transfers were used for the following recurring items:
• To allocate indirect charges from the General Fund to the Southlake Parks Development Corporation, Water and Sewer Enterprise Fund, and other nonmajor governmental funds.
• To move revenues from the fund with collection authorization to the General Obligation Debt Service Fund and other nonmajor debt service funds as debt service principal and interest payments become due.
• To move funding for vehicle and equipment replacement to the internal service fund.
• To fund the annual subsidy for commercial vehicle enforcement.
Further, during the year ended September 30, 2024, the City made the following one-time transfers:
• Transfer of $6,700,000 from the General Fund to the General Capital Projects Fund for roadway projects.
• Transferof$1,300,000fromtheGeneralFundtotheGeneralCapitalProjectsFundforinfrastructure projects.
• Transfer of $400,000 from the General Fund to the General Capital Projects Fund for public art projects.
• Transfer of $5,500,000 from the Southlake Parks Development Corporation to the General Capital Projects Fund for parks projects.
• Transfer of $241,000 from the Community Enhancement and Development Corporation to nonmajor governmental funds for community enhancement projects.
• Transfer of $850,000 from nonmajor governmental funds to the General Capital Projects Fund for infrastructure projects.
• Transfer of $334,500 from nonmajor governmental funds to the General Capital Projects Fund for crime control district projects.
TheCityparticipatesasoneof934plansinthedefinedbenefitcash-balanceplan administered by the TexasMunicipal Retirement System (TMRS). TMRSis astatewide public retirement plan created bythe State of Texasandadministeredin accordance with the TMRSAct, Subtitle G,Title 8,TexasGovernment Code(theTMRSAct)asanagentmultiple-employerretirementsystemfor employees of Texas participating cities. The TMRS Act places the general administration and management of TMRS with a six-member,Governor-appointedBoardofTrustees; however,TMRSisnot fiscallydependentontheState ofTexas.TMRSissuesapubliclyavailableAnnualComprehensive Financial Report (Annual Report) that can be obtained at tmrs.com.
All eligible employees of the City are required to participate in TMRS.
TMRS provides retirement, disability, and death benefits. Benefit provisions are adopted by the governing body of the city, within the options available in the state statutes governing TMRS.
At retirement, the Member’s benefit is calculated based on the sum of the Member’s contributions, with interest, and the city-financed monetary credits with interest. The retiring Member may select one of seven monthly benefit payment options. Members may also choose to receive a portion of their benefit as a lump sum distribution in an amount equal to 12, 24 or 36 monthly payments, which cannot exceed 75% of the total Member contributions and interest.
At the date the plan began, the City granted monetary credits for service rendered before the plan began of a theoretical amount at least equal to two times what would have been contributed by the employee, with interest, prior to establishment of the plan. Monetary credits for service since the plan began are a percent (100%, 150%, or 200%) of the employee's accumulated contributions. In addition, the City can grant, as often as annually, another type of monetary credit referred to as an updated service credit which is a theoretical amount which, when added to the employee's accumulated contributions and the monetary credits for service since the plan began, would be the total monetary credits and employee contributions accumulated with interest if the current employee contribution rate and City matching percent had always been in existence and if the employee's salary had always been the average of hissalary in the last three years thatare one year before theeffective date. At retirement, the benefit is calculated as if the sum of the employee's accumulated contributions with interest and the employer-financed monetary credits with interest were used to purchase an annuity.
Members can retire at ages 60 and above with 5 or more years of service or with 20 years of service. A memberisvested after5years.Theplan provisions areadoptedbythegoverningbody of theCity, within the options available in the state statutes governing TMRS and within the actuarial constraints also in the statutes.
Notes to the Financial Statements
Employees covered by benefit terms.
At the December 31, 2023 valuation and measurement date, the following employees were covered by the benefit terms:
Inactiveemployeesorbeneficiariescurrentlyreceivingbenefits191
Inactiveemployeesentitledtobutnotyetreceivingbenefits318
Member contribution rates in TMRS are either 5%, 6% or 7% of the Member’s total compensation, and the city matching percentages are either 100%, 150% or 200%, both as adopted by the governing body of the city. Under the state law governing TMRS, the contribution rate for each city is determined annually by the actuary, using the Entry Age Normal (EAN) actuarial cost method. The city’s contribution rate is based on the liabilities created from the benefit plan options selected by the city and any changes in benefits oractual experience over time.
Employees for the City were required to contribute 7% of their annual compensation during thefiscal year.Thecontribution rates for the City were 12.46% and 12.56% in calendar years 2023 and 2024, respectively. The City’s contributions to TMRS for the year ended September 30, 2024, were $4,151,701 and were greater than the required contributions by $46,094.
TheCity’sNetPensionLiability(NPL)wasmeasuredasofDecember31,2023,andtheTotalPension Liability (TPL) used to calculate the Net Pension Liability was determined by an actuarial valuation as of that date.
ActuarialAssumptions
TheTotalPensionLiabilityintheDecember 31,2023actuarialvaluationwasdeterminedusingthefollowing actuarial assumptions:
Inflation
2.5% per year
Overall payroll growth 2.75% per year, adjusted down for population declines, if any Investment Rate of Return
6.75%, net of pension plan investment expense, including inflation
Salary increases are based on a service-related table. Mortality rates for active members are based on the PUB(10) mortality tables with the Public Safety table used for males and the General Employee table used for females. Mortality rates for healthy retirees and beneficiaries are based on the Gender-distinct 2019 Municipal Retirees of Texas mortality tables. Male rates are multiplied by 103% and female rates are multiplied by 105%. The rates for actives, healthy retirees and beneficiaries are projected on a fully generational basis by Scale UMP to account for future mortality improvements. For disabled annuitants, the same mortality tables for healthy retirees are used with a 4-year set-forward for males and a 3-year set-forward for females. In addition, a 3.5% and 3.0% minimum mortality rate is applied, for males and females respectively, to reflect the impairment for younger members who become disabled. The rates are projected on a fully generational basis by Scale UMP to account for future mortality improvements subject to the floor.
The actuarial assumptions were developed primarily from the actuarial investigation of the experience of TMRS over the four-year period from December 31, 2018 toDecember 31, 2022. The assumptions were adoptedin 2023andfirstusedin theDecember31,2023,actuarialvaluation.Thepost-retirementmortality assumption for Annuity Purchase Rates (APRs) is based on the Mortality Experience Investigation Study covering 2009 through 2011 and dated December 31, 2013. Plan assets are managed on a total return basis with an emphasis on both capital appreciation as well as the production of income to satisfy the short-term and long-term funding needs of TMRS.
The long-term expected rate of return on pension plan investments was determined using a building-block methodinwhichbestestimaterangesofexpectedfuturerealratesofreturn(expected returns,netof pension plan investment expense and inflation) are developed for each major asset class. These ranges are combined to produce the long-term expected rate of return by weighting the expectedfuturerealratesof return by the targetasset allocation percentage andby adding expected inflation. In determining their bestestimateofarecommendedinvestmentreturnassumptionunder thevariousalternativeassetallocationportfolios,GRSfocusedontheareabetween(1)arithmetic mean(aggressive)withoutan adjustment for time (conservative) and (2) the geometric mean (conservative) with an adjustment for time (aggressive). The target allocation and best estimates of real rates of return for each major asset class in fiscal year 2024 are summarized in the following table:
Long-Term ExpectedReal TargetRateofReturn AssetClassAllocation(Arithmetic)
GlobalEquity35.0%6.70%
CoreFixedIncome6.0%4.70%
Non-CoreFixedIncome20.0%8.00%
Otherpublicandprivatemarkets12.0%8.00%
RealEstate12.0%7.60%
Hedgefunds5.0%6.40%
PrivateEquity10.0%11.60%
Total100.0%
The discount rate used to measure the Total Pension Liability was 6.75%. The projection of cash flows used to determine the discount rate assumed that Member and employer contributions will be made at the rates specified in statute. Based on that assumption, the pension plan’s Fiduciary Net Position was projected to be available to make all projected future benefit payments of current active and inactive Members. Therefore, the long-term expected rate of return on pension plan investments was applied to all periods of projected benefit payments to determine the Total Pension Liability.
ChangesintheNet PensionLiability
Increase Total(Decrease)Net PensionPlanFiduciaryPension LiabilityNetPositionLiability (a)(b)(a)-(b)
Balanceat12/31/2022139,795,674$119,979,054$19,816,620 $
Changesfortheyear: ServiceCost5,197,252-5,197,252 Interest9,435,242-9,435,242
Changeofbenefitterms--Differencebetweenexpected andactualexperience1,315,727-1,315,727 Changesofassumptions(467,923)-(467,923) Contributions-employer-3,967,997(3,967,997) Contributions-employee-2,229,213(2,229,213) Netinvestmentincome-13,917,389(13,917,389) Benefitpayments,includingrefunds ofemployeecontributions(5,225,884)(5,225,884)Administrativeexpense-(88,341)88,341 Otherchanges-(617)617
NetChanges10,254,41414,799,757(4,545,343)
Balanceat12/31/2023 $150,050,088134,778,811$15,271,277 $
SensitivityoftheNetPensionLiabilitytoChangesintheDiscountRate
The following presents the Net Pension Liability of the city, calculated using the discount rate of 6.75%, as well as what the city’s Net Pension Liability would be if it were calculated using a discount rate that is 1 percentage point lower (5.75%) or 1 percentage point higher (7.75%) than the current rate:
1%Decrease1%Increase inDiscountDiscountinDiscount Rate(5.75%)Rate(6.75%)Rate(7.75%)
Netpensionliability38,050,073$15,271,277$(3,285,956) $
PensionPlanFiduciaryNetPosition
Detailed information about the pension plan’s Fiduciary Net Position is available in the Schedule of Changes in Fiduciary Net Position, by Participating City. That report may be obtained at tmrs.com.
For the year ended September 30, 2024, the City recognized pension expense of $4,424,375. At September 30, 2024, the City reported deferred outflows of resources and deferred inflows of resources related to pensions from the following sources:
DeferredDeferred OutflowsofInflowsof ResourcesResources
Differencesbetweenexpectedandactualeconomicexperience1,712,991$$
Changesinactuarialassumptions6,360(353,516)
Differencebetweenprojectedandactualinvestmentearnings3,124,554-
Contributionssubsequenttothemeasurementdate3,223,593-
Total $8,067,498(353,516) $
The $3,223,593 reported as deferred outflows of resources related to pensions resulting from contributions subsequent to the measurement date willbe recognized as a reduction of the Net Pension Liability for the year ending September 30, 2025. Other amounts reported as deferred outflows and inflows of resources related to pensions will be recognized in pension expense as follows:
Fiscal YearEnded Sept.30
20251,410,841 $ 20261,516,680
20272,707,971
2028(1,145,103)
Total$4,490,389
The City of Southlake provides for two other postemployment benefit (OPEB) plans; one provides for postemployment health insurance benefitsthrough an agent-multiple employer definedbenefit medical plan (Southlake Retiree Health Care Plan), and the other is the Texas Municipal Retirement System Supplemental Death Benefits Fund, a single employer defined benefit OPEB plan. Both plans are described in detail below. Aggregate amounts for the two OPEB plans are as follows:
Retiree HealthcareTMRS PlanSDBFTotal
OPEBliability(asset)(865,618)$868,012$2,394 $ Deferredoutflowsofresources590,124178,524768,648 Deferredinflowsofresources617,261354,339971,600 OPEBexpense(121,105)20,310(100,795)
PlanDescription
The City provides other postemployment healthcare benefits in accordance with City policy. Administration of the City of Southlake Retiree Healthcare Plan trust is through Public Agency Retirement Services (PARS) with an IRC Section 115 Irrevocable Exclusive Benefit Trust. Trustee for the plan is US Bank. Ultimate authority for investment decisions and actions necessary to maintain the City’s participation in the program resides with the City Manager, appointed as Plan Administrator through a 2009 resolution of the City Council. Investment strategy is currently through the City’s selection of PARS Moderately Conservative High Mark Plus.
A third-party administrator is utilized to provide claims administration and payment of claims. Insurance is purchased to provide specific stop loss and aggregate stop loss protection. A separate financial statement is not issued for the plan.
BenefitsProvided
Regular full-time employees retiring from the City of Southlake have the option to continue medical insurance coverage until the retiree becomes eligible for Medicare or is eligible to be covered under another medical plan. The City contributes $125 per month towards the premium for retiree insurance coverage or$225towardsthepremium forretirees anddependents.Recommendationsforplan benefits are presented to City Council for their approval during the annual budget process.
The following table provides a summary of the number of participants in the plan as of December 31, 2023:
Inactiveemployeescurrentlyreceivingbenefits6 InactiveemployeesentitledtobutnotyetreceivingbenefitsActiveEmployees339
345
Contributions
TheCity’scontributionsduringthefiscalyearendingSeptember30, 2024were$209,480andweregreater than the required contributions by $167,637. The benefit payments were determined in a manner similar to how the benefit payments for the measurement period were developed. The City, through its budgeting process, determinesthe annual contributionsto the Plan based on the actuarially determined contribution and the availability of funds.
NetOPEBAsset
The City’s total OPEB asset is based on an actuarial valuation performed as of December 31, 2023.
The total OPEB asset in the December 31, 2023 actuarial valuation was determined using the following actuarial assumptions, applied to all periods included in the measurement:
ActuarialCostMethodIndividualEntry-AgeNormal
SingleDiscountRate5.00%asofDecember31,2023
Inflationrate2.50%peryear
SalaryIncreases3.60%to11.85%includinginflation
DemographicAssumptionsBasedontheexperiencestudycoveringthefour-year periodendingDecember31,2023asconductedforthe TexasMunicipalRetirementSystem(TMRS).
MortalityForhealthyretirees,thegender-distinctMunicipal RetireesofTexasmortalitytableswereused,withmale ratesmultipliedby103%andfemaleratesmultipliedby 105%.Theratesareprojectedonafullygenerational basisusingtheultimatemortalityimprovementratesin theMP-2021tabletoaccountforfuturemortality
Healthcareimprovements.CosttrendratesInitialrateof7.00%decliningtoultimateratesof4.25% after15years.
ParticipationRates30%ofemployeeswhoretireatage55orolder,orretire throughdisabilityretirementatanyage,wereassumed tomaintaintheirhealthcoverageafterretirement.
SingleDiscountRate. Projectedbenefitpaymentsarerequiredtobediscountedtotheiractuarialpresent values using a Single Discount Rate that reflects (1) a long-term expected rate of return on OPEB plan investments (to the extent that the plan’s fiduciary net position is projected to be sufficient to pay benefits),and(2)tax-exemptmunicipalbondratebasedonanindexof20-yeargeneralobligationbonds with anaverageAAcreditratingasofthe measurementdate(totheextentthatthecontributions foruse with the long-term expected rate of return are not met).
For the purpose of this valuation, the expected rate of return on OPEB plan investments is 5.0%; the municipal bond rate is1.84% (based on the daily rate closest to but not later than the measurement date of the Fidelity “20-Year Municipal GO AA Index”); and the resulting Single Discount Rate is 5.0%.
The City’s has consistently funded the actuarially determined employer contribution, which is based on a closed amortization policy. As a result, the plan’s fiduciary net position is projected to be sufficient to pay benefits for all future years.
ChangesintheNet OPEBAsset
Increase(Decrease)
TotalPlanNet
OPEBFiduciaryOPEB (Asset)LiabilityNetPosition(Asset)Liability (a)(b)(a)-(b)
Balanceat12/31/20221,886,828$2,339,116$(452,288) $
Changesfortheyear: ServiceCost128,267-128,267 Interest95,803-95,803
Differencebetweenexpectedand actualexperience(16,206)-(16,206) Changesofassumptions(150,440)-(150,440) Contributions-employer-209,818(209,818) Netinvestmentincome-269,081(269,081)
Benefitpayments,includingrefunds ofemployeecontributions(69,818)(69,818)Administrativeexpense-(8,145)8,145
NetChanges(12,394)400,936(413,330)
Balanceat12/31/2023 $1,874,4342,740,052$(865,618) $
Consistent with the requirements of GASB Statements No. 74, the employer contributions include “amountsfor OPEB asthe benefitscome due that willnotbereimbursed totheemployerusingOPEB plan assets.” The $69,818 in benefit payments was paid by the City using its own assets.
The plan fiduciary net position is 139% of the total OPEB liability as of the measurement date, resulting in the net OPEB asset.
The benefit payments during the measurement period were determined as follows: City'sexplicitsubsidy10,325 $ City'simplicitsubsidy(explicitsubsidy*5.762)59,493
Totalbenefitpayments69,818 $
The 5.762implicit factor equals the ratio of the expected implicit subsidy to the expected explicit subsidy.
SensitivityoftheNetOPEBAssettoChangesin theDiscountRateandHealthcareCostTrendRates
Regarding the sensitivity of the net OPEB asset to changes in the Single Discount Rate, the following presents the plan’s net OPEB asset, calculated using a discount rate of 5.00%, as well as what the plan’s net OPEB asset would be if it were calculated using a discount rate that is one percent lower or one percent higher:
1%Decrease1%Increase inDiscountDiscountinDiscount Rate(4.00%)Rate(5.00%)Rate(6.00%)
NetOPEBasset(703,914)$(865,618)$(1,010,870) $
RegardingthesensitivityofthenetOPEBassettochangesinthehealthcarecosttrendrates,thefollowing presents the plan’s net OPEB asset, calculated using the assumed trend rates as well as what the plan’s net OPEB asset would be if it were calculated using a trend rate that is one percent lower or one percent higher:
CurrentHealthcare CostRate 1%DecreaseAssumption1%Increase
NetOPEBasset(1,050,037)$(865,618)$(648,370) $
For the year ended December 31, 2023, the City recognized OPEB expense of $88,713. At September30,2024,thereporteddeferredoutflowsofresourcesanddeferredinflowsofresourcesrelated to OPEB from the following sources:
DifferencebetweenExpectedandActualEconomicExperiences11,203$(336,144) $ ChangesinAssumptions241,831(281,117) InvestmentExperience145,192Contributionssubsequenttothemeasurementdate191,898$590,124(617,261) $
The $191,898 reported as deferred outflows of resources related to OPEB resulting from contributions subsequent to the measurement date will increase the net OPEB asset during the year ending September 30, 2025. Amounts reported as deferred outflows of resources and deferred inflows of resources related to OPEB will be recognized in OPEB expense as follows:
FiscalYear EndedSept.30
20251,504 $ 202621,161
202721,456
2028(74,502)
2029(74,839) Thereafter(113,815)
Total$(219,035)
Differences between expected and actual experience and changes in assumptions are recognized in OPEB expense using a systematic and rational method over a closed period equal to the average of the expected remaining service lives of all employees that are provided with OPEB through the OPEB plan (activeemployeesandinactiveemployees)determinedasofthebeginningofthemeasurementperiod.
The expected remaining service lives of allactive employees in the plan were approximately 3,227 years. Additionally, the total plan membership (active employeesand inactive employees) was 345. As a result, the average of the expected remaining service lives for purposes of recognizing the applicable deferred outflows and inflows of resources established in the current measurement period is 9.3548 years.
Additionally, differences between projected and actual earnings on OPEB plan investments should be recognized in OPEB expense using a systematic and rational method over a closed five-year period. For this purpose, the deferred outflows and inflows of resources are recognized in the OPEB expense as a level dollar amount over the closed period identified above.
PlanDescription
Texas Municipal Retirement System (“TMRS”) administers a defined benefit group-term life insurance plan known as the Supplemental Death Benefits Fund (“SDBF”). This is a voluntary program in which participating member cities may elect, by ordinance, to provide group-term life insurance coverage for their active members, including or not including retirees. Employers may terminate coverage under and discontinue participation in the SDBF by adopting an ordinance before November 1 of any year to be effective the following January 1. The City has elected to participate in the SDBF for its active members including retirees. As the SDBF covers both active and retiree participants, with no segregation of assets, the SDBF is considered to be an unfunded single-employer OPEB plan (i.e. no assets are accumulated in a trust that meets the criteria in paragraph 4 of GASB Statement No. 75) for City reporting.
BenefitsProvided
The death benefit for active employees provides a lump-sum payment approximately equal to the employee’sannualsalary(calculatedbasedontheemployee’sactualearnings,forthe12-monthperiod preceding the month of death). The death benefit for retirees is considered an other postemployment benefit (“OPEB”) and is a fixed amount of $7,500.
At the December 31, 2023 valuation and measurement date, the following employees were covered by the benefit terms:
Inactiveemployeescurrentlyreceivingbenefits135
Inactiveemployeesentitledtobutnotyetreceivingbenefits77
ActiveEmployees384
596
The member city contributes to the SDBF at a contractually required rate as determined by an annual actuarial valuation. The rate is equal to the cost of providing one-year term life insurance. The funding policy for the SDBF program is to assure that adequate resources are available to meet all death benefit payments for the upcoming year. The intent is not to pre-fund retiree term life insurance during employees’ entire careers.
Contributions are made monthly based on the covered payroll of employee members of the participating member city. The contractually required contribution rate is determined annually for each city. The rate is based on the mortality and service experience of all employeescoveredby the SDBFand the demographics specific to the workforce of the city. There is a one-year delay between the actuarial valuation that serves asthebasisfor theemployercontribution rateand thecalendaryearwhen therate goesintoeffect.Thefundingpolicyofthisplanistoassurethatadequateresourcesareavailabletomeet all death benefit payments for the upcoming year.
The retiree portion of contribution rates to the SDBF for the City was 0.06% and 0.06% in calendar years 2023 and 2024, respectively. The City’s contributions to the SDBF for the year ended September 30, 2024 were $19,864, and were equal to the required contributions.
The City’s Total OPEB Liability (TOL) was measured as of December 31, 2023 and was determined by an actuarial valuation as of that date.
ActuarialAssumptions
The Total OPEB Liability in the December 31, 2023 actuarial valuation was determined using the following actuarial assumptions:
Inflation2.50%
SalaryIncreases3.60%to11.85%includinginflation
Discountrate3.77%
Retiree'sshareofbenefit-relatedcosts$0
AdministrativeexpensesAlladministrativeexpensesarepaid throughthePensionTrustand accountedforunderreporting requirementsofGASBStatement No.68.
Salary increases were based on a service-related table. Mortality rates for service retirees were based on the 2019 Municipal Retireesof Texas Mortality Tables. The rates are projectedon a fully generational basis with scale UMP. Mortality rates for disabled retirees were based on 2019 Municipal Retirees of Texas Mortality Tables with a 4-year set-forward for males and a 3-year set-forward for females. In addition, a 3.5% and 3% minimum mortality rate will be applied to reflect the impairment for younger members who become disabled for males and females, respectively. The rates are projected on a fully generational basis with scale UMP to account for future mortality improvements subject to the floor.
Actuarial assumptions used in the December 31, 2023 valuation were developed primarily from the actuarial investigation of the experience of TMRS over the four-year period from December 31, 2018 to December 31, 2022. They were first adopted in 2023 and first used in the December 31, 2023 actuarial valuation.
ThediscountrateusedtomeasuretheTotalOPEBLiabilitywas3.77%andwasbasedontheFidelityIndex’s “20-Year Municipal GO AA Index” rate as of December 31, 2023.
ChangesinTotalOPEBLiability
TotalOPEBLiability
Balancesasof12/31/2022787,897 $
Changesfortheyear: Servicecost35,030
Interest32,232
Differencebetweenexpectedand actualexperience(12,044) Changesofassumptions44,005 Contributions-employer(19,108)
NetChanges80,115
Balancesasof12/31/2023 $868,012
SensitivityoftheTotalOPEBLiabilitytoChangesin theDiscountRate
The following presents the total OPEB liability of the City, calculated using the discount rate of 3.77%, as well as what the City’s total OPEB liability would be if it were calculated using a discount rate that is 1 percentage-point lower (2.77%) or 1 percentage-point higher (4.77%) than the current rate:
TotalOPEBliability1,060,361$868,012$720,425 $
OPEBExpenseandDeferredOutflowsofResources andDeferredInflowsof ResourcesRelatedtoOPEB
For the year ended September 30, 2024, the City recognized OPEB expense of $39,418. At September 30, 2024, the City reported deferred outflows and inflows of resources related to the OPEB plan from the following sources:
Differencebetweenexpectedandactualeconomicexperiences-$(27,907) $ Changesinactuarialassumptions163,137(326,432) Contributionssubsequenttothemeasurementdate15,387$178,524(354,339) $
The $15,387 reported as deferred outflows of resources related to the OPEB plan resulting from contributions subsequent to the measurement date will reduce the Total OPEB liability during the year ending September 30, 2024.
The other amounts reported as deferred outflows and inflows of resources related to the OPEB plan will be recognized in OPEB expense as follows:
FiscalYear EndedSept.30
2025(36,661) $
2026(26,737)
2027(50,955)
2028(64,400)
2029(13,126)
Thereafter677
Total $(191,202)
The City offers its employees a deferred compensation plan created in accordance with Internal Revenue Code Section 457. The plan, available to all City employees, permits them to defer a portion of their salary until future years. The deferred compensation is not available to employees until termination, retirement, death, or unforeseeable emergency.
All amounts of compensation deferred under the plan, all property and rights purchased with such amounts, and all income attributable to such amounts, property, or rightsare heldin trust or under one or more annuity contracts described in Internal Revenue Code Section 401(f). Except as may otherwise be permitted or required by law, no assets or income of the plan shall be used for, or diverted to, purposes other than for the exclusive purpose of providing benefits for participants and their beneficiaries or defraying reasonable expenses of administration of the plan. In accordance with GASB 97, the plans as amended are not included in the City’s financial statements.
The City is exposed to various risks of loss related to torts, theft of, damage to, and destruction of assets; errorsandomissions;injuriestoemployees;andnaturaldisasters.Duringthefiscalyear1990,theCityjoined the Texas Municipal League Workers Compensation Joint Insurance Fund (“the Pool”) for risks related to employees. Premiums are paid tothe Pool, which retainsa limit of loss. Reinsurance companies insure the risks beyond those limits. The City retains, as a risk, only the deductible amount of each policy. The City continues to carry commercial insurance with TexasMunicipal League provided by Mutualof Omahafor other risks including general liability, property, and errors and omissions. There were no significant reductions in coverage in the past year and there were no settlements exceeding insurance coverage in any of the past three years.
The City has entered into various contracts with the Trinity River Authority (TRA) and other cities. Terms of the agreements provide the City will pay an amount equal to its proportional share of maintenance and operations and debt service based upon volumes of wastewater transported, treated, or disposed of. The City’s proportional share of future costs under these contracts is indeterminable and has not been recorded. Payments to the TRA under these contracts for the year ended September 30, 2024 were $5,780,289.
The City has authorized various contracts obligating future funds of the City as the contracted services are performed. Significant amounts unexpended under such contracts at year-end are reflected as reserves for authorized contracts in the applicable funds.
The City has certain claims and litigation pending with respect to matters arising in the normal course of operations. City management is of the opinion that the settlement of these matters will not have a material adverse impact on the City’s financial statements.
The City enters into economic development agreements authorized under Chapter 380 of the Texas Local Government Code. These agreements are planning tools designed to stimulate economic activity, redevelopment, community improvement, and provide a return on investment for the community. These programs abate or rebate property and/or sales taxes and may include other incentive payments such as fee reductions or construction cost reimbursements. Economic development agreements are considered on a case-by-case basis by the City Council and generally contain recapture provisions, which may require repayment or termination if recipients do not meet the required provisions of the economic incentives.
Chapter 380 of the Texas Local Government Code allows the City to provide grants for the purpose of promoting local economic development. These grants are based on a percentage of property and/or sales tax received by the City. For the fiscal year ending September 30, 2024, the City rebated $242,493 in sales taxes, $122,770 in property taxes, and $636,417 in hotel occupancy taxes. The City also refunded $92,782 in developer construction cost reimbursements for the fiscal year ending September 30, 2024.
For the fiscal year ending September 30, 2024, the City’s Southlake Parks Development Corporation Capital Project (SPDCCP) Fund became a major fund after previously being reported as nonmajor. This represents a change within the reporting entity, affecting the beginning fund balance of the SPDCCP major fund and the nonmajor governmental funds. See below for the changes to beginning fund balances.
ReportingUnitsAffectedby AdjustmentstoandRestatementsof BeginningBalances Funds
SouthlakeParks Development
NonmajorCorporation GovernmentalCapitalProjects FundsFund
9/30/2023,aspreviouslyreported50,727,020$$
Changewithinreportingentity(nonmajor fundtomajorfund)(20,845,367)20,845,367
10/1/2023,asrestated29,881,653$20,845,367 $
REVENUES
VARIANCEWITH FINALBUDGETPOSITIVE ORIGINALFINALACTUAL(NEGATIVE)
Advaloremtaxes,penaltiesandinterest28,140,607$27,340,607$27,190,295$(150,312) $ Franchisetaxes2,973,1063,348,8603,445,05996,199 Municipalsalesandmixedbeveragetax19,908,00021,545,28421,278,207(267,077) License,permitsandfees1,499,1001,395,2001,924,639529,439 Chargesforservices2,126,6231,958,9152,373,061414,146 Finesandforfeitures798,500798,000860,63462,634 Intergovernmentalrevenue72,000345,000433,49088,490 Investmentincome(losses)1,243,5001,987,5002,747,448759,948 Contributions5,00030,00031,5051,505 Miscellaneous185,000185,000134,402(50,598) Totalrevenues56,951,43658,934,36660,418,7401,484,374 EXPENDITURES
Generalgovernment Citysecretary/mayor667,578662,578618,64543,933 Citymanager'soffice1,202,7781,245,9531,226,41219,541 Humanresources1,080,100980,739905,10175,638 Supportservices4,947,2945,434,5105,762,333(327,823) Economicdevelopment397,159515,801441,22174,580 Finance2,173,7782,208,3992,117,15391,246 Municipalcourt888,133804,413790,60113,812 Teencourt176,673176,673164,96011,713 Informationtechnology4,974,5044,965,5043,479,9991,485,505 Publicsafety
Policeservices8,984,4279,140,5098,904,349236,160 Fireservices12,059,31312,701,37312,192,174509,199 Publicsafetysupport1,867,6951,867,6951,702,592165,103 Publicworks
Publicworksadministration3,048,7412,999,7712,775,504224,267 Streetsanddrainage1,436,3971,487,6701,479,0518,619 Planning1,331,6901,299,8541,221,94777,907 Buildinginspection1,374,0541,351,0201,266,68684,334 Cultureandrecreation
Communityservices1,775,9111,731,2991,649,82381,476 Parksandrecreation4,685,6664,588,9794,407,542181,437 Libraryservices1,354,4611,323,6171,224,65298,965 CapitalOutlay1,507,4251,507,4251,685,400(177,975) DebtService
Principal--1,003,961(1,003,961) Interest--53,272(53,272)
Totalexpenditures55,933,77756,993,78255,073,3781,920,404
OTHERFINANCINGSOURCES(USES)
Budgetary Comparison Schedule (GAAP Basis) For the Fiscal Year Ended September 30, 2024 The Notes to the Budgetary Comparison Schedules are an integral part of
Excessofrevenuesoverexpenditures1,017,6591,940,5845,345,3623,404,778
Issuanceoffinancedpurchases--752,937752,937 Issuanceofsubscriptions--333,898333,898 Saleofcapitalassets--43,35143,351 Transfersfromotherfunds3,089,0653,131,0803,131,080Transferstootherfunds(10,000,000)(11,000,000)(11,033,486)(33,486)
Totalotherfinancingsources(uses)(6,910,935)(7,868,920)(6,772,220)1,096,700
Netchangeinfundbalance(5,893,276)(5,928,336)(1,426,858)4,501,478 Fundbalances,beginningofyear48,969,46548,969,46548,969,465FUNDBALANCES,ENDOFYEAR
$43,076,18943,041,129$47,542,607$4,501,478 $
CityofSouthlake,Texas
Southlake Parks Development Corporation Operating Fund
Budgetary Comparison Schedule (GAAP Basis) For the Fiscal Year Ended September 30, 2024
VARIANCEWITH FINALBUDGETPOSITIVE ORIGINALFINALACTUAL(NEGATIVE)
BUDGETEDAMOUNTS
REVENUES
Municipalsalestax9,898,000$10,747,650$10,661,725$(85,925) $ Chargesforservices153,824237,824255,38917,565
Investmentincome(losses)152,000420,000599,793179,793
Totalrevenues10,203,82411,405,47411,516,907111,433
EXPENDITURES
Communityservices2,357,3972,352,5012,337,90914,592 Capitaloutlay472,500472,50072,236400,264
Totalexpenditures2,829,8972,825,0012,410,145414,856
Excessofrevenuesoverexpenditures7,373,9278,580,4739,106,762526,289
OTHERFINANCINGUSES
Transferstootherfunds(8,690,729)(8,738,795)(8,738,795)Netchangeinfundbalance(1,316,802)(158,322)367,967526,289 Fundbalances,beginningofyear,14,248,82614,248,82614,248,826FUNDBALANCE,ENDOFYEAR $12,932,02414,090,504$14,616,793$526,289 $
CityofSouthlake,Texas
Community Enhancement Development Corporation Special Revenue Fund
Budgetary Comparison Schedule (GAAP Basis) For the Fiscal Year Ended September 30, 2024
VARIANCEWITH FINALBUDGETPOSITIVE ORIGINALFINALACTUAL(NEGATIVE)
BUDGETEDAMOUNTS
REVENUES:
Municipalsalestax7,423,500$7,986,875$7,897,574$(89,301) $ Chargesforservices4,591,0404,489,0914,541,87452,783
Investmentincome(losses)265,000770,0001,111,659341,659 Contributions5,2475,40014,8409,440 Miscellaneous--1,1041,104
Totalrevenues12,284,78713,251,36613,567,051315,685
EXPENDITURES:
Communityservices7,217,9217,231,3936,181,1621,050,231 Capitaloutlay1,408,8391,408,839-1,408,839 DebtService Principal--13,016(13,016) Interest--1,073(1,073)
Totalexpenditures8,626,7608,640,2326,195,2512,444,981 Excessofrevenuesoverexpenditures3,658,0274,611,1347,371,8002,760,666
OTHERFINANCINGUSES:
Transferstootherfunds(3,180,948)(3,214,811)(3,214,811)Totalotherfinancinguses(3,180,948)(3,214,811)(3,214,811)Netchangesinfundbalance477,0791,396,3234,156,9892,760,666
Fundbalances,beginningofyear20,771,99920,771,99920,771,999FUNDBALANCES,ENDOFYEAR $21,249,07822,168,322$24,928,988$2,760,666 $
Notes to Budgetary Comparison Schedules
TheCity Counciladherestothefollowingproceduresinestablishingthe budgetsreflectedin thefinancial statements:
1. Each year the City Manager is required to submit to the City Council, between sixty and ninety days prior to the beginning of each fiscal year, a proposed budget for the fiscal year beginningonthefollowingOctober1.Theoperatingbudgetincludesproposedexpendituresand the means of financing them.
2. Public hearings are conducted to obtain taxpayers' comments.
3. Prior to October 1, the budget is legally enacted by the City Council through passage of an ordinance.
4. Annual budgets are legally adopted for the General Fund, the Tax Increment Financing District, Community Enhancement Development Corporation, Crime Control District, Parks Dedication, Hotel Occupancy, Storm Water Utility, Red Light Camera, Parks and Recreation, Court Security, Court Technology, Library, Commercial Vehicle Enforcement, and Southlake Parks Development Corporation Special Revenue Funds and all Debt Service Funds on a basis consistent with accounting principles generally accepted in the United States of America. Formal budgetary integrationisnotemployedforproprietaryfunds.However,theCitydoesadoptanannualbudget for those funds for managerial control.
5. During the fiscal year, the City Council may transfer funds allocated to a department to another department or re-estimate revenues or expenditures. The City Manager may transfer budgeted funds within a department. Expenditures should not exceed appropriations at the department level.
6. BudgetarydataforthePolice,MunicipalJury,OilandGas,TruancyPrevention,DisasterRecovery, and all Capital Projects Funds are not presented, as such funds are budgeted over the life of the respective project, and not on an annual basis. Budgetary information for the Proprietary Funds has not been presented since reporting on such budgets is not legally required.
7. General Fund reported expenditures in excess of appropriations for the year ended September 30, 2024 as follows:
• Support services ($327,823) – A building remodel project was budgeted as capital outlay. However, expenditures did not meet the capitalization criteria, so they were reported as operating expenditures.
• Capital outlay ($177,975) - Due to GASB 87 and 96, not a true cash flow expenditure over budget.
• Debt service: Principal ($1,003,961) - Due to GASB 87 and GASB 96, not a true cash flow expenditure over budget.
• Debtservice:Interest($53,272)-DuetoGASB87andGASB96,notatruecashflowexpenditure over budget.
Schedule of Changes in Net Pension Liability and Related Ratios
Texas Municipal Retirement System
Last Ten Measurement Years
202320222021
Totalpensionliability:
Servicecost5,197,252$4,838,653$4,328,436 $ Interest9,435,2428,750,7548,133,486
Changesofbenefitterms---
Differencebetweenexpectedandactual experience1,315,7271,059,885426,450 Changeinassumptions (467,923)-Benefitpayments,includingrefundsof employeecontributions(5,225,884)(4,150,172)(3,847,375)
Netchangeintotalpensionliability10,254,41410,499,1209,040,997
Totalpensionliability-beginning139,795,674129,296,554120,255,557
Totalpensionliability-ending(a)150,050,088139,795,674129,296,554
Planfiduciarynetposition: Contributions-employer3,967,9973,714,7603,348,713 Contributions-employee2,229,2132,070,3281,871,403 Netinvestmentincome13,917,389(9,335,205)14,591,844 Benefitpayments,includingrefundsof employeecontributions(5,225,884)(4,150,172)(3,847,375) Administrativeexpense(88,341)(80,641)(67,416) Other(617)96,229462
Netchangeinplanfiduciarynetposition14,799,757(7,684,701)15,897,631
Planfiduciarynetposition-beginning119,979,054127,663,755111,766,124
Planfiduciarynetposition-ending(b)134,778,811119,979,054127,663,755
Netpensionliability-ending(a)-(b) $15,271,27719,816,620$1,632,799 $
Planfiduciarynetpositionasa percentageoftotalpensionliability89.82%85.82%98.74% Coveredpayroll31,845,904$29,576,118$26,441,262 $
$4,289,1324,190,311$3,919,389$3,579,734$3,482,384$3,222,126$2,906,949 $ 7,554,3626,945,1836,379,3425,865,6015,393,9975,090,3084,779,462 -------
39,572250,630537,249213,937179,076102,364(1,602,645) -324,280---760,500(2,798,825)(2,671,062)(2,506,166)(1,930,078)(2,304,726)(1,921,361)(1,680,030) 9,084,2419,039,3428,329,8147,729,1946,750,7317,253,9374,403,736 111,171,316102,131,97493,802,16086,072,96679,322,23572,068,29867,664,562 120,255,557111,171,316102,131,97493,802,16086,072,96679,322,23572,068,298 3,322,0513,212,6902,992,1102,682,6292,595,9192,425,4552,283,310 1,829,6121,773,5411,673,4501,520,5181,480,9651,409,0081,340,870 7,731,31913,337,326(2,598,044)10,284,6034,588,25697,2523,463,018 (2,798,825)(2,671,062)(2,506,166)(1,930,078)(2,304,726)(1,921,361)(1,680,030) (49,969)(75,264)(50,164)(53,258)(51,781)(59,224)(36,150) (1,950)(2,262)(2,623)(2,699)(2,790)(2,925)(2,972) 10,032,23815,574,969(491,437)12,501,7156,305,8431,948,2055,368,046 101,733,88686,158,91786,650,35474,148,63967,842,79665,894,59160,526,545 111,766,124101,733,88686,158,91786,650,35474,148,63967,842,79665,894,591 $8,489,4339,437,430$15,973,057$7,151,806$11,924,327
$6,173,707 $ 92.94%91.51%84.36%92.38%86.15%85.53%91.43% $26,137,30925,334,408$23,710,761$21,721,689$21,156,637$20,113,150$19,154,225 $ 32.48%37.25%67.37%32.92%56.36%57.07%32.23%
CityofSouthlake,Texas
Schedule of Pension Contributions
Texas Municipal Retirement System
Last Ten Fiscal Years
FiscalYearFiscalYearFiscalYearFiscalYear 2024202320222021
Actuariallydeterminedcontribution4,105,607$3,792,064$3,547,858$3,244,987 $
Contributioninrelationoftheactuarially determinedcontribution4,151,7013,879,5803,610,3073,297,682
Contributiondeficiency(excess)(46,094)$(87,516)$(62,449)$(52,695) $
Coveredpayroll33,106,641$31,070,964$28,738,669$26,156,402 $
Contributionsasapercentageof
FiscalYearFiscalYearFiscalYearFiscalYearFiscalYearFiscalYear 202020192018201720162015
$3,131,6673,101,504$2,829,615$2,580,380$2,508,791$2,439,627 $
3,201,4513,182,7492,894,2192,654,3032,632,2092,439,627 $(69,784)(81,245)$(64,604)$(73,923)$(123,418)$$
$25,202,79825,156,408$23,132,172$21,525,552$21,551,426$20,034,712 $
Schedule of Changes in Net OPEB Liability (Asset) and Related Ratios
Southlake Net OPEB Liability (Asset) for Health Insurance
Last Seven Measurement Years
Year 202320222021
TotalOPEBliability(asset):
Servicecost128,267$120,612$80,561 $ Interest95,80392,53397,367
Changesofbenefitterms---
Differencebetweenexpectedandactualexperience(16,206)(163,080)6,855
Changeinassumptions (150,440)89,089(217,142)
Benefitpayments,includingrefundsofemployeecontributions(69,818)(85,370)(83,319)
NetchangeintotalOPEBliability(asset)(12,394)53,784(115,678)
TotalOPEBliability(asset)-beginning1,886,8281,833,0441,948,722
TotalOPEBliability(asset)-ending(a)1,874,4341,886,8281,833,044
Planfiduciarynetposition:
Contributions-employer209,818225,370323,319
Netinvestmentincome269,081(343,355)117,346
Benefitpayments,includingrefundsofemployeecontributions(69,818)(85,370)(83,319) Administrativeexpense(8,145)(7,980)(7,918)
Netchangeinplanfiduciarynetposition400,936(211,335)349,428
Planfiduciarynetposition-beginning2,339,1162,550,4512,201,023
Planfiduciarynetposition-ending(b)2,740,0522,339,1162,550,451
NetOPEBliability(asset)-ending(a)-(b)
Planfiduciarynetpositionasa percentageoftotalOPEBliability(asset)146.18%123.97%139.14%
Coveredpayroll32,671,598$30,420,420$27,287,214 $
NetOPEBliability(asset)asapercentage ofcoveredpayroll-2.65%-1.49%-2.63%
Note:OnlysevenyearsofdataispresentedinaccordancewithGASB#75.Additionalyears'informationwillbe displayedasitbecomesavailable.
$73,36566,950$53,239$55,061 $ 114,848108,95387,70684,496 ---(337,496)(1,262)16,549(3,965) 87,2228,001297,855(81,362)(75,967)(75,843)(76,779) (143,423)106,675379,50658,813
2,092,1451,985,4701,605,9641,547,151 1,948,7222,092,1451,985,4701,605,964 321,362165,967172,843116,779 201,804207,145(38,598)121,500 (81,362)(75,967)(75,843)(76,779) (6,098)(5,348)(4,389)(3,483) 435,706291,79754,013158,017
1,765,3171,473,5201,419,5071,261,490 2,201,0231,765,3171,473,5201,419,507 $(252,301)326,828$511,950$186,457 $ 112.95%84.38%74.22%88.39%
$26,994,04326,143,074$22,468,011$20,607,676 $
Last Seven Fiscal Years
Note:Thescheduleisintendedtoshowinformationfor10years.Additionalyears willbedisplayedastheybecomeavailable.
FiscalYearFiscalYearFiscalYearFiscalYear 2021202020192018
$142,458140,254$89,240$89,240 $
332,082301,318177,639168,167
$(189,624)(161,064)$(88,399)$(78,927) $
$25,882,45324,988,882$24,537,271$23,132,172 $
CityofSouthlake,Texas
Schedule of Changes in the Total OPEB Liability and Related Ratios
Texas Municipal Retirement System – Supplemental Death Benefits
Last Seven Measurement Years
MeasurementMeasurementMeasurement 202320222021
TotalOPEBliability: Servicecost35,030$79,856$66,103 $ Interest32,23221,62421,646 Changesofbenefitterms---
Differencebetweenexpectedandactualexperience(12,044)26,255(26,578) Changeinassumptions44,005(467,745)38,907 Contributions-employer(19,108)(14,788)(13,221)
Netchangeintotalpensionliability80,115(354,798)86,857
TotalOPEBliability-beginning787,8971,142,6951,055,838
TotalOPEBliability-ending(a) $868,012787,897$1,142,695 $
Coveredemployeepayroll31,845,904$29,576,118$26,441,273
Note:Thescheduleisintendedtoshowinformationfor10years.Additionalyears willbedisplayedastheybecomeavailable.
MeasurementMeasurementMeasurementMeasurement 2020201920182017
$52,27538,002$42,679$34,755 $ 24,40325,38823,15521,919 ---(37,301)(13,112)(18,599)156,506149,523(56,421)62,407 (2,614)(5,067)(2,371)(4,344) 193,269194,734(11,557)114,737 862,569667,835679,392564,655 $
$1,055,838862,569$667,835$679,392 $ 26,137,30925,334,40823,710,76121,721,689 $ 4.04%3.40%2.82%3.13%
CityofSouthlake,Texas
Schedule of OPEB Contributions
Texas Municipal Retirement System – Supplemental Death Benefits
Last Seven Fiscal Years
Note:Thescheduleisintendedtoshowinformationfor10years.Additionalyears willbedisplayedastheybecomeavailable.
Note:Therearenoassetsaccumulatedinatrustthatmeetthecriteriaof GASBcodificationP22.101orP52.101topayrelatedbenefitsfortheplan.
FiscalYearFiscalYearFiscalYearFiscalYear 2021202020192018
$10,2723,206$3,965$2,846 $ 10,2723,2063,9652,846
$--$-$$
$26,156,40325,202,798$25,156,408$23,132,172 $
CityofSouthlake,Texas
Condition Rating of Street System
September 30, 2024
20201,100,000$1,100,285$285 $ 20211,200,0001,336,244136,244 20221,900,0001,706,384(193,616) 20231,900,0001,982,89682,896 20242,500,000911,077(1,588,923)
The City hired a consultant to implement a pavement management system (PMS) to cover all public streets within the City. The condition of street pavement is measured using the Standard for Roads Pavement Condition Index (SRPCI) as developed by the American Society for Testing and Materials (ASTM). The SRPCI is based on a weighted average of thirteen defects found in pavement surfaces. The consultant conducted a pavement condition survey on all City-owned streets. This consisted of a roughnesssurveyandasurfacedistresssurvey,alongwithadeflectionsurveyofselectedroads.Apresent status analysis was conducted using data obtained from pavement condition survey to determine the International Roughness Index (IRI) and the Pavement Condition Index (PCI). These indices were then combined into the composite Pavement Quality Index (PQI). Values of PQI can range from 0 to 100. Typical values for a newly constructed pavement range from 95.0 to 100.0. The PQI level at which a pavement becomes in need of rehabilitation is typically in the 50.0 to 70.0 range. It was the City’s policy to maintain a PQI of 73.0 until 2012 when the City increased the minimum PQI to 78.0. Needed maintenance is calculated based upon inspections and the PQI.
In accordance with GASB Statement No. 34, the City is required to report at least three complete condition assessments at transition using the modified approach. The condition assessments were completed by the City and concluded that the eligible infrastructure assets are being preserved at or above thecondition levelestablishedbytheCity.HalfoftheCity’spublicstreetswillbeassessedannually to ensure all public streets are assessed every two years.
The City calculates needed maintenance of its street system annually. However, the scheduling of these road projects often crosses fiscal years. Therefore, actual maintenance may be less than the calculated needed maintenance in one fiscal year and greater than the calculated needed maintenance in the subsequent fiscal year.
Combining and Individual Fund Financial Statements and Schedules
The General Obligation Debt Service Fund is used to account for the accumulation of resources for, and the payment of, general obligation bonds and interest from governmental resources.
CityofSouthlake,Texas
General Obligation Debt Service Fund
Budgetary Comparison Schedule (GAAP Basis) For the Year Ended September 30, 2024
VARIANCEWITH FINALBUDGETPOSITIVE ORIGINALFINALACTUAL(NEGATIVE)
BUDGETEDAMOUNTS
REVENUES
Advaloremtaxes,penalties,andinterest5,862,343$5,697,043$5,690,222$(6,821) $ Investmentincome(losses)95,000130,000168,43038,430
Totalrevenues5,957,3435,827,0435,858,65231,609
EXPENDITURES
DebtService
Principal5,656,3585,771,3585,771,358Interest1,112,7811,221,5561,209,68011,876
Totalexpenditures6,769,1396,992,9146,981,03811,876
Excess(deficiency)ofrevenues over(under)expenditures(811,796)(1,165,871)(1,122,386)43,485
OTHERFINANCINGSOURCES:
Transfersfromotherfunds397,341397,341397,341Totalotherfinancingsources397,341397,341397,341-
Netchangeinfundbalance(414,455)(768,530)(725,045)43,485
Fundbalance,beginningofyear2,993,2632,993,2632,993,263-
The Special Revenue Funds are used to account for revenue sources that are legally restricted or committed to expenditures for specified purposes.
PoliceFund – Established to account for resources required to be utilized by the police department.
ParksandRecreationFund – Established to account for resources restricted for use by the community services department.
Parks Dedication Fund – Established to account for resources restricted for use by the community services department.
Crime Control District Fund – Established to account for the operations of the Crime Control District, which was established for the financing and development of crime control within the City. The Crime Control Fund is funded primarily through the municipal sales taxes.
Hotel Occupancy Fund – Established to account for all revenues and expenditures relating to the hotel occupancy tax received by the City.
Storm Water Utility Fund – Established to account for fees collected for the purpose of improving, upgradingandmaintainingtheCity'sdrainagesystem.TheCityismandatedbytheTexasCommission on Environmental Quality (TCEQ) to develop and maintain a Storm Water Management Plan in order to address capacity and quality issues and protect its residents and their properties from possible floodingandpollutionproblems.Drainagefeesarecollectedtofundtheactivitiesrequiredtocomply with TCEQ regulations.
Court Security Fund – Established to account for municipal court fees assessed to provide court security.
Court Technology Fund – Established to account for municipal court fees assessed to provide court technology.
MunicipalJuryFund –Establishedtoaccountformunicipalcourtfeesassessedtoprovidejuryservices.
LibraryFund – Established to account for resources donated for use by library services.
Red Light Camera Fund – Established to account for fees assessed for red light violations captured through the City’s camera monitoring system.
Oil and Gas Fund – Established to account for permits fees and the related expenditures for oil and gas drilling.
CommercialVehicleEnforcementFund –Establishedtoaccountforthefeesassessedforcommercial vehicle violations.
Truancy Prevention – Established to account for municipal court fees assessed to provide for juvenile case manager services.
TaxIncrementFinancing District – Established to account for the general operations of the TIF, which was formed to finance and make public improvements. The TIF is funded primarily through the assessment of ad valorem taxes.
DisasterRecovery – Established to account for grant awards to provide disaster relief.
The Debt Service Funds are utilized to account for the accumulation of financial resources for, and the payment of, long-term debt principal, interest, and related costs arising from the issuance of bonds.
Southlake Parks DevelopmentCorporation Debt ServiceFund – Established to accumulate resources to finance the debt service of debt issues of the Southlake Parks Development Corporation.
Community Enhancement and Development Corporation Debt Service Fund – Established to accumulate resources to finance the debt service of debt issues for the community entertainment and recreation center.
The Capital Projects Funds are utilized to account for financial resources to be used for the acquisition or construction of specified capital improvements (other than those financed by proprietary funds).
Community EnhancementandDevelopmentCorporationCapitalProjects Fund – Established to fund the acquisition and construction of a community entertainment and recreation center as approved by the CEDC board of directors. The fund has been financed through the issuance of sales tax revenue bonds.
Crime Control District Capital Projects Fund – Established to account for the acquisition and construction of capital assets as approved by the District’s board of directors. The fund has been funded primarily through the issuance of general obligation debt.
Storm HotelWaterCourtCourtMunicipalRedLight OccupancyUtilitySecurityTechnologyJuryLibraryCamera
$4,619,9721,944,678$454,888$324,405$2,540$21,381$172,666 $ 255,881-----4,8462,033478338322180 1,000223,839-----
$4,881,6992,170,550$455,366$324,743$2,543$21,403$172,846 $
646,4986,435$-$15,605$-$-$45,000 $ 11,08413,5851,443----------
657,58220,0201,44315,605--45,000 1,000------
4,223,1172,150,530453,923309,1382,54321,403127,846 -------
4,223,1172,150,530453,923309,1382,54321,403127,846
$4,881,6992,170,550$455,366$324,743$2,543$21,403$172,846 $
CityofSouthlake,Texas
Nonmajor Governmental Funds
Combining Balance Sheet - Continued September 30, 2024
ASSETS
Cashandcashequivalents60,309$161,795$154,729$11,578,974$$ Receivables,netofallowancesforuncollectibles: Taxes----Interest6316316112,073Other---8,607-
Unavailableresources---8,607FUNDBALANCES
Restricted-154,535154,89011,565,009Committed60,372----
Formerly SouthlakeCommunityNon-MajorCommunity TOTAL ParksEnhancementSouthlakeParksEnhancementCrimeNON-MAJOR DevelopmentDevelopmentDevelopmentDevelopmentControlGOVERNMENTAL CorporationCorporationCorporationCorporationDistrictFUNDS
$2,122,341658,608$-$2,406,505$2,106,339$34,174,694 $ -----671,163 2,214687-2,5112,20035,626 -----261,224
$2,124,555659,295$-$2,409,016$2,108,539$35,142,707 $
$--$-$-$449,899$1,181,398 $ -----160,999 ----48,03548,035 ----497,9341,390,432 -----32,484
2,124,555659,295-2,409,0161,610,60531,627,605 -----2,092,186
2,124,555659,295-2,409,0161,610,60533,719,791
$2,124,555659,295$-$2,409,016$2,108,539$35,142,707 $
CityofSouthlake,Texas
Nonmajor Governmental Funds
Combining Statement of Revenues, Expenditures and Changes in Fund Balances For the Year Ended September 30, 2024
ParksCrime andParksControl PoliceRecreationDedicationDistrict
REVENUES
Advaloremtaxes,penaltiesandinterest-$-$-$$ Municipalsalestax---2,600,691 Licenses,permitsandfees--342,310Finesandforfeitures590--Chargesforservices---Grants----
Investmentincome(losses)3,42711,49388,135250,002 Contributions-34,310-Miscellaneous4,327---
Totalrevenues8,34445,803430,4452,850,693
EXPENDITURES
Current: Generalgovernment Supportservices---Municipalcourt---Publicsafety Policeservices37,809--2,200,980 Fireservices---Publicworks Streetsanddrainage---Culturalandrecreation Communityservices-31,327-Parksandrecreation---Libraryservices---Promotionofcultureandtourism---Intergovernmental---Capitaloutlay---32,547
Debtservice: Principalretirement4,300--157,600 Interestandfiscalcharges---14,562
Totalexpenditures42,10931,327-2,405,689
Excess(deficiency)ofrevenues over(under)expenditures(33,765)14,476430,445445,004
OTHERFINANCINGSOURCES(USES) Issuanceofsubscriptions---Transfersfromotherfunds---Transferstootherfunds---(445,900) Totalotherfinancingsources(uses)---(445,900)
Netchangeinfundbalances(33,765)14,476430,445(896)
Fundbalances,beginningofyear, aspreviouslypresented88,584216,5091,601,3695,376,292
Changewithinfinancialreportingentity (nonmajortomajor)---Fundbalances,asrestated88,584216,5091,601,3695,376,292
Storm HotelWaterCourtCourtMunicipalRedLight OccupancyUtilitySecurityTechnologyJuryLibraryCamera
$--$-$-$-$-$$ 2,391,969-------------31,38925,769635--1,613,076----------185,12192,41222,82715,33721,03910,447 -----8,71911,919------
2,589,0091,705,48854,21641,1066379,75810,447 --------48,84422,364--------122,099 -------602,947---------------------7,889871,217-----------43,458-----19,935-2,306---1,053-----935,663602,94751,15022,364-7,889122,099 1,653,3461,102,5413,06618,7426371,869(111,652) 43,458-----------(658,850)(1,114,585)----(615,392)(1,114,585)----1,037,954(12,044)3,06618,7426371,869(111,652) 3,185,1632,162,574450,857290,3961,90619,534239,498 ------3,185,1632,162,574450,857290,3961,90619,534239,498
$4,223,1172,150,530$453,923$309,138$2,543$21,403$127,846 $
CityofSouthlake,Texas
Nonmajor Governmental Funds
Combining Statement of Revenues, Expenditures and Changes in Fund Balances - Continued For the Year Ended September 30, 2024
Tax CommercialIncrement OilandVehicleTruancyFinancingDisaster GasEnforcementPreventionDistrictRecovery REVENUES
Advaloremtaxes,penaltiesandinterest-$-$-$10,470,200$$ Municipalsalestax----Licenses,permitsandfees----Finesandforfeitures-11,52131,603-Chargesforservices----Grants----7,060 Investmentincome(losses)2,9249,5096,757474,432Contributions----Miscellaneous-----
Totalrevenues2,92421,03038,36010,944,6327,060 EXPENDITURES
Current: Generalgovernment Supportservices---529,694Municipalcourt----Publicsafety Policeservices-172,482-347,173Fireservices----7,060 Publicworks Streetsanddrainage----Culturalandrecreation Communityservices----Parksandrecreation----Libraryservices----Promotionofcultureandtourism----Intergovernmental---6,849,951Capitaloutlay----Debtservice: Principalretirement----Interestandfiscalcharges----Totalexpenditures-172,482-7,726,8187,060
Excess(deficiency)ofrevenues over(under)expenditures2,924(151,452)38,3603,217,814OTHERFINANCINGSOURCES(USES) Issuanceofsubscriptions----Transfersfromotherfunds-100,000--Transferstootherfunds-----
Totalotherfinancingsources(uses)-100,000--Netchangeinfundbalances2,924(51,452)38,3603,217,814Fundbalances,beginningofyear, aspreviouslypresented57,448205,987116,5308,347,195Changewithinfinancialreportingentity (nonmajortomajor)----Fundbalances,asrestated57,448205,987116,5308,347,195-
$--$-$-$-$10,470,200 $ -----4,992,660 -----342,310 -----101,507 -----1,613,076 -----7,060 106,55440,677-117,635123,4451,562,175 -----43,029 -----16,246 106,55440,677-117,635123,44519,148,263 -----529,694 -----71,208 -----2,880,543 ----7,060 -----602,947 -----31,327 ----------7,889 -----871,217 -----6,849,951 ---212,1061,467,9061,756,017
2,409,0001,620,000---4,213,141 378,565827,706---1,221,886
2,787,5652,447,706-212,1061,467,90619,042,880 (2,681,011)(2,407,029)-(94,471)(1,344,461)105,383 -----43,458 2,782,5762,450,556-241,000334,5005,908,632 -----(2,219,335)
2,782,5762,450,556-241,000334,5003,732,755 101,56543,527-146,529(1,009,961)3,838,138 2,022,990615,76820,845,3672,262,4872,620,56650,727,020 --(20,845,367)--(20,845,367) 2,022,990615,768-2,262,4872,620,56629,881,653 $2,124,555659,295$-$2,409,016$1,610,605$33,719,791 $
CityofSouthlake,Texas
Police Special Revenue Fund
Budgetary Comparison Schedule (GAAP Basis) For the Year Ended September 30, 2024
VARIANCEWITH FINALBUDGETPOSITIVE ORIGINALFINALACTUAL(NEGATIVE)
BUDGETEDAMOUNTS
REVENUES
Finesandforfeitures-$590$590$$ Investmentincome(losses)1,2002,6003,427827 Miscellaneous-4,3274,327-
Totalrevenues1,2007,5178,344827
EXPENDITURES
Current:
Publicsafety Policeservices57,42657,42637,80919,617
Debtservice:
Interestandfiscalcharges--4,300(4,300)
Totalexpenditures57,42657,42642,10915,317
Excess(deficiency)ofrevenues over(under)expenditures(56,226)(49,909)(33,765)16,144
Netchangeinfundbalances(56,226)(49,909)(33,765)16,144
Fundbalances,beginningofyear88,58488,58488,584FUNDBALANCES,ENDOFYEAR
CityofSouthlake,Texas
Parks and Recreation Special Revenue Fund
Budgetary Comparison Schedule (GAAP Basis) For the Year Ended September 30, 2024
VARIANCEWITH FINALBUDGETPOSITIVE ORIGINALFINALACTUAL(NEGATIVE)
BUDGETEDAMOUNTS
REVENUES
Investmentincome(losses)4,300$8,000$11,493$3,493 $ Contributions66,50025,00034,3109,310
Totalrevenues70,80033,00045,80312,803
EXPENDITURES
Culturalandrecreation
Communityservices87,50087,50031,32756,173
Totalexpenditures87,50087,50031,32756,173
Excess(deficiency)ofrevenues over(under)expenditures(16,700)(54,500)14,47668,976
Netchangeinfundbalances(16,700)(54,500)14,47668,976
Fundbalances,beginningofyear216,509216,509216,509FUNDBALANCES,ENDOFYEAR
CityofSouthlake,Texas
Parks Dedication Special Revenue Fund
Budgetary Comparison Schedule (GAAP Basis) For the Year Ended September 30, 2024
VARIANCEWITH FINALBUDGETPOSITIVE ORIGINALFINALACTUAL(NEGATIVE)
BUDGETEDAMOUNTS
REVENUES:
Licenses,permits,andfees90,000$293,300$342,310$49,010 $
Investmentincome(losses)30,00060,00088,13528,135
Totalrevenues120,000353,300430,44577,145
Netchangeinfundbalance120,000353,300430,44577,145
Fundbalances,beginningofyear1,601,3691,601,3691,601,369FUNDBALANCES,ENDOFYEAR $1,721,3691,954,669$2,031,814$77,145 $
CityofSouthlake,Texas
Crime Control District Special Revenue Fund
Budgetary Comparison Schedule (GAAP Basis) For the Year Ended September 30, 2024
VARIANCEWITH FINALBUDGETPOSITIVE ORIGINALFINALACTUAL(NEGATIVE)
REVENUES: Municipalsalestax2,424,000$2,600,000$2,600,691$691 $ Investmentincome(losses)95,000185,000250,00265,002
Totalrevenues2,519,0002,785,0002,850,69365,693
EXPENDITURES: Publicsafety Policeservices2,217,2382,234,9202,200,98033,940 Capitaloutlay--32,547(32,547)
Debtservice: Principalretirement--157,600(157,600) Interestandfiscalcharges--14,562(14,562)
Totalexpenditures2,217,2382,234,9202,405,689(170,769)
Excess(deficiency)ofrevenues over(under)expenditures301,762550,080445,004(105,076)
OTHERFINANCINGSOURCES(USES): Transferstootherfunds(435,260)(445,900)(445,900)-
Totalotherfinancing(uses)(435,260)(445,900)(445,900)Netchangeinfundbalance(133,498)104,180(896)(105,076)
Fundbalances,beginningofyear5,376,2925,376,2925,376,292-
$(105,076) $
CityofSouthlake,Texas
Hotel Occupancy Special Revenue Fund
Budgetary Comparison Schedule (GAAP Basis) For the Year Ended September 30, 2024
VARIANCEWITH FINALBUDGETPOSITIVE ORIGINALFINALACTUAL(NEGATIVE)
BUDGETEDAMOUNTS
REVENUES:
Municipalsalestax2,090,500$2,290,000$2,391,969$101,969 $ Investmentincome(losses)55,000125,000185,12160,121
Miscellaneousrevenue--11,91911,919
Totalrevenues2,145,5002,415,0002,589,009174,009
EXPENDITURES:
Promotionofcultureandtourism1,143,0441,143,044871,217271,827
Capitaloutlay--43,458(43,458)
Debtservice:
Principalretirement--19,935(19,935) Interestandfiscalcharges--1,053(1,053)
Totalexpenditures1,143,0441,143,044935,663207,381
Excess(deficiency)ofrevenues over(under)expenditures1,002,4561,271,9561,653,346381,390
OTHERFINANCINGUSES:
Issuanceofsubscriptions--43,45843,458 Transferstootherfunds(607,645)(658,850)(658,850)-
Totalotherfinancing(uses)(607,645)(658,850)(615,392)43,458
Netchangeinfundbalance394,811613,1061,037,954424,848
Fundbalances,beginningofyear3,185,1633,185,1633,185,163FUNDBALANCES,ENDOFYEAR
$3,579,9743,798,269$4,223,117$424,848 $
CityofSouthlake,Texas
Storm Water Utility Special Revenue Fund
Budgetary Comparison Schedule (GAAP Basis) For the Year Ended September 30, 2024
VARIANCEWITH FINALBUDGETPOSITIVE ORIGINALFINALACTUAL(NEGATIVE)
BUDGETEDAMOUNTS
REVENUES:
Chargesforservice1,611,300$1,615,100$1,613,076$(2,024) $ Investmentincome(losses)40,00066,00092,41226,412
Totalrevenues1,651,3001,681,1001,705,48824,388
EXPENDITURES:
Publicworks
Streetsanddrainage609,912609,912602,9476,965
Excessrevenuesoverexpenditures1,041,3881,071,1881,102,54131,353
OTHERFINANCINGUSES:
Transferstootherfunds(1,113,393)(1,114,585)(1,114,585)-
Netchangeinfundbalance(72,005)(43,397)(12,044)31,353
Fundbalances,beginningofyear2,162,5742,162,5742,162,574FUNDBALANCES,ENDOFYEAR $2,090,5692,119,177$2,150,530$31,353 $
CityofSouthlake,Texas
Court Security Special Revenue Fund
Budgetary Comparison Schedule (GAAP Basis) For the Year Ended September 30, 2024
VARIANCEWITH FINALBUDGETPOSITIVE ORIGINALFINALACTUAL(NEGATIVE)
BUDGETEDAMOUNTS
REVENUES
Finesandforfeitures23,000$25,000$31,389$6,389 $
Investmentincome(losses)9,00016,00022,8276,827
Totalrevenues32,00041,00054,21613,216
EXPENDITURES
Generalgovernment Municipalcourt80,52080,10048,84431,256
Debtservice: Principalretirement--2,306(2,306)
Totalexpenditures80,52080,10051,15028,950
Excess(deficiency)ofrevenues over(under)expenditures(48,520)(39,100)3,06642,166
Netchangeinfundbalance(48,520)(39,100)3,06642,166
Fundbalances,beginningofyear450,857450,857450,857FUNDBALANCES,ENDOFYEAR $402,337411,757$453,923$42,166 $
CityofSouthlake,Texas
Court Technology Special Revenue Fund
Budgetary Comparison Schedule (GAAP Basis) For the Year Ended September 30, 2024
VARIANCEWITH FINALBUDGETPOSITIVE ORIGINALFINALACTUAL(NEGATIVE)
BUDGETEDAMOUNTS
REVENUES
Finesandforfeitures20,000$22,000$25,769$3,769 $
Investmentincome(losses)6,50011,00015,3374,337
Totalrevenues26,50033,00041,1068,106
EXPENDITURES
Generalgovernment Municipalcourt26,53027,16022,3644,796
Excessrevenuesoverexpenditures(30)5,84018,74212,902
Netchangeinfundbalance(30)5,84018,74212,902
Fundbalances,beginningofyear290,396290,396290,396FUNDBALANCES,ENDOFYEAR $290,366296,236$309,138$12,902 $
CityofSouthlake,Texas ExhibitC-11
Library Special Revenue Fund
Budgetary Comparison Schedule (GAAP Basis) For the Year Ended September 30, 2024
VARIANCEWITH FINALBUDGETPOSITIVE ORIGINALFINALACTUAL(NEGATIVE)
BUDGETEDAMOUNTS
REVENUES
Investmentincome(losses)300$700$1,039$339 $ Contributions4,0008,5008,719219
Totalrevenue4,3009,2009,758558
EXPENDITURES
Culturalandrecreation Libraryservices8,0008,0007,889111
Excess(deficiency)ofrevenues over(under)expenditures(3,700)1,2001,869669
Netchangeinfundbalance(3,700)1,2001,869669
Fundbalances,beginningofyear19,53419,53419,534FUNDBALANCES,ENDOFYEAR
CityofSouthlake,Texas
Red Light Camera Special Revenue Fund
Budgetary Comparison Schedule (GAAP Basis) For the Year Ended September 30, 2024
VARIANCEWITH FINALBUDGETPOSITIVE ORIGINALFINALACTUAL(NEGATIVE)
BUDGETEDAMOUNTS
REVENUES: Investmentincome(losses)1,500$8,000$10,447$2,447 $
EXPENDITURES:
Publicsafety Policeservices126,205126,205122,0994,106
Excess(deficiency)ofrevenues(124,705)(118,205)(111,652)6,553 over(under)expenditures
Netchangeinfundbalance(124,705)(118,205)(111,652)6,553
Fundbalances,beginningofyear239,498239,498239,498FUNDBALANCES,ENDOFYEAR $114,793121,293$127,846$6,553 $
CityofSouthlake,Texas
Commercial Vehicle Enforcement
Budgetary Comparison Schedule (GAAP Basis) For the Year Ended September 30, 2024
VARIANCEWITH FINALBUDGETPOSITIVE ORIGINALFINALACTUAL(NEGATIVE)
REVENUES
Finesandforfeitures25,000$15,000$11,521$(3,479) $ Investmentincome(losses)4,5007,0009,5092,509 Totalrevenues29,50022,00021,030(970)
EXPENDITURES
Publicsafety Policeservices174,750174,750172,4822,268
Excess(deficiency)ofrevenues over(under)expenditures(145,250)(152,750)(151,452)1,298
OTHERFINANCINGSOURCES
Transfersfromotherfunds100,000100,000100,000Totalotherfinancingsources100,000100,000100,000Netchangeinfundbalance(45,250)(52,750)(51,452)1,298 Fundbalances,beginningofyear205,987205,987205,987FUNDBALANCES,ENDOFYEAR $160,737153,237$154,535$1,298 $
CityofSouthlake,Texas
Tax Increment Financing District Special Revenue Fund
Budgetary Comparison Schedule (GAAP Basis) For the Year Ended September 30, 2024
VARIANCEWITH FINALBUDGETPOSITIVE ORIGINALFINALACTUAL(NEGATIVE)
BUDGETEDAMOUNTS
REVENUES
Advaloremtaxes,penaltiesandinterest9,562,848$10,470,200$10,470,200$$
Investmentincome(losses)160,000300,000474,432174,432
Totalrevenues9,722,84810,770,20010,944,632174,432
EXPENDITURES
Generalgovernment: Supportservices565,453565,453529,69435,759
Publicsafety: Policeservices397,446397,446347,17350,273 Intergovernmental6,256,7306,849,9516,849,951-
Totalexpenditures7,219,6297,812,8507,726,81886,032
Excessofrevenuesoverexpenditures2,503,2192,957,3503,217,814260,464
Netchangeinfundbalance2,503,2192,957,3503,217,814260,464
Fundbalance,beginningofyear8,347,1958,347,1958,347,195FUNDBALANCE,ENDOFYEAR $10,850,41411,304,545$11,565,009$260,464 $
CityofSouthlake,Texas
Southlake Parks Development Corporation Debt Service Fund
Budgetary Comparison Schedule (GAAP Basis) For the Year Ended September 30, 2024
VARIANCEWITH FINALBUDGETPOSITIVE ORIGINALFINALACTUAL(NEGATIVE)
BUDGETEDAMOUNTS
REVENUES: Investmentincome(losses)69,000
EXPENDITURES:
Debtservice: Principalretirement2,409,0002,409,0002,409,000Interestandfiscalcharges379,576379,576378,5651,011
Totalexpenditures2,788,5762,788,5762,787,5651,011
Excess(deficiency)ofrevenues over(under)expenditures(2,719,576)(2,712,576)(2,681,011)31,565
OTHERFINANCINGSOURCES:
Transfersfromotherfunds2,782,5762,782,5762,782,576-
Totalotherfinancingsources2,782,5762,782,5762,782,576-
Netchangeinfundbalance63,00070,000101,56531,565 Fundbalances,beginningofyear2,022,9902,022,9902,022,990FUNDBALANCES,ENDOFYEAR $2,085,9902,092,990$2,124,555$31,565 $
CityofSouthlake,Texas
Community Enhancement Development Corporation Debt Service Fund
Budgetary Comparison Schedule (GAAP Basis) For the Year Ended September 30, 2024
VARIANCEWITH FINALBUDGETPOSITIVE ORIGINALFINALACTUAL(NEGATIVE) REVENUES: Investmentincome(losses)35,000$35,000$40,677$5,677 $
EXPENDITURES:
BUDGETEDAMOUNTS
Debtservice: Principalretirement1,620,0001,620,0001,620,000Interestandfiscalcharges830,556830,556827,7062,850
TOTALEXPENDITURES 2,450,5562,450,5562,447,7062,850
Excess(deficiency)ofrevenues over(under)expenditures(2,415,556)(2,415,556)(2,407,029)8,527
OTHERFINANCINGSOURCES:
Transfersfromotherfunds2,450,5562,450,5562,450,556Totalotherfinancingsources2,450,5562,450,5562,450,556-
Netchangeinfundbalance35,00035,00043,5278,527 Fundbalances,beginningofyear615,768615,768615,768FUNDBALANCES,ENDOFYEAR $650,768650,768$659,295$8,527 $
This part of the City of Southlake's annual comprehensive financial report presents detailed information as a context for understanding what the information in the financial statements, notes disclosures, and required supplementary information says about the City's overall financial health. This information has not been audited by the independent auditor.
These tables contain trend information to help the reader understand how the City’s financial performance and well-being have changed over time.
These tables contain information to help the reader assess the City's two most significant local revenue source, the property and sales taxes. Debt
These tables present information to help the reader assess the affordability of the City's current levels of outstanding debt and the City's ability to issue additional debt in the future.
Demographic and Economic Information .......................................................................................................158
Thesetablesoffereconomicanddemographicindicatorstohelpthereaderunderstandtheenvironment within which the City's financial activities take place.
These tables contain service and infrastructure data to help the reader understand how the information in the City's financial report relates to the services the City provides and the activities it performs.
Sources: Unless otherwise noted, the information in these tables is derived from the annual comprehensive financial reports for the relevant year.
CityofSouthlake,Texas
Net Position by Component
(Accrual Basis of Accounting) Last Ten Fiscal Years (Unaudited)
Governmentalactivities
Netinvestmentincapitalassets366,796,228$364,161,725$385,506,389$392,406,812 $ Restricted13,624,16411,589,35049,850,43928,492,591 Unrestricted59,447,80080,992,07945,930,42678,585,681
Totalgovernmentalactivitiesnetposition439,868,192
Business-typeactivities
Netinvestmentincapitalassets78,143,445$79,055,138$82,251,014$83,461,157 $ Restricted3,151,3096,817,0387,804,1978,980,312 Unrestricted10,509,49812,487,87515,721,75517,935,009
Totalbusiness-typeactivitiesnetposition91,804,252
Primarygovernment
Netinvestmentincapitalassets444,939,673$443,216,863$467,757,403$475,867,969 $ Restricted16,775,47318,406,38857,654,63637,472,903 Unrestricted69,957,29893,479,95461,652,18196,520,690
Totalprimarygovernmentalnetposition531,672,444
Source:AnnualComprehensiveFinancialReport
FiscalYear
201920202021202220232024
$399,651,828415,945,257$432,717,828$444,246,656$450,639,461$472,883,752 $ 32,690,10025,518,84439,870,05199,360,585121,858,264111,948,381 87,753,90696,924,42395,211,15262,641,19966,478,02388,137,949 $520,095,834538,388,524$567,799,031$606,248,440$638,975,748$672,970,082 $
$83,223,71376,271,158$77,068,608$77,774,937$75,167,644$74,231,905 $ 6,215,68610,555,03210,966,7289,877,1678,464,09411,659,020 21,579,17029,619,46336,831,31845,903,64262,370,81670,801,660 $111,018,569116,445,653$124,866,654$133,555,746$146,002,554$156,692,585 $
$482,875,541492,216,415$509,786,436$522,021,593$525,807,105$547,115,657 $ 38,905,78636,073,87650,836,779109,237,752130,322,358123,607,401 109,333,076126,543,886132,042,470108,544,841128,848,839158,939,609 $631,114,403654,834,177$692,665,685$739,804,186$784,978,302$829,662,667 $
(Accrual Basis of Accounting) Last Ten Fiscal Years (Unaudited)
FiscalYear
Totalgovernmentalactivitiesexpenses54,380,42657,764,17063,203,95468,081,109
Business-typeactivities:
Waterandsewer26,692,37324,741,42824,703,00729,068,434
Totalbusiness-typeactivitiesexpenses26,692,37324,741,42824,703,00729,068,434 Totalprimarygovernmentexpenses81,072,799
ProgramRevenues
Governmentalactivities:
$87,906,961$97,149,543 $
ChargesforServices: Generalgovernment2,309,861$2,363,499$2,262,247$2,895,701 $ Publicsafety4,427,1374,620,0303,929,5642,495,288 Publicworks265,432223,533143,9351,635,163 Cultureandrecreation1,399,8221,537,1851,814,3191,301,793 Operatinggrantsandcontributions455,575310,636328,288459,006 Capitalgrantsandcontributions8,967,4662,228,8637,714,7651,044,834 Totalgovernmentalactivitiesprogramrevenues17,825,29311,283,74616,193,1189,831,785
Business-typeactivities:
Chargesforservices: Waterandsewer24,792,61925,474,77727,939,50432,229,361 Capitalgrantsandcontributions5,776,4381,638,8423,851,0572,367,774 Totalbusiness-typeactivitiesprogramrevenues30,569,05727,113,61931,790,56134,597,135
Totalprimarygovernmentprogramrevenues48,394,350$38,397,365
$44,428,920 $
Net(Expenses)Revenue Governmentalactivities(36,555,133)$(46,480,424)$(47,010,836)$(58,249,324) $ Business-typeactivities3,876,6842,372,1917,087,5545,528,701 Totalprimarygovernmentnetexpenses(32,678,449)$(44,108,233)$(39,923,282)$(52,720,623) $
GeneralRevenues andOtherChangesinNetPosition Governmentalactivities: Generalrevenues: Propertytaxes33,176,285$34,501,608$37,705,796$40,380,926 $ Salestaxes30,090,61429,047,28529,968,33130,822,431 Franchisetaxes3,327,7392,955,1142,907,5372,972,143 Investmentincome(losses)523,954379,342843,0822,108,804 Gain(Loss)onsaleofcapitalassets102,900102,96071,284Miscellaneous1,066,818136,477216,881Transfers968,160(3,767,400)(157,975)1,211,036 Totalgovernmentalactivities69,256,47063,355,38671,554,93677,495,340 Business-typeactivities: Interestoninvestments112,96794,837167,068320,473 Gain(Loss)onsaleofcapitalassets23,100317,276350Transfers(968,160)3,767,400157,975(1,211,036) Miscellaneous4,5214,0953,9684,166 Totalbusiness-typeactivities(827,572)4,183,608329,361(886,397) Totalprimarygovernment68,428,898$67,538,994$71,884,297$76,608,943 $ ChangeinNetPosition Governmentalactivities32,701,337$16,874,962$24,544,100$19,246,016 $ Business-typeactivities3,049,1126,555,7997,416,9154,642,304 Totalprimarygovernment35,750,449$23,430,761$31,961,015$23,888,320 $
Source:AnnualComprehensiveFinancialReport
Notes:TheCitystartedsplittingoutpromotionofcultureandtourismin2024
FiscalYear
201920202021202220232024
$20,014,58321,275,487$20,990,841$20,685,238$26,292,171$26,994,341 $ 23,881,48524,054,52723,642,96924,915,80126,658,91727,798,598 10,081,7219,839,6469,122,95110,111,58512,108,56410,709,563 15,955,20117,665,95315,367,10316,970,27218,657,11019,939,371 -----871,217 2,750,0372,171,3592,076,8091,979,5462,071,8671,867,737 72,683,02775,006,97271,200,67374,662,44285,788,62988,180,827
29,873,78827,490,81525,730,74128,397,03628,506,29228,969,340 29,873,78827,490,81525,730,74128,397,03628,506,29228,969,340 $102,556,815102,497,787$96,931,414$103,059,478$114,294,921$117,150,167 $
$2,498,5491,631,816$1,733,148$1,957,434$1,712,925$2,271,472 $ 3,001,8952,536,5532,166,430803,365774,8911,081,451 1,724,3441,824,4341,658,7234,287,1383,477,3483,337,594 2,145,1282,993,5523,387,4304,477,0315,664,7755,607,865 866,5181,807,473894,4238,736,294825,770375,784 1,437,1661,422,3155,882,0152,653,5562,382,7704,890,150 11,673,60012,216,14315,722,16922,914,81814,838,47917,564,316
29,929,93232,271,34132,071,14037,241,97637,630,96535,597,701 896,6521,315,0923,332,4521,376,0022,064,2961,734,388 30,826,58433,586,43335,403,59238,617,97839,695,26137,332,089 $42,500,18445,802,576$51,125,761$61,532,796$54,533,740$54,896,405 $
$(61,009,427)(62,790,829)$(55,478,504)$(51,747,624)$(70,950,150)$(70,616,511) $ 952,7966,095,6189,672,85110,220,94211,188,9698,362,749 $(60,056,631)(56,695,211)$(45,805,653)$(41,526,682)$(59,761,181)$(62,253,762) $
$41,734,94641,973,780$41,660,369$41,392,861$42,315,760$43,315,203 $ 31,868,20432,119,11438,461,31243,723,49047,917,15244,830,166 3,114,1172,811,5732,671,7262,988,8743,656,8953,445,059 3,247,4011,721,876101,746(475,934)7,934,30111,116,664 ----4,156143,146 476,5771,222,231709,736804,354512,725151,752 1,178,9321,234,9451,284,1221,360,8301,336,4691,608,855 81,620,17781,083,51984,889,01189,794,475103,677,458104,610,845
868,227566,41132,272(171,020)2,594,3083,839,868 -----96,269 (1,178,932)(1,234,945)(1,284,122)(1,360,830)(1,336,469)(1,608,855) -----(310,705)(668,534)(1,251,850)(1,531,850)1,257,8392,327,282 $81,309,47280,414,985$83,637,161$88,262,625$104,935,297$106,938,127 $
$20,610,75018,292,690$29,410,507$38,046,851$32,727,308$33,994,334 $ 642,0915,427,0848,421,0018,689,09212,446,80810,690,031 $21,252,84123,719,774$37,831,508$46,735,943$45,174,116$44,684,365 $
CityofSouthlake,Texas
Fund Balances, Governmental Funds
(Modified Accrual Basis of Accounting) Last Ten Fiscal Years (Unaudited)
GeneralFund
FiscalYear
2015201620172018
Nonspendable27,826$86,286$57,997$86,286 $
Committedfor:
Policeexpenditures34,609-46,657Assignedfor:
Teencourtexpenditures19,07719,83519,68419,835
Seniorcenterexpenditures10,62410,74310,67110,743
Recycling40,61259,16352,81159,163
Reforestationexpenditures101,873111,728112,300111,728 Publicart---678,829
Facilitymaintenance---6,708,556
Economicinvestment---2,237,211
Strategicinitiatives7,673,6805,297,9986,052,0635,299,595
Unassigned18,230,31719,762,63318,745,73511,799,021
Totalgeneralfund26,138,618$25,348,386$25,097,918$27,010,967 $
AllOtherGovernmentalFunds*
Nonspendable-$-$-$50,177 $ Restrictedfor:
Debtservice11,057,1969,005,9858,029,6077,750,782
Capitalprojects----
Municipalcourtexpenditures878,490838,458868,393851,104
Reinvestmentzoneexpenditures4,010,1953,851,7831,954,971923,093
Parksandrecreation41,949,79172,654,65278,664,64640,726,831
Stormwater----
Policeexpenditures---Libraryexpenditures---Promotionofcultureandtourism---Committedfor:
Policeexpenditures7,813,8494,986,8043,645,2264,743,948 Parksandrecreation10,720,49811,125,96717,968,6958,904,671
Oilandgasexpenditures53,16853,22753,40453,719
Stormwaterexpenditures451,3714,856,336453,374456,388
Libraryexpenditures8,8327,1327,4328,338
Capitalprojects---34,285,874 Assignedfor: Capitalprojects---Unassigned----
Totalallothergovernmentalfunds76,943,390$107,380,344$111,645,748$98,704,748 $
Source:AnnualComprehensiveFinancialReport
Notes:aIncludesencumbrancesandprepaiditems.
*TheCitystartedsplittingparksandrecreationwithstormwaterandpromotionof cultureandtourismin2020
FiscalYear
201920202021202220232024
$63,18940,839$69,373$401,529$54,317$44,905 $ ------
20,42720,69320,72120,88221,86223,161 10,93811,06411,07411,04211,48612,061 66,25370,39576,458138,29170,97777,363 63,03035,15054,84796,012153,918160,358 835,991500,819364,046441,984610,439539,053 7,222,9958,813,7959,351,44110,064,32611,843,29912,934,258 2,282,7183,525,2802,870,6372,950,9943,225,4783,541,789 7,585,67110,603,71215,096,12020,306,80715,383,08013,189,926 12,517,34014,022,97615,810,84614,681,55617,594,60917,019,733 $30,668,55237,644,723$43,725,563$49,113,423$48,969,465$47,542,607 $
8,419,0087,102,1455,594,5795,751,5855,632,0215,052,068 ---26,395,65634,698,80424,660,776 847,247739,828775,437835,268859,689920,494 2,925,9774,999,8955,641,8936,663,9708,347,19511,565,009 24,372,5679,381,01924,792,05947,632,46558,345,18855,441,867 -1,789,6121,255,8731,936,3582,162,5742,150,530 ---7,791,9938,530,9277,323,201 ---14,60419,53421,403 -1,834,3372,089,4222,653,6973,185,1634,223,117 5,254,6945,256,6846,549,0131,169,4981,601,3692,031,814 8,815,41311,121,8251,793,35155,26657,44860,372 54,75455,42455,541--465,180----9,52811,32312,725--44,554,52845,315,08644,304,341-----19,442,76827,706,55645,400,563 -(175,833)---$95,718,89687,431,345$92,864,234$120,343,128$151,146,468$158,851,214 $
Changes in Fund Balances, Governmental Funds
(Modified Accrual Basis of Accounting)
Last Ten Fiscal Years (Unaudited)
FiscalYear
Advaloremtaxes,penaltiesandinterest33,294,062$34,445,902$37,688,372$40,484,511 $ Franchisetaxes3,327,7392,955,1142,907,5372,972,143 Municipalsalestaxandmixedbeveragetax30,090,61429,047,28529,968,33130,822,431 Licenses,permitsandfees4,385,0004,590,4774,103,0032,184,965 Chargesforservices1,849,7471,797,6761,909,9221,984,377 Finesandforfeitures1,943,4062,011,1371,969,1802,040,036 Intergovernmentalrevenue90,428128,489100,8992,108,228 Capitalrecoveryfees866,7821,237,552308,095376,004 Investmentincome(losses)490,55171,411118,9562,044,822 Contributions112,409383,732859,19997,644 Miscellaneous672,333528,093544,727481,919
Totalrevenues77,123,07177,196,86880,478,22185,597,080
EXPENDITURES
Generalgovernment8,974,0589,301,7509,608,51611,053,010 Publicsafety16,968,93917,376,31018,520,58819,806,464 Publicworks5,332,4025,483,13119,112,17023,225,431 Cultureandrecreation7,441,3668,456,5268,783,3238,026,149 Promotionofcultureandtourism---Intergovernmental4,478,3124,623,9195,348,4446,045,218 Capitaloutlay21,349,3248,658,0674,800,62712,214,328 Debtservice
Principalretirement14,489,31113,394,60413,258,18512,220,242 Interestandfiscalcharges3,894,5353,796,7404,084,0863,695,048
Totalexpenditures82,928,24771,091,04783,515,93996,285,890
Excess(deficiency)ofrevenues over(under)expenditures(5,805,176)6,105,821(3,037,718)(10,688,810)
OTHERFINANCINGSOURCES(USES)
Saleofproperty3,271--Issuanceoftaxnotespayable---Issuanceofgeneralobligationbonds---Premium(Discount)onissuanceofrefundingbonds--884,928Issuanceofsalestaxrevenuebonds-24,450,0009,945,000Issuanceofrefundingbonds--3,830,000Issuanceoflease---Issuanceofsubscriptions---Premium(Discount)onissuanceofgeneralobligationbonds-2,168,153-Paymenttorefundbondescrowagent--(4,309,151)Transferfromotherfunds21,925,06723,584,60523,332,60223,056,973 Transfertootherfunds(22,156,907)(28,352,005)(24,940,577)(23,345,937) Totalotherfinancingsources(uses)(228,569)21,850,7538,742,802(288,964)
NETCHANGEINFUNDBALANCES
$(6,033,745)27,956,574$5,705,084$(10,977,774) $
Debtserviceasapercentage ofnoncapitalexpenditures29.9%27.5%22.0%18.9%
Source:AnnualComprehensiveFinancialReport
FiscalYear
201920202021202220232024
$41,744,24341,980,391$41,675,661$41,429,872$42,299,595$43,350,717 $ 3,114,1172,811,5732,671,7262,988,8743,656,8953,445,059 31,868,20432,119,11438,461,31243,723,49047,917,15244,830,166 3,161,2282,868,1662,041,1893,071,4282,475,0772,266,949 4,970,9915,013,7695,783,5527,104,8838,234,7108,783,400 1,798,033968,495954,8091,213,211903,685962,141 124,1411,737,849760,6589,974,7951,545,1994,014,451 621,715693,293232,525773,745466,928143,101 3,123,0811,634,30196,183(448,117)7,485,82610,613,238 198,44982,22572,565242,645110,06790,855 341,9341,544,346836,962324,548512,725151,752 91,066,13691,453,52293,587,142110,399,374115,607,859118,651,829 12,988,72413,233,45514,236,00613,493,59415,976,46616,107,327 21,145,35121,534,85822,015,08022,719,90624,066,32225,686,718 5,687,4287,834,5777,177,2058,861,49610,287,2739,003,118 21,815,04313,226,04511,202,60913,118,27814,545,61815,841,400 -----871,217 6,123,9267,214,7986,049,2005,934,5846,454,9816,849,951 8,285,71615,951,42511,521,22311,601,16215,026,03824,681,093
8,385,0599,896,67510,341,2018,645,73710,777,72811,001,476 3,175,7313,108,0142,629,5852,321,8382,436,8392,485,911 87,606,97891,999,84785,172,10986,696,59599,571,265112,528,211
3,459,158(546,325)8,415,03323,702,77916,036,5946,123,618
6,019-27,28852,1244,15643,351 ----13,397,000--3,753,000--1,329,086--8,595,000------10,860,000-1,989,000-----514,16253,975752,937 ----3,031,188377,356 ---737,765-(12,311,639)-(1,954,804)--17,941,26315,937,42414,161,08128,575,10027,129,05524,187,053 (20,662,331)(16,702,479)(14,876,959)(29,714,270)(28,992,586)(25,206,427) (2,837,602)(765,055)3,098,6068,759,88114,622,788154,270 $621,556(1,311,380)$11,513,639$32,462,660$30,659,382$6,277,888 $ 14.6%17.1%17.6%14.6%15.6%15.4%
Assessed Value and Estimated Actual Value of Taxable Property
Last Ten Fiscal Years (Unaudited)
Source:TarrantAppraisalDistrict EstimatedMarketValue
20156,497,726,969615,477,149781,092,3036,332,111,8150.46200
20166,803,420,392543,329,6211,076,075,2236,270,674,7900.46200
20177,728,483,676544,366,9191,405,299,2636,867,551,3320.46200
20188,434,595,190604,366,0091,731,612,4667,307,348,7330.46200
20199,207,076,601616,734,0661,898,185,9637,925,624,7040.44700
20209,875,022,046660,867,2222,044,945,0948,490,944,1740.41000
202110,050,064,169670,131,1582,119,446,4008,600,748,9270.40500
202210,901,930,889656,909,6952,175,862,9279,382,977,6570.39000
202313,402,397,974694,991,0673,692,093,26810,405,295,7730.36000
202416,010,553,069756,859,9205,407,631,09711,359,781,8920.31900
Direct and Overlapping Property Tax Rates (Per $100 of Assessed Value)
Last Ten Fiscal Years (Unaudited)
CityDirectRatesOverlappingRates
20150.342000.120000.462001.400000.2640000.2722000.2278970.149500
20160.362000.100000.462001.395000.2640000.2620000.2278970.149500
20170.362000.100000.462001.390000.2540000.2484100.2278970.144730
20180.362000.100000.462001.385000.2440000.2378100.2244290.140060
20190.357000.090000.447001.380000.2340000.2255700.2244290.136070
20200.330000.080000.410001.300000.2340000.2252800.2244290.130170
20210.330000.075000.405001.286400.2340000.2249900.2244290.130170
20220.325000.065000.390001.268600.2290000.2330900.2244290.130170
20230.295000.065000.360001.218800.2240000.2175430.2244290.130170
20240.264000.055000.319001.002500.1945000.1894850.1945000.112170
Source:TarrantAppraisalDistrict
Principal Property Tax Payers Current Year and Nine Years Ago (Unaudited)
TownSquareVenturesLP296,207,832$2.14%VerizonWirelessTexasLLC172,818,555$2.79% CellcoPartnership120,369,7870.87%TownSquareVenturesLP141,692,7222.29% SCSouthlakeOwnerLLC101,462,5690.73%SLTSGrandAvenue/IILP80,996,3121.31% MCICommunicationsSvcsInc74,217,0060.54%WyndhamPropertiesLtd56,153,0540.91% TDAmeritradeServicesCompanyInc66,500,0000.48%SabreHeadquartersLLC54,803,3830.88% Carroll/1709Ltd57,000,0000.41%Carroll/1709Ltd50,236,8770.81% ExcelSouthlakeLP52,005,1780.38%H&CSouthlakeHiltonLLC45,538,8560.73% 1400PlazaPlaceSouthlakeOwnerLLC44,000,0000.32%InlandWesternSouthlakeCornersLtd31,208,1420.50% BDPSouthlakeDst40,053,7500.29%Cambridge114Inc29,435,9860.47% DSLLandlordIILLC39,928,0000.29%CostcoWholesaleCorporation22,492,5990.36%
Total891,744,122$6.45%Total685,376,486$11.05%
TotalAssessedValuation13,827,523,992100.00%TotalAssessedValuation6,199,833,416100.00%
Source:TarrantAppraisalDistrict
Notes:aTaxpayersareassessedonJanuary1,2023(2023taxyear)forthe2024fiscalyear. bTaxpayersareassessedonJanuary1,2014(2014taxyear)forthe2015fiscalyear.
Ad Valorem Tax Levies and Collections
Last Ten Fiscal Years (Unaudited)
CollectedwithintheFiscalYearofthe
Levy
FiscalYear TaxesLeviedfor
TotalCollections
201527,791,839$27,556,790$99.15106,959$27,663,749$99.54 201628,965,79228,684,13199.03170,05028,854,18199.61 201731,410,93431,054,00698.8695,75631,149,76299.17 201833,358,42932,975,60098.8566,11033,041,71099.05 201934,957,51934,486,82098.6513,59734,500,41798.69 202034,109,14133,572,46998.4391,51733,663,98698.69 202134,329,45733,833,65298.56(85,475)33,748,17798.31 202234,526,16834,013,77198.52(73,798)33,939,97398.30 202334,929,24734,409,84898.51(52,121)34,357,72798.36 202435,165,80934,649,63398.53-34,649,63398.53
Source:TarrantCountyTaxOffice
Ratios of Outstanding Debt by Type Last Ten Fiscal Years (Unaudited)
FiscalYear
201540,847,36333,182,85525,540,000---201640,733,28229,511,90548,330,000---201739,022,93318,706,52557,207,643---201830,112,18711,050,00053,605,000---201940,949,9006,606,48644,592,458---202033,224,1486,172,10941,767,697---202127,428,3383,782,83338,832,9363,753,000--202222,757,70112,783,18035,788,1752,686,000405,368338,051-202317,925,53610,953,00832,648,41515,420,000308,329448,9042,165,395 202412,933,8459,282,83429,383,65314,751,000208,476813,5191,817,561 FiscalYear
201515,422,27030,035,860-750,000-99,570,2189.035,238 201612,974,23229,143,202-385,000-118,575,1879.305,694 201713,846,42228,963,708---114,937,1018.085,358 20189,187,81330,550,000---94,767,1876.144,547 201914,816,09722,463,654---92,148,8446.014,270 202012,678,79821,352,753---81,163,9545.293,793 202112,916,02518,217,805---73,797,1074.843,363 202211,319,35717,193,400---74,758,4754.123,271 20239,676,21616,128,995---79,869,5874.093,305 20248,020,27126,098,698-34,05269,190,8882.002,137
Note:DetailsregardingtheCity'soutstandingdebtcanbefoundinthenotestothefinancialstatements. aSeeTable13forpersonalincomeandpopulationdata.
Ratios of General Bonded Debt Outstanding Last Ten Fiscal Years (Unaudited)
GeneralBondedDebtOutstanding
FiscalYear General Obligation Bonds Certificatesof ObligationTotal
Less:Available DebtService Funds NetGeneral BondedDebt Percentageof ActualTaxable Valueof PropertyaPerCapitab
201556,269,63363,218,715119,488,3488,735,479110,752,8691.79%3,979 201653,707,51458,655,107112,362,6216,899,109105,463,5121.72%3,728 201752,869,35547,670,233100,539,5887,444,51293,095,0761.38%3,162 201839,300,00041,600,00080,900,0007,345,62273,554,3781.03%2,487 201955,765,99729,070,14084,836,1378,009,33376,826,8040.99%2,535 202045,902,94627,524,86273,427,8086,774,15366,653,6550.80%2,195 202140,344,36322,000,63862,345,0015,315,36757,029,6340.68%1,828 202234,077,05829,976,58064,053,6385,436,57458,617,0640.64%1,857 202327,601,75227,082,00354,683,7555,256,90249,426,8530.50%1,710 202420,954,11635,381,53556,335,6514,776,36651,559,2850.41%1,740
Note:Detailsregardingthecity'soutstandingdebtcanbefoundinthenotestothefinancialstatements. aSeeTable5forpropertyvaluedata. bSeeTable13forpopulationdata.
Direct and Overlapping Governmental Activities Debt
As of September 30, 2024 (Unaudited)
Debtrepaidwithpropertytaxes
CarrollISD269,520,000$84.72%228,337,344 $
DentonCounty673,670,0000.18%1,212,606 $
Grapevine-ColleyvilleISD272,665,6591.52%4,144,518 $
KellerISD736,234,9892.43%17,890,510 $
NorthwestISD2,280,247,5691.04%23,714,575 $
TarrantCounty345,130,0003.86%13,322,018 $
TarrantCountyCollegeDistrict569,915,0003.86%21,998,719 $
TarrantCountyHospitalDistrict440,020,0003.86%16,984,772 $
Subtotal,overlappingdebt327,605,062
$396,795,758
Source:MunicipalAdvisoryCouncilofTexas.
Note:IncludesonlydebtoftheCity'sgovernmentalactivities.
Note:PertheMunicipalAdvisoryCouncilofTexas,theoverlappingpercentagesarecalculatedby determiningtheestimatedshareassessedvaluationoftaxablepropertywithintheoverlapping taxingbodiesandtheCity,andthendividingthatsharevaluebythetotalassessedvalueof taxablepropertywithintheoverlappingtaxbody.
CityofSouthlake,Texas
Pledged-Revenue Coverage – Southlake Parks Development Corporation
Last Ten Fiscal Years (Unaudited)
SouthlakeParksDevelopmentCorporation-SalesTaxRevenueRefundingBonds
DebtService
FiscalYearSalesTaxCollectionsPrincipalInterest
TotalAnnual RequirementaTimesCoverage
20157,440,7261,120,000463,2001,583,2004.70
20167,318,4901,150,000429,1501,579,1504.63
20177,578,4461,190,000394,0501,584,0504.78
20187,705,0091,225,000357,8251,582,8254.87
20197,741,0051,260,000320,5501,580,5504.90
20207,908,6011,300,000282,1501,582,1505.00
20219,249,9301,340,000242,5501,582,5505.84
202210,610,9931,385,000201,6751,586,6756.69
202312,829,1961,415,000159,6751,574,6758.15
202410,661,7251,460,000116,5501,576,5506.76
Note:aIncludesPrincipalandInterest
Pledged-Revenue Coverage – Southlake Community Enhancement and Development Corporation
Last Ten Fiscal Years (Unaudited)
FiscalYearSalesTaxCollectionsPrincipalInterest
TotalAnnual RequirementaTimesCoverage
2016(1)5,421,104$-$-$-$20175,613,664-869,749869,7496.45
20185,707,4141,190,0001,252,2392,442,2392.34
20195,734,0781,280,0001,163,4062,443,4062.35
20205,858,2231,340,0001,102,4062,442,4062.40 20216,851,8001,410,0001,033,6562,443,6562.80 20227,859,9951,475,000968,0562,443,0563.22 20238,463,8321,540,000899,2062,439,2063.47 20247,897,5741,620,000822,5562,442,5563.23
Note:aIncludesPrincipalandInterest
Thiswastheyearofissuance.Accordingly,noprincipalorinterestpaymentswerescheduledinthisyear,andnodebtwas outstandingintheprevious2yearsthatwassecuredbypledgedrevenue.
Demographic and Economic Statistics
Last Ten Calendar Years (Unaudited)
FiscalYearEstimatedPopulationaPersonalIncome
PerCapitaPersonal IncomeSchoolEnrollmentcUnemploymentRated
201527,8331,613,952,17157,9877,8843.5% 201628,2901,732,875,66061,2548,1773.5%
201729,4401,951,901,44066,3018,1903.0%
201829,5802,189,038,32074,0048,3413.2%
201930,3102,151,828,14070,9948,3442.7% 202030,3702,177,863,07071,7118,5095.2%
202131,1992,169,765,65469,5468,3183.6%
202231,5692,506,862,72179,4098,3823.0% 202331,9752,585,284,27580,8538,3183.6%
202432,3763,453,868,176106,6808,2923.6%
Note:aCityofSouthlakeEconomicDevelopment bCarrollIndependentSchoolDistrict cTexasWorkforceCommission
Principal Employers Current Year and Nine Years Ago (Unaudited)
Full-time Equivalent City Government Employees by Function/Program Last Ten Fiscal Years (Unaudited)
Source:CityBudget
Operations Indicators by Function/Program
Last Ten Fiscal Years
(Unaudited)
FiscalYear
Function/Program2015201620172018201920202021202220232024
PublicSafety Police
Numberofemployees68686768727272727676
Numberofviolations(citations)16,24115,00313,84013,49213,7599,0958,2309,5517,3428,582 Numberofarrests1,0955131,1481,0277191,025838640324367 Numberofalarmcalls3,4973,6733,2843,4343,1712,4652,5498931,4691,523 Fire
Numberofemployees72737373737373737474 Numberoffireruns1,2207608078117489991,036834894940 NumberofEMSruns1,4481,7451,8081,8021,8751,5171,9942,2562,4182,423 Numberofhazardousmaterialsruns439510510990949211193151 Numberofalarmcalls501608652651678602748659590598
DevelopmentServices
Streetsmaintained(miles)204209199211213214214214217217 Streetscracksealed(blocks)N/AN/A75391384506800 Roadwaysignagereplaced/installedN/A568N/A2113613132128137165 Asphaltrepairs(tons)4,8494,6676,6715,1916,1002137,747151250375 Concreterepairstoroads/sidewalks(cu.yds.)2,4213081,4621,188503411,26911715
Right-of-waymaintenance(miles)N/AN/A541741755855729
BuildingpermitsIssueda2,9792,7033,1633,4533,1332,8343,2093,3722,9902,827 Planning&zoningcasesheard136190100110766282536577
CulturalandRecreational
ParksandRecreation
Parkmaintain&operateperacre1,2001,1061,1061,1061,1061,1065615615611,139 Participantsinleisureserviceprograms6,2008,6878,7359,84417,5558,0657,36013,01025,00022,790 Participantsinspecialevents60,00066,00072,62571,40065,00090036,30044,00048,00054,700 Participantsinseniorcenterprograms4,9008,86813,44913,55214,0684,9896,3906,6918,66310,219
Library
Volumesincollection44,97145,41644,89943,94741,78943,69941,89542,60742,03442,533 Patrons16,83813,46113,76414,32715,26713,27414,46715,44617,05415,450
WaterandSewer
Numberofwaterconsumers10,18310,58110,94111,00911,13311,23611,34911,46111,52811,598 Numberofseweraccounts8,1678,4708,8899,11111,8869,0539,1429,2299,3199,387 Lineinspections(feet)1,086,624789,266687,246574,136641,941377,081214,789141,503189,370409,254 Watermetersinstalled/repaired/replaced1,28410,5661351912791863594,099.0010294 Transmittersinstalled/replacedN/A10,5664891241134661,3277,891.006,666203 GallonspurchasedfromFt.Worth(millions)3,069,9712,904,0483,206,3633,156,0192,762,2273,013,8013,057,8253,914,8783,805,8743,527,876 Gallonsdistributed(millions)2,870,4302,935,8182,900,9263,229,4382,363,5422,957,5822,731,6973,569,0903,539,8103,371,031 Maximumstoragecapacity(millionofgallons)21212121212121212121
Source:CityDepartments
Notes:N/ADatanotavailable aIncludesresidential,commercial,andmiscellaneous(e.g.pools,fences)permits.
CityofSouthlake,Texas
Capital Asset Statistics by Function/Program
Last Ten Fiscal Years (Unaudited)
FiscalYear
CulturalandRecreational
WaterandSewer
WaterMains(miles)285290284298301304293294296304 LiftStations1313141515159131313
SanitarySewerMains(miles)206209212216218220220222223224 Drainage,ditches/creeks(miles)36364852515142515151
Firehydrants2,5942,6432,7232,7742,8092,8542,9192,9382,9733,017 WatervalvesN/A7,1547,3607,5537,6737,8188,0238,1048,2128,309
Source:CityDepartments
Note:N/A-Datanotavailable aIn-linehockeyrinkconvertedtoturffieldin2020.