40 Highway Corridor and Focus Area Plan
Mid America Regional Council Creating Sustainable Places
Jackson County, Missouri
September 2013
and design for public and private clients.
throughout all of our projects. Vireo employs a variety of planning and design professionals in Landscape Architecture, Community Planning, Natural Resource Planning and Graphic Design.
This document provides the story of the design analysis, definition and discoveries that led to planning solutions and conclusions. It is intended for use in presenting the vision for the 40 Highway Corridor and the nodes identified for redevelopment, to attract the interest of investors and to serve as the foundation for the next phases of the design process.
Prepared for:
Patti Banks, co-Owner, was the first LEED (Leadership in Energy and Environmental Design) accredited Landscape Architect in Kansas City and the firm now has a number of professionals that are LEED accredited.
Mid-America Regional Council

Employees by Discipline:
600 Broadway, Suite 200 Kansas City, MO 64105 816-474-4240
www.marc.org
Kansas City, Missiouri 414 E. 12th St Kansas City, MO 64106 www.kcmo.org
•
Administrative - 2
•
Ecologists - 3
Consultant Team: Lead Consultant, Planning, Market and Economic Analysis
downtown Kansas City, Missouri (20 staff) and Omaha, and has completed over 1,100 contracts during the existence. business of planning and building enduring, quality places. designs to a sustainable, ecologically sound foundation. experience that ranges from policy development and master analysis, design, construction, and implementation integrate policy, design and development at all levels. includes natural resource planning, transit supportive planning; traditional neighborhood design; urban and park and trail planning; environmentally sensitive site process management and project management. include regional planning councils, counties, cities, private developers. The firm’s work centers on region of Missouri, Kansas, Nebraska, and Iowa; and surrounding states. Women’s Business Enterprise.
RAIL AND CORRIDOR PLANNING
City of Independence

111 E. Maple Independence, MO 64050 www.kcmo.org
Planners - 6 •
•
Landscape Architects - 11
1390 Lawrence Street, Suite 200 Denver, Colorado 80204 303.623.5186
Nelson\Nygaard knows that successful rail and corridor planning goes beyond engineering. Using our expertise in system operations and different transit technologies, we will recommend the best mode for the corridor, anticipate operational problems, and quantify tradeoffs and successes so our clients achieve larger community goals through transit.
Developing Performance Measures
City of Lee’s Summit
220 SE Green
www.designworkshop.com
Transportation Planning and Engineering
116 New Montgomery Street Suite 500
San Francisco, CA 94105
www.nelsonnygaard.com
Patti Banks Associates + Community ReDesigned
929 Walnut, Suite 700 (816) 756-5690
Public Outreach and Planning 929 Walnut
Federal ID: 43-171-4841
Lee’s Summit, MO 64063
http://cityofls.net
City of Blue Springs
903 West Main Street
Nelson\Nygaard begins the planning process by working with clients to clarify their priorities and define success in transit terms. We develop performance tools that can calculate, in quantiative terms, the Return on Investment (ROI) for qualitative community goals such as economic development, livability, community character and social justice.
Patti@BeVireo.com
Suite 700
Kansas City, MO 64106
www.bevireo.com

Civil Engineering
Burns & McDonnell
9400 Ward Parkway
Kansas City, MO 64114
www.burnsmcd.com
Blue Springs, MO 64015
www.bluespringsgov.com

Technology Selection
The most crucial step in rail planning is determining the technology that will best serve the community. With years of experience with light rail, heavy rail, commuter rail, streetcar and BRT systems, Nelson\Nygaard will outline the neces-
consulting firm whose work focuses on public participatory based planning
public education and participation
Acknowledgements:
Mid-America Regional Council
Dean Katterndahl, Program Director
Dave Knopick, Project Manager
Jeff Hirt, Project Manager
Steering Committee:
Gerald Williams, Kansas City, Missouri
Scott Allen, City of Blue Springs
Jim Holley, City of Blue Springs
Tom Scannell, City of Independence
Jennifer Clark, City of Independence
Heping Zhan, City of Lee’s Summit
Damon Daniel, Communities Creating Opportunity (CCO)
Lora McDonald, Metro Organization for Racial and Economic Equity (MORE2)
| v Contents PrOjECT InTrOduCTIOn ..................................................................................................................... 1 Project Context and Scope. . . . . . . . . . . . . . . . . . . . . . . . . . . . . . . . . . . . . . . . . . . . . . . . . . . . . . . . .2 Previous Studies and Plans ....................................................... 7 MArKET & ECOnOMIC SCAn.............................................................................................................. 13 Overall Corridor Economic Position ................................................. 14 Psychographic Analysis 21 EXISTInG COndITIOnS ........................................................................................................................ 39 Local and Regional Context of 40 Highway and Key Focus Areas ......................... 40 Zoning and Land Use 43 Transportation and Mobility ....................................................... 45 Auto Traffic and Circulation 52 COMMunITY EnGAGEMEnT................................................................................................................ 55 rECOMMEndATIOnS ........................................................................................................................... 65 Transportation and Corridor Design 66 Creation of Development Centers .................................................. 88 Corridor Wide Strategies 96 Land Use / Redevelopment Recommendations by Focus Area ........................... 106 31st and Prospect .................................................................. 10 6 Blue Ridge Cutoff and 40 Highway Overview ............................................. 110 Noland Road and 40 Highway Overview 114 Adams Dairy Parkway and 40 Highway Overview 118 IMPLEMEnTATIOn STrATEGIES ....................................................................................................... 123
PROJECT INTRODUCTION
Project Introduction | 1 1
Introduction
Project Context and Scope
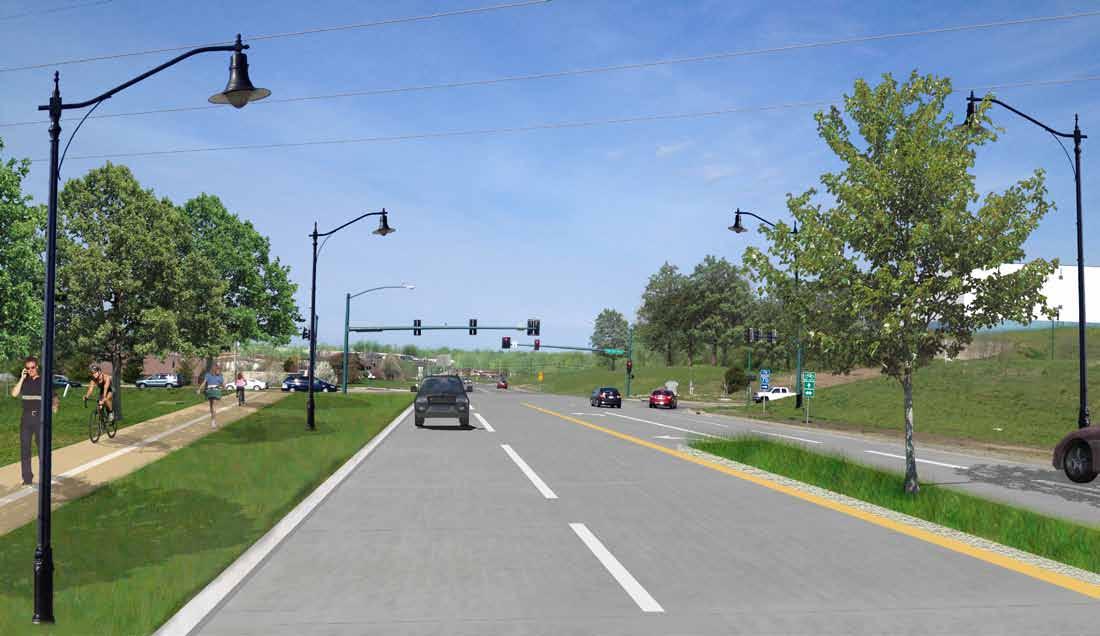
The US 40 Highway Corridor (40 Highway Corridor) is one of six corridors selected for the Mid-America Regional Council’s (MARC) Creating Sustainable Places (CSP) Initiative. CSP is a regional effort to create a vision for sustainable development in the Kansas City area that aims to initiate a dialogue and ongoing planning strategies to reposition six corridors as vibrant, connected, and “green” districts. The planning studies will provide recommendations to strengthen older neighborhoods and establish distinct districts that will stand the test of time and represent “great places” that support transit oriented development.
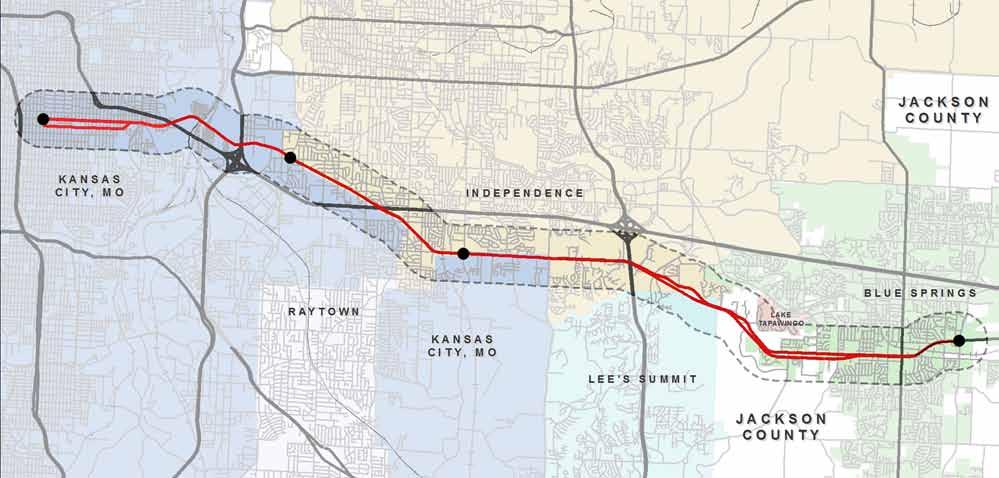
The planning effort is being led by MARC, in conjunction with the cities of Kansas City, Independence, Lee’s Summit, and Blue Springs, Missouri to create a vision for the US 40 Highway Corridor in Jackson County. The corridor study area follows 31st Street (formerly known as 40 Highway) from Bruce R. Watkins Parkway east to I-70, and US 40 Highway from I-70 in Kansas City to Adams Dairy Parkway in Blue Springs. The corridor traverses through Kansas City, Independence, Blue Springs, Lee’s Summit, Lake Tapawingo, Grain Valley and unincorporated Jackson County.
The objective of the 40 Highway Study is twofold. The first objective is to discuss with community members and stakeholders ideas for the future of the corridor. The study looked at corridor-wide elements related to transportation planning, particularly related to transit, biking and walking, aesthetics, environmental and economic considerations, and potential future land uses. The study aims to begin a dialogue with adjacent communities along 40 Highway regarding the role of corridor in the local area as a key transportation connection between suburban areas and the regional city center of Kansas City. The plan looks at how future improvements and development strategies can help maximize economic opportunities, connectivity and livability along the corridor.
The second objective of the study is to develop a vision for the future development and evolution of four key focus areas or “nodes” which have been identified by MARC at key intersections along the corridor, including:
• 31st and Prospect, Kansas City
• 40 Highway and Blue Ridge Cutoff, Kansas City / Independence
• 40 Highway and Noland Road, Kansas City / Independence
• 40 Highway and Adams Dairy Parkway, Blue Springs
The study provides recommendations for how development and public investment may proceed within a half-mile radius of each node and provides a foundation for the adjacent communities to continue detailed planning and implementation.
Highway 40 Corridor Plan | Focus Area Plans 2 | Project Introduction
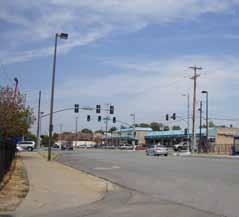
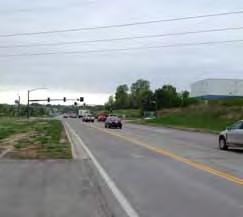
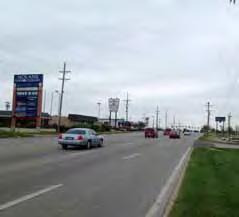
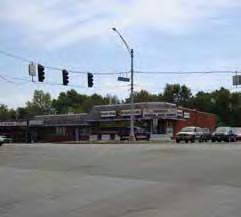


Project Introduction | 3 31st Street & Prospect Ave (Looking north) 40 Highway & Adams Dairy Parkway (Looking west) 40 Highway & Noland Rd (Looking east) 40 Highway & Blue Ridge Cutoff (Looking south west) 1 2 3 4 1 2 3 4 31ST Street n ol and r o ad Adams d a iry Pky Linwood Blvd Blue r i dge Cutoff 470 40 7 435 40 71 350
Background: Creating Sustainable Places
In 2010, MARC received a grant from the US Department of Housing and Urban Development to implement a plan for sustainable development for the bi-state Kansas City Region. The 40 Highway plan is a part of the Creating Sustainable Places (CSP) initiative which has grown out of MARC’s Transportation Outlook 2040. The 40 Highway Corridor is one of six key transportation corridors chosen for more detailed planning, in addition to creating technical tools and resources for sustainable development and implementation. The US 40 Highway, along with four other corridors, received Tiger I grant funding for investments in Bus Rapid Transit (BRT) and other improved transit infrastructure.
Transit Oriented Development
The CSP effort also seeks to provide examples and create strategies to promote Transit Oriented Development (TOD). These types of projects involve a variety of land uses situated around transit stations or “centers” that service rail or bus systems connecting other communities. Stakeholders have worked to identify strategies to orient new development around or in conjunction with transit systems around the Kansas City region. Well-planned TOD results in greater ridership on transit systems, reduces dependence on vehicular travel, enhances mobility for various segments of the population, and helps to attract new businesses, while promoting overall economic development. Providing mixed uses and housing choices promotes diversity and can better accommodate the changing needs of communities. Existing and future residents will have more opportunities to find housing that is suitable for each stage of their life within the same community.
Highway 40 Corridor Plan | Focus Area Plans 4 | Project Introduction
Creating Sustainable Places Focus Corridors
Complete Streets
In addition to promoting the creation of great districts and places along these corridors, the CSP effort seeks to create truly “Complete Streets” along these corridors. The key principles of Great Streets include:
• Complete Streets reflect the neighborhoods through which they pass and have a scale and design appropriate to the character of abutting properties and land uses.
• A Complete Street corridor is designed and furnished to accommodate pedestrians. Complete Streets allow people to walk comfortably and safely. The relationship between the street and adjacent buildings is conducive to all modes of transport and inviting to people.
• Complete Streets contribute to the economic vitality of the local community. Complete Streets promote commerce and the economic health of a place. They serve as destinations, not just as transportation facilities. They provide desirable commercial addresses and locational value to businesses that help to power local economies.
• Complete Streets are functionally complete and effectively serve multiple modes of travel. Both mobility and safety are provided with convenient travel for automobiles, pedestrians, bicycles and transit. Complete Streets provide a balanced level of service (LOS) that accounts for all modes, in contrast to conventional transportation planning that prioritizes vehicular efficiency.
• Complete Streets facilitate placemaking. Complete streets incorporate and complement places that are memorable and interesting. These may include plazas, pocket parks, attractive intersections and corners, or improved sidewalks that foster an active street life.
• Complete Streets are “green”. Complete Streets incorporate environmentally sensitive design standards and development techniques including the generous provision of street trees and other plantings and the application of low impact stormwater management techniques.
The Challenge:
US 40 Highway travels from the urban area of Kansas City to the suburban and exurban areas to the east. The eastern segments of the corridor have seen recent investments spurred by the growth of suburban areas. However, a vast majority of the corridor is characterized by aging and under-performing retail where empty store fronts and parking lots dominate the landscape in conjunction with industrial and residential properties. The corridor is in need of a clear, market-sensitive strategy that will guide investments and decisions to create a more sustainable corridor.
The purpose of this project is to better understand what strategies are needed to strike a balance between the economic realities of redevelopment and regional and local sustainability goals and objectives.
Project Introduction | 5
Project Goals
As a result of various past and current planning efforts along the 40 Highway Corridor, various transportation goals and priorities have been developed for the study area. These include the following:
• Promoting sustainable development via targeted transportation improvements and investments along the regional 40 Highway Corridor and across jurisdictional boundaries.
• Leveling the playing field for all modes of transportation and improving safety and comfort for all users of the corridor through the creation of more complete streets.
• Identifying priorities for revitalization and creating economically viable, sustainable development and redevelopment opportunities which respond to economic realities and accommodate the wide range of existing development patterns (urban, industrial, low density suburban, exurban).
These priorities form an important part of the existing conditions analysis, and will shape the recommendations of the subsequent Corridor Plan effort.
Vision:
This plan seeks to advance the regional vision to develop a more sustainable corridor that supports a series of transit oriented development nodes that are connected by a multi-modal corridor that supports bikes and pedestrians in addition to vehicles and transit. Each node will function uniquely in relationship to the overall corridor, based upon the local characteristics of surrounding neighborhoods. The corridor should become a model for the region in which land use, transportation, and environmental considerations are integrated to create a thriving destination that can attract new growth and bolster local economies.
The study also identifies implementation strategies to guide future transportation and land use decisions for the corridor. While this study does not constitute a detailed corridor study encompassing the entire length of 40 Highway, it is a first step towards creating a unified vision for the corridor, shared by the communities as well as outlining tools to support a more vibrant, connected, and green corridor. This study examines the current conditions along 40 Highway, captures community input regarding the future of the corridor and the focus areas, and ultimately provides a vision for the future.
Guiding Principles:
1. The vision and recommendations for 40 Highway must strengthen businesses along the corridor and improve the economic position of the communities through the presentation of realistic concepts and ideas, appropriate to the local context.
2. The recommendations for the corridor and the four focus areas should create quality, pedestrian and bike friendly, and aesthetically pleasing environments.
3. The planning effort must have political and community support and produce concepts that are implementable.
4. The effort must illustrate the ideas and concepts of “Complete Streets” and inform ongoing planning and design for the coordinated development of the entire corridor.
Highway 40 Corridor Plan | Focus Area Plans 6 | Project Introduction
Previous Studies and Plans
Kansas State University Study: Retrofit 40 Summer Planning and Design Studio (Summer 2012):


A group of 17 landscape architecture students from Kansas State University, led by two professors, conducted an eight week summer studio program during June and July of 2012 to examine the 40 Highway Corridor and create ideas and concepts to revitalize and redevelop the corridor and its various intersections in a sustainable way.
Some key findings from the K State summer program included the following:
• Encouraging additional residential development along the corridor would help regenerate the various communities along the corridor and provide the foundation for additional commercial (retail) development along 40 Highway.

• The numerous streams and watersheds that cross 40 Highway provide great opportunities to enhance open space connections, encourage the use of community gardens and the local production of food, and to enhance the overall natural environment in the various communities.
• Several key focus areas along the corridorincluding the 31st and Prospect area, the Truman Sports Complex, and the Missouri Innovation Park in Blue Springs – provide the foundation for key redevelopment areas.


• The entire corridor may represent an opportunity for future transit lines connecting Downtown Kansas City with communities to the east in Jackson County.
The consultant team used some of the research from the Kansas State program in its initial analysis of the 40 Highway Corridor.
From initial mappings, we were able to identify a number of important nodes for development. We looked beyond the US 40 Corridor boundaries when identifying


Project Introduction | 7
HOWARD HAHN BLAKE BELANGER RETROFIT 40 KANSAS STATE UNIVERSITY LANDSCAPE ARCHTIECTURE REGIONAL AND COMMUNITY PLANNING RETROFIT 40 Research, Strategic Planning, and Design for Reinvisioning the US 40 Corridor Landscape Architecture Community Planning and Design Studio 40 40 I-70 I-70 I-70 I-70 71 71 71 I-435 I-470 291 291 7 7 7 24 24 24 78 78 350 350
VISIONARY CONCEPT PLAN I-70 I-70 I-435 24 78 350 350 Primary Node Secondary Node Tertiary Node Minor Node Primary Connection: Proposed LRT Priamry Connection: Proposed LRT and Metrogreen Secondary Connections Expanded Ecological Corridor Existing Metrogreen Routes Rivers Major Highways Existing Razil Lines From our initial mappings we were able to identify number of important nodes for development. These nodes were not just limited by the corridor boundaries, therefore we were able expand our proposal to include connections to adjacent communities. Each of the proposed primary nodes are intended to be major employment nodes, activity centers, and transit hubs. These nodes would also be areas of increased density along the corridor. Each level of nodes, down to minor nodes, would include the same development goals as the primary nodes, but in decreasing scale. The overal goal to create not simply a linear corridor but web of interconnected nodes and linkages that can begin to create new set of districts and identitiis within this area. Primary LRT and metrogreen connections are proposed to connect the major nodes where there no existing rail lines or metrogreen routes. Minor transit connections are proposed to link all surrounding nodes in order to create variety of options for pedestrians to travel within the area. Another major component of our visionary strategy is the expansion of exsiting ecological corridors on site. Two rivers cut through the corridor, and our intent to improve and expand these corridors in order to create healthier ecological system and also to create green amenity for surroundign development. Strategic Visionary Plan Raytown Node Independence Node Commercial/ Transit Node Commercial/ Transit Node 40 I-70 I-435 24 350 Tertiary Node Minor Node Primary Connection: Proposed LRT Priamry Connection: Proposed LRT and Metrogreen Secondary Connections Expanded Ecological Corridor Existing Metrogreen Routes Rivers Major Highways From our initial mappings we were able to identify number of important nodes for development. These nodes were not just limited by the corridor boundaries, therefore we were able expand our proposal to include connections to adjacent communities. Each of the proposed primary nodes are intended to be major employment nodes, activity centers, and transit hubs. These nodes would also be areas of increased density along the corridor. Each level of nodes, down to minor nodes, would include the same development goals as the primary nodes, but decreasing scale. The overal goal to create not simply linear corridor but web of interconnected nodes and linkages that can begin to create new set districts and identitiis within this area. Primary LRT and metrogreen connections are proposed to connect the major nodes where there is no existing rail lines or metrogreen routes. Minor transit connections are proposed to link all surrounding nodes in order create variety of options for pedestrians to travel within the area. Another major component of our visionary strategy the expansion of exsiting ecological corridors on site. Two rivers cut through the corridor, and is our intent to improve and expand these corridors order to create healthier ecological system and also to create green amenity for surroundign development. Strategic Visionary Plan Entertainment Node Community Node Innovation/ Research Node Kansas City/ Union Station Node Kansas CIty Zoo Node Noland Independence Center Node Blue Springs Node Educational/ Research Node Node Independence Node Node Legend: Primary Connection: LRT Connection Primary Connection: LRT and MetroGreen Secondary Connections Tertiary Node Expanded Ecological Corridor Existing MetroGreen Routes Minor Node Rivers Major Highways Existing Rail Lines I-70 I-70 I-70 I-435 24 78 350 350 Primary Node Secondary Node Tertiary Node Minor Node Primary Connection: Proposed LRT Priamry Connection: Proposed LRT and Metrogreen Secondary Connections Expanded Ecological Corridor Existing Metrogreen Routes Rivers Major Highways Existing Razil Lines From our initial mappings we were able to identify number of important nodes for development. These nodes were not just limited by the corridor boundaries, therefore we were able expand our proposal to include connections to adjacent communities. Each of the proposed primary nodes are intended to be major employment nodes, activity centers, and transit hubs. These nodes would also be areas of increased density along the corridor. Each level of nodes, down to minor nodes, would include the same development goals as the primary nodes, but in decreasing scale. The overal goal to create not simply a linear corridor but web of interconnected nodes and linkages that can begin to create new set of districts and identitiis within this area. Primary LRT and metrogreen connections are proposed to connect the major nodes where there no existing rail lines or metrogreen routes. Minor transit connections are proposed to link all surrounding nodes in order to create variety of options for pedestrians to travel within the area. Another major component of our visionary strategy is the expansion of exsiting ecological corridors on site. Two rivers cut through the corridor, and our intent to improve and expand these corridors in order to create healthier ecological system and also to create green amenity for surroundign development. Strategic Visionary Plan Raytown Node Independence Node Commercial/ Transit Node Commercial/ Transit Node 40 71 24 350 Primary Node Secondary Node Tertiary Node Minor Node Primary Connection: Proposed LRT Priamry Connection: Proposed LRT and Metrogreen Secondary Connections Expanded Ecological Corridor Existing Metrogreen Routes Rivers Major Highways Existing Razil Lines From our initial mappings we were able to identify number of important nodes for development. These nodes were not just limited by the corridor boundaries, therefore we were able expand our proposal to include connections to adjacent communities. Each of the proposed primary nodes are intended to be major employment nodes, activity centers, and transit hubs. These nodes would also be areas of increased density along the corridor. Each of nodes, down to minor nodes, would include the same development as the primary nodes, but in decreasing scale. The overal goal to create not simply linear corridor but web of interconnected nodes and linkages that can begin to create a new set of districts and identitiis within this area. Primary LRT and metrogreen connections are proposed to connect the major nodes where there is no existing rail lines or metrogreen routes. Minor transit connections are proposed to link all surrounding nodes in order to create a variety of options for pedestrians to travel within the area. Another major component of our visionary strategy is the expansion of exsiting ecological corridors on site. Two rivers cut through the corridor, and it our intent to improve and expand these corridors in order to create healthier ecological system and also to create green amenity for surroundign development. Strategic Visionary Plan Raytown Independence Commercial/ Node Commercial/ Node I-70 I-70 I-70 71 24 350 Primary Node Secondary Node Priamry Connection: Proposed LRT and Metrogreen Secondary Connections Existing Metrogreen Routes Rivers Existing Razil Lines From our initial mappings we were able to identify number of important nodes for development. These nodes were not limited by the corridor boundaries, therefore we were able expand our proposal to include connections to adjaand transit hubs. These nodes would also be areas of inoveral goal to create not simply linear corridor but web of interconnected nodes and linkages that can begin to create a new set of districts and identitiis within this area. Primary LRT and metrogreen connections are proposed to connect the major nodes where there is no existing rail lines or metrogreen routes. Minor transit connections are proexpand these corridors in order to create healthier ecologisystem and also to create green amenity for surroundign development. Strategic Visionary Plan Entertainment Node Community Node Innovation/ Research Node Kansas City/ Union Station Node Kansas CIty Zoo Node Noland Node Independence Center Node Lake/ Recreation Blue Springs Node Educational/ Research Node Node Node Independence Node Transit Node Transit Node
Figure 2.1.6 Visionary Concept Plan (Butler, Mannix-Slobig, Patterson, 2012) Union Station Kansas City Connection Node Entertainment Stadium Node Missouri Innovation Park Research Node
include the same development goals but at an smaller, more appropriate scale. The overall goal is to create not simply a linear corridor, but a web of Recreation Node Commercial Industry Node Independence Node Noland Node Kansas City Zoo Node
in order to create a variety of options for pedestrians to travel within the area. Another major component of our visionary strategy is the expansion of Lake District Node
Blue Springs Node
Independence Center Node
Community Node Education/ Research Node Commercial Node Raytown Node Lee Summit Node
BlueRiver Little Blue River N 0.512 4 miles Nodes Not To Scale
Example of Analysis Boards from the K-State Summer Design Studio
regional Plans
Smart Moves (2008 Update)
Mid America Regional Council, in conjunction with a consortium of communities and organizations in the metropolitan area, originally developed the Smart Moves document in 2002 to describe how transit should serve the Kansas City area in coming decades, with an update provided in 2008. Smart Moves proposed a primarily bus-based system that would increase transit service in the region to a level comparable with transit service in peer cities in the nation. Smart Moves builds on previous plans and studies and incorporated community input from throughout the metropolitan area. The vision articulated in Smart Moves expands current transit routes and facilities, and recommends existing and new service types, vehicles and facilities to meet local and regional needs.
The Smart Moves vision document identifies the 40 Highway / I-70 corridor, as a “Major Fixed Route” for future higher-intensity bus service to serve the heavy commuter traffic for people accessing employment in downtown Kansas City, the Norhtland and Johnson County.
The Jackson County Commuter Corridor Alternatives Analysis (August 2012)
A transit alternatives analysis for Jackson County has been developed concurrent to this planning process as part of the Smart Moves transportation study for the 40 Highway Corridor. It emphasizes the need for a revitalization strategy to establish a new identity for the corridor that is in line with the goals for walkable and active nodes. The study evaluated Diesel Multiple Unit (DMU) and Enhanced Bus Service along the I-70 / 40 Highway Corridor.
Highway 40 Corridor Plan | Focus Area Plans 8 | Project Introduction 40 PLEASANT HILL GRAIN VALLEY Independence Ave. Tr uman Rd. Shawnee Msn Pkwy Wo r nall Rock Island line Prospect State Ave. Tr oos t Linwood Metcalf 23r d Lee ’s Summit Rd Noland Rd Blue RIdge Rd. 95th / Bannister Gr andview Rd VILLAGE WEST SHAWNEE K-7 DOWNTOWN KCK INDIAN SPRINGS MISSION COLLEGE BLVD OLATHE GARDNER LENEXA GLADSTONE NORTH KANSAS CITY DOWNTOWN TRUMAN LIBRARY TRUMAN SPORTS COMPLEX PLAZA WALDO INDEPENDENCE SQUARE BLUE RIVER COMM COLLEGE BLUE SPRINGS RAYTOWN LEE’S SUMMIT THREE TRAILS BELTON GRANDVIEW 119th Major fixed-route service Commuter service Urban service LEGEND Local service Activity nodes Arterial transit corridors FIGure 6: Jackson and cass counties with Major local transit corridors Shawnee Msn Pkwy Wo r nall Prospect Tr oos t Linwood Metcalf 23r d Blue RIdge Rd. 95th Gr andview Rd . VILLAGE SHAWNEE K-7 DOWNTOWN INDIAN MISSION COLLEGE BLVD OLATHE GARDNER LENEXA TRUMAN PLAZA WALDO THREE TRAILS BELTON GRANDVIEW 119th Major fixed-route service Commuter service Urban service LEGEND Local service Activity nodes Arterial transit corridors www.marc.org/kcsmartmoves
Jackson and Cass Counties with major Local Transit Corridors
As part of the planning process the analysis looked at the following nodes and transit opportunities:
• I -70 has the potential to develop as a Diesel Multiple Unit (DMU) corridor to facilitate transportation to downtown Kansas City.
• Proposed BRT / Enhanced Streetcar within portions of the 40 Highway right-of-way for the East Line through Jackson County.
• Regional Rail serving Truman Sports Complex
• BRT / Enhanced Streetcar Station development at Lee’s Summit Road and 40 Highway with small scale commercial and connections to residential neighborhoods.
• BRT / Enhanced Streetcar Station potential for either 19th Street and 40 Highway or SW Woods Chapel Road and 40 Highway in Blue Springs due to better accessibility.
• BRT / Enhanced Streetcar Station at 40 Highway and 7 Highway offers development potential on all four corners and the opportunity for a destination/ entertainment node. The City of Blue Springs is already utilizing TIF at this location, which has a mixed-use zoning overlay. However, this strategy has not been tested to date.
• Regional Rail / Enhanced Streetcar and BRT Station at Adams Dairy Parkway which offers access to a large residential population within a ½ mile walking distance, and proximity to plans for the Missouri Innovation Park, which would provide a science and technology hub on over 200 acres.
City of Kansas City, Missouri
The Heart of the City and Little Blue River Area Plans build upon the objectives outlined in the Focus Kansas City Governance Plan, which outlines a strategic plan for the next 25 years for the City and incorporates the City wide walkability and bike plans.
Heart of the City Area Plan (2011)
The portion of the 40 Highway Corridor within Kansas City, from Bruce R Watkins to I-70 along 31st Street, is addressed in the Heart of the City Area Plan. The plan defines a long term vision for the Heart of the City Community which builds off City wide plans including the Kansas City Walkability Plan (2003) and Focus Kansas City. There are four primary objectives including: putting people first, creating jobs, promoting sustainability, and increasing population. The plan provides guidelines for future decision making and proactive strategies with phased implementation. The plan identified the study area as an area of decline and aims to consolidate commercial uses to mixed use nodes or activity centers. The plan’s analysis shows high retail vacancy and an excess of commercial zoning, even when population growth is considered. A key recommendation is to revitalize struggling commercial corridors by implementing streetscape and aesthetic improvements, as well as reinforcing alternative modes of transportation and supportive land uses through a jobs/housing balance. The Linwood/31st Street and Prospect area is identified for a potential pedestrian overlay zone with mixed use/ multi-modal centers.
The Heart of the City land use plan shows “Mixed Use Community” land uses between 31st Street and Linwood Boulevard along Prospect Avenue, as well as further east along the corridor at the Van Brunt Boulevard and 40 Highway intersection. This land use category is described as “Primarily intended to accommodate and promote a variety of community-serving retail sales or service uses generally of a higher intensity and larger scale than what is allowed in Mixed-Use Neighborhood areas. This
Project Introduction | 9
category should include a mix of business and residential uses designed to enhance the pedestrian environment of the community and will correspond with the B3 zoning category within the new zoning ordinance.”
The infrastructure goals that are applicable to the 40 Highway Corridor include strategies that support green solutions and better utilization of existing infrastructure. Green stormwater management that improves the public realm, water quality, air quality and the reduction of the heat island effect are objectives of the plan. The plan recommends an additional bike route to the City’s planned routes along Linwood Boulevard to connect into the on-street routes planned for Van Brunt Boulevard. The Prospect node is identified as an existing Pedestrian Zone in the City’s Walkability Plan with the area at the Van Brunt intersection identified as a recommended additional pedestrian zone. Prospect Avenue is identified as the top priority for transportation improvements such as BRT and supportive improvements including bus stops. Prospect is identified as an “image street” for the area. Linwood Boulevard is identified for Urban Transit Services from Broadway to Van Brunt Boulevard and is identified as a candidate for lane narrowing and as a primary “image street”. The plan characterizes “image streets” as having: diversity and density, development that enhances the appearance of the corridor, pedestrian safety, amenities such as lighting, benches, and signage, and access to goods and services.
Little Blue Valley Area Plan (December 2012)
The Little Blue Valley Area Plan (LBVAP) creates a long term vision for the Little Blue Valley and encompasses the portion of the 40 Highway Corridor that lies in eastern Kansas City, from the intersection of 47th Street to Lee’s Summit Road. The Plan incorporates recommendations for land use, transportation, site planning, and development guidelines focused around four primary objectives including: maintaining the area’s rural character, creating and maintaining desirable neighborhoods, promoting sustainability, and fostering new development. This plan reinforces many of the
objectives of the 40 Highway Study and identifies 40 Highway as a “Primary Image Street” and the frontage of 40 Highway from the intersection of 47th Street to Lee’s Summit Road as within the Development Priority Zone. Planning for enhanced transit service along the corridor and transit oriented development is part of the LBVAP’s vision for 40 Highway.
Some of the key considerations included in this plan that are applicable to 40 Highway include:
• US 40 Highway is a priority for revitalizing the area’s struggling commercial corridors through the creation of special districts such as Community Improvement Districts and other incentives and encouraging mixed use development within compact nodes. Other strategies the plan suggests are building capacity for business and property owners through the creation of business associations, incentives or funding in the form of loans and grants for site improvements.
• Focus on quality of new development along 40 Highway through development standards and the promotion of predictable and efficient growth. This includes minimizing development footprints, utilizing materials that reflect the rural character of the area and preserving and enhancing historic and cultural resources as development occurs. The 40 Highway School House is a historic resource identified in the plan that falls within the corridor boundaries.
• Image Streets, including 40 Highway, are prioritized for aesthetic and streetscape enhancements. These corridors are intended to have a diversity of density, development to enhance the appearance of the corridor, pedestrian safety measures, attractive streetscape amenities, and access to desirable goods and services. Image streets should leverage public investments to lead private investments. Development should be of the highest quality, reflecting a positive image for the area. Visual clutter, such as billboards, cell towers, and junk yards, should be avoided and removed as new development occurs.
Highway 40 Corridor Plan | Focus Area Plans 10 | Project Introduction
• US 40 Highway and Noland Road is designated as a new pedestrian zone.
• The land use plan along this section of 40 Highway recommends Mixed Use Neighborhood development along the highway with Mixed Use Community development at the intersection of Noland Road and 40 Highway. The intersection of Lee’s Summit and 40 Highway is planned for Mixed Use Neighborhood development.
• The Noland Road intersection with 40 Highway is identified as a Major Gateway to the Little Blue Valley Area and a Minor Gateway is identified at Lee’s Summit Road.
Independence, Missouri
Independence Comprehensive Plan (1993, updated in 2004)
The current comprehensive plan for the City of Independence, revised in 2004, outlines goals, policies, and strategies for the community related to transportation, land use, community facilities, parks and recreation, economic and environmental planning and capital improvements. Though produced in 1993 the plan grapples with challenges that are still present today such as how to address declining household size and revitalizing older or declining commercial areas that have been affected by demographic shifts or market changes. The plan classifies the area bounded by Lee’s Summit Road on the west, Mo. 291 highway on the east, Interstate 70 on the north, and U.S. 40 highway on the south as a multi-use district emphasizing high density residential, office, and lower intensity retail usage. Under this designation, residential units and apartments combined with; limited retail uses; service orientated professional and office businesses; eating and drinking businesses; governmental services; and cultural, entertainment and recreational uses are allowed. This wider range of uses is intended to help stimulate redevelopment and create new markets in the older areas of the community.
Kansas City Land Use Classifications:
Mixed Use Neighborhood
Primarily intended to accommodate and promote neighborhood serving retail sales or service uses, as well as mixed-use development consisting of business uses on a building’s lower floors and residential uses on upper floors. This type of vertical, mixed-use development that includes a variety of business and residential choices should enhance the pedestrian environment of the community. Encouraging residential development in mixeduse areas provides increased housing choice and promotes higher density housing.
Mixed Use Community
Primarily intended to accommodate and promote a variety of community serving retail sales or service uses generally of a higher intensity and larger scale than what is allowed in Mixed Use Neighborhood areas. This category should include a mix of business and residential uses designed to enhance the pedestrian environment of the community.
(Little Blue Valley Area Plan & Heart of the City Area Plan)
Blue Springs
Blue Springs Comprehensive Plan (2003 – Currently updating as of August 2013)
The comprehensive plan for the City of Blue Springs is in the process of being updated, with the latest plan adopted in 2003. The plan seeks to capitalize on the strategic location of Blue Springs along Interstate 70 and 40 Highway as a suburban community and regional center for business and industry. Revitalizing commercial centers and developing new ones through both infill development and new development within the identified Growth Phase Areas is seen as an opportunity for the community and a necessity as the City has limited land area for growth. Blue Springs has served as a bedroom community with many residents commuting to other places for employment within the metro region, and as a result the predominate land use is single family residential. The ability to provide cost-effective services and infrastructure is contingent on encouraging higher densities and diversifying the housing stock to respond to changing market demands. Design guidelines for infill commercial and industrial uses support the policies outlined in the plan.
Project Introduction | 11
Secondary gateways which identify the City of Blue Springs on a smaller scale than primary gateways are recommended at 40 Highway and 7 Highway; and 40 Highway and Adams Dairy Parkway. These gateway areas are intended to be pedestrian scale with prominent features, high quality signage, landscaping and streetscape features and amenities. Four development opportunity districts have been identified along 40 Highway that are specific to Blue Springs, including:
• District E: Includes the area south of US 40 Highway, west of 28th Street and east of Burris Road.
• District F: Includes the area north of US 40 Highway between White Cemetery Road and 19th Street.
• District D: Includes the business land uses around the intersection of Missouri 7 Highway and US 40 Highway.
• District I: The area is generally located at the Adams Dairy Parkway overpass at US 40 Highway and the Gateway Western Railroad tracts.
Within these key districts, Blue Springs seeks to identify key partnerships and incentives that could increase development, and adopt development standards that focus on quality for both upscale developments and for lower cost developments. These districts are targeted for public investments through assembling parcels and/ or using innovative financing tools. The city incorporates the regional vision for “Creating Quality Places” through diverse, mixed use developments that focus on infill, a strong pedestrian orientation, and destinations for adjacent neighborhoods. At the Adams Dairy Parkway and 40 Highway node the City’s goal is to “Encourage appropriate commercial and multi-family housing opportunities along 40 Highway, which assure long-term benefits to Blue Springs.”
Blue Springs has a forward looking vision for their transportation system as a network serving all modes of travel wherever possible that provides for and encourages non-motorized bicycle and pedestrian transportation. Efforts have been made by the city to improve the pedestrian network with the City’s policy (since 1996) requiring approved developments to include construction of sidewalks on one side of local streets and both sides of collectors and arterials. Their focus for 40 Highway is to improve pedestrian safety especially at the intersection with 7 Highway where there have historically been a high number of accidents.
Lee’s Summit, Missouri
Lee’s Summit Comprehensive Plan (2005)
The Lee’s Summit Comprehensive Plan, similar to the other comprehensive plans impacting the corridor, outlines the guidelines and long term goals for the community located southeast of Kansas City in Jackson County. U.S. 40 Highway cuts through the northern part of the city connecting it to Blue Springs and Independence and is included in the North Area Comprehensive Plan Update study. This study asserted that the area’s proximity to major regional commercial / office development at both I-470 / I-70 and 40 Highway / I-470 limits the area’s market potential. The small portion of 40 Highway that passes through Lee’s Summit currently is flanked by commercial and undeveloped land with retail with the recommended land use in the plan.
Highway 40 Corridor Plan | Focus Area Plans 12 | Project Introduction
MARKET & ECONOMIC SCAN
Market Scan | 13 2
Market and Economic Scan
As the basis for considering future land use and transportation planning alternatives, the project team examined the historical and projected demographic information and market position for the overall corridor, as well as the four focus areas. This effort did not constitute a comprehensive market study, but draws from local market information and long term trends that impact this portion of the Kansas City metropolitan area as well as the region overall. Whereas many market studies consider and recommend highest and best uses for particular trade areas for time horizons extending out only three to five years, this market scan considers a longer time horizon – up to twenty years, in line with the time frame for the 40 Highway Corridor Study.
Overall Corridor Economic Position
As mentioned previously, the 40 Highway Corridor includes a highly varied set of conditions, ranging from the older and more urban central city neighborhoods surrounding 31st and Prospect, to the post-World War II suburban areas in Independence and eastern Kansas City, Missouri, to the eastern suburban fringes of the Kansas City metropolitan area, near Adams Dairy Parkway in Blue Springs and the Grain Valley area, just to the east of Blue Springs.
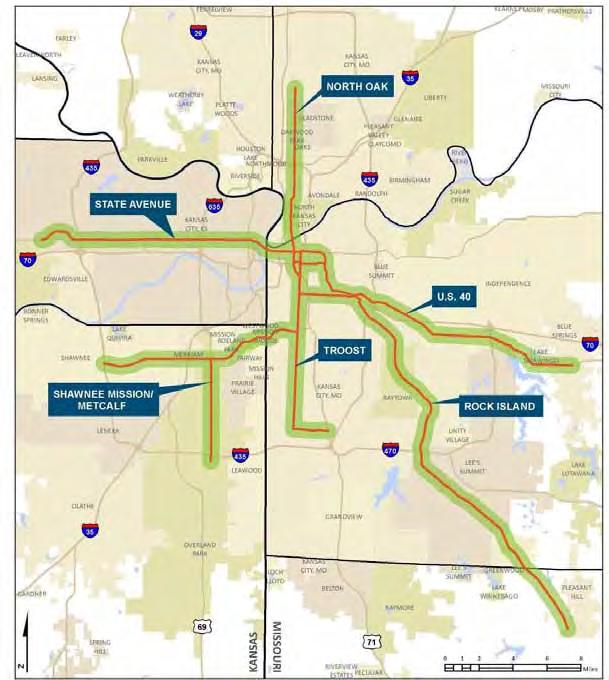
However, on a macro level, the 40 Highway Corridor represents a less favorable “vector” of economic activity, extending from the heart of the city out to the eastern edge, compared to more favorable areas in the Kansas City metropolitan area. Johnson County, along the I-35 and 69 Highway corridors to the south and west, and the I-29 corridor in Platte County, have grown noticeably over the last few decades. In contrast, older corridors in Jackson and Wyandotte counties, including 40 Highway, 24 Highway, and State Avenue in Kansas City, Kansas, have declined overall in economic vitality over the last twenty years.
A comparison of demographic trends for the cities along 40 Highway reveals that most of the municipalities have experienced flat or relatively slow growth in population and households over the last two decades. Lee’s Summit, located to the south of the study area and oriented primarily around the I-470 and US 50 corridors, has accounted for a significant portion of population growth in Jackson County over the last two decades. Blue Springs has grown more modestly but has continued to exhibit consistent population growth over the last two decades. Grain Valley has grown tremendously on a percentage basis. In contrast, Independence has remained essentially flat over the last few decades, as residential growth has tended to be focused in Lee’s Summit, Blue Springs and Grain Valley.
In addition, while the Lee’s Summit and Blue Springs areas have grown over the last few decades, Jackson County overall has continued to trail Johnson County and, more recently, Platte County in the metropolitan area in overall growth. As illustrated in the table, Johnson County represented nearly half of the total population increase for the seven core counties in the Kansas City metropolitan area from 2000 to 2010. Jackson County reported little overall growth of around 3 percent for the decade.
Highway 40 Corridor Plan | Focus Area Plans 14 | Market Scan
P O P u L ATIO n BY C O u n T Y 1990 2000 2010 Change, 20002010 Percentage Change, 2000 - 2010 Leavenworth County 64,371 68,691 76,227 7,536 11.0% Wyandotte County 161,993 157,882 157,505 (377) -0.2% Johnson County 355,054 451,086 544,179 93,093 20.6% Platte County 57,867 73,781 89,322 15,541 21.1% Clay County 153,411 184,006 221,939 37,933 20.6% jackson County 633,232 654,880 674,158 19,278 2.9% Cass County 63,808 82,092 99,478 17,386 21.2% Seven County Total 190,390
Table 1: Population by County
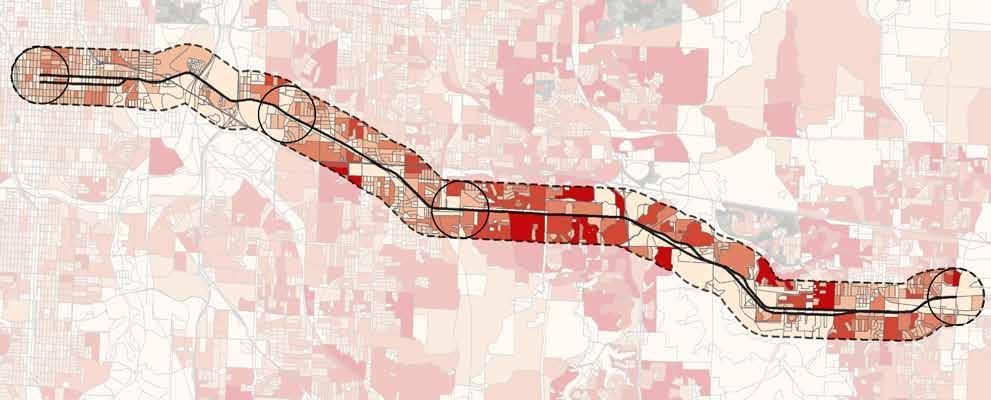
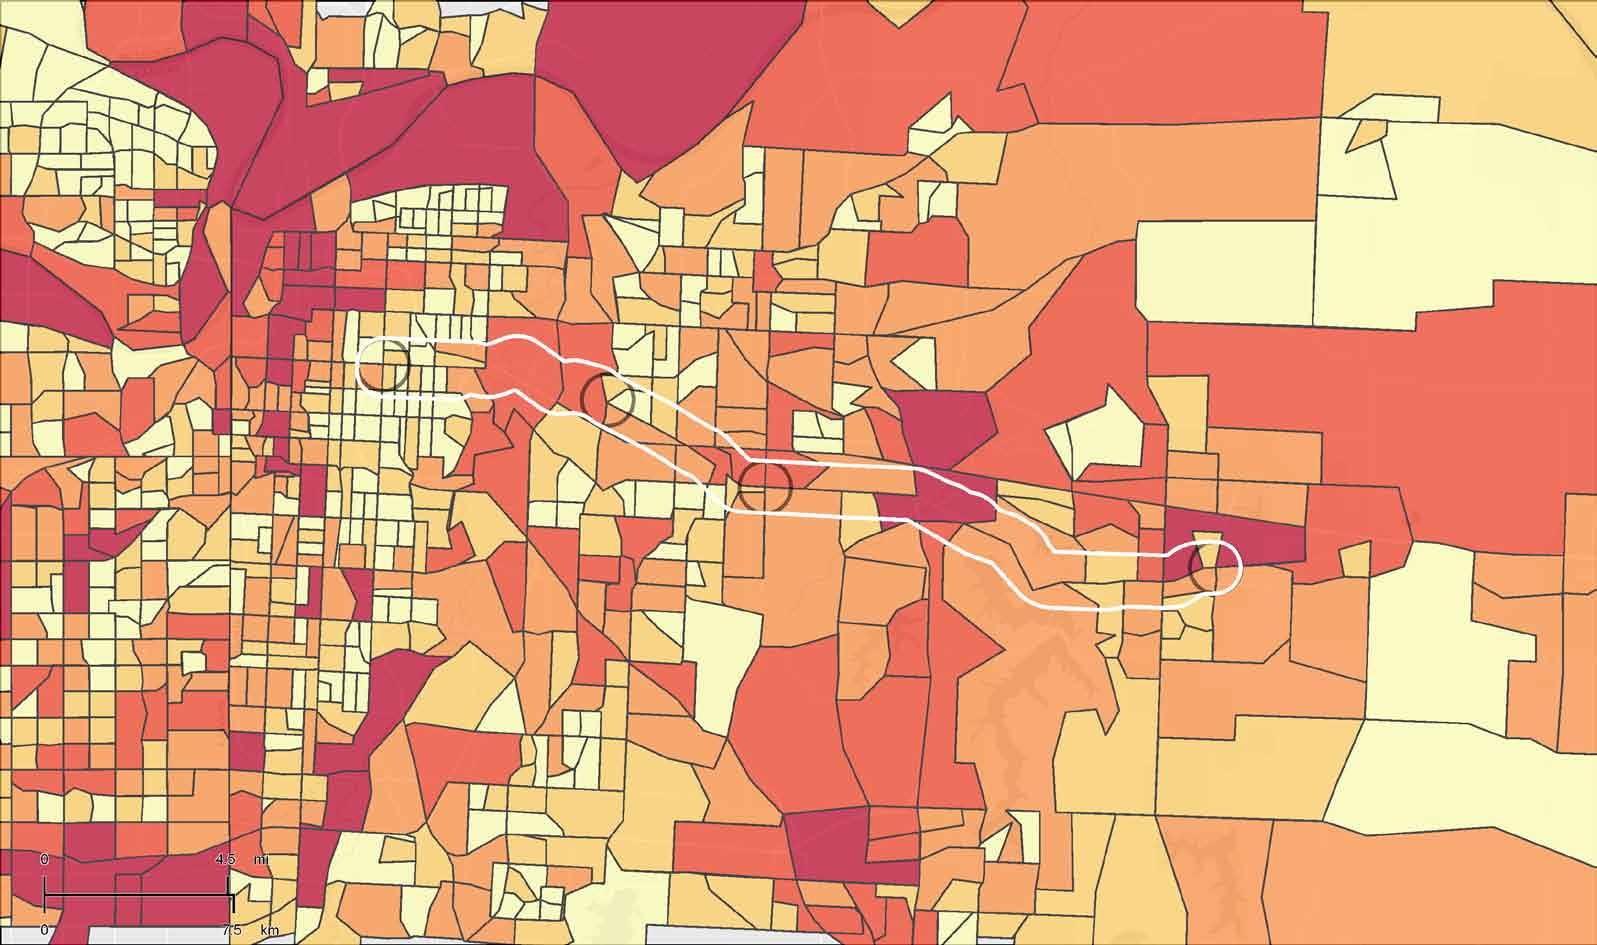

Figure 1: 2010 Population - 40 Highway Corridor 31ST Street and r o ad Blue r i dge Cutoff
2012 Total (SIC01-99) 2012 Total (SIC01-99) Employees by Block Groups Total Employees by Block Groups 2,016 or greater 765 - 2,015 262 - 764 125 - 261 124 or less June 28, 2013 Adams d a iry Pky
noland road
Custom Map
Adams dairy Pky
31st and Prospect
Blue ridge Cutoff
However, despite this historically weak position over the last twenty years, the Mid America Regional Council, in its regional forecasts for growth from 2008 to 2040, predicts that the communities surrounding the 40 Highway Corridor will regenerate or grow substantially more over the next three decades. The “adopted” growth forecast by MARC assumes that larger economic and demographic changes in the metropolitan area and nationally will result in a greater degree of infill and higher density development closer to the urban core, and along aging transportation corridors such as 40 Highway.
As illustrated in the Table 2, the MARC forecast anticipates that Jackson County will grow by over 144,000 residents from 2008 to 2040 and account for 18 percent of the region’s population growth during the period. The county will account for 19 percent of the increase in households and 20 percent of the increase in employment from 2008 to 2040, a dramatic shift from the patterns of the last few decades. The MARC forecasts anticipate that the region’s growth in employment and population over the next 30 years will shift from the historical emphasis on Johnson County to a more balanced pattern of growth, with Jackson County accounting for a larger share of regional economic growth.
Likewise, the MARC forecasts anticipate that many of the cities directly adjacent to the 40 Highway Corridor will experience increases in population, the number of households, and employment from 2008 to 2040.
For example, although its population increased by fewer than 5,000 people from 1990 to 2010, the MARC forecast anticipates that Independence will gain over 27,000 additional residents from 2008 to 2040. However, the MARC forecast anticipates somewhat slower rates of growth for three of the outlying communities –Lee’s Summit, Blue Springs, and Grain Valley. For example, despite growing by over 10,000 residents from 1990 to 2010, MARC predicts total population growth for Grain Valley of only 3,920 residents from 2008 to 2040.
Highway 40 Corridor Plan | Focus Area Plans 16 | Market Scan
P r E d I CTE d TOTAL P O P u L ATIO n / H O u S EHOL d / E M PLOYME n T CHA n G E, 2008 - 2040 County Population Change Percentage of Total Increase Household Change Percentage of Total Increase Employment Change Percentage of Total Increase Wyandotte27,752 3% 13,691 4% 20,269 3% Leavenworth 24,499 3% 10,937 3% 8,562 1% Cass 58,354 7% 23,865 7% 19,142 3% Clay 166,648 21% 73,914 20% 80,369 14% jackson 144,282 18% 70,652 19% 119,386 20% Johnson 300,432 38% 136,825 38% 300,203 51% Platte 72,771 9% 33,769 9% 38,480 7% TOTAL 794,738 363,653 586,411
Table 2: Predicted total population / household change for the Kansas City Metropolitan Area, 2008-2040
Source: Mid America Regional Council Long Term Forecasts
Regional projections of population and households are not available for more specified geographies or subareas within communities, such as the 40 Highway corridor in Jackson County. This report asserts that while the data cannot absolutely point to a potential for infill population and household growth along the corridor over the next three decades, the projected shift of growth to Jackson County should translate into at least some growth along one of its major corridors, 40 Highway. The areas along 40 Highway represent the most prominent
areas for potential infill development on the east side of the metro, given their size and their relative access to Downtown Kansas City and to I-70. The 40 Highway corridor would demonstrate noticeable growth in mixed use development if it were to capture even 10 percent of the projected Jackson County growth over the next three decades. Realizing attainable capture rates of growth along 40 Highway should produce noticeable demand for additional residential and commercial space along the corridor over the next three decades.
* 2008 - 2040 projection for Lee’s Summit includes Jackson County portion only.
Sources: ESRI, Mid America Regional Council
Market Scan | 17 HISTO r I CAL & P r O j E CTE d d E MOG r A PHICS BY CITY 1990 Census 2000 Census Change (19902000) 2010 Census Change (20002010) Total Change 2008 - 2040 (MArC) Kansas City (Jackson County portion) Population 30,763 Households 19,114 Employment 67,035 Independence Population 112,374 113,288 101% 116,830 103% 27,354 Households 45,358 47,390 104% 48,742 103% 12,383 Employment 33,195 14,094 Raytown Population 30,171 30,388 101% 29,526 97% 1,187 Households 12,482 12,855 103% 12,104 94% 583 Employment 9,755 903 Lee’s Summit * Population 47,161 70,700 150% 91,364 129% 40,636 Households 17,870 26,417 148% 34,429 130% 19,843 Employment 31,516 19,529 Lake Tapawingo Population 649 843 130% 730 87% 144 Households 261 350 134% 342 98% 53 Employment 73 0 Blue Springs Population 40,745 48,080 118% 52,575 109% 21,383 Households 13,781 17,286 125% 19,522 113% 9,000 Employment 14,477 5,753 Grain Valley Population 2,132 5,160 242% 12,854 249% 3,920 Households 731 1,921 263% 4,566 238% 1,535 Employment 2,211 4,364
Table 3: Historical & Projected Demographics by City
Long Term Trends Impacting development / redevelopment Potential
A number of longer term trends impacting the entire nation, and the Kansas City area, may encourage the creation of different kinds of development along the 40 Highway Corridor going forward, compared to the traditional suburban development model the area has pursued over the last sixty years.
Aging Population:
In line with national trends, the overall population of the Kansas City metropolitan area continues to age and will continue to age over the next thirty years. As illustrated in Table 4, according to research by Chris Nelson of the University of Utah, the population of people age 65 or older will increase 76 percent in the metro area over the 2010 to 2040 time period, as the Baby Boomer cohort continues to age and retire. The growth of households led by persons age 65 and older will account for 31 percent of all household growth in the metro over this time period.
Similarly, households led by persons age 65 or older will account for 56 percent of the total increase in households in the metro area over the 2010 to 2040 period. The number of households headed by persons age 35 to 64 will account for only 8 percent of the total increase in households in the Kansas City area over the same time period. Persons in the 35 to 64 age range generally are in their “peak years” in terms of needing the maximum size of housing. Households in this age range have tended to desire the traditional, single family detached model of housing. However, the very limited projected growth of this age range means that the overall growth of the single family detached housing segment will remain somewhat limited in the Kansas City area over the next thirty years.
Highway 40 Corridor Plan | Focus Area Plans 18 | Market Scan
AG E 65-P L u S P O P u L ATIO n P r O j E CTE d C H A n G E 2010-2040 united States Midwest Kansas Missouri Kansas City MSA Population 65-Plus, 2010 (thousands) 40,331 9,028 377 839 244 Population 65-Plus, 2040 (thousands) 81,250 15,681 626 1,405 429 Population 65-Plus Total Change, 2010 - 2040 (thousands) 40,919 6,654 249 566 185 Population 65-Plus Percent Change, 20102040 101% 74% 66% 67% 76% Share of Net Growth of Population 65 Plus, 2010 - 2040 42% 60% 35% 43% 31% Source: Chris Nelson, University of Utah Table 5: Change in Households
Age C H A n G E I n H O u S EHOL d S BY AG E 2 010 - 2040 united States Midwest Kansas Missouri Kansas City MSA Household Change, 2010 - 2040 (thousands) 35,226 4,080 267 496 288 Households Age Under 35 Total Change, 2010 - 2040 (thousands) 6,672 450 49 82 36 Households Age 35 - 64 Total Change, 2010 - 2040 (thousands) 28,554 3,630 218 414 252 Households Age 65 Plus Total Change, 2010 - 2040 (thousands) 17,554 2,848 135 271 154 Households Age Under 35 Share (of total change) 13% 10% 23% 16% 36% Households Age 35 - 64 Share (of total change) 20%0% 18% 15% 8% Households Age 65 Plus Share (of total change) 67% 90%60% 70% 56%
Table 4: Age 65-Plus Population Projected Change
by
Source: Chris Nelson, University of Utah
Changing Household Composition:
Traditional households that included one or more parents and one or more children helped drive the significant suburban growth in Kansas City and nationally in the Post War period oriented around traditional, detached housing units in suburban areas. As the Baby Boomers grew up, the nation met a huge demand for conventional suburban housing oriented around child rearing. However, in line with national trends, households with children will account for only 13 percent of the total increase in the number of households in the Kansas City area over the 2010 to 2040 period. Furthermore, as more people live alone either during their young adult years or in their retirement years, households comprising only one person will account for 54 percent of the total increase in households in the metro area over the 2010 to 2040 period, based upon research by Mid America Regional Council and Chris Nelson of the University of Utah.
Market Scan | 19
C H A n G E I n H O u S EHOL d S BY T Y PE 2 010 - 2040 united States Midwest Kansas Missouri Kansas City MSA Household Change, 2010 - 2040 (thousands) 35,226 4,080 267 496 288 Households with Children Change, 20102040 (thousands) 6,672 450 49 82 36 Households without Children Change, 2010 - 2040 (thousands) 28,554 3,630 218 414 252 Single-Person Households Change, 20102040 (thousands) 17,554 2,848 135 271 154 Households with Children Share (of total change) 19% 11% 18% 17% 13% Households without Children Share (of total change) 81% 89% 82% 83%87% Single-Person Household Share (of total change) 50% 70% 51% 55% 54%
Table 6: Change in Households by Age
Source: Chris Nelson, University of Utah
Additional Factors Driving Changes in Housing Patterns:
In addition to the macro forces surrounding an aging population and a changing mix of household types, other factors are likely to alter the overall demand for different kinds of housing and development types locally and nationally over the next 30 years.
rising Energy Costs: Steadily increasing gasoline prices may dampen the attractiveness of suburban fringe and exurban areas for home buying and make living closer to the heart of the metro area more appealing.
Falling Incomes: Since 2000, real median household incomes have fallen, and although the economy has slowly recovered, the average household may not enjoy significant increases in real purchasing power over the next few decades. This trend may logically translate into a demand for smaller houses, or for more rental housing, over time as households adjust their expectations. Flat or falling real incomes would support the development of smaller format attached or detached housing and additional rental units in order to satisfy demand in Kansas City, and nationally, over the next few decades.
Tighter Home Financing: In contrast to the very lenient credit environment of the early 2000s, the country is likely returning to the “norm” of the post war period in which individuals must provide larger down payments and meet stricter qualification guidelines in order to obtain credit to buy homes. As a result, the demand for rental units (whether as part of attached, or detached, housing) will likely increase over time.
Takeaways for the 40 Highway Corridor:
The impact of the overall trends outlined above translates into the following takeaways for areas along the 40 Highway Corridor over the next few decades.
• The increased number of seniors will likely translate into increased demand for smaller housing units geared toward lower maintenance living compared to conventional suburban housing. This age cohort
is more likely to seek out living options in apartment units, smaller townhomes, and other attached forms of housing, often developed in infill locations, compared to traditional suburban detached housing.
• The increase in the number of single person households and households without children will also translate into increased demand for smaller housing units such as townhomes, condominiums, and apartments in contrast to traditional detached housing.
• Falling incomes and tighter home financing will also stimulate increased demand for attached housing and for rental housing, including both apartments and houses, over the next few decades.
• Increased fuel prices will increase demand for housing and living options located closer to employment centers and to the urban core.
All of these trends point toward increased demand, compared to the last few decades, for smaller housing units, more rental units, and more compact developments around the Kansas City area. Older corridors such as 40 Highway contain significant parcels of land that could be redeveloped into these forms of housing and could take advantage of the relative centrality of the corridor to the heart of the city and to the overall metropolitan area. Infill developments that orient multiple forms of housing in a more compact manner are more likely to meet the overall demands for housing and living options over the next few decades compared to the traditional suburban model of constructing detached homes at the edge of urban areas.
Highway 40 Corridor Plan | Focus Area Plans 20 | Market Scan
Psychographic Analysis
Demographers have organized and categorized households around the country according to a variety of “life groups” and psychographic tapestry segments that provide clues concerning their particular living and consumption habits. RCLCO, a real estate research and consulting company, conducted a study for the Mid America Regional Council in 2012 organized to examine the breakdown of households along various corridors in the metro area by psychographic segment. Research has indicated that certain groups of psychographic segments are more likely to desire to live in “smart growth” communities that include the arrangement of housing more conveniently oriented around employment, shopping, and amenity options and more likely to desire to live near transit options.
Specifically, RCLCO drew from a survey conducted by the National Association of Realtors of the different psychographic groups of their preferences for “smart growth” tied to four question types:
Question 8: Preference for a Walkable Neighborhood with Smaller Lots
Question 9: Preference for Shorter Commute with Smaller Lots
Question 10: Preference for Walkable, Mixed-Use Neighborhoods
Question 11: Preference for Walkable Neighborhoods and Shorter Commute without Detached Housing
The survey revealed that while younger and more urban oriented psychographic groups are typically associated with an increased desire to live near transit and to live in communities that exhibit “smart growth” principles, a wider variety of psychographic groups actually exhibit many of the same tendencies.
Table 7 outlines the prevalent psychographic groups along the 40 Highway Corridor in terms of the number of households, their preference for smart growth and transit tied to the questions above, and the number of households (as a result) that may be candidates for “smart growth” communities or developments in the future along or near the corridor.
According to the data, roughly 40 percent of the total households in the area along 40 Highway (including areas generally a half mile north or south of the roadway) indicate a preference for “smart growth” and for having transit options available. While the notion of “smart growth” communicated in the RCLCO study and National Association of Realtors survey may not be directly translatable to a particular type of housing unit, this information does imply that a sizeable portion of the households in eastern Jackson County may consider living in developments organized differently than the suburban norm created in the area since the 1950s. Households along 40 Highway, and around the metro area, have expressed a desire to live in quality developments that have shopping, entertainment, employment, and areas for recreation close at hand, in compact developments. This finding may support the development of “districts” in infill areas along the corridor that better integrate residential, commercial, office, and open space amenities in more compact arrangements. It also supports the creation of developments that better integrate with local and regional transit service.
Market Scan | 21
Highway 40 Corridor Plan | Focus Area Plans 22 | Market Scan 40 H I GH w AY C O rr I d O r T O TAL Psychographic Life Segment Households d i stribution % Prefer Transit Quantity of Households Q 8% Prefer w a lkability / Small Lots Quantity of Households Q 9% Prefer Shorter Commute / Smaller Lots Quantity of Households Q 10% Prefer w a lkable / Mixed u se Quantity of Households Q 11% Prefer w a lkability / Shorter Commutes w/out d e tached Housing Quantity of Households Metropolis 3,527 17% 67% 2,363 63% 2,222 66% 2,328 79% 2,786 56% 1,975 Solo Acts 0 0% 59% 0 58% 0 79% 0 84% 0 57% 0 Global Roots 755 4% 59% 445 54% 408 64% 483 71% 536 52% 393 Family Portrait 3,336 16% 43% 1,434 34% 1,134 50% 1,668 59% 1,968 34% 1,134 Upscale Avenues 2,681 13% 41% 1,099 41% 1,099 65% 1,743 58% 1,555 38% 1,019 High Hopes 2,785 14% 41% 1,142 45% 1,253 63% 1,755 59% 1,643 39% 1,086 High Society 32 0% 41% 13 46% 15 59% 19 53% 17 33% 11 Traditional Living 2,214 11% 33% 731 43% 952 63% 1,395 59% 1,306 34% 753 Senior Styles 4,868 24% 28% 1,363 36% 1,752 61% 2,969 50% 2,434 38% 1,850 American Quilt 374 2% 23% 86 23% 86 50% 187 41% 153 26% 97 Scholars and Patriots 0 0% 21% 0 50% 0 64% 0 55% 0 50% 0 Factories & Farms 0 0% 18% 0 25% 0 56% 0 48% 0 28% 0 Total 20,572 8,676 8,921 12,547 12,398 8,318
Source: ESRI, RCLCO Table 7: 40 Highway Corridor Psycographic Life Segments
ESRI’s LifeMode Group Definitions:
ESRI classifies neighborhoods throughout the U.S. into market segments based on socioeconomic and demographic factors. These segments are then consolidated into their LifeMode groups which are characterized below:
Metropolis
Residents in the six segments of the Metropolis group live and work in America’s cities. They live in older, single-family homes or row houses built in the 1940s or earlier. Those living in larger cities tend to own fewer vehicles and rely more on public transportation; however, workers in most of the Metropolis segments commute to service-related jobs. The Metropolis group reflects the segments’ diversity in housing, age, and income. For example, ages among the segments range from Generation Xers to retirees; households include married couples with children and single parents with children. Employment status also varies from well-educated professionals to unemployed. The median household income of the group is $39,031. Their lifestyle is also uniquely urban and media oriented. They like music, especially urban and contemporary formats, which they listen to during their commutes. They watch a variety of TV programs, from news to syndicated sitcoms, and would rather see movies than read books.
Solo Acts
Residents of the Solo Acts summary group segments are singles who prefer city life. Many are young, just starting out in more densely populated US neighborhoods; others are well-established singles who have no home ownership or child-rearing responsibilities. Second only to High Society, residents of this group tend to be well-educated, working professionals who are either attending college or already hold a degree. Their incomes reflect their employment experience, ranging from a low median of $39,234 (Old and Newcomers) among the newest households to approximately $84,612 (Laptops & Lattes) among established
singles. Home ownership is at 28 percent. Contrary to modern migration patterns that flow away from the largest cities, Solo Acts’ residents are moving into major cities such as New York City; Chicago; Washington, D.C.; Boston; Los Angeles; and San Francisco. With considerable discretionary income and few commitments, their lifestyle is urban, including the best of city life—dining out, attending plays and concerts, and visiting museums—and, for a break from constant connectivity, extensive travel domestically and abroad.
Global Roots
Ethnic diversity is the common thread among the eight segments in Global Roots; the diversity index stands at 88. Las Casas and NeWest Residents represent a strong Hispanic influence in addition to a broad mix of cultural and racial diversity found in Urban Melting Pot and International Marketplace. Typical of new households, Global Roots’ residents are young, earn modest incomes, and tend to rent in multi-unit buildings. Their youth reflects recent immigration trends; half of all households have immigrated to the United States within the past 10 years. Married couples, usually with children; single parents; and people who live alone are typical of the household types in the Global Roots segments. Because households with children dominate, it is not surprising that spending is high for baby products, children’s clothing, and toys. Residents of Global Roots are less likely than other groups to have home PCs but just as likely to use cell phones. They maintain ties with friends and relatives in their countries of origin with foreign travel.
Family Portrait
Family Portrait has the fastest-growing population of the LifeMode summary groups, driven primarily by the rapid increase in the Up and Coming Families segment. Youth, family life, and the presence of children are the common characteristics across the five markets in Family Portrait. The group is also ethnically diverse: more than 30 percent of the residents are of Hispanic descent. The
neighborhoods are predominantly composed of homeowners who live in single-family homes. Most households include married couples with children who contribute to the group’s large household size, averaging more than 3.09 persons per household. Their lifestyle reflects their youth and family orientation—buying infant and children’s clothing and toys and visiting theme parks and zoos.
Upscale Avenues
Prosperity is the overriding attribute shared by the seven segments in Upscale Avenues. Residents have earned their success from years of hard work. Similar to the High Society segments, many in this group are also well educated with above-average earnings. However, their housing choices reveal their distinct preferences. Urban markets such as Urban Chic and Pacific Heights favor townhouses and high-rises, Pleasant-Ville residents prefer singlefamily homes in suburban neighborhoods, and Green Acres residents opt for open spaces. Some have not settled on a home yet, such as the renters among Enterprising Professionals; others, such as Cozy and Comfortable residents, have been settled for years. The median household income for the group is $65,912. Prosperous domesticity also characterizes the lifestyle in Upscale Avenues. They invest in their homes; the owners work on landscaping and home remodeling projects, and the renters buy new furnishings and appliances. They play golf, lift weights, go bicycling, and take domestic vacations. Although they are partial to new cars, they also save and invest their earnings.
High Hopes
The High Hopes summary group includes Aspiring Young Families and Great Expectations. These residents are a mix of married couples, single parents, and singles who seek the “American Dream” of home ownership and a rewarding job. Most live in single-family houses or multiunit buildings; approximately half own their homes. Many would move to a new location for better opportunities. Many are young, mobile, and college educated; one-third
Market Scan | 23
ESRI’s Life Mode Group Definitions:
are younger than 35 years. The median household income is $40,928.
High Society
Residents of the seven High Society neighborhoods are affluent and well educated. They represent slightly more than 12 percent of all US households but generate nearly one-quarter of the total US income. Employment in high paying positions, such as professional or managerial occupations, is a primary reason why the median household income for this group is $100,216. Most households are married couple families who live in affluent neighborhoods. Although this is one of the least ethnically diverse groups in the United States, it is one of the fastest growing, increasing by more than 2 percent annually since 2000. Residents of High Society are affluent and active—financially, civically, and physically. They participate in a wide variety of public activities and sports and travel extensively. Try the Internet or radio instead of television to reach these markets.
Traditional Living
The four segments in Traditional Living convey the perception of real middle America—hardworking, settled families. The group’s higher median age of 37.8 years also conveys their lifestage—a number of older residents who are completing their child-rearing responsibilities and anticipating retirement. Even though they’re older, many still work hard to earn a modest living. They typically own single-family homes in established, slow-growing neighborhoods. They buy standard, four-door American cars, belong to veterans’ clubs and fraternal organizations, take care of their homes and gardens, and rely on traditional media such as newspapers for their news.
Senior Styles
More than 14.4 million households in the nine Senior Styles segments comprise one of the largest LifeMode summary groups. As the US population
ages, two of the fastest-growing American markets are found among The Elders and the Silver and Gold segments. Senior Styles segments illustrate the diversity among today’s senior markets. Although incomes within this group cover a wide range, the median is $41,334, attributable mostly to retirement income or Social Security payments. Younger, more affluent seniors, freed of their child-rearing responsibilities, are traveling and relocating to warmer climates. Settled seniors are looking forward to retirement and remaining in their homes. Residents in some of the older, less privileged segments live alone and collect Social Security and other benefits. Their choice of housing depends on their income. This group may reside in single-family homes, retirement homes, or high-rises. Their lifestyles can be as diverse as their circumstances, but senior markets do have common traits among their preferences. Golf is their favorite sport; they play and watch golf on TV. They read the newspaper daily and prefer to watch news shows on television. Although their use of the Internet is nearly average, they are more likely to shop through QVC than online.
American Quilt
Location in America’s small towns and rural areas links the four segments in American Quilt. Unlike Factories and Farms, this group represents a more diverse microcosm of small-town life, including the largest segment of Tapestry Segmentation, Midland Crowd. Manufacturing and agriculture remain part of the local economy, but American Quilt also includes workers in local government, service, construction, communication, and utilities. In addition to farmers, American Quilt includes the Rural Resort Dwellers segment, an older population that is retiring to seasonal vacation spots, and Crossroads, young families who live in mobile homes. Households in American Quilt are also more affluent, with a median household income of $41,953, and more are homeowners. However, the rural lifestyle is also evident, with a preference for fishing, hunting, power boats, pickups, and country music.
Scholars and Patriots
Residents in the six segments of the Metropolis group live and work in America’s cities. They live in older, single-family homes or row houses built in the 1940s or earlier. Those living in larger cities tend to own fewer vehicles and rely more on public transportation; however, workers in most of the Metropolis segments commute to service-related jobs. The Metropolis group reflects the segments’ diversity in housing, age, and income. For example, ages among the segments range from Generation Xers to retirees; households include married couples with children and single parents with children. Employment status also varies from well-educated professionals to unemployed. The median household income of the group is $39,031. Their lifestyle is also uniquely urban and media oriented. They like music, especially urban and contemporary formats, which they listen to during their commutes. They watch a variety of TV programs, from news to syndicated sitcoms, and would rather see movies than read books.
Factories and Farms
The segments in the Factories and Farms summary group represent rural life—from small towns and villages to farms. Employment in manufacturing and agricultural industries is typical in these small, settled communities across America’s breadbasket. Population change is nominal, and the profile is classic. Most households are families, either married couples or married couples with children. By age, the residents of Factories and Farms mirror the US distribution, with slightly more retirees. Median household income is a bit lower, almost $37,716. Most own their homes. Their lifestyle reflects their locale, emphasizing home and garden care, fishing and hunting, pets, and membership in local clubs.
Source: ESRI. 2012. Tapestry Segmentation Reference Guide. www.esri.com
Highway 40 Corridor Plan | Focus Area Plans 24 | Market Scan
demographic Analysis by Focus Area
The project team analyzed the demographic and economic history of the corridor at the four focus areas – 31st and Prospect Avenue, 40 Highway and Blue Ridge Cutoff, 40 Highway and Noland Road, and 40 Highway and Adams Dairy Parkway – to reveal trends that impact the short-term and long-term planning for the corridor. While the corridor has continued to witness economic stagnation and some degree of deterioration over the last twenty years, the demographic and economic trends do differ along the length of 40 Highway.
The 31st and Prospect and 40 Highway and Blue Ridge Cutoff areas have continued to lose population over the last twenty years due to a number of factors including an aging housing stock, perceptions of safety, and school quality. In contrast, the 40 Highway and Noland Road and 40 Highway and Adams Dairy Parkway areas have remained fairly constant in terms of population or have gained slightly over the last few decades.
Market Scan | 25 F O C u S Ar EA P O P u L ATIO n A C T u AL C H A n GE P E r C E n TAGE C H A n GE 1990 2000 2010 2016 (Projected) 19902000 20002010 20102016 (Projected) 19902000 20002010 2010 - 2016 (Projected) 31st and Prospect - (2 mile radius) Population 71,796 61,456 58,230 57,158 (10,340) (3,226) (1,072) -14.4% -5.2% -1.8% Households 28,622 25,096 24,142 23,818 (3,526) (954)(324) -12.3% -3.8% -1.3% Average Household Size 2.44 2.38 2.34 2.32 40 Highway & Blue ridge Cutoff - (2 mile radius) Population 21,881 19,714 19,082 20,405 (2,167) (632) 1,323 -9.9% -3.2% 6.9% Households 9,525 8,909 8,814 8,871 (616) (95) 57 -6.5% -1.1% 0.6% Average Household Size 2.27 2.19 2.15 2.30 40 Highway & noland road - (2 mile radius) Population 27,149 26,673 27,456 28,610 (476) 783 1,154 -1.8% 2.9% 4.2% Households 11,056 11,483 12,057 12,185 427 574 128 3.9% 5.0% 1.1% Average Household Size 2.45 2.29 2.25 2.33 40 Highway & Adams dairy Parkway - (2 mile radius) Population 22,288 25,452 27,484 26,981 3,164 2,032 (503) 14.2% 8.0% -1.8% Households 7,806 9,592 10,538 10,273 1,786 946 (265) 22.9% 9.9% -2.5% Average Household Size 2.82 2.63 2.58 2.61 Kansas City Metro Area Population 1,636,528 1,836,038 2,051,186 2,141,252 199,510 215,148 90,066 12.2% 11.7% 4.4% Households 629,122 717,761 806,044 842,480 88,639 88,283 36,436 14.1% 12.3% 4.5% Average Household Size 2.55 2.51 2.50 2.50
ESRI, RCLCO
Source:
Table 8: Population change by focus area
Household Income:
The 31st and Prospect and 40 Highway and Blue Ridge Cutoff focus areas report a significantly higher proportion of households that report annual incomes under $35,000 compared to the average for the region. The Adams Dairy Parkway area reflects the greatest degree of affluence, with nearly 19 percent of households reporting annual income in excess of $100,000. In general, household incomes increase as one travels east on 31st Street and 40 Highway, away from the urban core toward Blue Springs and Grain Valley. This reflects a similar pattern to many cities where center city areas are less affluent in comparison to suburban areas.
Highway 40 Corridor Plan | Focus Area Plans 26 | Market Scan
H O u S EHOL d I n C OME , 2 010 under $35,000 $35,000$50,000 $50,000$75,000 $75,000$100,000 Over $100,000 31st and Prospect 57.2% 15.3% 14.8% 7.8% 5.0% 40 Highway & Blue Ridge Cutoff 31.3% 24.9% 25.0% 13.1% 5.6% 40 Highway & Noland Road 22.6% 21.0% 24.5% 20.3% 11.5% 40 Highway & Adams Dairy Parkway 17.3%17.9% 25.2% 20.6% 18.9% Kansas City Metro Area 23.6% 16.7% 21.7% 17.0% 21.0% 2010 Data, Nodes Assume 2 Mile Ring Source: ESRI
Figure 3:
57% 15% 15% 8% 5% Under $35,000 $35,000 ‐ $50,000 $50,000 ‐ $75,000 $75,000 ‐ $100,000 Over $100,000 57% 15% 15% 8% 5% 31st and Prospect 31st & Prospect 23% 17% 22% 17% 21% Kansas City Metro Area Kansas City Metro Area 31% 25% 25% 13% 6% 40 Highway & Blue Ridge Cutoff 40 Highway & Blue Ridge Cutoff 23% 21% 25% 20% 11% 40 Highway & Noland Road 40 Highway & Noland Rd. 17% 18% 25% 21% 19% 40 Highway & Adams Dairy Parkway 40 Highway & Adams Dairy Parkway
Table 9: Household Income 2010
Household Income - 2010
Housing Vacancy:
The area around 31st and Prospect has exhibited significant deterioration in the local housing market over the last ten years, as rates of overall housing vacancy have increased markedly from 17 percent to nearly 27 percent from 2000 to 2010. Vacancies for housing units around 40 Highway and Blue Ridge Cutoff also exceed the averages for the metropolitan area overall. The Noland Road and Adams Dairy Parkway focus areas report relatively stable housing markets, with vacancy rates below the averages for the metropolitan area.
Market Scan | 27
VA CA n C Y rATE - H O u S I n G u n I TS 1990 2000 2010 31st and Prospect (2 mile radius) 20.70% 17.00% 26.90% 40 Highway & Blue Ridge Cutoff (2 mile radius) 7.8% 10.7% 16.9% 40 Highway & Noland Road (2 mile radius) 2.9% 3.0% 6.3% 40 Highway & Adams Dairy Parkway (2 mile radius) 4.8%2.8% 6.2% Kansas City Metro Area 8.6% 6.5% 9.7%
Table
§ ¨ I 70 § ¨ 70 £ ¤ 40 § ¨ 470 § ¨ 435 £ ¤ 40 £ ¤ 40 M 7 M 291 Bruce R Watkins 23rd Swope Blue Parkway Truman Bruce R Watkins I 435 Noland Rd Prospect Ave Blue Ridge Cutoff SE Adams Dairy Parkway Lee's Summit Rd Raytown Rd S Crysler Ave BlueRidgeBlvd S Little BluePky N E L a k e w o o d W a y Hardesty Ave Manchester Tfwy S EmanuelC eaverIIBlvd NWWoods C h a pel Rd StadiumDr US40HWY 31st Street Fleming Park Swope Park Burr Oak Woods Conservation Area Blue Valley Park Missouri HWY 40 Corridor Plan 0 1 2 3 4 0.5 Miles Roads k Nodes 1/2 Mile HWY 40 Corridor Water Bodies Existing Park Study Area Boundary Export_Output_2_Buffer1 1/4 Mile Walking Distance Total Employment 1 - 10 10 - 30 30 - 75 75 - 150 150 - 300 300 - 600 Median Income 2000 High : $137,711 Low $13,466
Employment
Household
Raytown N E 3 4 Miles Roads k Nodes 1/2 Mile HWY 40 Corridor Water Bodies Existing Park Study Area Export_Output_2_Buffer1 1/4 Mile Walking Total Employment 1 - 10 10 - 30 30 - 75 75 - 150 150 - 300 300 - 600 Median Income 2000 High : $137,711 Low : $13,466 § ¨ I 470 £ ¤ 40 Raytown Rd BlueRidge N E L a k e w o o d W a y US40HWY Fleming Park Swope Park Corridor Plan 1 2 3 4 Miles Total Employment 1 - 10 10 - 30 30 - 75 75 - 150 150 - 300 300 - 600 Median Income 2000 High : $137,711 Low : $13,466 Figure 5: Vacancy Rate - Housing Units 0% 5% 10% 15% 20% 25% 30% 31st and Prospect (2 mile radius) 40 Highway & Blue Ridge Cutoff (2 mile radius) 40 Highway & Noland Road (2 mile radius) 40 Highway & Adams Dairy Parkway (2 mile radius) Kansas City Metro Area Vacancy Rate ‐ Housing Units 1990 2000 2010
Source: ESRI
10: Housing Vacancy
Figure 4:
Centers and
Income (2000)
Homeownership Rates:
The national average homeownership rate has varied between 60 percent and 65 percent historically, and the average for the Kansas City metro area has tended to mirror the national rate. The areas around 31st and Prospect exhibit much lower rates of homeownership, in the 35 to 40 percent range. The area near 40 Highway and Noland Road features a number of established single family detached neighborhoods and therefore reports a much higher rate of homeownership compared to averages for the corridor overall and for the metro area. The other focus areas, at Blue Ridge Cutoff and at Adams Dairy Parkway, exhibit homeownership rates comparable to national averages.
Highway 40 Corridor Plan | Focus Area Plans 28 | Market Scan
0% 10% 20% 30% 40% 50% 60% 70% 80% 90% 31st and Prospect (2 mile radius) 40 Highway & Blue Ridge Cutoff (2 mile radius) 40 Highway & Noland Road (2 mile radius) 40 Highway & Adams Dairy Parkway (2 mile radius) Kansas City Metro Area Homeownership Percentage 1990 2000 2010 H OMEO w n E r S HIP P E r C E n TAGE 1990 2000 2010 31st and Prospect (2 mile radius) 36.9% 38.0% 40.2% 40 Highway & Blue Ridge Cutoff (2 mile radius) 65.4% 62.0% 64.6% 40 Highway & Noland Road (2 mile radius) 81.2% 79.4% 77.3% 40 Highway & Adams Dairy Parkway (2 mile radius) 67.1%67.7% 63.8% Kansas City Metro Area 60.2% 63.8% 67.2% Source: ESRI
Figure 6: Homeownership Percentage
Table 11: Homeownership Rates
u S 4 0 H I GH w AY C O r r I d O r , H O u S EHOL d T Y PES , 2 010 Married with Children Married, with unrelated Children / no Children Single with Children Single with Other Family House-holder Living Alone Householder Living with nonFamily Members 31st and Prospect (2 mile radius) 6.4% 11.9% 15.0%15.5% 42.4% 8.9% 40 Highway & Blue Ridge Cutoff (2 mile radius) 11.3% 22.7% 12.8% 9.9% 35.4% 7.9% 40 Highway & Noland Road (2 mile radius) 14.6% 32.1% 8.8% 8.1% 30.9% 5.5% 40 Highway & Adams Dairy Parkway (2 mile radius) 22.5% 27.8% 13.5% 6.9% 23.2% 6.0% Kansas City Metro Area (2 mile radius) 21.1% 27.9% 9.9% 7.1% 27.8% 6.2% Source: ESRI Table
12: Household Type Married with Children Married, with Unrelated Children / No Children Single with Children Single with Other Family Householder Living Alone Householder Living with Non‐Family Members
Figure 7: Household Type - 2010 6% 12% 15% 16%
42%
9%
31st and Prospect 31st & Prospect 21% 28% 10% 7%
28%
6%
Kansas City Metro Area Kansas City Metro Area 11% 23% 13% 10%
35%
8%
40 Highway & Blue Ridge Cutoff 40 Highway & Blue Ridge Cutoff 15% 32% 9% 8%
31%
5%
40 Highway & Noland Road 40 Highway & Noland Rd 11% 23% 13% 10%
35%
8%
40 Highway & Blue Ridge Cutoff 40 Highway & Adams Dairy Parkway
Household
Type:
Of the focus areas examined, only the 40 Highway and Adams Dairy area in Blue Springs mirrors the regional trends, with households including a married couple with one or more children accounting for over 22 percent of all households. The 40 Highway and Noland Road area is generally dominated by empty nesters, and the Blue Ridge Cutoff and 31st and Prospect areas report higher numbers of households headed by a single person.
Economic Performance and Market Conditions by Land use
While the 40 Highway Corridor represented an engine of economic growth from the 1950s to the 1980s, as suburbs such as Independence and Blue Springs continued to grow, the corridor has continued to deteriorate over the last twenty years as newer developments farther out from the urban core have gained market share and diminished the prominence of the corridor.
Retail
As illustrated in the Table 13, the overall corridor (considering areas within a half mile of 40 Highway on either side, from 31st and Prospect east to Adams Dairy Parkway) exhibits lease rates and vacancies for retail uses below the averages for the overall Kansas City metropolitan area, and for the respective submarkets that include 40 Highway in eastern Jackson County.
Essentially, while the areas along and near 40 Highway in eastern Jackson County have continued to grow at a relatively modest pace, or in some cases even lost population over the last few decades, the construction of new retail centers farther to the east has continued to result in increased vacancies and lower rents for the predominantly older retail properties along 40 Highway. In particular, the development of big box retail and associated in-line properties at the I-70 and Little Blue Parkway area, and at the Adams Dairy Landing complex at I-70 and Adams Dairy Parkway, have drawn retail vitality away from the 40 Highway Corridor in recent years.
Office
The primary focus of redevelopment efforts along the majority of the 40 Highway Corridor, and at 31st and Prospect, will center around retail and associated residential development oriented around creating new infill neighborhoods, in particular at locations such as Noland Road and Blue Ridge Cutoff. The Johnson County and Downtown markets simply represent more of the core areas in the metropolitan area for key employment centers. The majority of the 40 Highway Corridor will include only local-serving office uses at locations such as Noland Road. Likely neighborhood oriented office uses would include medical office uses, attorneys offices, bank or investment firm offices, and the like. The 40 Highway and Adams Dairy Parkway focus area will represent one notable difference.
The investments made by the University of Missouri and the marketing and economic development focus on the Missouri Innovation Park, just to the north, has the potential to create a key employment center at the east edge of the metro area, strategically located on the I-70 corridor between Downtown Kansas City and Columbia. The research park has the potential to generate several hundred thousand square feet of office space demand over the next few decades, including some space that could integrate into a mixed-use center at 40 Highway and Adams Dairy Parkway. A good deal of this office space may include research and development facilities and similar high tech offices. In addition, the 40 Highway and Adams Dairy Parkway focus area could also include a program of local serving medical office uses.
rETAIL M A r K ET S
$7.76 East and Southeast Jackson County Submarket 9.1% $11.13
Kansas
$13.24
* East and Southeast Jackson County and KC Metro data from Cassidy Turley report, January 2013
* 40 Highway Corridor data from CoStar, 2013
* Rental Rate for 40 Highway Corridor represents the direct rental rate. Rental rate for East and SE Jackson County and KC Metro area represents the average asking rent rate, NNN.
Source: Cassidy Turley, CoStar
Eastern Jackson County Submarket
$13.77
$14.14
Kansas City Metro (Overall) 15.8% $17.36
* Eastern Jackson County and KC Metro data from Newmark Grubb Knight Frank, 1st Quarter 2013
* 40 Highway Corridor data from CoStar, 2013
Source: Newmark Grubb Knight Frank, CoStar
Highway 40 Corridor Plan | Focus Area Plans 30 | Market Scan
TATISTICS Total Vacancy rental rate 40 Highway Corridor 15.0%
City Metro (Overall) 9.8%
O F FICE M
Total Vacancy direct rental rate (Average) 40 Highway Corridor 18.0%
Table 13: Retail Market Statistics
A r K ET S TATISTICS
13.9%
Table 14: Office Market Statistics
Economic Performance and Local Market Conditions by Focus Area
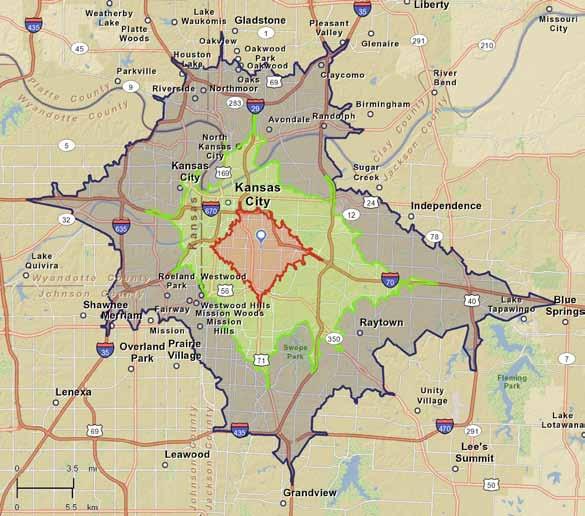
31st and Prospect
This part of the corridor study area, including the parallel 31st Street and Linwood corridors running east from Bruce R. Watkins (71 Highway) to the junction with I-70, has witnessed very few new retail openings and little construction over the last twenty years. A grocery store anchored shopping center at 31st and Prospect lost its main tenant and a number of associated inline tenants in recent years. Local serving retail and service establishments have remained along 31st Street, including a number of fast food restaurants and smallscale local markets (such as Woody’s), but the corridor has not witnessed any significant new construction in recent years.
This part of east Kansas City has suffered to a certain extent from the development of some notable infill and larger scale retail projects in recent years in or close to the urban core, that have absorbed a good deal of the market demand in this part of the city. The large scale shopping center containing a Costco and Home Depot at Linwood Boulevard and Main Street absorbs a significant portion of the grocery and hardware related demand from the central city. The Blue Ridge Crossing development, constructed on the site of the old Blue Ridge Mall at 40 Highway and I-70 (east of Sterling) contains a Walmart and Lowe’s that absorb grocery, general retail, and hardware sales from the eastern portion of Kansas City, Missouri. The development also includes a number of in-line retailers and restaurants including Applebee’s, Chipotle, IHOP, and Starbucks.
Retail
The declining population in the immediate area near 31st and Prospect has translated into a retail market that is generally oversupplied. As illustrated in Figure 8 and Table 15, the immediate area (5 minute drive time) around 31st and Prospect does have an unmet need for a food store (a small grocery) but in most other
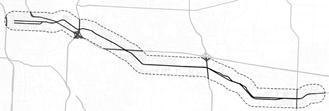
Market Scan | 31
Site Map E 31st St and Prospect Ave, Kansas City, MO, 64128_1 E 31st St & Prospect Ave, Kansas City, MO, 64128 Latitude: 39.06986 Drive Time: 5, 10, 15 Minutes Longitude: -94.55284 June 15, 2013 Made with Esri Business Analyst ©2013 Esri www.esri.com/ba800-447-9778Try it Now! Page 1 of 1 Figure 8:
5, 10, and 15 Minute Drive Times Source: Esri 5 Minute Drive Time 10 Minute Drive Time 15 Minute Drive Time 40
31st and Prospect:
categories, the area has an oversupply of retail space. The local retail market is particularly oversupplied in relation to the 10 minute and 15 minute drive times, which are more applicable for regional-serving retail uses. The 31st and Prospect area appears to be particularly over-supplied with regard to eating and drinking establishments (including sit-down restaurants as well as fast food restaurants).
The anticipated arrival of a new Aldi’s grocery store at 39th and Prospect may absorb the unmet demand for food stores in the immediate area around 31st and Prospect in the near term.
Office
The area around 31st and Prospect does not include any significant areas of office properties. The area remains relatively distant from the primary office and employment corridors in the city (including the Plaza, Crown Center, and Downtown).
Retail Marketplace Profile:
The Retail Marketplace Profiles in the tables that follow help demonstrate the retail performance of the focus areas. The data shows if the areas are meeting consumer demand, whether customers are shopping elsewhere for different types of products creating a situation where supply is less than the demand (leakage) or if the area’s retailers are exceeding demand (surplus). ESRI’s Leakage/Surplus factor provides a summary of the relationship between sales or supply and consumer spending (demand or retail potential) generated by household spending within the same industry. The Leakage represents a condition where supply is less than demand whereas Surplus represents the situation in which the supply exceeds the area’s demand or where retailers are attracting sales from people residing outside the trade area.
Highway 40 Corridor Plan | Focus Area Plans 32 | Market Scan
31st and Prospect nodeRetail Marketplace Profile 5 M I n u T E d r I VE T I ME 10 M I n u T E d r I VE T I ME 15 M I n u T E d r I VE T I ME Industry Subsector: retail Gap Leakage or Surplus Leakage/ Surplus Factor retail Gap Leakage or Surplus Leakage/ Surplus Factor retail Gap Leakage or Surplus Leakage/ Surplus Factor Motor Vehicle & Parts Dealers ($4,887,662) Surplus (4.9) $2,049,017 Leakage 0.4 ($227,688,512) Surplus (12.9) Furniture & Home Furnishings Stores $1,211,782 Leakage 12.9 ($21,295,341) Surplus (27.9) ($33,074,337) Surplus (15.5) Electronics & Appliance Stores $2,110,709 Leakage 16.9 ($27,618,434) Surplus (26.9) ($28,438,283) Surplus (10.7) Building Materials, Garden Equipment, & Supply Stores ($11,048,477) Surplus (43.5) ($35,669,828) Surplus (32.2) ($87,782,038) Surplus (25.0) Food & Beverage Stores $19,836,380 Leakage 40.5 ($2,480,740) Surplus (0.7) ($82,443,432) Surplus (6.9) Health & Personal Care Stores ($501,307) Surplus (1.2) ($112,773,888) Surplus (35.0) ($240,785,097) Surplus (27.0) Gasoline Stations $399,506 Leakage 0.6 ($80,159,892) Surplus (20.4) ($169,333,611) Surplus (14.9) Clothing and Clothing Accessories Stories $8,546,598 Leakage 40.4 ($83,729,646) Surplus (35.4) ($64,260,136) Surplus (12.1) Sporting Goods, Hobby, Book & Music Stores $2,352,793 Leakage 38.4 ($16,092,337) Surplus (26.6) ($67,846,186) Surplus (31.3) General Merchandise Stores * ($68,675,171) Surplus (36.5) $40,124,794 Leakage 7.2 ($176,630,527) Surplus (8.8) Miscellaneous Store Retailers ** $3,649,287 Leakage 35.2 ($7,020,169) Surplus (9.2) $8,327,147 Leakage 4.0 Nonstore Retailers $6,657,934 Leakage 25.9 $20,781,728 Leakage 14.5 $41,819,029 Leakage 8.8 Food Services & Drinking Places ($3,678,494) Surplus (6.2) ($223,069,371) Surplus (43.6) ($307,273,268) Surplus (25.4) Total retail Trade ($40,347,627) Surplus (7.3) ($323,884,737) Surplus (11.1)($1,128,135,983) Surplus (12.2) Total Food and drink ($3,678,494) Surplus (6.2) ($223,069,371) Surplus (43.6) ($307,273,268) Surplus (25.4)
Source: ESRI
Table 15: 31st and Prospect Node Retail Marketplace Profile
40 Highway and Blue ridge Cutoff
This area has also experienced flat or slightly declining population levels over the last few decades. This stretch of 40 Highway has particularly suffered from significant vacancies. A good deal of the industrial or light industrial space along 40 Highway on either side of I-435 remains vacant, and several retail properties east of Blue Ridge Cutoff remain vacant as well. Although this area is located less than a mile from the I-70 interchange at the Truman Sports Complex the lack of visibility to 40 Highway has limited the attractiveness of this area for redevelopment to date.
The Dixon’s Chili restaurant represents one of the key tenants on the corridor, and most of the rest of this part of 40 Highway is lined with gas stations, small restaurants and bars, and various service businesses. Several actual vacant lots still remain on the corridor (with no buildings on them) meaning that the corridor never fully built out during the period of suburban expansion, before declining in vitality in recent years.
Retail
While some areas of unmet retail demand exist in the area immediately around 40 Highway and Blue Ridge Cutoff, overall, the area exhibits an oversupply of retail based upon the current data from ESRI.
As illustrated in Table 16, the area immediately around 40 Highway and Blue Ridge Cutoff (reflected in the five minute drive time area) is losing some retail demand due to lack of supply in the areas of food and beverage stores, health and personal care stores, and a few other categories. The area could support a small CVS or similar outlet in the future, particularly if the area’s population stabilizes or begins to grow again. Otherwise, within the 10 and 15 minute drive time zones, the area appears over-retailed.
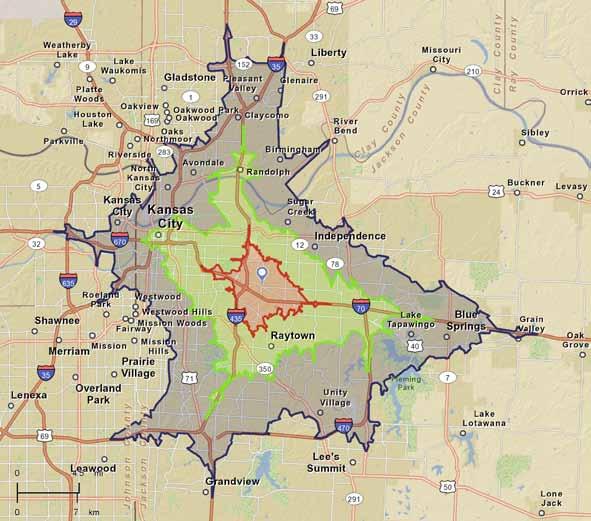
Market Scan | 33
Site Map 9098 Us 40, Independence, MO, 64055 Drive Time: 5, 10, 15 Minutes Latitude: 39.05992 Longitude: -94.47212 June 15, 2013 Made with Esri Business Analyst ©2013 Esri www.esri.com/ba800-447-9778Try it Now! Page 1 of 1 Source: Esri
5 Minute Drive Time 10 Minute Drive Time 15 Minute Drive Time 40
Figure 9: 40 Highway and Blue Ridge Cutoff: 5, 10, and 15 Minute Drive Times
Office / Industrial:
The areas around and near 40 Highway and Blue Ridge Cutoff do not have any significant land uses dedicated to office space. However, the areas along 40 Highway between Blue Ridge Cutoff and I-70 (to the west) contain significant areas of industrial properties, including truck depots, small storage outlets, junk yards, and the like. The industrial uses along 40 Highway are generally lower value proposition uses, compared to distribution centers, manufacturing or assembly plants, and other industrial uses that produce more jobs and greater tax revenues.
Highway 40 Corridor Plan | Focus Area Plans 34 | Market Scan
40 H I GH w AY & B L u E rI d G E C u T OFF nO d E - rETAIL M A r KETPLACE P r OF ILE 5 M I n u T E d r I VE T I ME 10 M I n u T E d r I VE T I ME 15 M I n u T E d r I VE T I ME Industry Subsector: retail Gap Leakage or Surplus Leakage/ Surplus Factor retail Gap Leakage or Surplus Leakage/ Surplus Factor retail Gap Leakage or Surplus Leakage / Surplus Factor Motor Vehicle & Parts Dealers $6,551,718 Leakage 12.4 ($166,534,699) Surplus (25.8) ($467,130,985) Surplus (24.1) Furniture & Home Furnishings Stores $1,242,693 Leakage 23.1 ($11,509,608) Surplus (17.5) ($28,820,710) Surplus (14.6) Electronics & Appliance Stores $4,201,732 Leakage 86.5 $5,739,376 Leakage 8.4 ($34,267,127) Surplus (13.0) Building Materials, Garden Equipment, & Supply Stores ($6,700,000) Surplus (39.3) ($23,442,238) Surplus (22.3) ($56,761,480) Surplus (18.3) Food & Beverage Stores $16,272,327 Leakage 65.7 ($79,486,508) Surplus (19.2) ($96,894,640) Surplus (8.6) Health & Personal Care Stores $11,766,753 Leakage 80.0 ($67,973,428) Surplus (24.2) ($352,542,111) Surplus (35.4) Gasoline Stations ($24,969,608) Surplus (39.9) ($54,720,430) Surplus (15.1) ($193,153,919) Surplus (17.2) Clothing and Clothing Accessories Stories $5,072,763 Leakage 40.0 ($24,922,427) Surplus (14.5) ($68,055,939) Surplus (13.1) Sporting Goods, Hobby, Book & Music Stores $894,514 Leakage 20.4 ($39,601,163) Surplus (48.0) ($59,716,579) Surplus (30.8) General Merchandise Stores * $10,802,929 Leakage 17.7 ($290,415,357) Surplus (33.2) ($296,836,569) Surplus (14.3) Miscellaneous Store Retailers ** ($1,708,374) Surplus (16.7) ($922,218) Surplus (1.3) $12,887,476 Leakage 6.6 Nonstore Retailers $3,784,578 Leakage 22.9 $18,820,864 Leakage 13.0 $92,232,405 Leakage 22.8 Food Services & Drinking Places ($14,600,014) Surplus (30.5) ($98,276,673) Surplus (26.4) ($282,966,548) Surplus (24.9) Total retail Trade $27,212,025 Leakage 9.5 ($734,967,835) Surplus (22.4) ($1,549,060,178) Surplus (16.6) Total Food and drink ($14,600,014) Surplus (30.5) ($98,276,673) Surplus (26.4) ($282,966,548) Surplus (24.9) Source: ESRI Table 16: 40 Highway and Blue Ridge Cutoff Node Retail Marketplace Profile
40 Highway and noland road
The area around 40 Highway and Noland Road emerged as one of the most active and vibrant retail shopping areas in eastern Jackson County in the 1980s and early 1990s, with major anchors such as Sam’s Club and a variety of smaller retailers helping to make Noland Road the signature commercial strip in the area. However, in recent years, as newer retail developments have opened to the east, along I-470 and along Little Blue Parkway, including a variety of new restaurants and big box stores, retailers have quickly moved out of the Noland Road area. Today, the area appears predominantly vacant on the northwest and southwest quadrants. The HyVee grocery store on the northeast quadrant appears healthy, as it relies on business from the adjacent residential areas, and the junior box stores on the southeast quadrant appear to be stable at this time.
Retail
While the area within a five minute drive time of 40 Highway and Noland Road has unmet demand in the areas of gas stations, clothing stores, furniture and home furnishings stores, and electronics stores, overall the area has an oversupply of retail space across all scales of trade areas exhibited (5 minute drive time, 10 minute drive time, and 15 minute drive time).
Office
The area around 40 Highway and Noland Road does not have a significant pool of office properties. A variety of small business park users exist between 40 Highway and I-70, to the west of Noland Road, but this area does not materially impact the subject area focused on 40 Highway and Noland Road.
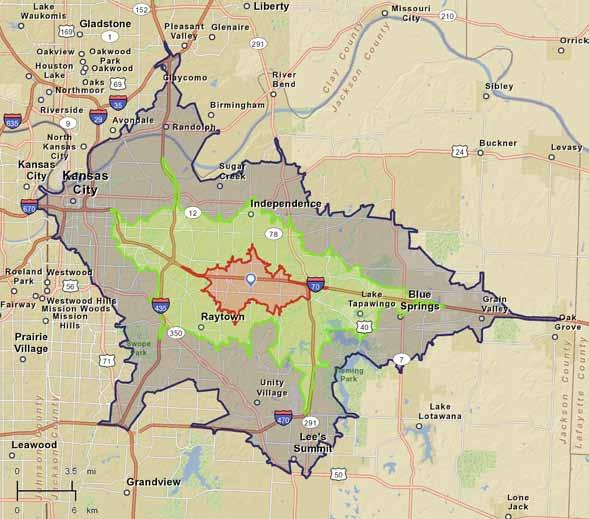
Market Scan | 35
Site Map 13998 Us 40, Independence, MO, 64055 Drive Time: 5, 10, 15 Minutes Latitude: 39.03563 Longitude: -94.41569 June 15, 2013 Made with Esri Business Analyst ©2013 Esri www.esri.com/ba800-447-9778Try it Now! Page 1 of 1 Source: Esri Figure 10: 40
5, 10,
15
5 Minute Drive Time 10 Minute Drive Time 15 Minute Drive Time 40
Highway and Noland Road:
and
Minute Drive Times
Highway 40 Corridor Plan | Focus Area Plans 36 | Market Scan 40 H I GH w AY & nOLA n d rOA d n O d E - rETAIL M A r K ETPLACE Pr O FILE 5 M I n u T E d r I VE T I ME 10 M I n u T E d r I VE T I ME 15 M I n u T E d r I VE T I ME Industry Subsector: retail Gap Leakage or Surplus Leakage/ Surplus Factor retail Gap Leakage or Surplus Leakage/ Surplus Factor retail Gap Leakage or Surplus Leakage / Surplus Factor Motor Vehicle & Parts Dealers ($34,192,672) Surplus (28.0) ($47,458,807) Surplus (8.7) ($195,408,430) Surplus (14.0) Furniture & Home Furnishings Stores $626,076 Leakage 6.7 $134,257 Leakage 0.2 ($16,964,374) Surplus (11.0) Electronics & Appliance Stores $5,897,355 Leakage 78.2 ($3,996,026) Surplus (4.9) $5,226,186 Leakage 2.9 Building Materials, Garden Equipment, & Supply Stores ($29,753,863) Surplus (65.5) ($22,907,885) Surplus (20.2) ($33,492,007) Surplus (13.8) Food & Beverage Stores ($14,797,284) Surplus (19.8) ($58,380,087) Surplus (14.7) ($101,224,493) Surplus (11.0) Health & Personal Care Stores ($62,182,090) Surplus (61.3) ($63,563,116) Surplus (22.4) ($120,831,484) Surplus (18.7) Gasoline Stations $9,899,934 Leakage 22.2 ($60,581,575) Surplus (16.4) ($15,344,480) Surplus (2.0) Clothing and Clothing Accessories Stories $5,303,771 Leakage 25.2 ($49,336,788) Surplus (24.5) $4,432,596 Leakage 1.2 Sporting Goods, Hobby, Book & Music Stores ($30,528,481) Surplus (79.7) ($45,966,309) Surplus (50.7) ($44,187,117) Surplus (29.1) General Merchandise Stores * ($71,273,449) Surplus (40.4)($304,056,354) Surplus (33.7) ($239,058,321) Surplus (14.2) Miscellaneous Store Retailers ** ($2,919,638) Surplus (19.0) ($1,283,442) Surplus (1.8) $12,410,211 Leakage 7.9 Nonstore Retailers $11,249,144 Leakage 58.8 $29,053,239 Leakage 20.7 $52,686,631 Leakage 15.1 Food Services & Drinking Places ($17,093,997) Surplus (25.7) ($80,370,377) Surplus (22.0) ($191,091,880) Surplus (21.7) Total retail Trade ($212,671,199) Surplus (31.5) ($628,293,587) Surplus (19.3) ($691,755,082) Surplus (9.9) Total Food and drink ($17,093,997) Surplus (25.7) ($80,370,377) Surplus (22.0) ($191,091,880) Surplus (21.7) Source: ESRI
Table 17: 40 Highway and Noland Road Node Retail Marketplace Profile
40 Highway and Adams dairy Parkway
The area around 40 Highway and Adams Dairy Parkway is largely overshadowed by more prominent intersections in the Blue Springs area, including 7 Highway and I-70, 7 Highway and 40 Highway, and I-70 and Adams Dairy Parkway. The parcels immediately surrounding the Adams Dairy Parkway focus area include a mixture of vacant land and various light industrial uses, including an old asphalt plant.
Retail
The area immediately surrounding 40 Highway and Adams Dairy Parkway (within a five minute drive time) exhibits unmet retail need in terms of health and personal care stores, gas stations, and motor vehicle and parts dealers, but otherwise the area has an oversupply of retail space. Likewise, the areas within the 10 and 15 minute drive times of 40 Highway and Adams Dairy Parkway exhibit an overall excess of retail and food / drink space. It appears the neighborhood around 40 Highway and Adams Dairy Parkway could absorb an additional pharmacy or convenience retail outlet (such as a CVS or a Walgreens), but overall the area is oversupplied in terms of retail. The presence of I-70 and the dominance of the interstate as a retail corridor means that any retail demand at 40 Highway and Adams Dairy Parkway would have to be generated from the surrounding neighborhood (for small scale uses) or from additional residential demand generated in close proximity to the focus area.
Office / Industrial
The areas in and near the 40 Highway and Adams Dairy Parkway focus area do not currently have significant areas of office space. The light industrial space at 40 Highway and Adams Dairy Parkway is rather limited and likely to move out over time, based upon information provided by the City of Blue Springs as part of this study.
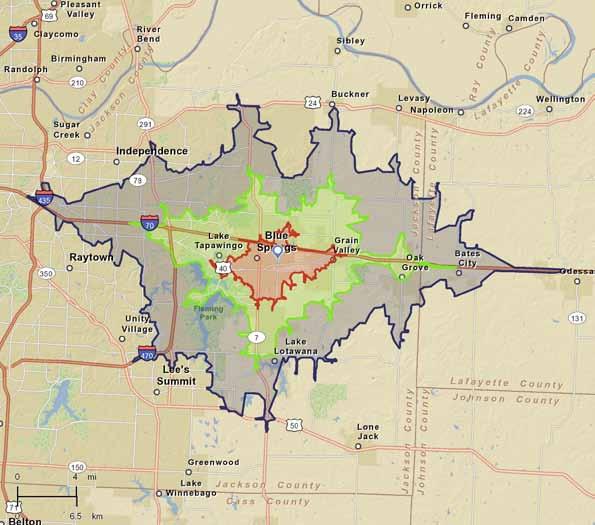
Market Scan | 37
Site Map Us 40 and SE Adams Dairy Pky, Blue Springs, MO, 64014 Us 40 & SE Adams Dairy Pky, Blue Springs, MO, 64014 Latitude: 39.01313 Drive Time: 5, 10, 15 Minutes Longitude: -94.25385 June 15, 2013 Made with Esri Business Analyst ©2013 Esri www.esri.com/ba800-447-9778Try it Now! Page 1 of 1 Source: Esri Figure 11:
10,
15 Minute Drive Times 40 5 Minute Drive Time 10 Minute Drive Time 15 Minute Drive Time
40 Highway and Adams Dairy Parkway: 5,
and
Highway 40 Corridor Plan | Focus Area Plans 38 | Market Scan 40 H I GH w AY & Ad A MS d AI r Y PA r K w AY nO d E - rETAIL M A r K ETPLACE Pr O FILE 5 M I n u T E d r I VE T I ME 10 M I n u T E d r I VE T I ME 15 M I n u T E d r I VE T I ME Industry Subsector: retail Gap Leakage or Surplus Leakage/ Surplus Factor retail Gap Leakage or Surplus Leakage/ Surplus Factor retail Gap Leakage or Surplus Leakage/ Surplus Factor Motor Vehicle & Parts Dealers $25,313,471 Leakage 35.6 $12,544,816 Leakage 4.2 $5,712,577 Leakage 0.9 Furniture & Home Furnishings Stores ($479,079) Surplus (4.2) $345,064 Leakage 1.0 $6,211,793 Leakage 8.7 Electronics & Appliance Stores $1,768,209 Leakage 13.5 ($10,004,320) Surplus (17.2) $3,820,392 Leakage 3.8 Building Materials, Garden Equipment, & Supply Stores ($15,723,931) Surplus (48.2) ($23,198,969) Surplus (28.9) ($23,805,711) Surplus (16.0) Food & Beverage Stores ($19,778,869) Surplus (23.7) $39,327,854 Leakage 23.8 ($42,363,095) Surplus (8.6) Health & Personal Care Stores $12,150,684 Leakage 42.5 ($88,091,845) Surplus (40.0) ($128,979,060) Surplus (30.6) Gasoline Stations $13,478,636 Leakage 29.5 ($10,646,787) Surplus (5.4) ($22,243,059) Surplus (5.2) Clothing and Clothing Accessories Stories $11,851,170 Leakage 68.5 ($18,532,276) Surplus (16.5) ($25,408,739) Surplus (11.0) Sporting Goods, Hobby, Book & Music Stores ($2,022,430) Surplus (19.0) ($16,061,476) Surplus (36.5) ($42,012,790) Surplus (41.0) General Merchandise Stores * ($49,365,575) Surplus (30.3) ($183,033,434) Surplus (33.4) ($346,456,576) Surplus (30.3) Miscellaneous Store Retailers ** ($101,452) Surplus (0.8) $7,925,514 Leakage 22.7 $13,366,961 Leakage 16.6 Nonstore Retailers $14,174,109 Leakage 85.2 $31,835,701 Leakage 46.5 $20,783,159 Leakage 10.2 Food Services & Drinking Places ($7,635,991) Surplus (12.1) ($15,202,216) Surplus (7.9) ($36,308,432) Surplus (8.6) Total retail Trade ($8,735,059) Surplus (1.7) ($257,590,158) Surplus (13.8) ($581,374,147) Surplus (14.2) Total Food and drink ($7,635,991) Surplus (12.1) ($15,202,216) Surplus (7.9) ($36,308,432) Surplus (8.6)
Source: ESRI
Table 18: 40 Highway and Adams Dairy Parkway Node Retail Marketplace Profile
Existing Conditions | 39 3
EXISTING CONDITIONS
Existing Conditions
Local and regional Context of 40 Highway and Key Focus Areas
The 40 Highway Corridor, from Kansas City east to Grain Valley, developed largely since the beginning of suburban expansion in the 1940s. Over the last few decades, numerous segments of the corridor have deteriorated in terms of appearance and economic performance as newer corridors and shopping districts have emerged elsewhere in Jackson County and throughout the metropolitan area. Prior to the construction of I-70, 40 Highway represented one of the most desired commercial addresses in Jackson County. The 14-mile corridor is physically and functionally diverse, ranging from the urbanized area of Kansas City from 31st and Prospect east to I-70, to industrial areas to the east and west of I-435, to commercial strip areas in eastern Kansas City, Independence, and Blue Springs, to nearly rural segments of the highway in western Blue Springs and between Blue Springs and Grain Valley. Retail and commercial uses predominate along the corridor, as well as sizeable areas of industrial, business park, open space, and residential uses in various segments along the corridor.
The western portion of the identified corridor study area, following 31st Street from I-70 west to Bruce R. Watkins Parkway, is solely under the jurisdiction of the City of Kansas City, Missouri. The Missouri Department of Transportation (MoDOT) controls the jurisdiction of the remainder of the corridor, officially designated US 40 Highway, from I-70 in Kansas City east to its reunification with I-70 eastbound at Grain Valley. US 40, of course, is a federal highway and MoDOT has officially designated US 40 as the “relief route” for I-70 when the interstate has significant congestion or experiences delays due to major accidents. 40 Highway frequently serves as an alternate route for spectators accessing the Truman Sports Complex, just to the south of I-70 on Blue Ridge Cutoff.
The various cities and jurisdictions along the entirety of 40 Highway have planned and will continue to plan for various cross streets intersecting with the corridor and for various focus areas along 40 Highway over time. This effort, as part of the Creating Sustainable Places Initiative, does not constitute a comprehensive and detailed plan for every block along the entire 14 mile corridor. Instead, the various communities, along with MARC, identified four focus areas for the completion of conceptual planning that may help further redevelopment and revitalization efforts along the corridor.
Each selected focus area represents a distinct development type, including Urban (the 31st and Prospect area), Post World War II suburban (Blue Ridge Cutoff area), 1980s suburban (Noland Road), and greenfield suburban (Adams Dairy Parkway).
Evolution of 40 Highway
Until the 1960s, 40 Highway served as the main highway connecting Kansas City to St. Louis. The corridor developed rapidly during the post World War II period as one of the most prominent and thriving corridors on the Missouri side of the Kansas City metro area. Similar to how other corridors from the period evolved, 40 Highway grew during the 1950s through the development of small motels, fast food outlets, grocery stores, and convenience stores. The Blue Ridge Mall, at 40 Highway and Blue Ridge Boulevard, opened as one of the first malls in the metro area in 1958 and served a booming suburban growth area in eastern Kansas City, Independence, Raytown, and surrounding areas.
During the 1960s, the state completed construction of I-70 across Missouri, and 40 Highway lost a good deal of its traffic volume. However, because commercial development did not emerge along most of the interchanges with I-70 from Kansas City east into Independence, 40 Highway continued to represent a key commercial corridor in the minds of local residents. From the 1960s through the 1980s iconic restaurants and destinations along 40 Highway, such as V’s Ristorante
Highway 40 Corridor Plan | Focus Area Plans 40 | Existing Conditions
and Cool Crest, advertised widely and drew a metro-wide following. Stephenson’s Orchard at 40 Highway and Lee’s Summit Road also drew visitors from throughout the area. Blue Ridge Mall continued to thrive through the 1960s and 1970s.

During the 1980s the competitive position of 40 Highway began to change as newer suburbs and commercial areas emerged in the metro area. Blue Ridge Mall declined in prominence as the Independence Center mall at 291 and I-70 opened, along with surrounding retail areas. Commercial areas along 7 Highway in Blue Springs and around 7 Highway and I-70 continued to develop, diverting energy away from the corridor. Elsewhere, the Bannister Mall and shopping centers in Lee’s Summit also began to attract retail spending that 40 Highway had formerly enjoyed. The area around 40 Highway and Noland Road, however, developed as a notable retail center for Independence and eastern Kansas City, as the Noland Fashion Square opened in 1987 and Sam’s Club opened a few years later.
During the 1990s and 2000s, the combination of relatively slow population growth in the communities adjacent to 40 Highway and the introduction of new retail areas further exacerbated 40 Highway’s decline. The area around I-70 and Little Blue Parkway developed with a mixture of big box stores, restaurants, the Independence Events Center, and various smaller retail stores, and very quickly the area around 40 Highway and Noland Road lost vitality. Sam’s Club closed its store at Noland Road and subsequently opened a new store near 291 Highway. The new Adams Dairy Landing development at I-70 and Adams Dairy Parkway opened in Blue Springs with a mix of big box retailers such as Kohl’s and Target along with in-line retailers flanking the interstate. In turn, vacancies and economic performance of businesses along both 40 Highway and 7 Highway in Blue Springs worsened.
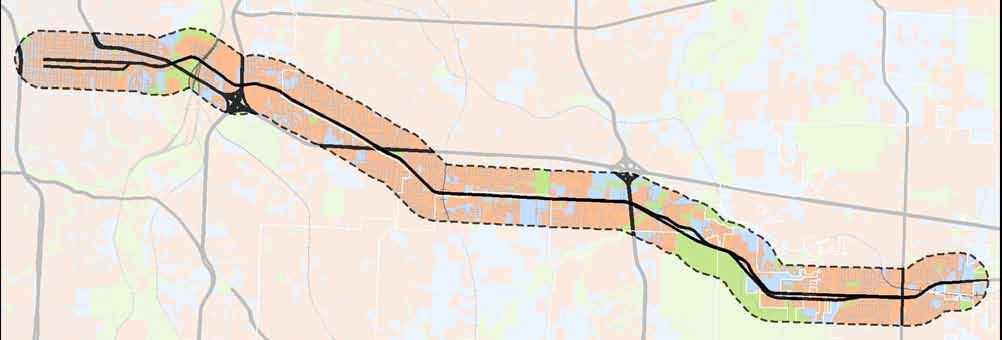
Existing Conditions | 41
31ST Street n ol and r o ad Blue r i dge Cutoff 470 40 7 435 40 71 350
Figure 12: Status of land along 40 Highway
Adams dairy Pky
Highway 40 Corridor Plan | Focus Area Plans 42 | Existing Conditions Figure 13: Land status node comparison 1 2 3 4 1 3 2 4 37% 3% 50% 10% 31st and Prospect Developed Protected ROW Vacant 15% 7% 67% 11% Adams Dairy 57% 0.2% 30% 12% Noland Road 35% 34% 21% 10% 40 Highway Study Area (1/2 mile radius) 40 Highway Study Area (1/2 Mile Radius) 31st Street and Prospect Avenue Noland Road & 40 Highway Blue Ridge Cutoff & 40 Highway Adams Dairy Parkway & 40 Highway 43% 1% 47% 9% Blue Ridge Cutoff
Zoning and Land use

As illustrated in Figure 16, a significant proportion of the total acreage along the 40 Highway Corridor carries general commercial or retail zoning and has retail or commercial as the existing land use. A total of 1,839 acres along the corridor, or 15 percent of the total land area along the 15-mile corridor of 11,666 acres, is zoned in some form of general commercial. This amount of land zoned as commercial is similar to the magnitude of land zoned for commercial uses in the entire downtown of Kansas City. Other prominent zoning classifications along the corridor include neighborhood residential designations along 31st Street and Linwood Boulevard in Kansas City, industrial designations in the Blue Valley and areas to the east, residential and general purpose business land uses in the areas between Independence and Blue Springs, and industrial land uses in the eastern portion of Blue Springs.
Parks and Open Space
The vast majority of the 40 Highway Corridor (including areas a half mile to the north and south) does not include any park or open space areas or amenities, in keeping with the pattern of similar commercial corridors around the country. However, 40 Highway passes by or near a number of sizeable and notable park and open space areas that serve local communities as well as Jackson County and the metro area as a whole. Near 31st and Prospect, 31st Street passes near Central Park, a small neighborhood park serving the nearby areas in the city. Small neighborhood parks and community gardens also line various parcels along Linwood Boulevard in the study area. Although not officially designated as a park, the significant open space that lines Emanuel Cleaver II Boulevard, at 31st Street and to the south, provides a visual and aesthetic relief for area residents and passers by. Blue Valley Park, located about a half mile north of 40 Highway on the west side of the Blue River, provides regional park and open space facilities for the eastern part of Kansas City, Missouri.
Roberts Park, to the north of 40 Highway on Blue Ridge Cutoff, provides park facilities for the surrounding neighborhood. Adair Park, located between 40 Highway and I-70 on Lee’s Summit Road, provides small fields and equipment for the surrounding neighborhoods. Blue Springs Lake and Fleming Park dominate the southwestern part of Blue Springs, just to the south of 40 Highway, and provide regional scale recreation, ranging from camping and boating to hiking trails and other amenities. The Adams Pointe Golf Course, north of 40 Highway between Blue Springs and Grain Valley, offers one of the largest golf courses in eastern Jackson County.
In addition, a number of existing and planned trails (shown on Figure 18) cross the 40 Highway Corridor, including the trails along the Little Blue River in eastern Independence and Kansas City, Missouri, and planned trails along the Blue River in Kansas City.
Existing Conditions | 43
Conservation
Blue Valley Park Robert’s Park Adair Park Central Park Burr Oak Woods
Area Adams Point Golf Course Fleming Park & Blue Springs Lake
Figure 14: Land status node comparison
Commercial or Mixed use Zoning
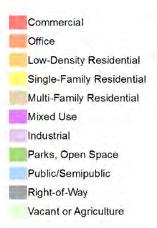
downtown Kansas City: 1,253 acres
31st Street / 40 Highway Corridor (.5 Mile Buffer): 1,839 acres
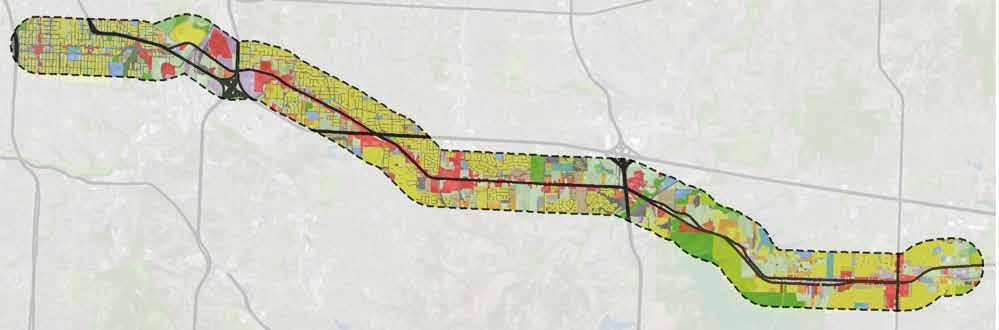
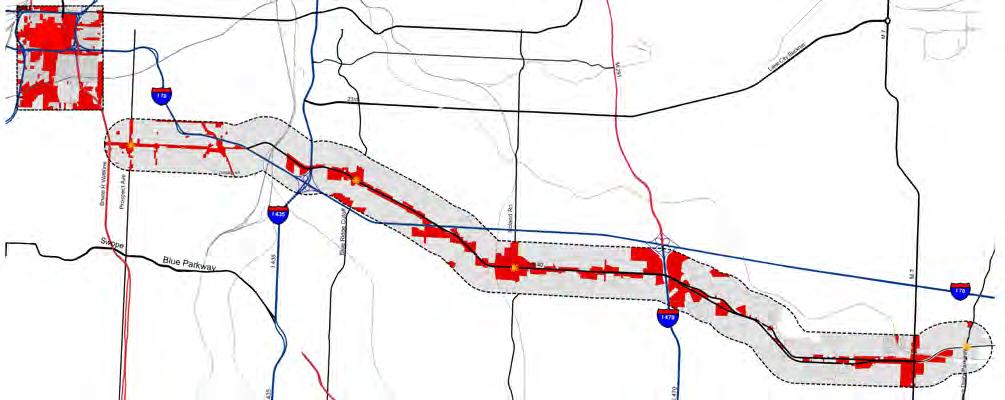
Highway 40 Corridor Plan | Focus Area Plans 44 | Existing Conditions
Figure 15: Commercial zoning comparison between Downtown Kansas City and the 40 Highway study area
31ST Street n ol and r o ad Blue r i dge Cutoff 470 40 7 435 40 71 350 Adams dairy Pky
Figure 16: Existing Land Use
Transportation and Mobility
The following section presents an analysis of current transportation conditions in the corridor, including a transportation profile. It includes information that addresses existing mode splits and rates of car ownership, transit service, non-motorized facilities (pedestrian and bicycle), and traffic and circulation. It concludes with an overview of the transportation-specific regulatory framework that exists within the corridor’s municipalities. This section also discusses observed issues and potential opportunities associated with the transportation system by mode.
Transportation Goals and Priorities
As a result of various past and current planning efforts along the 40 Highway Corridor, transportation goals and priorities have been developed for the study area. These include:
• Promoting sustainable development via targeted transportation improvements and investments along the 40 Highway Corridor and across jurisdictional boundaries.

• Leveling the playing field for all modes of transportation and improving safety and comfort for all users of the corridor through the creation of more “complete streets”.
Corridor Transportation Profile

The corridor study area includes communities within a half mile of 40 Highway from Prospect Avenue in Kansas City to Adams Dairy Parkway in Blue Springs. As a part of this existing conditions analysis, the project team documented and analyzed the existing resident and employee commute mode splits, the existing rates of car ownership, and the rates of vehicle, pedestrian, and bicycle collisions along the corridor.
Mode Splits
Automobile use is the predominant transportation mode in traveling to, from, and through the corridor. Nearly 84 percent of residents living along the 40 Highway Corridor drive alone to work, which is comparable to the mode share in Blue Springs and Independence and sightly higher than for residents in Kansas City, where there are slightly fewer people driving to work alone. Only 8 percent of residents carpool to work, which is slightly higher than the 7.4 percent in Kansas City and slightly lower than the percent of residents car pooling in Blue Springs and Independence. Table 19 outlines a breakdown of resident travel mode splits as well as the city-wide travel mode rates from Blue Springs, Independence, and Kansas City. Generally speaking, residents along 40 Highway drive more, take transit less, and walk less than the overall population in Kansas City, Missouri. The travel rates by mode are similar to the city-wide travel rates in Blue Springs and Independence, which reflects the more auto centric development patterns of the suburban areas in contrast to Kansas City.
Vehicle Ownership

As outlined in Table 20, only about 28 percent of households living within a half mile of 40 Highway have either one vehicle or none at all. This rate is higher than the overall, city-wide rates for Blue Springs (15.9 percent) and Independence (25.3 percent) but lower than the overall city-wide rate for Kansas City, Missouri (at 33.5 percent).
Existing Conditions | 45
d r IVE A LO n E C A r POOL Tr A n S IT wALK B IKE TAXI wO r K AT H OME 40 Highway Study Area 83.8% 8.5% 1.9%1.5% 0.4% 2.0% 2.9% Blue Springs 84.6% 9.1% 1.0% 0.8% 0.2% 1.2% 3.1% Independence 85.5% 9.2% 0.7% 0.8% 0.1% 1.0% 2.6% Kansas City 80.5% 7.4% 3.6% 2.1% 0.3% 1.1% 3.4%
Source: American Community Survey 2011 5-year Estimates
Table 19: Corridor and City Mode Splits
83.8% 1.9% 0.4%
1.5%
40 Highway Travel Modes
Collisions and Safety
The project team analyzed STARS crash report data from the 2002 to 2011 period for collisions along 40 Highway involving automobiles, pedestrians, and bicyclists. Table 21 summarizes the total number of collisions along the corridor by year and type, including the number of fatalities.
Most collisions, regardless of type, have concentrated along the ends of the corridor - along 31st Street in Kansas City, and along 40 Highway in Blue Springs. As illustrated in Table 21, the corridor has witnessed a recent decrease in auto collisions, most likely due to a decrease in overall traffic levels. Communities around the nation have observed similar downturns in traffic levels and accident rates due to the recent recession. However, while overall collision rates along 40 Highway have decreased, the rate of pedestrian collisions has increased.
Issues and Opportunities
As noted, a few key issues arise from the existing conditions data for the 40 Highway Corridor, including the following takeaways:
• The automobile is clearly the dominant form of transportation in and around the corridor.
• Collision rates are relatively high, although they have decreased over the last few years in line with the economic recession. As the economy recovers, traffic levels and collision rates are likely to increase as well. Various opportunities exist related to the transportation profile of the study area. While the existing land use along the corridor is not transit supportive, existing residential populations exhibit low auto ownership rates and are therefore primed for transit use.
Highway 40 Corridor Plan | Focus Area Plans 46 | Existing Conditions
nO n E O n E T w O T H r E E O r M O r E 40 Highway 1.3% 26.6% 45.5% 26.6% Blue Springs 0.4% 15.5% 51.0% 33.1% Independence 1.70% 23.6% 46.5% 28.2% Kansas City 4.3% 29.2% 43.1% 23.4%
Source: American Community Survey 2011 5-year Estimates
Y E A r T OTAL A u TO C O LLISIO n S In V OLVI n G B I CYCLES In V OLVI n G P E d EST r I A n S FATALITIES 2011 155 1 52010 175 0 4 1 2009 212 1 8 2 2008 227 0 42007 286 0 5 2 2006 225 3 2 1 2005 284 0 42004 300 0 4 1 2003 252 2 1 3 2002 294 0 2 -
Table 20: Corridor and City Household Vehicle Ownership
Source: Missouri State Highway Patrol (STARS Crash Reporting)
Table 21: Collisions (Auto, Auto +Bicycle, Auto + Pedestrian) along the study corridor, 2011 – 2002
Transit Service
Existing Service
The Kansas City Area Transportation Authority (KCATA) provides transit service on the Missouri side of the Kansas City area and Wyandotte County. KCATA lines traverse or use the 40 Highway Corridor at several points; however, no lines service the entirety of the corridor, and large portions of 40 Highway do not have access to any bus or transit lines. Table 22 chronicles existing transit routes, headways, service hours, and ridership along the 40 Highway Corridor. See Figure 19 for a map of transit lines in the study area.
Planned Service
Investments along 40 Highway include the potential for either BRT or arterial bus service:
• The Smart Moves Plan identifies an Urban Corridor network. The Urban Corridors include Eastern Jackson County routes, roughly following US 24 / Truman Road and / or 40 Highway. The Urban Corridor for eastern Jackson County has not yet been defined. It could include one or two of three possible eastern corridors: US 24 / Independence Avenue, Truman Road, and 40 Highway. Each of these alignments has an eastbound service addition that can be added at a lower frequency of service. The above Urban Corridors can be seen as an initial system of bus rapid transit corridors.
• Potential frequencies: 10 minute peak, 15 off-peak
• BRT would operate in mixed traffic
There is potential for a commuter rail service along the I-70 East Corridor (or Blue Springs Line).
» The rail line includes the existing rail of Kansas City Southern’s (KCS) Mexico Subdivision as well as Union Pacific’s Pixley Subdivision. Currently there are five (5) trains per day on the KCS line with four of these passing at night. The majority of the new
rail corridor involves a connection from the junction of the KCS and UP lines to the Rock Island Line. Preliminary discussions with KCS indicate the opportunity to obtain temporal separation for passenger rail operations for an annual fee (not yet determined). This corridor has the potential for further extension beyond Jackson County east to Odessa.
» update from KCATA – While the political leadership in Jackson County had championed the installation of commuter rail through eastern Jackson County in 2012 and had even planned to place a sales tax issue on the ballot to initially fund the system, the project is on hold for the time being. Negotiations with Kansas City Southern regarding access to KSC lines for the commuter rail encountered difficulties, and for the time being the commuter rail possibility is off the table, at least politically, in Jackson County.
Existing Conditions | 47
S E r V ICE Pr O VI d E r/ rO u T E P E AK H E A d w AY S S E r V ICE H O u r S AVE r AGE d AILY r I d E r S HIP nO d E ( S ) S E r V E d KCATA 28 Blue Ridge30 minWeekday – 4:30 AM to 10:42 PM Saturday – 6:48 AM to 7:59 PM Sunday – No service 2,425 (Weekday) 1,260 (Saturday) 525 (Sunday) Blue Ridge 28X Blue Ridge Express 30 minWeekday – 4:56 AM to 6:37 PM Blue Ridge 31 31st Street 15 min Weekday – 4: 36 AM to 12:41 AM Saturday – 5:21 AM to 12:41 AM Sunday – 5:21 AM to 10:41 PM 2,288 (Weekday) 996 (Saturday) 571 (Sunday) 31st & Prospect; Blue Ridge 251 TMC Lakewood Connector 60 minWeekday – 9:00 AM to 2:56 PM 77 (Weekday) Blue Ridge; Noland 47 Roanoke 30 minWeekday – 4:38 AM to 7:31 PM Saturday – 4:56 AM to 7:24 PM Sunday – No service 1,521 (Weekday) 670 (Saturday) Blue Ridge
Source: KCATA (Ridership figures represent daily averages from January through May of 2012)
Table 22: Exiting Transit Routes Servicing the Study Corridor
Issues and Opportunities
As outlined above, the existing framework of the 40 Highway Corridor presents a range of challenges in providing enhanced transit service. However, future planning for the corridor study area and the focus areas presents a range of opportunities for the various communities with regard to transit.
Issues:
• Land uses - The current land uses (with residential densities averaging 2.2 dwelling units per acre around the suburban focus areas) and urban framework (in terms of surrounding street networks and connections) do not support the installation of higher frequency (and, in turn, higher cost) transit investments in the short term. The communities may have the opportunity to introduce enhanced transit service in phases along with changes in land uses and residential densities along the corridor over time.
• jurisdictional issues – Transit throughout the Kansas City metro area is funded at the city level, and a framework for a regional transportation tax does not currently exist. This framework complicates the potential for the communities along 40 Highway to jointly fund and implement corridor-wide transit improvements.
• discontinuous existing service – While an express bus runs from Downtown Kansas City to Blue Springs, a continuous bus line does not operate along the entirety of the 40 Highway Corridor at this time. In addition, the Adams Dairy Parkway area (at 40 Highway) does not have any bus service at this time.
• Infrequent existing service – The bus lines that do operate along the 40 Highway Corridor operate infrequently and the nature of the pedestrian environment at many of the suburban locations (dominated by surface parking lots and lack of places to safely and comfortably wait) hampers the ability to transfer from 40 Highway buses to other lines in the area.
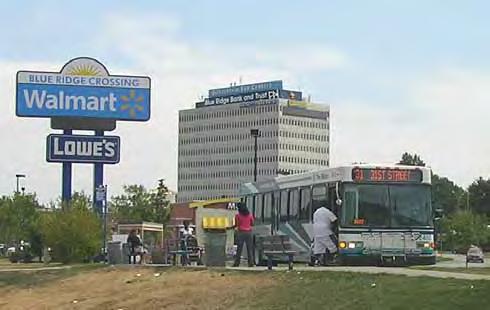
• Challenges with existing transit funding – The KCATA, along with the other transit agencies in the metro area, has unfortunately followed a pattern in recent years of declining levels of transit service. Cuts in transit due to budget issues result in ridership decreases, which in turn causes subsequent additional budgetary
issues. These funding challenges in turn cause the agency to further cut service, leading to another cycle of decreased ridership.
• High vehicle speeds – Observed and posted vehicle speeds are relatively high along some segments of the corridor, which creates potential complications for buses pulling in and out of traffic (assuming mixed traffic operations where buses utilize the same lanes as other vehicles)
• need for enhanced connections to 40 Highway from surrounding areas – In addition to providing continuous bus service along 40 Highway itself, the communities could improve connections from the corridor to surrounding neighborhoods and destinations (including enhanced bicycle connections, sidewalks, bus lines serving local neighborhoods, etc.).
Highway 40 Corridor Plan | Focus Area Plans 48 | Existing Conditions
Existing Transit Stop at Blue Ridge Crossing
Opportunities:
Despite the numerous challenges outlined above, the communities along 40 Highway may be able to seize two key opportunities to enhance transit service along the corridor:
• The Smart Moves plan identifies the corridor for potential Bus Rapid Transit investment. This improvement could help stimulate redevelopment along parts of 40 Highway and improve the connectivity of the overall corridor study area.
• The Smart Moves plan identifies the I-70 corridor in general for potential commuter rail investment. Parts of the commuter rail line corridor may overlap with the 40 Highway Corridor.
• These potential transit enhancements provide opportunities to catalyze improvements to 40 Highway, stimulate development opportunities, and increase access and connectivity along the corridor.
Bicycle and Pedestrian Infrastructure
Existing Infrastructure
Bicycle Facilities
As mapped in Figure 18, no bicycle facilities exist currently along the length of the corridor. Facilities that connect to the corridor include:
• Class I (Multi-use path) along Adams Dairy Parkway in Blue Springs
• Class II lanes along 7 Highway in Blue Springs
Bicycle facilities within a half mile radius of each node include the following:
• Blue Ridge Cutoff - Class III route along Blue Ridge Cutoff
• Noland Road - No existing facilities
• Adams Dairy Parkway - Class I off-street path along Adams Dairy Parkway
• 31st Street and Prospect Avenue - Class III route along E 29th Street, E 30th Street, and Benton Boulevard
Pedestrian Facilities
Sidewalks improve safety for pedestrians and enhance the sense of community and connection within a neighborhood or commercial district. Figure 20 shows the sidewalk network throughout the length of the corridor, showing a fairly complete network on 31st Street, to the west of the Blue River in Kansas City, Missouri, although many of the sidewalks are in fair or poor condition. The sidewalk network is missing and discontinuous for most of the eastern portion of the corridor, from I-70 to the east through Independence and Blue Springs. The following list presents an overview of existing pedestrian facilities in the study area:
• 31st Street and Prospect Avenue
» Sidewalks exist along streets at this node, though many are in poor condition
• Blue Ridge Cutoff
» No sidewalks or marked crosswalks
» Limited or absent pedestrian infrastructure, creating low levels of pedestrian convenience, comfort, and amenities
• Noland Road
» Sidewalks exist east of Noland on 40 Highway
» No marked crosswalks at the intersection of 40 Highway and Noland Road - creating a safety concern for pedestrians traversing the area
» No sidewalks west of Noland on 40 Highway
• Adams Dairy Parkway
» Sidewalks exist along Adams Dairy Parkway, but not along 40 Highway
» No marked crosswalks at intersection
» Multi-use bike/pedestrian path along Adams Dairy Parkway
Existing Conditions | 49
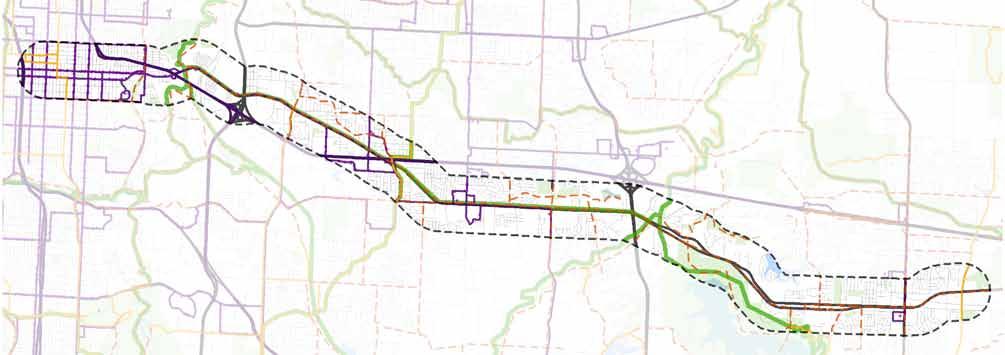
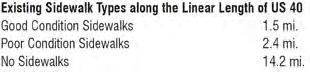
Highway 40 Corridor Plan | Focus Area Plans 50 | Existing Conditions
k k § 70 Bruce R Watkins 23rd Swope Blue Parkway Bruce R Watkins I 435 Prospect Ave Raytown Rd Hardesty Ave Manchester Tfwy S Eman 31st Street Swope Park Blue Valley Park 0 1 2 3 4 0.5 Miles Good Connectivity, Poor Condition Sidewalks Poor or noConnectivityforCyclistsandPedestrians (Kansas State University) Figure 18: Walkability - Sidewalks: 31ST Street 31ST Street n ol and r o ad n ol and r o ad Blue r i dge Cutoff Blue r i dge Cutoff 470 470 40 40 7 7 435 435 40 40 71 71 350 Adams dairy Pky Adams dairy Pky
Figure 17: Study Area Transit Lines and Bikeways
Planned Improvements:
There are various planned improvements to bicycle and pedestrian facilities in the study area. These include projects identified in the Trails KC Plan and the Little Blue Valley Area Plan, as detailed below:
• Trails KC Plan:
» Blue River Trail/Katy Trail where 40 Highway crosses the Blue River
» Van Brunt on-street connector at 40 Highway and Van Brunt
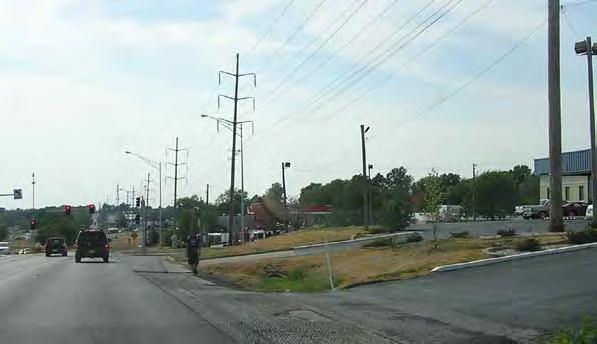
• Little Blue Valley Area Plan:
» New pedestrian zone at 40 Highway/Noland –Includes improvements to the pedestrian level of service at the intersection, coupled with the adoption of a new zoning or district overlay designation that would require a higher level of pedestrian design for future developments.
Issues and Opportunities
Bicycle and pedestrian movement along 40 Highway currently faces a significant set of challenges, including:
• Auto-oriented nature of the corridor
» Pedestrian facilities are often non-existent or in poor condition, even where transit exists and at transit transfer points/nodes. In particular, several of the higher traffic intersections with 40 Highway do not have any marked crosswalks.
» No major bicycle infrastructure or amenities along most parts of the corridor, though wide shoulders present an opportunity for future improvements
• Access to the corridor
» If investment is made in the corridor and development occurs, there is a need to develop connections to the corridor itself from the
surrounding communities (connecting bicycle/pedestrian infrastructure, transit, etc.).
However, despite these challenges, communities along 40 Highway may be able to leverage a number of opportunities to improve bike and pedestrian access along the corridor.
• The relatively wide right of way and wide existing shoulder along much of the 40 Highway Corridor presents additional space, which could be available for enhanced bike and pedestrian improvements along various segments of the corridor.
• The presence of a number of larger vacant properties along 40 Highway presents opportunities to start with a “fresh slate” with regard to redevelopment and to create and implement site plans for redevelopment that address all modes of travel and provide improved facilities and amenities for people wishing to walk or bicycle.
Existing Conditions | 51
The number of driveways and lack of sidewalks along 40 Highway present challenges for pedestrians
Auto Traffic and Circulation
Existing network and Volumes
US 40 Highway ranges from a two-lane urban arterial on the western edge of the study area, to a higher speed suburban parkway on the eastern edge of the study area. Posted speed limits at each study area node are as follows:
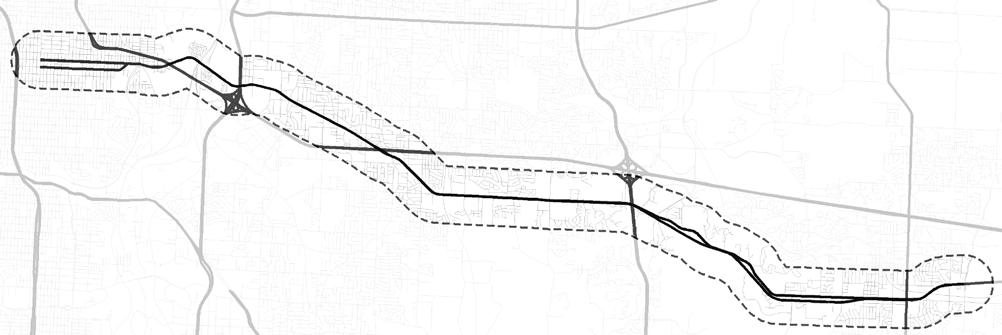
• 31st Street & Prospect Avenue: 35 mph
• Blue Ridge Cutoff: 40 mph
• Noland Road: 40 mph

• Adams Dairy Parkway: 45 mph
Existing traffic volumes are presented, by node, in Table 23. The communities and MODOT should collect data on actual vehicle speeds to compare them to the posted speed limits.
Figure 19: Traffic Control: Speed Limits and Stop Lights

Comments:
This chart shows how the severity of injuries goes up as vehicles speeds increase, generally when an accident occurs between a vehicle traveling over 36 miles per hour and a pedestrian it typically results in a fatality.
Highway 40 Corridor Plan | Focus Area Plans 52 | Existing Conditions
9 8 7 6 5 4 3 2 1 0 AIS Severity (6 = Fatal) Speed 1012141618 30 Usually Fatal Injuries 2022242628 40 323436384244 Small Injuries Pedestrian Safety Vehicle Impact Speed vs. Pedestrian Injury in Midtown
k k § ¨ 470 § 435 Wildwood Lake Park £ ¤ 40 I 70 I 435 US 40 Blue I 435 I 470 Noland Rd Blue Ridge Cutoff Raytown Rd S Crysler Ave BlueRidgeBlvd SLittleBluePky N E L a ke wood Way Manchester Tfwy NWWoodsChapelRd Stadium Dr k Nodes Water Bodies Existing Park Roads 1/2 Mile from Node HWY 40 Hwy 40 Study Area (1/2 Mile Buffer) 40? HWY 40?
Highway System Road Classification/Function Collector Freeway/Expressway Interstate Minor Arterial Principal Arterial Stoplight 35 mph (Posted Speed Limit) 45 mph (Posted Speed Limit) 55 mph (Posted Speed Limit) 45 mph (Posted Speed Limit) 55mph(Posted SpeedLimit) 40mph(Posted SpeedLimit) Blue Springs Cutoff 31ST Street n ol and r o ad Blue r i dge Cutoff 470 40 7 435 40 71 350
Issues and Opportunities
With regard to auto traffic and circulation, MoDOT has noted that 40 Highway is identified as the official “relief route” to I-70 in Jackson County when the interstate is closed or congested. This framework suggests that 40 Highway must remain a four lane facility that can, when necessary, accommodate a higher level of traffic at peak times. However, the presence of the interstate means that during most times of the day the traffic along 40 Highway will most likely accommodate local trips and destinations. This orientation creates the opportunity to create more locally focused nodes of redevelopment along the corridor, as well as opportunities to provide facilities for additional transportation modes including transit, bicycles, and pedestrians.
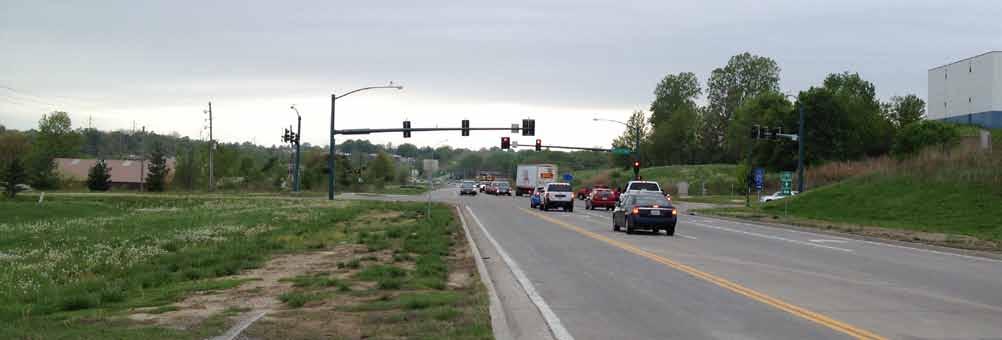
Existing Conditions | 53
In T E r S ECTIO n / nO d E A d T ( 2010) AM P E AK H O u r Tr A FFIC V O L u M E ( 6:00 – 8:00 AM) PM P E AK H O u r Tr A FFIC V O L u M E (4:00 – 6:00 PM) VehiclesVehicles Pedestrians Vehicles Pedestrians Blue Ridge Cutoff 14,426 4,457 0 6,378 0 Noland Road 19,181 -Adams Dairy Parkway 7,513 -31st and Prospect 12,726 - - --
Source: MoDOT and ESRI
Table 23: Traffic Volumes at Study Nodes
40 Highway east of Adams Dairy Parkway
COMMUNITY ENGAGEMENT
Community Engagement | 55 4
Community Engagement
The cities of Kansas City, Independence, Lee’s Summit, and Blue Springs along with MARC, led a public outreach process to gather input concerning the future of the 40 Highway Corridor study area and the four focus areas which were identified by MARC at the outset of the project. The focus areas include the commercial properties around the intersections of 31st Street and Prospect Avenue and US 40 Highway and Blue Ridge Cutoff, Noland Road, and Adams Dairy Parkway.
The project team reached out to engage the community and gather input through stakeholder meetings, a series of open houses, dedicated websites and online surveys and digital dialogues.
Stakeholder Meetings
The project team conducted meetings with stakeholders along the 40 Highway Corridor throughout the project in order to gain input concerning key ideas, review preliminary and final concepts for the plan, and discuss implementation ideas. In Kansas City, Missouri, the project team briefed the local neighborhood council and met with representatives from city council on several occasions. The team also met with various property owners in the area around 31st and Prospect. At 40 Highway and Noland Road, the team met with some of the key property owners in the focus area. The team conducted a design work session with city council members and representatives from both Kansas City, Missouri and Independence in order to review and develop a final conceptual plan for the focus area at Noland Road, addressing future land uses, open space, and transportation connections. In Blue Springs, the team conducted a briefing of the Blue Springs City Council and also met with economic development officials concerning the concepts and future plan for the 40 Highway and Adams Dairy Parkway area. Throughout the project, the team reached out to the mayors and related staff from the various cities, as well as representatives from the Missouri Department of Transportation, in order to review the progress of the plan and discuss key issues.
MindMixer
MARC was responsible for hosting, promoting, and monitoring the MindMixer application for the Creating Sustainable Places initiative through the planning process. This online engagement site encouraged members of the public to submit and share ideas concerning how to
improve the corridor and the focus areas in an “interactive online town hall” conversation. Members of the public submitted ideas in response to different topics posted to the site. There were just over 30 people that provided input on questions related to the 40 Highway Corridor. In response to the goals for economic development along the corridor, participants supported creating sustainable districts that remain successful as tenants change over time and support the growth and sustainability of locally owned businesses. In regards to improvements to enhance the feeling of safety for walking and biking along the corridor people supported separate bike paths and sidewalks. Participants’ ideas and comments can be reviewed in more detail in Appendix A.
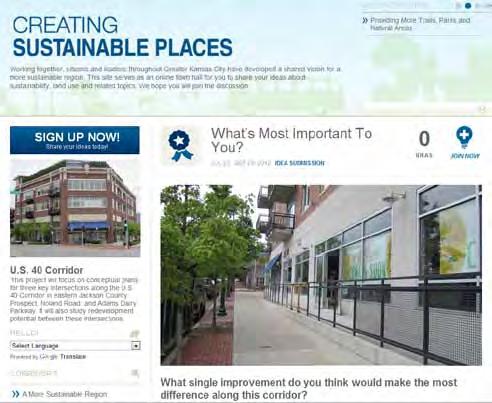
Highway 40 Corridor Plan | Focus Area Plans 56 | Community Engagement
The MindMixer website hosted by MARC generated an online conversation about issues and ideas impacting the 40 Highway Corridor
Public websites
A portion of the website for the Mid America Regional Council focused on the 40 Highway planning effort and included background documents and presentations as well as links to online surveys. In addition, individual city websites included links to the MARC web page and the online surveys. The online surveys collected responses to the same set of questions presented at the public meetings for those who were unable to attend.
Public Open Houses
Three rounds of public meetings were held to gather feedback and inform citizens about the progress of the project. Due to the length and diversity of the corridor, each round of public open houses was carried out over three separate evenings at different locations along the corridor. Meetings were held in August and November of 2012 and the end of April / beginning of May 2013. In advance of the three rounds of public open houses multiple strategies to notify the public were utilized including:
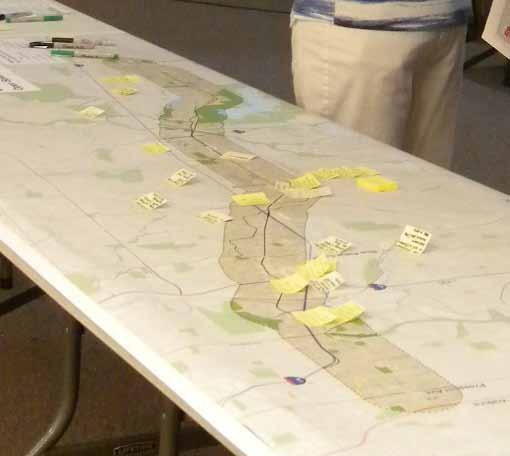
• Distribution of digital flyers through e-blasts via each city’s email list serves and notices posted to the cities’ and MARC’s websites.
• Posing fliers at key locations, including dissemination on KCATA bus lines for all affected communities;
• Deployment of fliers in children’s backpacks to 15 schools representing KCMO, Lee’s Summit, Independence and Blue Springs;
• Traditional press releases;
• Use of social media sites including Twitter and Facebook (Kansas City and Independence); and
• Announcements at community churches.
The format for each meeting included an open house session with presentation boards providing background
conditions and information concerning the project’s evolution. The open house period was followed by an informative presentation and an instant feedback keypad polling session where participants responded to a set of questions aimed at understanding their preferences for the corridor. Due to the constraints of the public process the results of the public feedback are not representative of the communities as a whole; they are intended to gather opinions, concerns, and ideas from those who are impacted by changes to the corridor and who have first-hand experiences of the corridor either as nearby residents, business or property owners, or commuters.
Who Participated:
A total of 173 people attended the community meetings at various locations along the corridor. The MARC website provided a link to the online versions of the keypad polling for several weeks following each public open house and collected 157 additional responses. The majority of participants were nearby residents of the corridor, with some representation from business owners and property owners. The results reflect the views of participants living and working in Independence, Kansas City and Blue Springs as well as some from Lee’s Summit and other places throughout the metro area. Many of the responses are from participants who use the corridor for
Community Engagement | 57
During the 1st round of public meetings participants added their concerns and ideas to a map of the corridor.
commuting. Detailed responses from each meeting are included in Appendix A.
2. Which of the following do you consider most important for the Hwy 40 Corridor Plan? (Choose three) Polling question from Public Meeting #1 - Participant’s priority for improvements to the 40 Highway Corridor (Keypad and Online Responses):
Public Open House #1 – August 28th - 30th, 2012
The initial round of keypad questions, hosted over three evenings, was aimed at understanding the communities’ goals, preferences, and priorities for the 40 Highway Corridor. In this first round of public meetings the same set of questions was asked of all meeting attendees and online respondents regardless of their geographic location, whereas in the second and third round meetings, questions were targeted to specific nodes along the corridor.
Some of the key findings from the first round of keypad and survey questions include:
Priorities for the Corridor
The top three most important improvements identified for the corridor, which laid the foundation for the planning effort, included:
1. Improving the overall aesthetic appearance;
2. Introducing a greater mix of uses (retail, residential, etc.); and
3. Improving the bicycle safety, access and circulation of the corridor.
After establishing the overall priorities the questions dug deeper into participants perceptions of existing conditions along the corridor and key community, economic, aesthetic, transportation, and environmental elements.
Aesthetics:
Only two percent of respondents responded positively about the appearance of the corridor, whereas 85 percent rated the corridor’s appearance as poor or very poor, demonstrating the lack of aesthetic appeal of the corridor. Improving the streetscape’s aesthetic appeal was the most important community consideration, capturing support from over 70 percent of the participants. There was support to improve the quality of signage for adjacent
Improve the overall aesthetic appearance
Introduce a greater mix of uses (retail, residential, etc.)
Improve bicycle safety, access, & circulation
Create a plan of key parcels for redevelopment
Improve pedestrian safety and circulation
Increase employment opportunities

Improve auto circulation & safety (reduce congestion)
Improve open space amenities and connections
Introduce new housing to attract new residents
businesses and to manage large outdoor signage such as billboards which are prevalent along some parts of the corridor. Enhancing signage to incorporate street addresses so that businesses are easier to locate for both visitors and locals received significant support.
Economics and Land Use:
The most important goals for economic development along the corridor were removing dilapidated buildings or uses, promoting the growth and sustainability of locally owned businesses, and creating sustainable districts that remain successful even as tenants change over time.
Respondents believed there was too much strip commercial or retail development, as well as auto sales and service types of businesses along 40 Highway. The top three land use issues to address along the corridor included:
1. Economic development or attracting new businesses;
Highway 40 Corridor Plan | Focus Area Plans 58 | Community Engagement
54% 39% 33% 29% 28% 26% 18% 16% 6% 0%
Other
2. Addressing retail/commercial building vacancies; and
3. Creating a mix of land uses in focus areas. At each of the focus areas the communities envisioned similar land uses including: neighborhood retail such as grocery stores, dry cleaners, banks and other everyday type businesses, as well as mixed use buildings and parks and open spaces.
There was general consensus (63 percent of responses) that there is an excess of parking spaces and lots along the corridor. Almost three quarters of the respondents supported shared parking between properties and cross connections between parking lots as redevelopment takes place.
Transportation:
The keypad polling, as well as follow up conversations with residents, revealed the need to provide accommodations for biking and walking, especially for future generations. The transportation issue raising the most concern among participants was the lack of infrastructure for bicyclists, with over 40 percent of participants indicating they would like to bicycle along 40 Highway either for transportation or recreation. The pedestrian safety issue of highest concern was the lack of marked crosswalks or poorly marked crosswalks contributing to the perception of 40 highway as a significant barrier. To increase walking and biking along the corridor, respondents prioritized installing sidewalks where they are missing and providing separated infrastructure for bicyclists and pedestrians through the use of a landscaped buffer.
Transportation concerns related to access management included the presence of too many driveways, confusing signage, and high traffic speeds. Respondents supported providing cross-connections to adjacent properties, installing medians with turn pockets and combining or reducing the number of driveways to improve access management along the length of the corridor.
The potential for rail transit along the 40 Highway Corridor received support from 45 percent of respondents who choose rail as one of their top two options for transit. Bus rapid transit was the second most popular transit option.
Environment:
The two most important environmental issues to address along the corridor included providing healthy street trees and vegetation and managing stormwater, thereby improving water quality. Forty five percent of the public responses showed support for implementing green building standards, such as LEED.
Public Open House #2 – november 13th – 15th, 2012
The second round of public meetings reviewed the findings from the first public meeting, and also presented and reviewed feedback on the conceptual land use alternatives for each of the focus areas and the potential roadway alternatives along the corridor. Boards depicted a series of information and images that provided examples of the types of developments that might proceed along the corridor in the future, including a variety of mixed land uses and development using many of the principles articulated as part of the Creating Sustainable Places program. Targeted questions were asked depending on the geographic location in which the meeting was held.
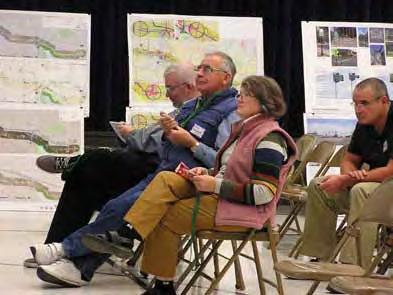
Community Engagement | 59
Meeting attendees participate in Keypad Polling at the second public meeting held in the City of Independence
40 Highway Overall recommendations:
Consistent with the answers from the first meeting, parkway features including landscaping and trees were the most desirable features to implement along 40 Highway from I-70 east through Blue Springs. People also liked the options of landscaped buffers, raised medians, bike lanes and bus rapid transit along 40 Highway.
When asked to prioritize elements of the transportation framework for the corridor, the parkway median, express bus/BRT and a multi-modal path for biking and walking emerged as the top three improvements.
Corridor Amenities:
There was generally support for all three signage and wayfinding strategies including:
• Better community wayfinding to guide people to libraries, city halls, downtowns, and other community destinations.
• Monumentation or wayfinding signs that identify city limits along the corridor.
• Signage on traffic signals and street signs that denotes address numbers.
Land use at key focus areas:
The majority of both keypad polling and survey respondents supported building heights of up to three stories at each of the focus areas, with some support for up to five stories. People attending the keypad session were supportive of increased density of 5-8 dwelling units per acre while people responding online preferred low density development at 1-3 dwelling units per acre. There was support for shared parking schemes.
In addition to the four nodes selected by MARC, the people who participated in the meetings and online survey chose Lee’s Summit Road and 40 Highway as an additional place to focus redevelopment efforts.
Preserving streams and floodplain areas as open space or park land along the corridor was popular among respondents.
Focus Areas
Due to the more urban context of the 31st and Prospect node, the meeting held in Kansas City addressed a unique set of questions specific to the western portion of the study area which follows 31st Street. The meetings held in the more suburban portions of the corridor shared a common set of questions that addressed corridor wide issues and had subsets of specific questions for each node.
31st and Prospect:
Community Amenities:
• Signage - There was general support for signage and wayfinding strategies, with the most support for wayfinding signs directing people to key destinations (such as libraries, nearby parks, and community centers).
• Parks/Plazas – Integrating parks or plazas into new shopping areas and opportunities for community gardens and linear parks along the boulevards and main streets received support from meeting participants.
• Public Art – Participants were most interested in integrated public art, such as benches, bike racks, etc. as part of the street design.
Land use: Feedback from the meeting demonstrated support for building heights of up to three stories, however people were less supportive of increasing density. The question about how much density people were open to received contrasting results from the keypad/online responses, with public meeting responses supporting low densities of 3-5 dwelling units per acre, whereas the online survey respondents were willing to accept 12-20 dwelling units per acre. Participants were supportive of regulating building setbacks to encourage
Highway 40 Corridor Plan | Focus Area Plans 60 | Community Engagement
redevelopment and implementing shared parking schemes and maximum parking requirements rather than minimums. When asked what other places in the city they would like the 31st and Prospect area to resemble people liked Westport and the City Market/River Market areas.
Transportation: The public weighed in on preferred street sections for major roads impacting the 31st and Prospect node. Along Linwood, from Bruce R Watkins to Van Brunt Boulevard, participants preferred a section depicting one lane in each direction with a center turn lane and a bike lane. On 31st Street and Prospect Avenue they preferred a three lane section with a single travel lane in each direction and a center turn lane with parallel parking. This option would provide for safer left hand turns and space for outdoor dining and wider sidewalks or bike facilities.
There was support for more transit facilities/express bus service along 31st Street and Linwood Boulevard and an interest in seeing a bus transfer station in the 31st and Prospect area.
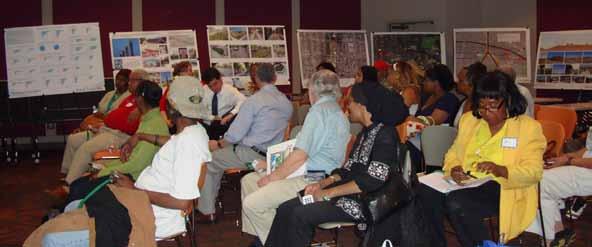
Noland Road and 40 Highway:
Vision: The most popular vision for the future of the Noland focus area was “A major community scale destination, representing a new ‘downtown’ district for this part of Independence and Kansas City” with 54 percent of keypad respondents selecting this option. The online survey preferred “A neighborhood center, with retail and office uses serving the surrounding neighborhoods” with 53 percent of responses.
Strategy: The top two strategies to address redevelopment at the Noland Road and 40 Highway focus area were to promote higher levels of density in order to create a destination district and to revise the current zoning to allow for a wider range of land uses.
Blue Ridge Cutoff and 40 Highway:
Vision: Both keypad and online responses showed support for developing “a neighborhood center, with retail and office uses serving the surrounding neighborhoods” as the vision for the future of the focus area.
Strategy: The majority of keypad respondents preferred to implement a form based code to encourage specific placemaking strategies, whereas the online responses supported revising the current zoning to allow for a wider range of land uses. Almost 20 percent of the online responses chose the “do nothing” option revealing that there is a sentiment among some people not to intervene with the current patterns of development at the Blue Ridge Cutoff focus area.
Community Engagement | 61
Participants at the third round of public meetings at 31st and Prospect.
Adams Dairy Parkway and 40 Highway:
Vision: Both groups supported developing a “mixeduse community scale district that integrates with the nearby Missouri Innovation Park and attracts visitors and business activity from a wider area in Blue Springs” as the most popular vision for the area, however there were about a quarter of respondents in the online survey that believed the “do nothing” approach and the continuation of existing development patterns (mainly light industrial uses) was the best option.
Strategy: There was support from both groups to “revise the current zoning to allow for a wider range of land uses”. The keypad responses supported “implementing a form based code similar to the one used in Downtown Blue Springs” while the other popular strategy supported by the online respondents was to “focus only on improving bike or pedestrian connections and access and not altering the current land use regulations.”
Public Open House #3 – April 29th and May 1st and
2nd, 2013
The third round of public meetings centered around questions about the conceptual land use plans for each of the focus areas and the plans for accommodating multiple modes of transportation along the length of 40 Highway.
40 Highway Overall Recommendations:
There was strong support among the respondents for the cities along 40 Highway to work together to coordinate signage, zoning, parking and other development regulations in order to ensure a more consistent look and feel going forward. The highest priorities were similar to the responses from other meetings including: improving the biking and walking trails along 40 Highway, landscaping and transit improvements. The respondents would prioritize improvements around Noland Road and along the section of 40 Highway from Noland Road to Lee’s Summit Road.
I would be in favor of exploring the following access management tools for the 40 Highway Corridor: (Choose all that apply)
Installing a landscaped median (with turn pockets) to reduce left turn conflicts
Cross connections between parking lots
Realigning the streets in the area to avoid confusion and improve connectivity
Removing driveways as redevelopment proceeds
Installing parallel roads where possible to provide additional access to businesses
All of the above
more

None of the above
Transportation:
There was general agreement for the overall transportation recommendation for 40 Highway which included landscaped parkway elements and express bus service. Particularly, there was support for installing a landscaped median with turn pockets to reduce left turn conflicts and encouraging cross connections between parking lots for access management. There was also agreement among respondents to move forward with plans for BRT or express bus service along the corridor.
Highway 40 Corridor Plan | Focus Area Plans 62 | Community Engagement
69% 56% 56% 50% 31% 25% 13% 6%
I don’t know, I would like to learn
31st and Prospect:
Land Use:
Participants preferred neighborhood retail, big box development and apartments, townhomes, or residential land uses when asked about the types of development they would like to see near the Linwood / 31st Street area.
Redevelopment:
Those who answered the keypad polling questions were supportive of creating a community improvement district and issuing a Request for Proposal from developers in order to generate development activity in the area or to form a joint redevelopment entity to coordinate improvements and redevelopment. There was support for the cities along 31st Street and 40 Highway working together to coordinate their signage, zoning, parking, and other development regulations in order to ensure a more consistent look and feel going forward. Improved lighting was the highest priority for the area around 31st Street and Linwood / Prospect.
Transportation:
There was also support for including parkway elements such as a landscaped median, a separated multi-use trail, and enhanced bus services. To improve the area around 31st Street and Van Brunt Boulevard, people were in favor of realigning the streets in the area to avoid confusion and improve connectivity.
There was agreement supporting collaboration between neighboring cities, MoDOT and the Kansas City Transit Authority to move forward with planning for BRT or express bus service along the 40 Highway and 31st Street corridor.
Blue Ridge Cutoff and Noland Road:
The public input collected at the meetings held in Independence helped inform the project team’s recommendations for the Blue Ridge Cutoff and Noland Road Focus Areas, as well as the corridor as a whole. There was support for the land use concepts shown at the meeting for the Blue Ridge Cutoff and Noland Road focus areas and for joint planning between the cities of Independence and Kansas City. The respondents supported the development of subarea plans for each area and a joint redevelopment entity to coordinate improvements and redevelopment along the corridor. Similar to the meeting at 31st and Prospect, responses were mixed about the potential for business park redevelopment along 40 Highway from Manchester Trafficway east toward Blue Ridge Cutoff.
Adams Dairy Parkway:
There was general support for the land use and transportation concepts depicted for the Adams Dairy Parkway area along 40 Highway and for the City of Blue Springs working jointly with the Missouri Innovation Park to plan for the focus area.
The respondents indicated general agreement with promoting mixed-use development at 7 Highway and 40 Highway. In this area participants prioritized improving the area between Woods Chapel Road and Adams Dairy Parkway. There was agreement for exploring ways to enhance gateways from 40 Highway into Fleming Park and Blue Springs Lake.
Community Engagement | 63
Recommendations | 65 5
RECOMMENDATIONS
Corridor- wide recommendations
Transportation and Corridor design
As outlined in the market scan and preceding chapters of this document, long term trends impacting the Kansas City area and Jackson County over the next 30 years should increase the demand for developments that are more compact and include a variety of housing options, ranging from apartments to townhomes to condominiums, that would appeal to the most rapidly growing segments of households in the area (including senior citizens, single person households, younger adults, and households unable to qualify to purchase traditional detached housing units). The likely continued increases in fuel costs over the next few decades will also likely increase demand for developments located closer to the heart of the metro area, along existing transportation corridors throughout the Kansas City area.
These trends, coupled with the availability of significant acreages for redevelopment, should position the 40 Highway Corridor to redevelop as a transit-oriented corridor over the next 30 years. Redevelopment of key focus areas and parcels along the corridor should result in concentrations of employment and residents that would support the introduction of more frequent and higher-quality transit service along the corridor. This strategy should help to revitalize the aging neighborhoods in Kansas City, Independence, Blue Springs and surrounding communities, and should strengthen the marketability of employment centers along and near the corridor, including the Missouri Innovation Park in Blue Springs and the various employment centers in central Kansas City, Missouri.
Transit Enhancements
The relationship between enhanced transit service (that runs more frequently or with more express options to key destinations) and development is a bit of a “chicken and egg” proposition, in that potential residents may be attracted by the presence of enhanced transit, yet transit agencies are more attracted to existing concentrations of residents along a given route.
The 40 Highway Corridor plan recommends that the communities along the corridor proactively plan for the redevelopment of four key focus areas to encourage sufficient concentrations of residents to
more effectively compete for the installation of transit improvements. In order for transit to be successful, it must be fast, frequent, and easily accessible. More than any other factor, the nature of surrounding development determines the potential success of a transit line. Transit needs to serve sufficiently high volumes of travelers to be cost effective, and the density of development determines the overall size of the travel market. The reach of transit is generally limited to within one-fourth to one-half mile of a transit line, and thus the size of the travel market is directly related to the density of development in that area. Housing densities of 10 dwelling units per acre are recommended for Bus Rapid Transit and five dwelling units per acre for frequent bus service. At the same time, transit must be frequent, running at least every 30 minutes and preferably every 10 or 15 minutes, in order to compete with automobile travel as an option. Transit service that runs more infrequently than these general thresholds is likely to only serve transit dependent populations (including those who cannot drive or choose not drive) as opposed to the broader population. Simply put, the KCATA is unlikely to make significant investments in upgrading bus and related transit service along 40 Highway unless the communities have a plan to develop sufficient densities of residents along the corridor to support enhanced transit services.
Transit Thresholds
Figure 22 illustrates the typical thresholds, in terms of residents and jobs within a square mile, necessary to support various levels of transit service over time.
The significant and varying costs of these transit options, outlined in Table 24, lead the KCATA, like any organization, to only make investments where the necessary investment criteria (in this case, densities or concentrations of residents or employees) are met. The following analysis presents a planning level of magnitude estimate of costs (both in terms of capital expenditures and ongoing operating costs) for various potential transit modes. Transit investments require both up front costs (typically with the aid of federal grants) and long term operating costs. Importantly, the mode selected must provide the most benefit for the cost and must not impair the operations or funding of any existing or already planned KCATA routes.
Highway 40 Corridor Plan | Focus Area Plans 66 | Recommendations
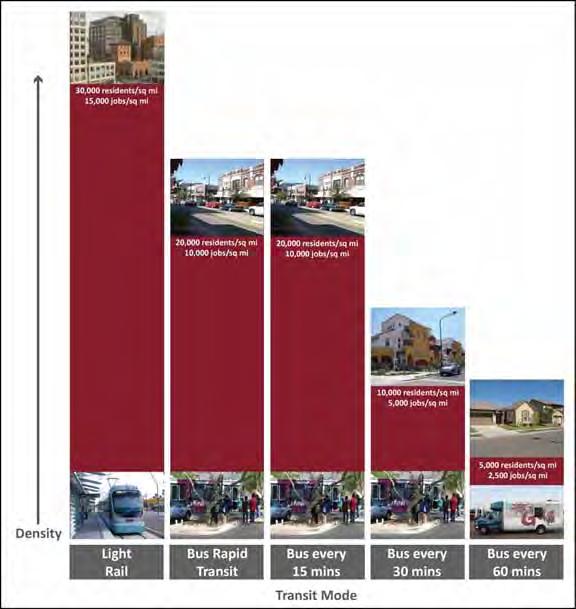
Recommendations | 67
Figure 21: Transit Supportive Population and Employment Densities
5,000 residents/sq mi 2.500 jobs/sq mi 10,000 residents/sq mi 5,000 jobs/sq mi 20,000 residents/sq mi 10,000 jobs/sq mi 20,000 residents/sq mi 10,000 jobs/sq mi 30,000 residents/sq mi 15,000 jobs/sq mi COST H E AVY rAIL C O MM u T E r r AIL L IGHT rAIL S T r EETCA r B r T E X P r E SS B u S B u S O n A r TE r I AL Capital Cost per Mile (in millions) $50-$250 $3-$25 $20-$60 $10-$25 $4-$40 $2 $0.68 Operating Cost per Hour >$476$476 $220 $170 $160 $120 (MAX) <$120
Source: Composite data compiled by Nelson\Nygaard from various sources.
Table 24: Capital and Cost Estimates, by Mode
Source: National Transportation Database and Reconnecting America
Transit Recommendations and Phasing
Given the orientation of the areas around the 40 Highway Corridor in Jackson County toward single-family suburban development, the communities will likely not achieve sufficient densities over the next twenty years to warrant investment in a light rail line or a bus rapid transit line (with a dedicated lane for buses) along the length of the corridor. However, assuming that the focus areas along 40 Highway redevelop with higher levels of residential density and compact forms of development, the corridor should be able to support the introduction of enhanced bus service (including more frequent buses and the introduction of bus lines traversing the entire corridor). In addition, the urban portion of the corridor in Kansas City, Missouri (from Bruce R. Watkins east toward the Truman Sports Complex) may support the introduction of a streetcar line along the route as an extension of the already planned streetcar line in the heart of the city.
As outlined further in subsequent sections of this document addressing the four focus areas, the overall 40 Highway Corridor Plan anticipates more compact forms of development and greater levels of residential density within these areas. Table 26 lists the general assumptions for residential and employment intensity.
As illustrated in the Table 26, these projected residential and employment densities at the four focus areas would generally support enhanced local bus service with service times of either 30 minutes or 15 minutes. The KCATA would have an additional incentive to move to 15 minute head times on a bus line serving 40 Highway if additional nodes or focus areas along the corridor (such as at Van Brunt, Lee’s Summit Road, or 7 Highway) redevelop at even higher densities than the ones articulated in the table.
The higher overall cost of Bus Rapid Transit and Light Rail, coupled with the lack of certainty that these focus areas can achieve the projected intensities articulated in the table, likely indicates that the communities along
Highway 40 Corridor Plan | Focus Area Plans 68 | Recommendations In T E r SECTIO n / nO d E P r O POSE d H O u SI n G I n T E n S ITY ( r ESI d E n T S / A C r E ) * Pr O POSE d E M PLOYME n T I n T E n SITY (j OBS / A C r E ) 31st Street and Prospect Avenue 50 8 - 16 40 Highway and Blue Ridge Cutoff 32 8 - 16 40 Highway and Noland Road 40 8 - 16 40 Highway and Adams Dairy Parkway 48 > 48 * Assumes an average of two residents per dwelling unit - Source: Design Workshop
Table 25: Transit Supportive Population and Employment Densities
Tr A n SI T M O d E / S E r V ICE L EVEL rESI d E n T S /A C r E j OBS /A C r E Flex Bus 0.5 Community Circulator 2 Local Bus 60 minutes 8–16 4–8 30 minutes 16–31 8–16 15 minutes 31–47 16–24 10 minutes 47–92 24–48 ≤ 5 minutes >92 >48 Bus Rapid Transit 26–52 >13 Light Rail 31–78 >15
Table 26: Residential and Job Densities Needed for Transit / Mode Service Level
40 Highway should aim to concentrate their efforts in securing consistent and reliable bus service that serves the entire corridor at head times that attract a market for bus service to include “choice riders” (meaning, those riders that could easily choose an automobile as another option to transit).
Current housing and employment densities do not support high capacity transit improvements along the 40 Highway Corridor. However, as focus areas redevelop and overall densities increase, the communities, along with KCATA, should be able to confidently implement enhanced transit service. The following phasing options could capitalize on existing opportunities, and build upon the development of areas of greater intensity (in terms of residential and employment land uses) to implement improved transit service over time.
Phase 1: Extension of the 31 Route to the Entire Corridor
As an initial investment, KCATA should consider extending some of the Route 31 runs (which currently end at Blue Ridge Crossing, coming from the west) to the entire corridor, extending all the way to Grain Valley. The agency could provide this service to the entire corridor initially during only a few runs during the morning and afternoon peaks and then further expand over time. This strategy would provide transit service to the entire 40 Highway Corridor, to areas that currently do not have any transit service along the eastern half of the study area. This extension of the 31 route could serve as an initial “experiment” during which local communities and the KCATA could test the feasibility of providing additional corridor-wide transit service in the future.
Phase 2: Evaluate Dedicated Express Service or Full Service Local Line
As redevelopment proceeds at the four focus areas and at other locations along the 40 Highway Corridor, the KCATA should evaluate the potential to create a dedicated commuter express line, or a full service line, along the length of the entire corridor. The KCATA should explore including various amenities with an express or
full service line, including signal priority and queue jump lanes, to speed transit service.
Importantly, the communities and KCATA should not move existing express bus service from Interstate 70 to the 40 Highway alignment. The I-70 express bus service serves a distinctly different market, driven by the provision of faster travel times and speed, than the market likely to be served by express buses along 40 Highway. Moving express buses from I-70 to US 40 would only serve to reduce ridership along the express line and produce increased travel times along the route in traveling from Kansas City east to Blue Springs. Express buses on 40 Highway, even with investments made to speed service such as queue jumps and signal prioritization for buses, would not compete time-wise with express service running along I-70. Any new transit service or expansion on 40 Highway should proceed based upon inherent market demand, meaning that providing higher capacity service should be contingent on increasing residential and employment densities at corridor focus areas or nodes. Enhanced transit service on 40 Highway should complement and not replace existing service along Interstate 70.
Phase 3: Evaluate Additional Service Options and Extensions Along 40 Highway (Depending on Future Nearby Investments and Development Intensity)
As a longer term option, the communities and KCATA should consider making extensions or connections of transit service from 40 Highway to nearby future higher capacity transit investments in order to further improve transit service and enhance overall connectivity in the study area. Specifically, the communities should look to connect transit service along 40 Highway to the following potential improvements going forward:
Recommendations | 69
Commuter rail (jackson County) – The communities should consider potential links from enhanced or express transit along 40 Highway with potential alignments for a commuter rail line roughly paralleling I-70 through Jackson County, east to Oak Grove. Specifically, the Adams Dairy Parkway and 40 Highway focus area has the potential to have connections in close proximity to both express buses along 40 Highway and to the potential commuter rail line, which would likely pass along the Kansas City Southern line about two blocks to the south of the 40 Highway and Adams Dairy Parkway intersection.
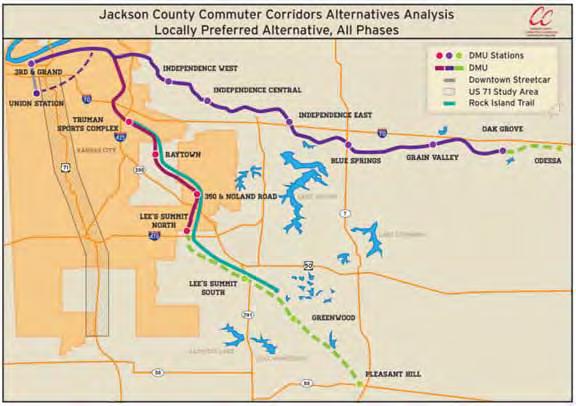
Highway 40 Corridor Plan | Focus Area Plans 70 | Recommendations
. . . . . . . . .
Figure 22: Jackson County Alternatives Analysis – Study Corridors
.Source: Jackson County Commuter Corridors Alternatives Analysis
Kansas City Streetcar Expansion – The City of Kansas City is currently conducting a study to evaluate six possible corridors for expansion of the initial streetcar line that has been approved and funded for the corridor from the City Market south through Midtown. The 31st and Linwood Corridor, if chosen, could follow one of these east-west corridors out of the heart of the city and eventually connect with the Truman Sports Complex. Express buses or enhanced bus service along 40 Highway would need to tie with the streetcar line if completed along this route through the eastern portion of the city.
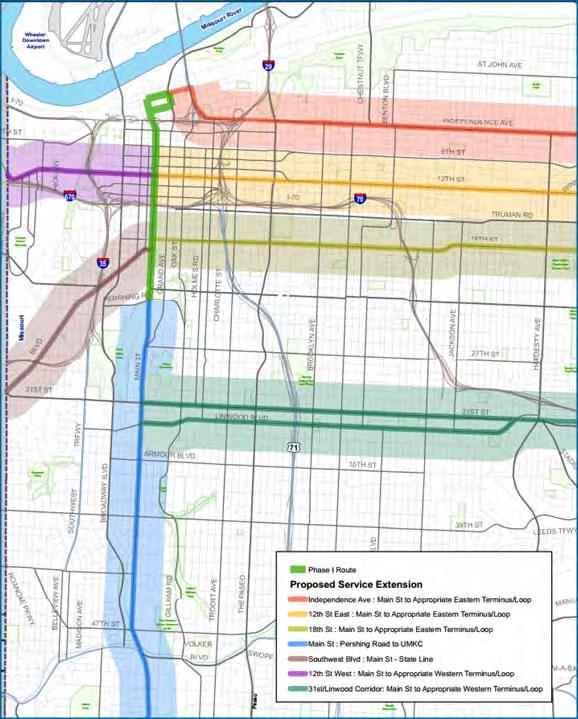
Recommendations | 71
Figure 23: Streetcar Expansion Analysis Study Corridors
Source: City of Kansas City
roadway design
The “Landscaped Parkway”
The introduction of enhanced transit service along 40 Highway will require time and the demonstrated presence of increased residential or employment density at nodes along the corridor. However, irrespective of the timeline to complete transit enhancements, the communities along the 40 Highway Corridor, working with MoDOT, can help to improve the aesthetic appearance and economic marketability of the corridor over time by redesigning 40 Highway, in stretches, as a “landscaped parkway” throughout Jackson County and as an enhanced urban street or boulevard in the heart of Kansas City, Missouri. These improvements can strengthen overall traffic safety and the environment for people walking and biking along the corridor, whether in a local focus area or from community to community. This strategy takes advantage of the relatively wide right of way of the highway through the communities of eastern Kansas City, Independence, Lee’s Summit, Blue Springs, and Grain Valley and uses the extra space for bike and pedestrian improvements and to provide for an attractive center landscaped median, thereby also improving access management.
Key components of the landscaped parkway recommendation, for the segment officially designated as 40 Highway from I-70 east to Grain Valley, include the following:
• Construction of a multi-use pathway (of eight to twelve feet in width), including room for both bicyclists and pedestrians, along at least one, and hopefully both, sides of the parkway (depending on the availability of right-of-way).

• Construction of a landscaped median with turn pockets down the middle of 40 Highway as segments are improved.
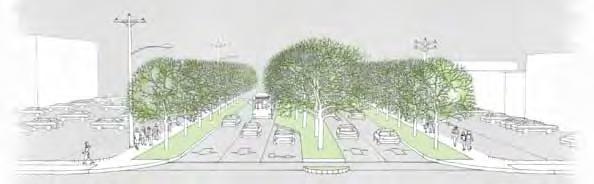
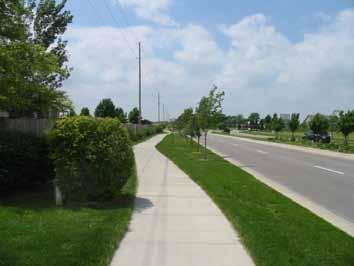
Highway 40 Corridor Plan | Focus Area Plans 72 | Recommendations
Median with Turn Pockets
Sidewalks and Multi-Use Paths adjacent to the roadway
• Installation of street trees, benches, and other street furniture along the length of the parkway, and in particular at the focus areas or similar “districts” along 40 Highway, to improve the aesthetic appeal and functionality of the corridor.
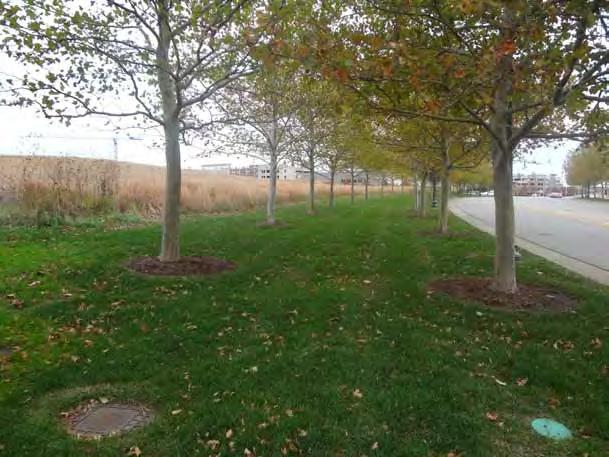
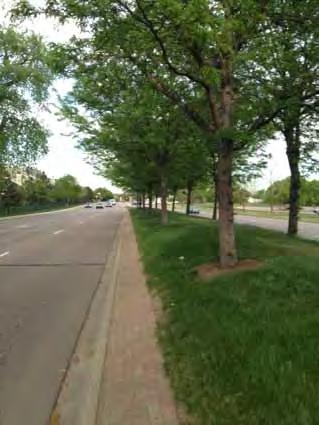
• Installation of bus shelters at fixed locations in order to provide shade and encourage greater ridership of enhanced or express bus lines along 40 Highway.
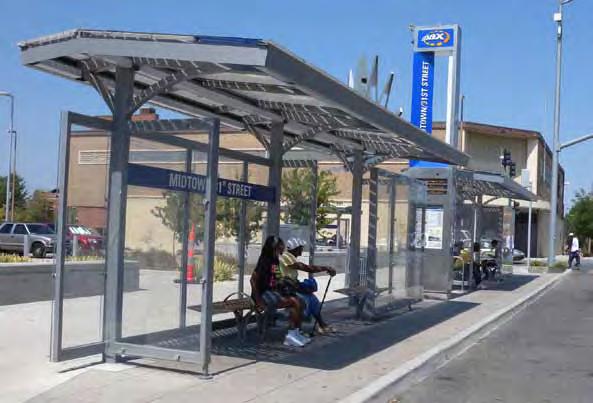
Multi-modal Strategies
• Providing pedestrian signals at all traffic signals as well as clearly marked crosswalk facilities.
• Appropriately timed pedestrian signals to allow pedestrians sufficient time to cross.
• Providing bicycle parking and passenger amenities at bus stops and transit facilities.
• Improvements to speed transit movement along the corridor, such as providing signal priority and queue jumping for transit vehicles. A queue jump treatment allows a bus to use an auxiliary lane at a signalized intersection in order to bypass the adjacent queue for general traffic flow, and to use an advance green signal in order to move through an intersection unimpeded, ahead of the general traffic flow.
Recommendations | 73
Access Management
The corridor functions fairly well with regard to vehicular traffic flow, though 40 Highway does have a high number of curb cuts per mile in some sections. Too many curb cuts create unnecessary conflict points between turning traffic and through traffic along the arterial. The addition of a landscaped median, as mentioned above, as well as improving the network of local streets, can help minimize conflict points and maintain access to businesses.
Potential areas for redevelopment or revitalization along 40 Highway lack the presence of local street connections or networks that could help facilitate the development of local neighborhood centers or town centers.
Connected Parking Lots and Cross Access Agreements
The cities should work with property and business owners at each of the focus areas to establish cross access agreements and connect parking lots between adjacent parcels along the highway in order to relieve the travel lanes on 40 Highway of local traffic.
Establish a Grid network of Streets
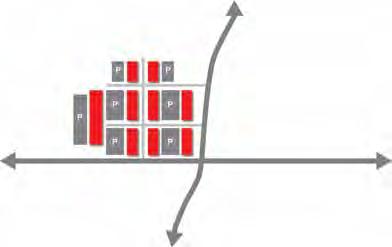
The cities along 40 Highway should work with property owners to establish a grid of north-south and east-west streets running parallel or perpendicular to the corridor to improve the overall flow of traffic within new development areas. These parallel or perpendicular streets cities could serve as “Main Streets” for shopping center or town center areas.
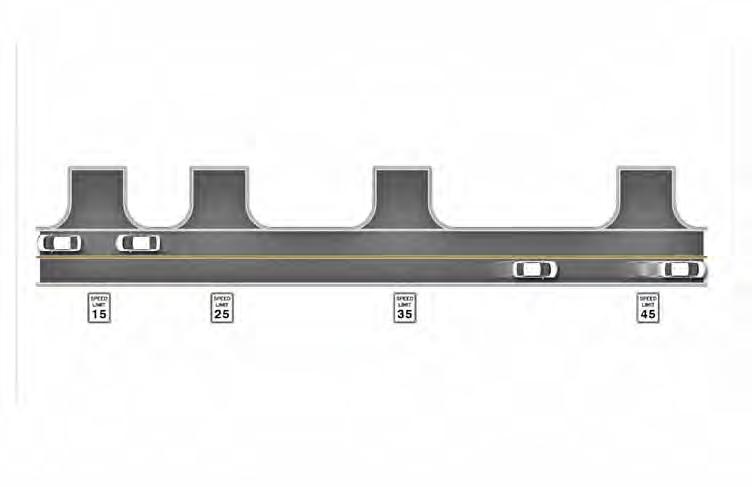
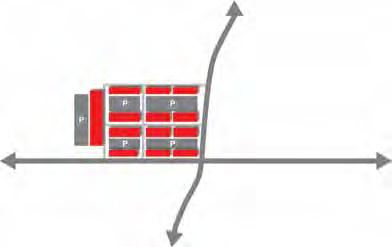
Highway 40 Corridor Plan | Focus Area Plans 74 | Recommendations
Perpendicular development 50’ 100’ 150’
Figure 25: Curb Cut and Recommended Vehicle Speed Relationship Diagram
Parallel and Perpendicular Road Sections
The design team recommends road sections for a variety of street prototypes within the corridor study area, including north-south streets intersecting with 40 Highway, “Main Streets” serving the focus areas, and other types of streets along and near corridor. The following depicts typical road sections for a variety of streets that would serve future redevelopment along the corridor.
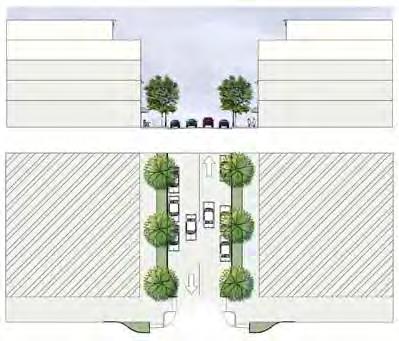
Back Streets
Back streets could run parallel or perpendicular to 40 Highway and would serve as relief routes as well as streets serving retail, office, or residential uses throughout the study area. The recommended street sections call for one travel lane in each direction, a landscape zone of six feet between the travel lanes and areas of development, and sidewalk areas of at least 10 feet in width to facilitate retail and commercial activities. The streets should include bulb-outs at intersections to shorten the distance pedestrians must travel from one side of the street to another. Parking may line the street on both sides in a parallel fashion (as depicted in Back Streets Option 1) or angled on one side (as depicted in Back Streets Option 2), in order to increase the total number of parking spaces. Buildings of up to four stories may flank back streets. The exact form and orientation of buildings along back streets would depend on market forces and individual redevelopment concepts.
Back Streets Section: Option 1
Back Streets Section: Option 2
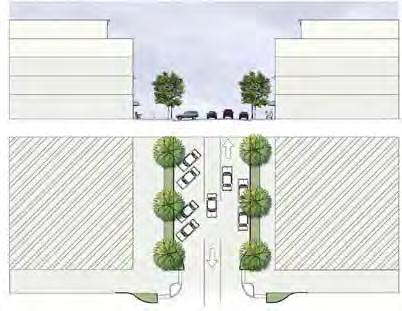
Recommendations | 75
Main Streets
The “Main Street” section represents the recommended design for primary main streets in town center or neighborhood center districts along the 40 Highway Corridor. The street section recommends angled parking along either side of a two lane road in order to increase the number of parking spaces along the street. A minimum 10-foot wide sidewalk along the main streets would help facilitate outdoor dining and accommodate greater numbers of pedestrians compared to side streets or back streets. Landscaping including street trees would line the Main Streets. Buildings of up to five stories in height are encouraged on either side of Main Streets.
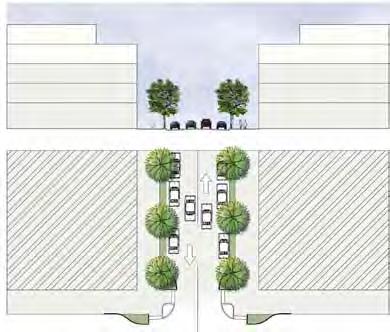
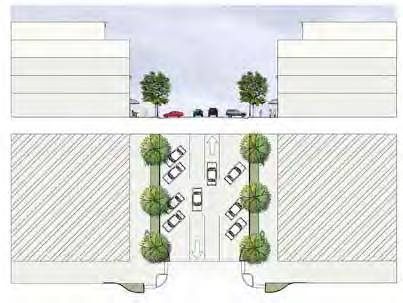
Residential Streets
Residential streets would serve as lower volume streets accessing residential developments in close proximity to 40 Highway. These streets would feature a single lane of travel in each direction and parallel parking on each side. A landscape strip would separate the parallel parking area from sidewalks on either side.
A subsequent section of the text will outline the combined transportation and redevelopment concepts for each segment along the corridor, for use by each community in future planning.
Main Street Section
Residential Streets Section
Highway 40 Corridor Plan | Focus Area Plans 76 | Recommendations
Parking
In order to reduce development costs, reduce the amount of space consumed by parking, and more efficiently utilize real estate along 40 Highway, the design team recommends that the communities along 40 Highway adopt shared parking regulations for areas along and near the corridor. Shared parking is based on the concept that different uses in mixed use areas attract users at different times throughout the day and can share parking spaces, thus maximizing the use of each space. The parking regulations should ideally include the following stipulations:
• Implementation of a shared parking code to allow for reduced parking requirements for different uses.
• Identification of available pooled liability protection programs or insurance policies whereby owners of different parking facilities can pool resources and purchase a joint replacement policy. This type of policy would provide for public access across multiple parking lots at lower insurance rates compared to traditional parking policies.
In addition, the cities should consider modifying the zoning regulations surrounding the identified focus areas to allow greater flexibility in meeting parking requirements. Based upon nationwide best practices, the project team suggests the following parking ratios, for example: for retail uses, a maximum of 3.5 parking spaces per 1,000 square feet of building area is encouraged. For residential units, the cities might consider a requirement of
1 1/8 parking spaces for each residential unit.
The two communities should implement the following design standards in order to better integrate parking with the surrounding urban environment and encourage walkability along the 40 Highway Corridor.
• As the areas around focus areas evolve over time, the cities should work to minimize surface parking and encourage the construction of structured parking facilities wrapped or hidden by surrounding land uses. As the density of development increases, the financial viability of providing structured parking will increase.
• Where property owners or developers pursue surface parking, the cities should encourage property owners to place these facilities primarily between or behind buildings that have direct frontage onto 40 Highway. This strategy would help to prevent the creation of a “sea of parking” in front of each retailer or other use along the corridor.
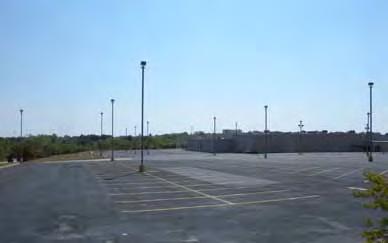
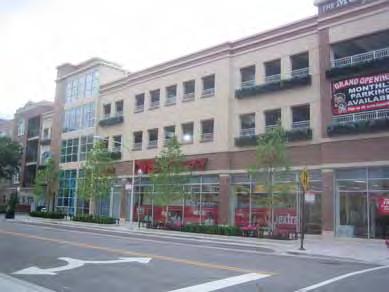
• Requirements for surface parking lots with more than 50 spaces to include raised pedestrian walkways (at elevated grades above the level of surrounding pavement).
• Prohibition of at- and above-grade parking within 25 feet of a required building line (this essentially forbids surface parking adjacent to the street
Recommendations | 77
Mixed-use parking garage next to the Loyola Station CTA line in North Edgewater, Chicago, IL. Photo by: Jeremy Jannene - Creative Commons
Existing parking lot at the Blue Ridge Cutoff focus area.
and provides incentives for the construction of parking structures wrapped by liner buildings).
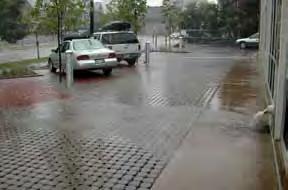
• Requirements for property owners to provide connections or grant easements for connections to adjacent parking lots on neighboring properties.
The communities should consider requiring or providing incentives for investment in design, landscaping, and multi-modal improvements associated with surface lots that are not likely to attract redevelopment prospects for some time. Potential investments may include:
• Adding green space, trees and porous pavement surfaces in order to improve aesthetics and reduce rainwater runoff from existing lots. These strategies may also include the installation of perimeter landscaping, pocket parks and gardens, and bioswales.
• Improving pedestrian connectivity between destinations in order to generate foot traffic and support shared parking between properties. Quality pedestrian through-paths across parking lots would shorten walking distances, provide direct connections between multiple uses, and improve overall safety.
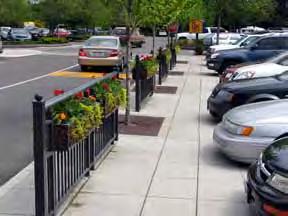
• Adding bicycle parking facilities to existing parking lots to encourage non-motorized commuting and local travel.
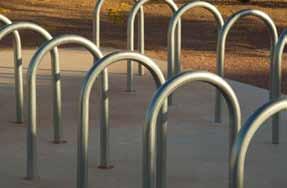
• Removing reserved employee parking spots from key locations for bus stations and bicycle facilities in order to encourage use of these alternative modes of travel.
• Creation of improved transition zones between 40 Highway and the main north-south roadways and existing parking lots, including places to rest.
• The installation of improved wayfinding and information systems.
• The creation of opportunities for shade and shelter for pedestrians.
Providing adequate bike parking is an important part of promoting non-motorized or mutlimodal trips along 40 Highway and within new developments.
Highway 40 Corridor Plan | Focus Area Plans 78 | Recommendations
Porous parking surfaces reduce stormwater runoff and encourage infiltration rather than more surface runoff.
Pedestrian connections and buffers for parking lots
These improvements can improve the performance and appearance of the corridor in the near term, prior to the redevelopment or conversion of land uses. In addition, in the near term, the cities can work with landowners to coordinate shared parking arrangements. For example, a city could work with the owner of an auto parts store that closes by 5PM to arrange for neighboring restaurants to use his or her parking spaces after hours.
Recommendations | 79
Bike parking and seating provides options for visitors.
Clear connections, street trees, and seating help improve pedestrian comfort where large parking lots are necessary.
Rain gardens and low impact development strategies can help improve the environment as well as aesthetics.
Image: Smart Growth America
Parks, Open Space and Landscaping
Given that the public was in favor of adding some parkway features along 40 Highway and the expansive right-of-way in most sections of the corridor, the design team recommends that the communities along 40 Highway consider future improvements to the corridor that enhance parkway features. Aesthetic enhancements should bolster the image of the corridor as a key parkway traversing the community.
Trees and Landscaping
The communities should consider installing a regular program of street trees along 40 Highway, both within a center median and along either side, in order to enhance the identity of the corridor, increase shade areas, and to reduce stormwater runoff. The project team recommends tree spacing of 40 feet. The city staff should install street trees that grow especially high and therefore would eventually include tree canopies above the level of view from passing vehicles. Encouraging trees to grow to their full potential will allow for viewsheds from the main corridor into neighborhood center areas and for passersby to see signage and windows from nearby retail and office buildings from their vehicles. In order to encourage trees to grow to their full potential, each tree should have a minimum of 1,000 cubic feet of soil. Absent sufficient space for the root system to grow, trees often do not grow to their full potential and in many cases prematurely die.
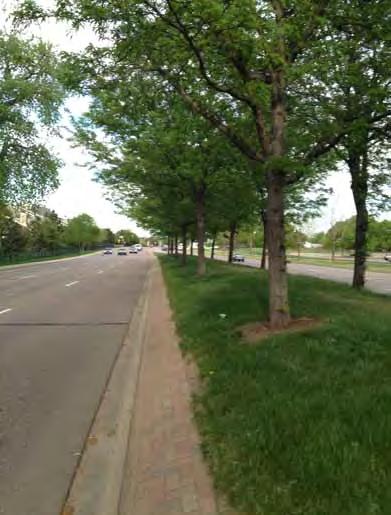
Trail Connections
The cities and MODOT should consider constructing a multi-use trail along at least one side of 40 Highway through the communities for both recreation and transportation.
The cities may wish to gain additional input from the community prior to moving forward with installation of this type of improvement. Combined bike and pedestrian trails, separated from arterial streets by landscaping or grass, have gained acceptance in other parts of the metro region and could help to enhance the multi-modal functionality and overall aesthetic appeal of the corridor going forward. The cities should also consider installing benches and related seating areas along the trails on either side in order to further encourage pedestrian and bicycle activity.
The cities should consider installing trail connections from 40 Highway to nearby local and regional park facilities in order to enhance the overall open space network. Trails could connect from 40 Highway to Blue Valley Park, Adair Park, and Fleming Park.
Parkways Defined:
Characteristics of parkways include: a wide trafficway, perhaps 200 to 250 ft. in width with a median of perhaps 100 ft.; lends itself to multi-purpose pedestrian use for biking, walking and jogging; has limited points of ingress/ egress; although residential development is appropriate, other uses for commercial, retail and light industrial are acceptable; adaptable to modern engineering for turn lanes; landscaping and amenities are typically more naturalistic in design and form than boulevards; don’t necessarily follow a grid system in their layout and tend to be more undulating.
(Blue Springs Comprehensive Plan)
Highway 40 Corridor Plan | Focus Area Plans 80 | Recommendations
An example of street trees in a parkway median
Greenways
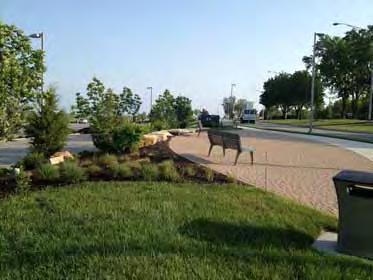
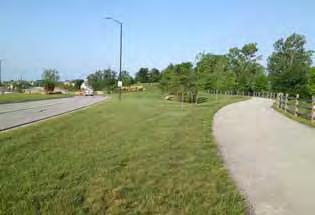
The design team suggests that the cities explore the improvement of greenways flanking streams that run perpendicular to or along the 40 Highway Corridor area. Trails or paths installed along either side of these streams would help to encourage walking and outdoor activity. Future development areas adjacent to streams should include links from these land uses to nearby creeks, rather than flank the streamways with back doors, service entryways, and dumpster areas. Providing setbacks of up to 50 feet from streamways would help to create additional greenspace along the streamways and also simultaneously improve the ability of the streams to accommodate stormwater flows during peak precipitation events.
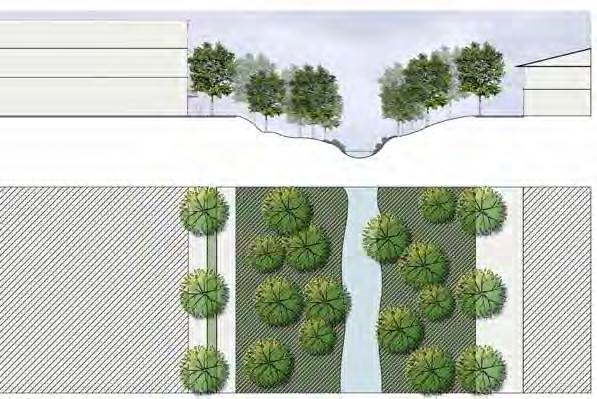
Recommendations | 81
Bike and Pedestrian Trail Along Prairie Star Parkway in Lenexa
Greenways along streamways with setbacks for buildings
Seating Area Along Renner Boulevard in Lenexa
Signage and Wayfinding
CONCEPT OPTION C:
CONCEPT OPTION C:
“Shape Reflects Community (Homes)”
“Shape Reflects Community (Homes)”
-A consistent corridor system with a singular shape
Major arterial systems and corridors, such as 40 Highway, must provide effective signage and wayfinding systems for motorists in order to encourage commerce and highlight community destinations and services. Recommendations for signage and wayfinding along the 40 Highway Corridor include the following:
-A consistent corridor system with a singular shape
-Simplified square “house” shape
-Simplified square “house” shape
Bluebird State Park
Bluebird State Park
-Each City utilizes their logo and color
-Each City utilizes their logo and color
-Manchester Road is treated as a footer
Klamberg Woods
Klamberg Woods
-Manchester Road is treated as a footer
Mockingbird Park
Cardinal Park
Mockingbird Park
Ellisville City Hall
Ellisville City Hall
Wildwood Town Center City Hall Theater
-Arrows are oriented toward each end of the message, not organized at right
-Arrows are oriented toward each end of the message, not organized at right
• The cities should adopt and implement a common family of signage along the corridor in order to provide signage and directions to motorists, pedestrians and bicyclists in order to navigate to key destinations. Installing a common signage vocabulary will “brand” the corridor over time and help to create a more distinct sense of place along 40 Highway.
• The cities should consider a comprehensive design and implementation of monumentation markers along the 40 Highway Corridor. These monuments could help establish a distinct brand and identity for the corridor and thus enhance its overall marketability. Designs for common monuments along 40 Highway would also help create a more common “sense of place” along the corridor in each city. The illustrations provide examples of monumentation from other corridors and districts in the Midwest. Monuments along the corridor could include a common logo to denote the 40 Highway Corridor.
Sign panel is one layer of substrate, 1/8” to 3/16” thick. All graphics are 4-color digital printing on reflective vinyl or standard translucent vinyl over reflective vinyl. Back face is painted black. Post must use a break-away design approved by MoDot. 4” letter height for all messages.
Ellisville Police
MANCHESTER ROAD MANCHESTER ROAD
• Visitors to suburban arterials often have difficulty locating specific addresses for businesses, offices, or other destinations. The address numbers for many businesses in suburban locations are small in size or located in less visible locations. While the use of mapping technologies on smart phones and related technologies have helped people in locating addresses, installing improved signage to denote address locations would help to increase the business-friendly nature of 40 Highway. One strategy would involve requiring new signage along the corridor to more prominently display address numbers. Another strategy would involve installing freestanding address range markers along block corners along 40 Highway in order to assist with address location.
Cardinal Park MANCHESTER ROAD MANCHESTER ROAD
Ellisville Police
MANCHESTER ROAD
YMCA STL Comm College
MANCHESTER ROAD Wildwood Town Center City Hall Theater YMCA STL Comm College
MANCHESTER ROAD
Layout 1: Up to four messagesLayout 2: Up to two messages
Layout 1: Up to four messagesLayout 2: Up to two messages
Street I.D. with Address Marker
OPTION C: Manchester Road Vehicular Community Wayfinding System-Ellisville, MO (Standard new design for corridor, customized with City logos)
Scale: 1/2”=1’-0”
6" 1'-0"
OPTION C: Manchester Road Vehicular Community Wayfinding System-Ellisville, MO
(Standard new design for corridor, customized with City logos)
Scale: 1/2”=1’-0”
6'-8"
40 Highway
1590 1580
Identity Options:
Street Name Letter Height: 6”
Highway 40 Corridor Plan | Focus Area Plans 82 | Recommendations
Sign panel is one layer of substrate, 1/8” to 3/16” thick. All graphics are 4-color digital printing on reflective vinyl or standard translucent vinyl over reflective vinyl. Back face is painted black. Post must use a break-away design approved by MoDot. 4” letter height for all messages. MANCHESTER ROAD
Example: Vehicular Community Wayfinding System Street Identification with Address Marker
-Could Include Unique Logo -City Logos
3"
Street Address Numbers: 3”
US
Example Signage Program
Address Marker
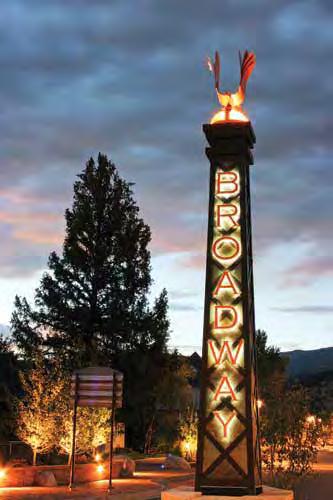
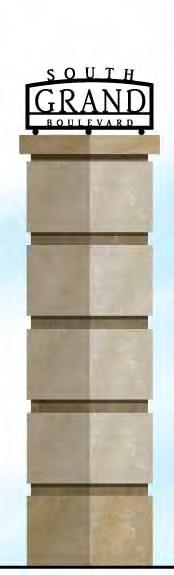
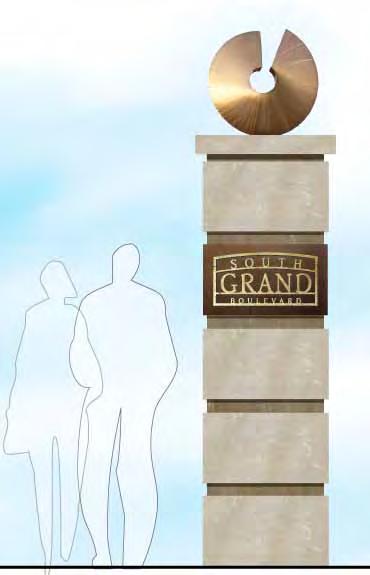
Recommendations | 83 OPTION 2: Manchester Road Vehicular Community Wayfinding System Address Marker painted manner. 1 5 0 0 0 4’-6”
Example Wayfinding Signage Example Monumentation
Example Address Markers
Public Art
Communities that have successfully redeveloped or revitalized corridors or districts around the country have integrated public art programs in order to enhance the sense of place and identity within particular areas. Public art can express the historical heritage of a community or may provide additional aesthetic styles and designs that help distinguish a corridor within in a region.
The project team recommends that the cities of Kansas City, Independence, Lee’s Summit, and Blue Springs collaborate to develop standards and strategies for public art along 40 Highway, including potentially within the right-of-way of the road. The design team recommends that the communities pursue the following goals related to public art along 40 Highway as the corridor continues to evolve.
• Public art should strengthen the collective identity of the corridor, and of each community, individually, by inviting artists to create artworks for inclusion along the corridor that reflect the social, cultural, and spatial aspects of the area.
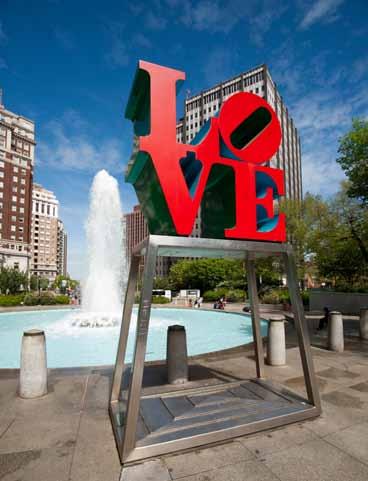
• Reinforce the corridor as a destination in Jackson County for dining, shopping, living, entertaining, and conducting business.
• Enhance and support efforts to “green” the corridor by commissioning artwork that reveal environmental aspects of the streetscape and the local community.
• Create partnerships with local schools, arts organizations, and other entities in order to present high quality artwork and engage with artists.
Recommendations for Public Art along 40 Highway
Permanent, Integrated Artwork:
The cities should integrate works of art into the future design of the corridor and other streets, including key north-south streets intersecting the corridor (such as Prospect, Blue Ridge Cutoff, Noland Road, and Adams Dairy Parkway), thereby helping to define the aesthetic quality of different parts of the corridor. Integrating planning for public art with redevelopment plans and initiatives to complete other public improvements will enhance the overall quality of the design of the public spaces along the corridor and avoid the creation of a cluttered landscape.
“Green Street” Public Art:
The cities should consider enlisting an environmental artist to highlight the environmental features of the corridor, including areas of woodlands, creeks, and streams. Design for town centers and neighborhood centers should integrate elements of public art with the design of rain gardens, rainwater detention facilities, and other sustainable stormwater strategies.
Highway 40 Corridor Plan | Focus Area Plans 84 | Recommendations
Permanent Sculpture:
The cities should consider the installation of permanent public art sculptures at key locations along the corridor in the future, including town center areas, civic gathering places, and other centers of community activity. These permanent structures may speak to the history of adjacent cities or reflect the vision of a particular district along the corridor. For example, a neighborhood center in the Independence area could highlight elements of the Santa Fe Trail that once passed through the area.
Temporary Public Art Installations:
In partnership with local arts and cultural organizations, the cities should explore introducing temporary public art installations along 40 Highway. Temporary art projects or displays can introduce new art and aesthetic concepts to residents and visitors along the corridor area. Temporary public art can raise the collective profile of 40 Highway as viewed by residents and visitors. The cities should build relationships with local galleries and cultural institutions by creating opportunities for the display of artwork in high traffic locations. Above all, temporary public art should help to attract visitors and business to the area.
Recommendations | 85
Stormwater Management
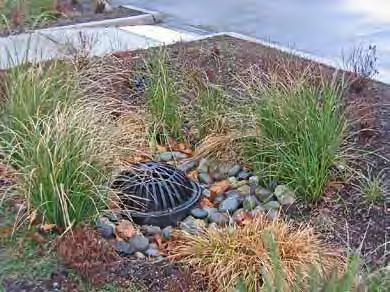
Given that the Kansas City area receives nearly 40 inches of precipitation per year, planning for stormwater management remains at the forefront of community planning throughout the region. The 40 Highway Corridor passes through several drainage watersheds. Both new developments and the design for non-developed areas along the corridor can impact the amount of runoff flowing into the basins. Low-impact strategies for managing runoff can help to improve water quality and minimize the quantity of stormwater. The following recommendations should be considered in planning for the corridor:
• Installation of a series of vegetated swales within undeveloped portions of the right-of-way along 40 Highway, and along side streets and intersecting north-south roadways, to increase the percentage of runoff that infiltrates into the ground rather than enter local waterways and drainages. In particular, the eastern portion of the 40 Highway Corridor, includes significant open space within the right-of-way that is suitable for the installation of vegetated swales.
• Installation of rain gardens. A rain garden is defined as a planted depression that allows rainwater runoff from impervious urban areas to be absorbed into the ground. Studies have shown that effective rain gardens can reduce the amount of stormwater and pollution reaching creeks by as much as 30 percent. Rain gardens should incorporate native plantings because these varieties typically do not require fertilizer and are more hardy and acceptable to the local conditions. Examples of plants to include in rain gardens in order to absorb the greatest amount of runoff include wildflowers, rushes, ferns, shrubs and small or miniature trees.
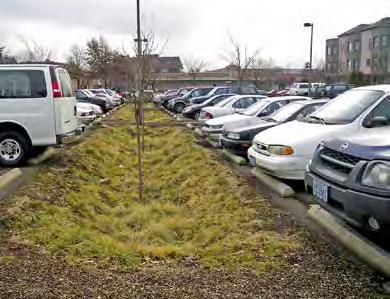
Highway 40 Corridor Plan | Focus Area Plans 86 | Recommendations
Photo By: Brett VA- Creative Commons
Photo By: Brett VA- Creative Commons
Permeable Pavement (Bogert Products)
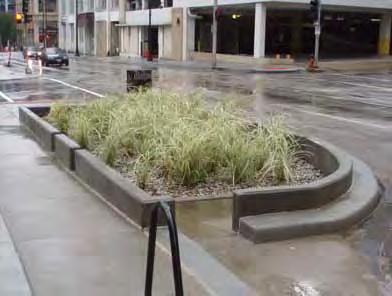
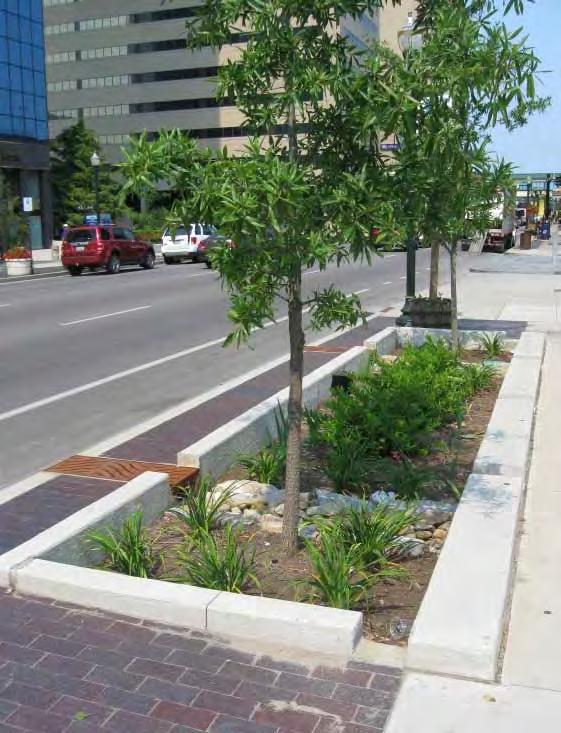
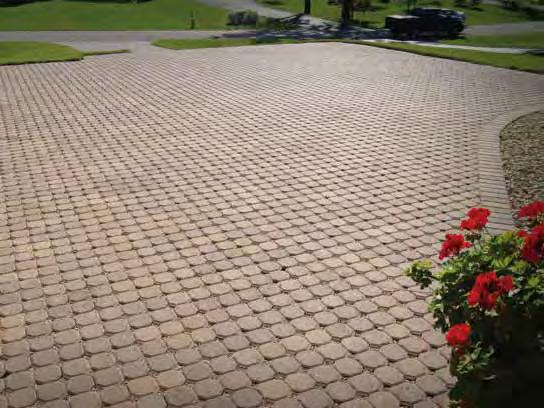
Recommendations | 87
Bulb-out Rain Garden
Linear Rain Garden
Creation of development Centers
neighborhood / Town Centers
Public input supported introducing a greater mix of land uses as redevelopment occurs over time at the focus areas along the 40 Highway Corridor. The project team recommends that the communities work with the private sector and the local stakeholders to create a series of neighborhood centers that have the potential to evolve into more regionally serving town centers over time. These mixed use centers are supportive of enhanced transit services and alternative transportation modes. Neighborhood centers would help to achieve many of the goals outlined in the Creating Sustainable Places program and would help to create more vibrant, green, and connected districts along the corridor over time. The following outlines some of the key recommendations concerning the design of neighborhood centers along the corridor.
Neighborhood centers could evolve over the next few decades at the four focus areas including 31st and Prospect, Blue Ridge Cutoff, Noland Road, and Adams Dairy Parkway. In addition to the initial focus areas identified by MARC, locations for future neighborhood centers may include the areas near the intersections with Van Brunt Boulevard, Lee’s Summit Road, and Missouri 7.
Neighborhood Centers include a mix of land uses, civic spaces, and a variety of local-serving retail and amenities. Neighborhood centers contain a variety of local-serving retail and tend to attract visitors and business from within a few miles. These centers can include residential, office, and retail development, but are smaller in scale than a Town Center.
Town Centers, in general, have the potential to attract business from a wider, metropolitan audience and include more regional-serving tenants and land uses. Town Centers can serve an entire county and several communities at once with retail tenants or attractions that draw from up to 20 miles away.
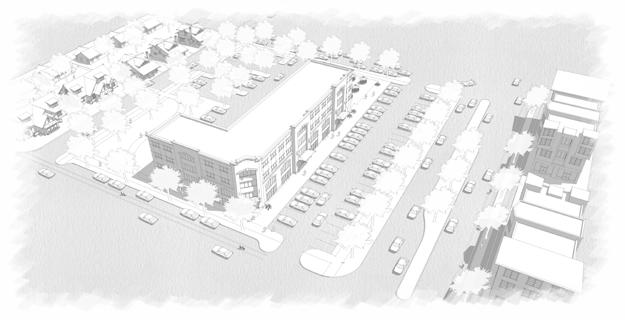
(Form Based Code)
Highway 40 Corridor Plan | Focus Area Plans 88 | Recommendations I E H A G A B C D E F G H Density De nitions of Terms: Anatomy of a Neighborhood Center Rain Gardens Bioswale Porous Pavement Architectural Design Standards Setbacks Bike Lane Multi-Use Path I District Identity B C C D F I B C d I H G
Rain Garden
Bike Lane
Bioswale Multi-use Path District Identity
Porous Pavement
Neighborhood Centers are place-making tools which provide local scale services that can be supported by residential land uses.
Providing for pedestrian and bicycle connectivity, green infrastructure, public gathering spaces, higher densities and deliberate building form are all hallmarks of successful Neighborhood Centers.
Design elements that the cities along the corridor should explore in creating well-designed neighborhood / town centers along 40 Highway include:
Reduced Setbacks from Streets to Building Fronts
Many of the existing developments along 40 Highway feature a broad expanse of parking located between the main road and building frontages. This pattern creates a less desirable appearance for developments in the zone between the street and buildings and negatively impacts the walkability of the area from surrounding neighborhoods and between businesses.
In order to create a more aesthetically pleasing and marketable design for developments along 40 Highway, the communities should consider requiring reduced setbacks along either side of the main corridor. The cities may even wish to explore requiring the fronts of buildings to be located up against the right-of-way of the corridor, in order to create a more uniform look and feel and to enhance the aesthetic quality.
Increased Density in Commercial and Residential Development
In order to create districts that feature enhanced vitality and facilitate greater levels of activity at all hours, the communities along the corridor should tailor zoning and regulations for the neighborhood districts to encourage the development of residential, office, and retail space at increased densities, compared to the historical norm in Jackson County. Specifically, assuming the communities would like to generate interest and demand for enhanced bus service along 40 Highway in the future, neighborhoods and town centers should ideally develop at densities of at least 15 dwelling units per acre or about 30 people per acre. As mentioned, the KCATA and various state and federal funding agencies are more likely to provide funding for corridors that have established plans to provide greater density in terms of residential units and employment centers, in order to produce higher rates of transit usage.
In addition, the neighborhood centers and town centers along 40 Highway should include retail and office space developed at increased density, including higher Floor Area Ratios (FARs) than average suburban developments. Whereas most retail and office developments in Jackson County have an average FAR of 0.1 to 0.3, retail and office development in town centers or neighborhood centers along 40 Highway should develop at FARs of 0.5 or greater.
Mixed-Use Zoning
The vast majority of the parcels along 40 Highway include traditional commercial zoning that does not allow for residential land uses. In order to promote the development of neighborhood centers and town centers that include a greater mix of land uses in close proximity (either horizontally or vertically) the design team recommends that the cities rezone the areas along the corridor to a mixed-use zoning. This zoning would not require that existing property owners convert their parcels to mixed-use developments, but instead would give the property owners the option of developing a larger variety of uses over time.
The following diagrams illustrate three potential land use designations of the four focus areas. The diagrams illustrate potential neighborhood or town centers that could evolve as redevelopment occurs over time. Scenario 1 for each of the areas represents the existing pattern of land uses. Scenario 2 represents a hybrid approach, in which some parcels in the study area develop with a mixture of land uses and other areas retain their existing patterns of suburban development. The project team recommends that the communities pursue the Scenario 3 land use designations for the focus areas in order to create districts of the greatest vitality over time.
These new districts are centered around mixed-use buildings, including retail, residential, and office land uses, that would orient toward internal streets running north-south and east-west. Orienting buildings closer to the streets would allow for the creation of a “Main Street” feel within the development. These “Main Streets” should develop as pedestrian oriented streets with street trees along both sides. Linear parks and public plazas can connect to the corridor and create community gathering spaces and / or connections to recreation areas.
Recommendations | 89
Form Based Code Standards for Architecture
Neighborhood centers along 40 Highway should develop using common standards for building construction, architecture, and design in order to create a consistent look or theme along the corridor and to maintain certain standards of quality or appearance between different buildings. Some of the more notable mixeduse developments in the region over the last ten years, including Mission Farms and Park Place, have included design standards and guidelines devised to create a consistent, higher quality appearance in these districts. The cities should articulate distinct design standards, either through city ordinances or through creation of a Form Based Code for the corridor, in order to achieve this goal.
Creation of Community Gathering Places and Amenities
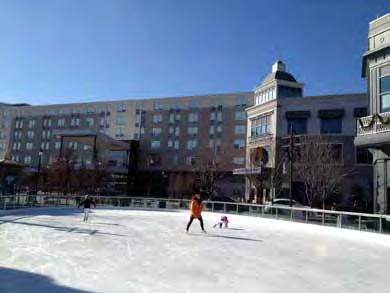
The potential neighborhood centers along 40 Highway should include the design of community gathering places, such as central plazas or parks, as well as integration of additional amenities such as public art or enhanced signage and wayfinding, in order to enhance marketability and create a more distinct sense of place. Examples of community gathering places include public ice skating facilities, fountains, small performance spaces, and seating areas. Similar to town greens or town square parks in smaller towns, these gathering places can help serve as a focus of activity and help to bring more people to these neighborhood or town center districts.
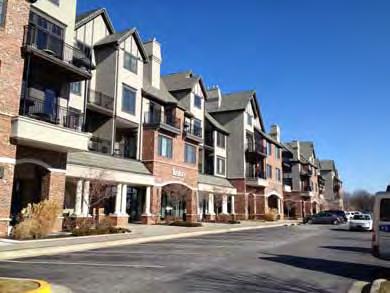
Highway 40 Corridor Plan | Focus Area Plans 90 | Recommendations
Consistent Design Themes at Mission Farms Development in Leawood
Ice Skating Rink at Park Place, Leawood
development Center Examples
The following diagrams illustrate some regional examples of town and neighborhood centers that demonstrate precedent redevelopment patterns that can serve as models for the focus areas along 40 Highway. These centers illustrate the principles of the Creating Sustainable Places initiative focused on connected, vibrant and green communities where mixed-use developments are scaled to the pedestrian. Typical characteristics include:
• Mixed-use development (vertical or horizontal), including a variety of housing choices;
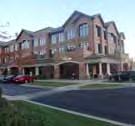
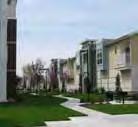
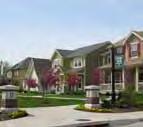
• Interconnected street system and connections to adjacent or future development;
• Pedestrian-oriented street and building design;
• Reduced building setbacks, street widths and turning radii;
• Minimized parking and maximized transit, bike, and pedestrian access;
• Civic and park spaces within walking distance of residential
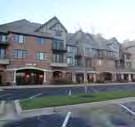
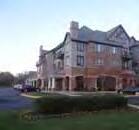
Study Area: 37.6 acres
Building Area: 7.1 acres
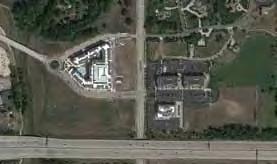
Surface Parking Area: 6.2 acres
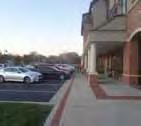
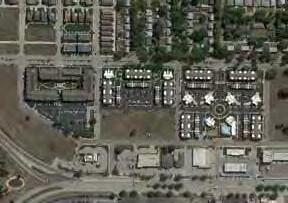
Pedestrian Activity Area: 1.3 acres
Study Area: 27.1 acres
Building Area: 3.9 acres
Surface Parking Area: 5.5 acres
Pedestrian Activity Area: 0.12 acres
Building Footprint
Surface Parking
Parking Structure
Primary Pedestrian Activity Space
Primary Pedestrian Circulation Space
Recommendations | 91 n O r T HGATE n o rth Kansas City 660’ (1/8 MILE)
neighborhood Center - Major Tenants: North Kansas City Community Center, Residential
660’ (1/8 MILE) M I SSIO n FA r MS
neighborhood Center - Major Tenants: Boutique Retail, Dining, Spa/Salon, Fitness, Residential
Leawood
Study Area: 66.7 acres
Building Area: 18.6 acres
Surface Parking Area: 9.1 acres
Pedestrian Activity Area: 0.5 acres
Study Area: 77.7 acres
Building Area: 11.8 acres
Surface Parking Area: 16.1 acres
Pedestrian Activity Area: 0.5 acres
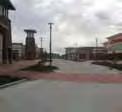
Study Area: 56.3 acres
Building Area: 4.7 acres
Surface Parking Area: 2.3 acres

Pedestrian Activity Area: 0 acres
neighborhood Center - Major Tenants: University of Kansas Hospital, University of Kansas Medical Center, Retail, Dining, Residential
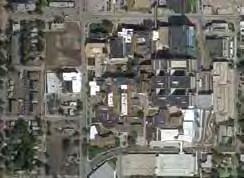
Town Center - Major Tenants: Von Maur, Scheels, Lifetime Fitness, Sprout’s Farmers Market, JC Penney
neighborhood Center - Major Tenants: Residential, Office, Retail
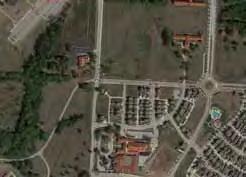
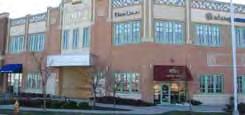
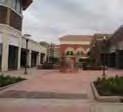
Building Footprint
Surface Parking
Parking Structure
Primary Pedestrian Activity Space
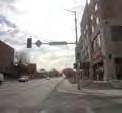
Primary Pedestrian Circulation Space
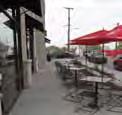
Highway 40 Corridor Plan | Focus Area Plans 92 | Recommendations CO r BI n PA r K O verland Park 660’ (1/8 MILE) nE w LO n G VIE w L ees Summit 660’ (1/8 MILE) 660’ (1/8 MILE) 39 th & r A I n B O w K ansas City
Study Area: 30.04 acres
Building Area: 9.8 acres
Surface Parking Area: 11.5 acres
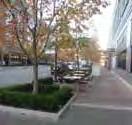

Pedestrian Activity Area: 1.1 acres
Study Area: 39.5 acres
Building Area: 18.7 acres
Surface Parking Area: 2.8 acres
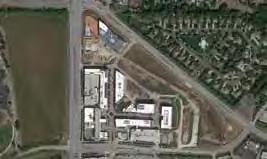
Pedestrian Activity Area: 0.9 acres
Study Area: 13.6 acres
Building Area: 6.6 acres
Surface Parking Area: 0.9 acres
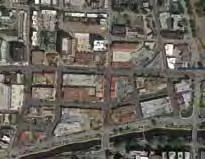
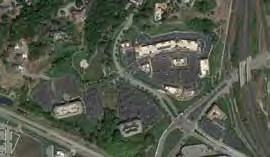
Pedestrian Activity Area: 0.4 acres
neighborhood Center - Major Tenants: Boutique Retail, Dining, Spa/Salon, Fitness
Town Center - Major Tenants: H&M, Michael Kors, Tiffany & Co., Burberry, Halls, L’Occitane, Apple, Tommy Bahama, Anthropologie, Sur La Table, The North Face, St. John, Capital Grille
Town Center - Major Tenants: Boutique Retail, Dining, Spa/Salon, Fitness
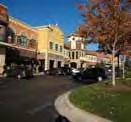
Building Footprint
Surface Parking Parking Structure
Primary Pedestrian Activity Space
Primary Pedestrian Circulation Space
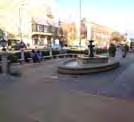
Recommendations | 93 660’ (1/8 MILE) 660’ (1/8 MILE) 660’ (1/8 MILE) C O un T r Y CL u B PA r K PLACE B r IA r C LIFF
VILLAGE
K ansas City K ansas City L eawood
National Neighborhood Center Development Examples
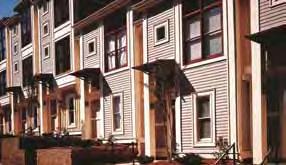
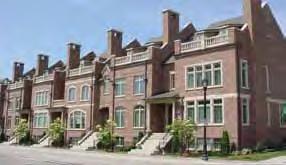
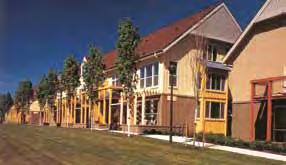
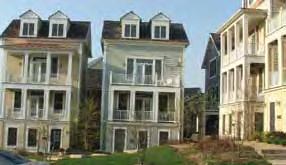
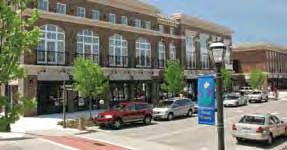
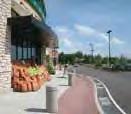
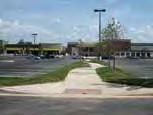
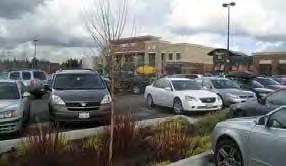
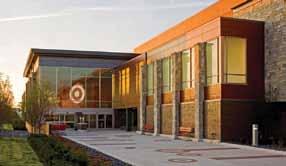
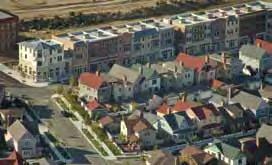
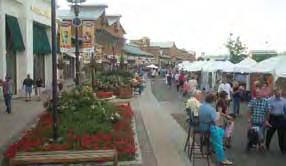
Multi
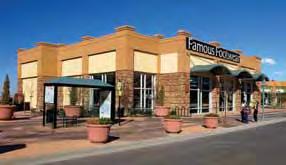
Highway 40 Corridor Plan | Focus Area Plans 94 | Recommendations
District | Uses and
Character
Neighborhood Retail: Flatiron Marketplace, Broomfield, Colorado
Big Box Retail: Bloomfield Hills, Michigan
120 East Main Street, Aspen, Colorado 81611 tel) 970 925 8354 fax) 970 920 1387 www.designworkshop.com J an 2010
Big Box Retail: Aspen Grove, Littleton, Colorado
Multi-family Housing: Promenade, Hercules, California
Big Box Retail: Town and Country Crossing, Clayton, Missouri
Neighborhood Retail: Edgewood Retail District, Atlanta, Georgia Big Box Retail
and Character
Big Box Retail: One Nineteen, Leawood, Kansas
Neighborhood District | Uses
Neighborhood Retail: Broomfield, Colorado
Townhomes: Kentlands, Gaithersburg, Maryland
Manchester
s t. Louis c ounty,
Family Housing: Portland, Oregon
road
Missouri
Multi-family Housing:
Single Family Townhomes: Palatine, Illinois
Neighborhood Retail: Atlanta, Georgia
Multi Family Housing: Charlotte, North Carolina
Big Box Retail: One
National Town Center Development Examples

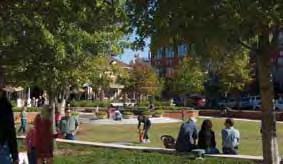
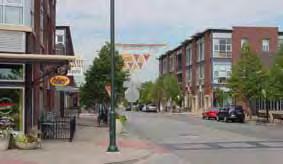
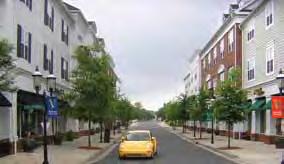
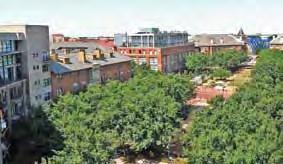
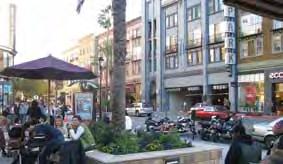
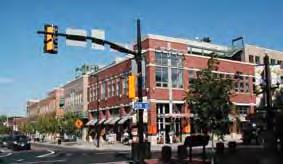
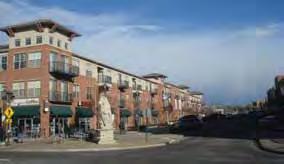
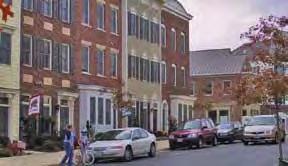
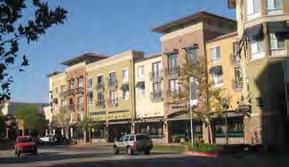
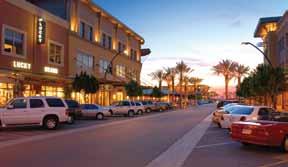
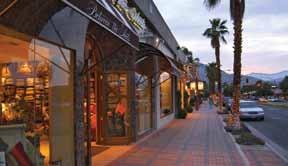
Recommendations | 95
Character
The Gardens on El Paseo, Palm Desert, California
Keirland Commons, Scottsdale, Arizona
120 East Main Street, Aspen, Colorado 81611 tel) 970 925 8354 fax) 970 920 1387 www.designworkshop.com Pearl
Englewood Town Center, Colorado
Street, Boulder, Colorado
Valencia
California
Santana Way, San Jose, California
Town Square, Valencia,
Addison Circle, Addison, Texas
Kentlands, Gaithersburg, Maryland
Character
Kierland Commons, Scottsdale, Arizona
The Gardens on El Paseo, Palm Desert, California
Keirland Commons, Scottsdale, Arizona
120 East Main Street, Aspen, Colorado 81611 tel) 970 925 8354 fax) 970 920 1387 www.designworkshop.com J an 2010 Pearl
Englewood Town Center, Colorado
Street, Boulder, Colorado
Santana Way, San Jose, California
Valencia Town Square, Valencia, California
Addison Circle, Addison, Texas
Kentlands, Gaithersburg, Maryland
Town Center | Character
Santana Row, San Jose, California
Birkdale Village, Charlotte, North Carolina
The Gardens
Manchester road s t. Louis c ounty,
Keirland Stapleton, Denver, Colorado
Missouri Valencia The Grove, Los Angeles, California
Kentlands, The Woodlands, Houston, Texas
Corridor wide Strategies
Figures 50 through 55 illustrate the potential strategies and locations where the key recommendations for the various sections along 40 Highway would be implemented over time.. The diagrams demonstrate how the improvements along and near the 40 Highway Corridor can enhance linkages between communities and focus areas to create a more vibrant corridor that supports all modes of travel as redevelopment takes place.
Potential Conversion to Three Lanes.
Potential Conversion to 3 Lanes
Importantly, Kansas City should explore the idea of narrowing 31st Street from two travel lanes in each direction to one travel lane in each direction, plus a center turn lane, in order to provide more room within the right-of-way for wider sidewalks, aesthetic improvements, and onstreet parking. As redevelopment occurs in this area, allowing more pedestrian space and on-street bike facilities in the form of shared lane markings will help to facilitate access for all modes of travel. Figure 47 shows the potential road section for 31st Street at the 31st and Prospect Node. Further study would be required to determine feasibility.
Roadway Improvements Potential Parkway Improvements
As described in the preceding section, the 40 Highway Corridor has many opportunities due to the expansive right of way in many sections to enhance the roadway function, aesthetic appeal and environmental functions such as stormwater management along the roadway. Parkway enhancements can include a number of strategies including planted medians with turn pockets, street trees, signage and wayfinding enhancements and regulations, and green or low impact stormwater strategies. The enhancements can help make 40 Highway a preferred route without impacting the vehicle level of service.
Figures 48 and 49 show two different parkway options that could be implemented along 40 Highway that illustrate reduced drive lane widths, landscape enhancements and street trees in addition to bike and pedestrian accommodations.
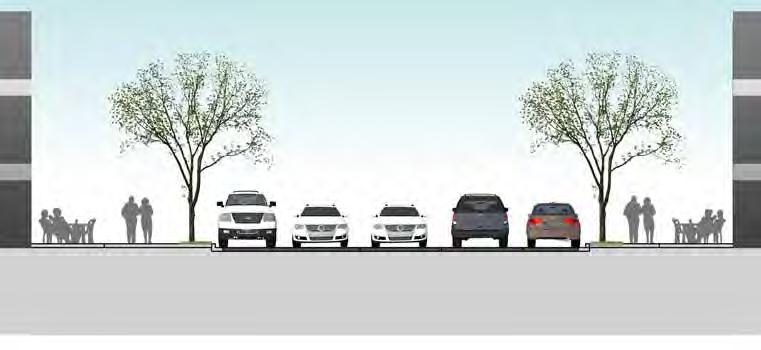
Highway 40 Corridor Plan | Focus Area Plans 96 | Recommendations
8’-6” Parking 11’ Drive Lane 11’ Drive Lane 11’ Drive Lane 8’-6” Parking 5’ Landscape 5’ Sidewalk 15’
75’
Figure 26: Potential Roadway Section for 31st Street with a Road Diet
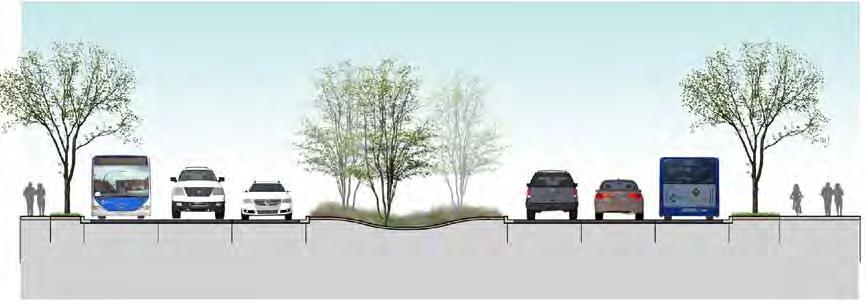
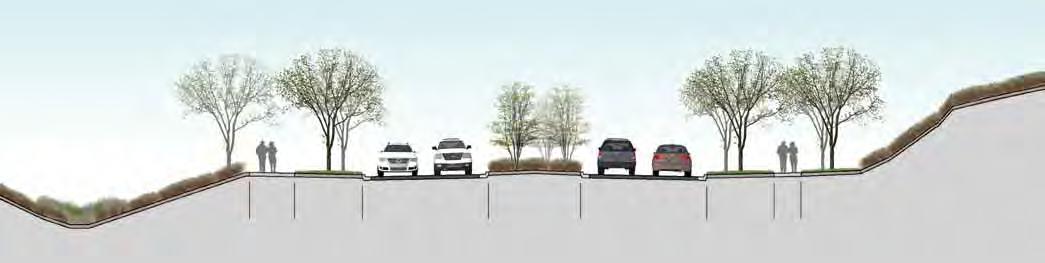
Recommendations | 97
Figure 27: Prototypical Parkway Sections for 40 Highway - 4 Travel Lanes
4.5’ Landscape 11’ Drive lane 11’ Drive lane 11’ Drive lane 5’ Landscape 4.5’ Sidewalk 30’ Median Swale for Stormwater 11’ Drive lane 11’ Drive lane 11’ Drive lane 12’ Multi-use Trail 125’ Multipurpose Trail Green Space Traffic Lanes Median Traffic Lanes Green Space Sidewalk Existing Grade Vegetated Swales
Figure 28: Prototypical Parkway Section for 40 Highway - Six Travel Lanes
Potential Transit Improvements Potential Transit Improvements
The 40 Highway Corridor currently lacks transit service along the length of the study area. While transit improvements will take time and further study it is important to ensure that any changes made to the corridor in the short term do not impact its capacity to serve as a transit corridor over the long term with enhanced bus service, as described in the transportation recommendations section.
Potential Redevelopment Areas Potential Redevelopment Area
Within each city and as collaborative efforts at nodes that engage both Independence and Kansas City, upcoming planning efforts should build on past planning efforts and continue to explore the redevelopment potential for each of the focus areas, including 31st and Prospect, Blue Ridge Cutoff, Noland Road, and Adams Dairy Parkway. In addition the areas at Bruce R Watkins Parkway, Van Brunt Boulevard, the I-70 interchange at Blue Ridge Boulevard, Lee’s Summit Road, and 7 Highway all present additional locations where development could intensify and a range of housing and mixed-use development could be encouraged.
While streetscape improvements should take place along the length of the corridor, they are particularly important where redevelopment efforts are poised to occur. Strategies should be focused on stimulating redevelopment, and supporting ideas for community gathering places, parks, signage and lighting, and related elements. The preceding section provides further detail about the four main focus areas covered in this plan in addition to a focus area at Van Brunt Boulevard and an additional focus area at Lee’s Summit Road.
Potential Mixed Use Zone Potential Mixed Use Zone
These potential mixed use zones offer property owners more opportunities to redevelop according to new market demands and trends. Some of the primary locations for this type of zoning might include the area along 40 Highway between Blue Ridge Cutoff and Noland Road; between Noland Road and Phelps Road; between Lee’s Summit Road and Bass Pro Drive; and between Woods Chapel Road and 7 Highway.
Bike Facilities and Key Connections
Enhanced Linkages
Planned Bike Routes / Multi-Use trails

As the planning effort for 40 Highway moves forward, the communities should explore opportunities to enhance bike and pedestrian connections along or parallel to the parkway that can facilitate travel all the way from Grain Valley to the heart of the city. There are many existing and planned regional or city wide trails that cross 40 Highway running north and south into the various communities. In the urban area from Bruce R Watkins to Van Brunt Boulevard bike facilities are likely to include on-street sharrows to help educate drivers that bikes may be present and to show bicyclists the proper direction of travel and positioning within the roadway. To the east of Van Brunt where the right-of-way is wider it is possible and desirable to build a separated, multi-use trail that can accommodate both bicyclists and pedestrians and serve both recreation and transportation needs of the adjacent communities.
Some initial key investments to improve pedestrian and bike connections include improvements along Blue Ridge Cutoff between 40 Highway and Interstate 70, at the point where 40 Highway and Interstate 70 intersect to the east of Sterling Road, across 40 Highway and Interstate 470, and at the crossing of the Little Blue Trace Trail. Improvements may include better sidewalks or paths, signage and signal improvements, crosswalk enhancements and other pedestrian and bike best practices to facilitate improved safety and comfort for non-motorized modes.
Highway 40 Corridor Plan | Focus Area Plans 98 | Recommendations
Connections / Signage and Wayfinding)
(Bike/Ped
Potential Gateways and Monumentation

Potential Gateway Monumentation
The cities along 40 Highway should work with MoDOT to explore options to enhance the gateway monumentation and signage for the highway corridor as well as adjoining districts in the various communities along the route. Many communities in the middle of the country have included signage and monumentation enhancements along primary arterials in order to announce or publicize their communities or to create a more attractive and exciting entrance. For example, the City of Lenexa worked with KDOT to create a very attractive gateway including monumentation, landscaping, and other elements on the 87th Street Parkway bridge over I-35. The new 87th Street interchange has helped to create a more attractive entrance into Lenexa and ties with ongoing corridor aesthetic improvements along 87th Street Parkway to the west.
The cities should explore ideas to create true district identities for different areas along the corridor that can be highlighted through signage and wayfinding strategies. These gateways also provide opportunities to raise awareness about different opportunities accessed from 40 Highway. Some initial gateway opportunities might include gateway monumentation identifying Truman Sports Complex, gateway markers to identify Fleming Park and Blue Springs Lake along 40 Highway and Woods Chapel Road, and markers and signage for the downtown commercial districts of each of the cities accessed by 40 Highway including downtown Independence, Lee’s Summit, Raytown, and Blue Springs.
Potential Park/Open Space Locations
Potential Open Space/Park
Potential Park Space (not identified at specific locations)
The cities should explore ideas to create small park areas along the corridor to enhance the aesthetics, environmental functions, stormwater management, and opportunities to enjoy the outdoor environment. Maintaining open space corridors provides important environmental services and there are a few places along the corridor where these areas can be conserved and restored.
Recommendations | 99
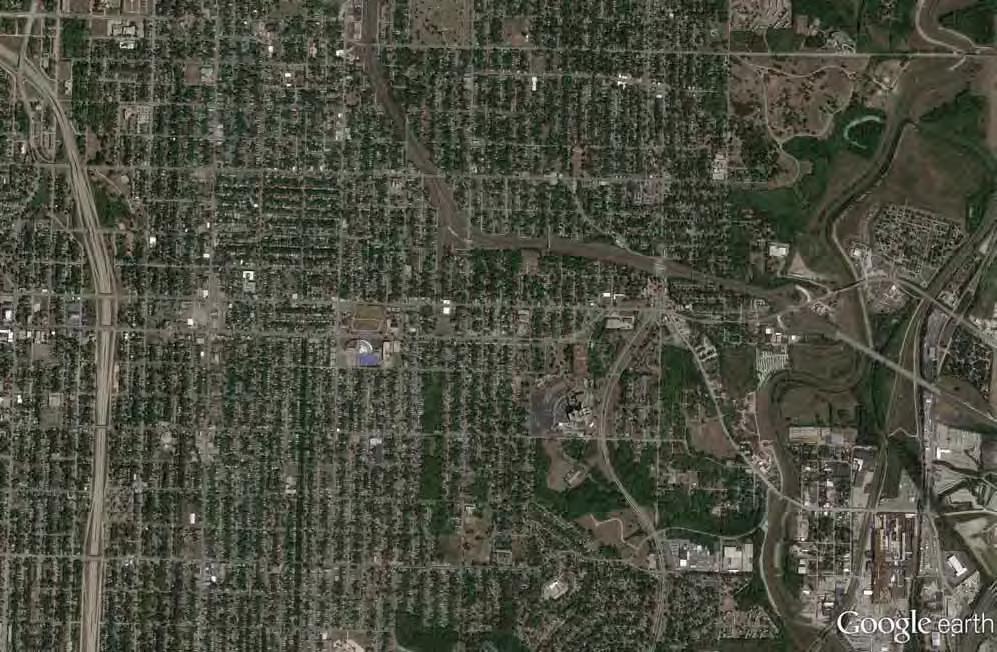


Highway 40 Corridor Plan | Focus Area Plans 100 | Recommendations EULB REVIR REVAELC I I B L V D VAN BRUNT BLVD STADIUM DR. M SEHCNA TER TRAFFIC W A Y BRUCE R WATKINS PKY LINWOOD BLVD Central Park VA Medical Center Blue Valley Park Dunbar Park Liberty Park 31ST STREET * * * Bruce R Watkins to Van Brunt Boulevard 40 71 70 Potential Conversion to 3 Lanes (2 travel lanes, center turn lane, possible bike lane or wider sidewalks, and parallel parking) Potential Transit Improvements Potential Parkway Improvements Proposed City Wide Trail Potential Additional Trail or Bike/Ped Facility Potential Business Park Potential Redevelopment Project PROSPECT AVENUE POTENTIAL TRAIL / GREENSPACE CONNECTION POTENTIAL TRAIL / CONNECTION POTENTIAL BUSINESS PARK REDEVELOPMENT POTENTIAL TRAIL / GREENSPACE CONNECTION VAN BRUNT MIXED USE REDEVELOPMENT AREA 31ST & PROSPECT REDEVELOPMENT AREA HIGHWAY FOCUSED REDEVELOPMENT AREA US 71/Bruce R Watkins Transit Study is looking at either a combined Bus Rapid Transit service on Bruce R Watkins and Prospect Ave or a Diesel Multiple Unite (DMU) Alignment operating in a shared right-of-way with the Kansas City Southern Railroad/ Kansas City Terminal Railroad. www.kcsmartmoves.org Existing Park
Figure 29: Bruce R Watkins to Van Brunt Boulevard Corridor Recommendations
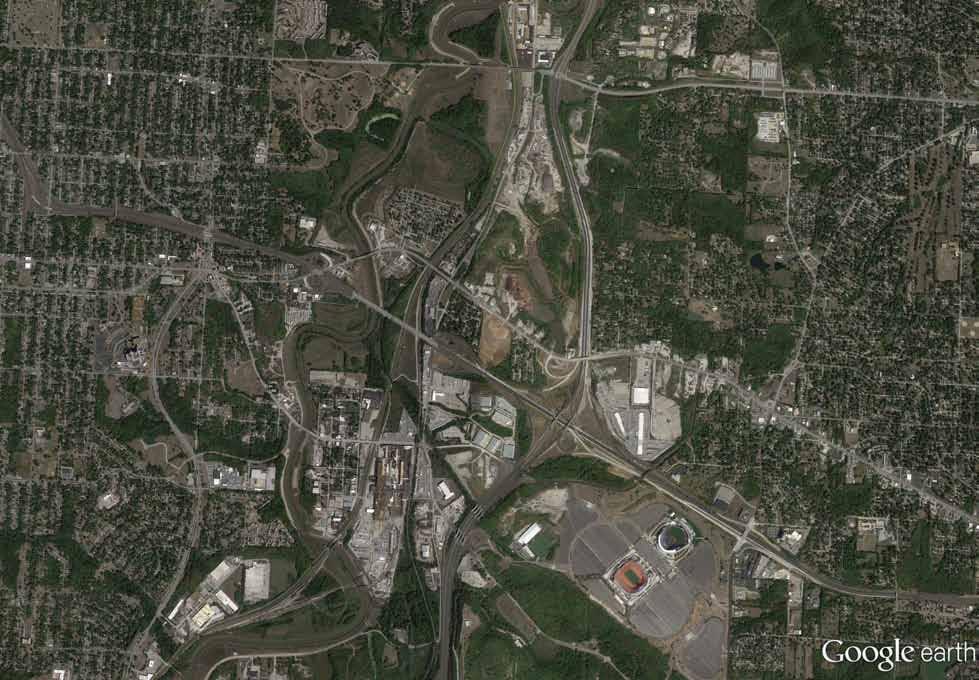
Recommendations | 101 Liberty Park Blue Valley Park BLUE RIVER STADIUM DR 23RD STREET CLEAVER II B L DV VAN BRUNT BLVD B L U E R I D G E C OTU F F MANCHESTERTRAFFICW A Y BLUERIVER TRAIL VA Medical Center LINWOOD BLVD Truman Sports Complex + * * * * * Van Brunt Boulevard to Blue Ridge Cutoff 70 40 435 KATY TRAIL Potential Conversion to 3 Lanes (2 travel lanes, center turn lane, possible bike lane or wider sidewalks, and parallel parking) REDEVELOPMENT AREA NEW INTERCHANGE BLUE RIDGE CUTOFF MIXED USE REDEVELOPMENT AREA ENHANCED LINKAGES TO 40 MIXED USE REDEVELOPMENT AREA POTENTIAL BUSINESS PARK REDEVELOPMENT VAN BRUNT MIXED USE REDEVELOPMENT AREA Potential Transit Improvements Potential Parkway Improvements Potential Redevelopment Area Proposed City Wide Trail Future Bike Facility Potential Business Park Existing Park 31ST STREET
Figure 30: Van Brunt to Blue Ridge Cutoff Corridor
Recommendations
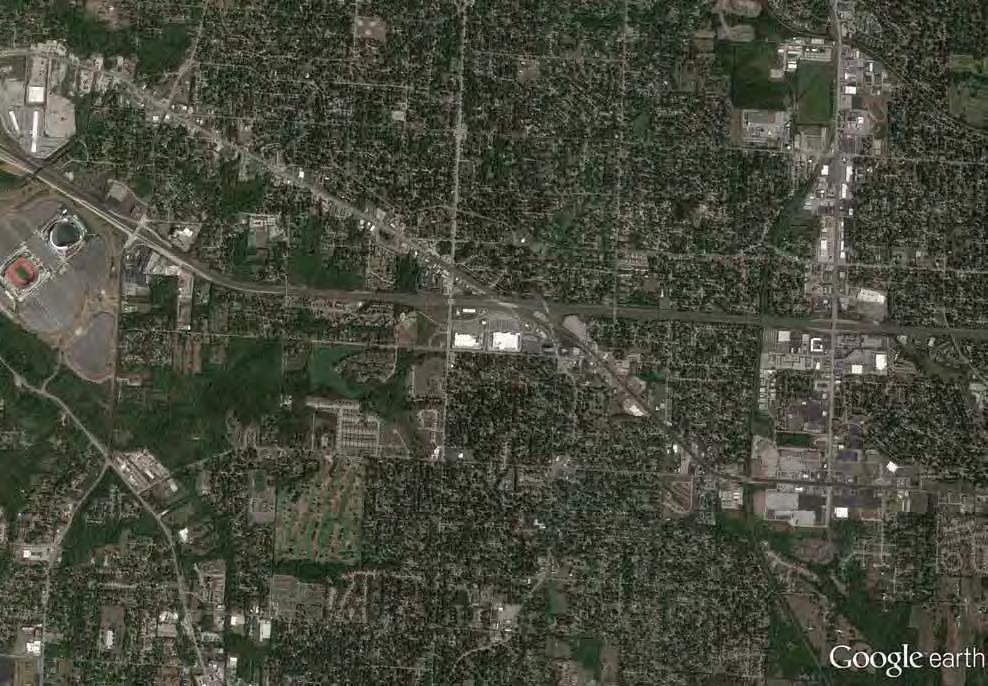


Highway 40 Corridor Plan | Focus Area Plans 102 | Recommendations Truman Sports Complex N OLA ND ROAD STERLING CRYSLER BLUE RIDGE CUTOFF * Gateway Monumentation * * * * Blue Ridge Cutoff to Noland Road 70 40 ENHANCED BIKE / PEDESTRIAN CONNECTIONS BLUE RIDGE CUTOFF MIXED USE REDEVELOPMENT AREA LANDSCAPE BUFFER FOR EXISTING RESIDENTIAL MIXED USE REDEVELOPMENT AREA ADDITIONAL SMALL PARK SPACE ON VACANT PARCELS Potential Transit Improvements IMPROVE PEDESTRIAN CONNECTIONS AT INTERCHANGE MIXED USE ZONING TO ENCOURAGE REDEVELOPMENT NOLAND RD MIXED USE DISTRICT Planned Streetscape Enhancements * Potential Redevelopment Area Potential Business Park Enhanced Linkages (Bike/Ped Connections Signage and Wayfinding) Potential Park Space (not identified at specific locations) Potential Parkway Improvements Planned Bike Route * *
Figure 31: Blue Ridge Cutoff to Noland Road Corridor Recommendations
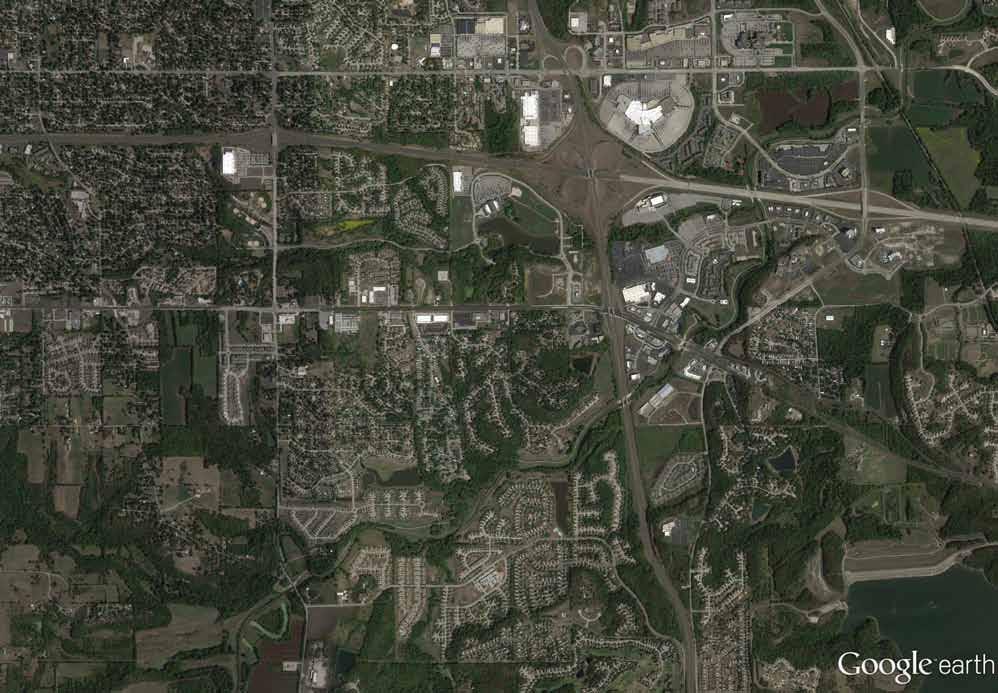
Recommendations | 103 Adair Park Linear Park Connection L E E ’ S S U M M I T R D LITTLEBLUEPARKWAY BASSPRO DRIVE SPLEHP R D LITTLEBLUE TRACE TRAIL * LEE’S SUMMIT ROAD MIXED USE AREA REZONE TO MIXED USE IMPROVE BIKE / PED CONNECTIONS IMPROVE BIKE / PED CONNECTIONS TO EXISTING TRAIL EXPLORE OPTIONS FOR OPEN SPACE / PARK WITHIN MEDIAN AREA 70 470 40 Phelps Road to Little Blue Parkway Existing Retail Area ADDITIONAL SMALL PARK SPACE ON SMALL LOTS Potential Transit Improvements * Potential Redevelopment Area Enhanced Linkages (Bike/Ped Connections Signage and Wayfinding) Potential Park Space (not identified at specific locations) Potential Parkway Improvements Planned Bike Route Existing Bike Route Potential Mixed Use Zone Potential Open Space/Park
Recommendations
Figure
32:
Phelps Road to Little Blue Parkway Corridor
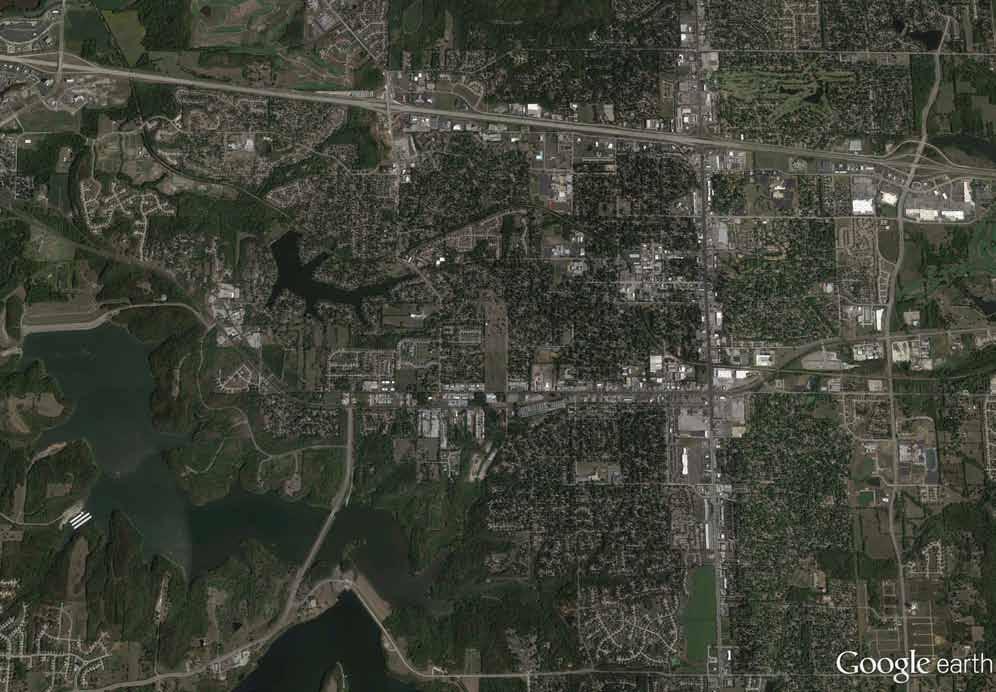

Highway 40 Corridor Plan | Focus Area Plans 104 | Recommendations LAKE TAPAWINGO Blue Springs Lake Fleming Park Lee W O O DS CHAPEL R D Planned Streetscape Enhancements DOWNTOWN BLUE SPRINGS * * * EXPLORE OPTIONS FOR OPEN SPACE / PARK WITHIN MEDIAN AREA SUPPORT PLANNED IMPROVEMENTS FOR 7 HIGHWAY REVITALIZATION GATEWAYS TO PARK AREA / BLUE SPRINGS LAKE REZONE TO MIXED-USE TO SUPPORT REDEVELOPMENT 7 HIGHWAY MIXED USE REDEVELOPMENT AREA ADAMS DAIRY PARKWAY REDEVELOPMENT AREA IMPROVED GATEWAYS TO DOWNTOWN BLUE SPRINGS * * 70 40 WOODS CHAPEL RD 10TH STREET 7 Lake Tapawingo to Adams Dairy Parkway Potential Transit Improvements * Potential Redevelopment Area Enhanced Linkages (Bike/Ped Connections Signage and Wayfinding) Potential Park Space (not identified at specific locations) Potential Parkway Improvements Planned Bike Route Existing Bike Route Potential Mixed Use Zone Potential Open Space/ Park
Figure 33: Lake Tapawingo to Adams Dairy Parkway Corridor Recommendations
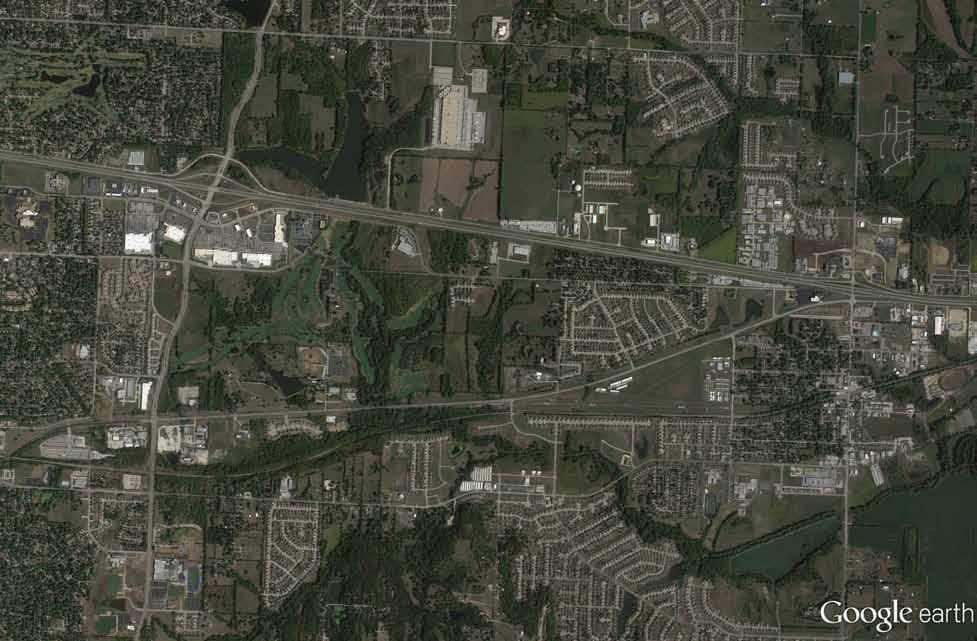


Recommendations | 105 BUCKNER TARSNEY RD ADAMSDAIRY PARKWA Y Missouri Innovation Park Downtown Grain Valley Adams Pointe Golf Course * * Gateway Monumentation * 40 70 Adams Dairy Parkway to Grain Valley Long Term Expansion to 4 Lanes Potential Parkway Improvements Existing Multi-use Trail Planned Multi-use Trail POTENTIAL TRANSIT ORIENTED DEVELOPMENT AREA IMPROVED BIKE / PED CONNECTION ACROSS I 70 EXISTING TRAIL CURRENT REALIGNMENT OF 40 HIGHWAY * Potential Redevelopment Area Enhanced Linkages: Bike/Ped Connections Signage and Wayfinding Potential Transit Improvements
Recommendations
Figure
34:
Adams Dairy Parkway to Buckner Tarsney Road (Grain Valley) Corridor
Land
use / redevelopment recommendations by Focus Area
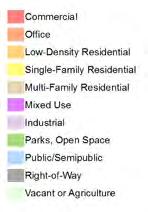
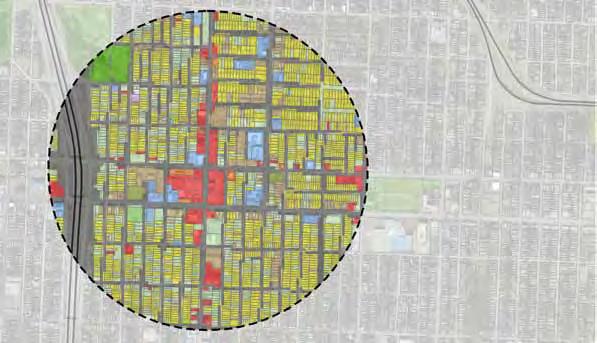
31st and Prospect Overview
The focus area at 31st Street and Prospect Avenue falls within the urban core just to the southeast of Downtown Kansas City. The area within a 1/2 mile walking distance from the intersection has a population of 4,692 and an average density of 5.4 dwelling units per acre. The commercial area of the node is located within an established residential neighborhood with predominantly single family homes and some multifamily units, many of the historic homes are vacant and in disrepair and physically represent the area’s problems with crime and disinvestment. For both the residential and commercial properties there was a 30% vacancy rate as of the 2010 census. The Lucile H Bluford Public Library is a community destination and resource serving as the cornerstone of activity. The existing commercial development on the southwest corner consists of an older big box retail center that is currently vacant and a strip retail center on the northwest corner.
The node is well-served by local transit services and has a well-established network of sidewalks, though some are in need of significant repairs and aesthetic improvements to better support pedestrians. There is an on-street bike route proposed for Linwood Boulevard. Prospect Avenue and Linwood Boulevard are both classified in the Heart of the City plan as “Primary Transit Corridors”.
With the more urban context of this node and the connectivity of the grid network, the area faces a different set of challenges than the other, more suburban nodes along the 40 Highway Corridor. The Heart of the City neighborhood plan identifies the area as a mixed use activity center with a goal to eliminate the strip commercial zoning pattern that currently exists. The area is intended to have a pedestrian focus to serve both businesses and residences.
Highway 40 Corridor Plan | Focus Area Plans 106 | Recommendations
4% 6% 3% 3% 23% 12% Commercial Industrial Low Density Residential Multi-Family Residential Office Parks, Open Space Public/Semipublic Single Family Residential Vacant/Agriculture 1/2MileWalkingDistance Qu I CK S TATS Population (2010) 4,692 Households (2010) 2,712 Density - Dwelling Units/Acre (2010) 5.4
Figure 35: Existing Land Use
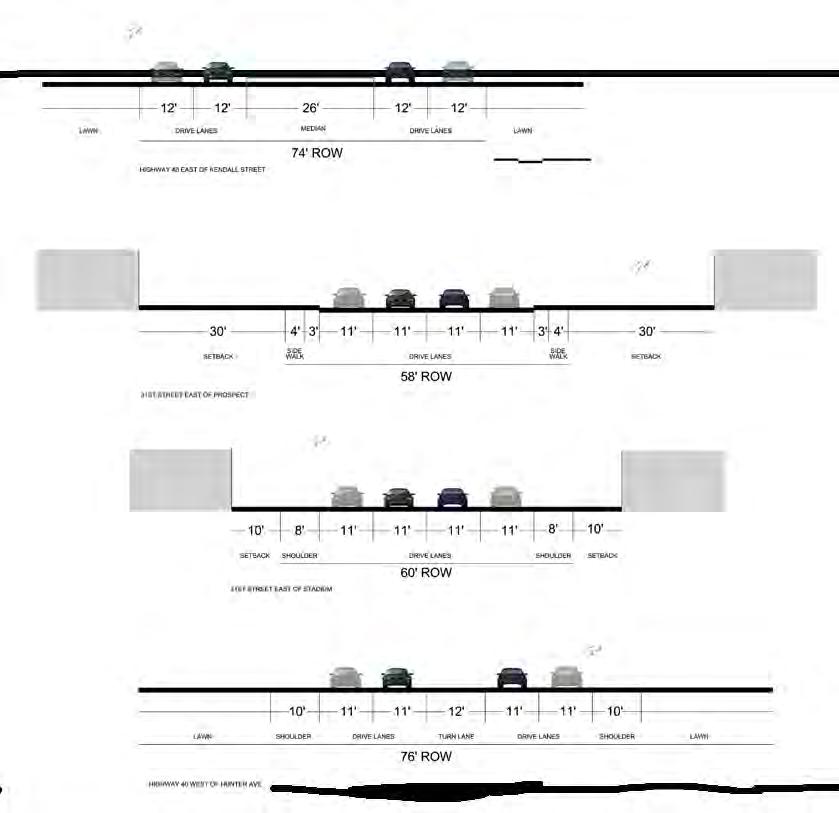

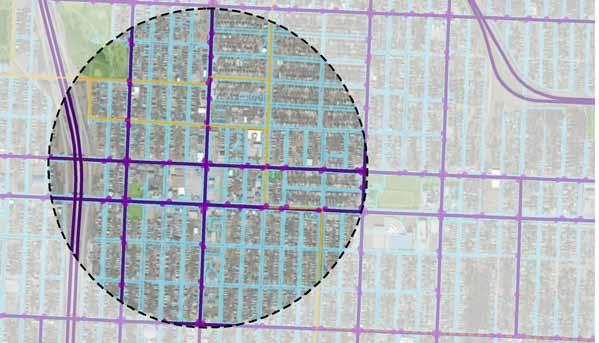
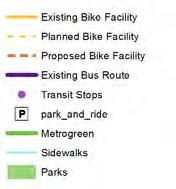
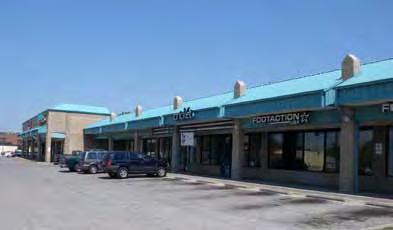
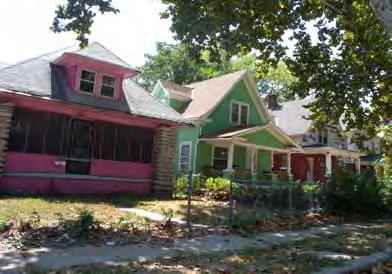

1/2MileWalkingDistance
Figure 36: Transit and Bike Facilities
Top: Linwood Square Commercial Area on the northeast corner of 31st Street and Prospect
Middle: Typical single family residences within 1/2 mile of the commercial node
Bottom: Vacant retail space on the southwest corner of the node
31ST and Prospect Area recommendations
As illustrated in the conceptual diagram, Figure 30, the project team recommends that the City of Kansas City work with prospective developers and property owners in the 31st Street and Prospect Avenue area to densify and fill in the “missing teeth” of the urban framework underpinning this part of the city. Compared to the sites of former shopping centers or failed retail projects in most suburban locations, the neighborhoods around 31st and Prospect already have many of the ingredients necessary to create and sustain a great neighborhood center in place. The area already benefits from a well-articulated and easy to follow urban grid of streets. Civic gathering places and centers such as the local branch of the Kansas City Library, and a number of well-established and historic churches, operate in the vicinity. A number of small parks support the surrounding neighborhood, as well as some additional community gardens. Transit lines already serve the area along 31st Street, Linwood, and Prospect. The City of Kansas City should work with developers to complete catalytic projects along the main corridors that will help to stimulate and sustain the ongoing repopulation of the area and further investment in neighborhood housing and services.
The market scan suggest that, at least in the short term, the area is not anticipated to grow on its own and may continue to slowly lose population over the next few years. Therefore, a key aim of many of the ideas discussed for this plan concern leveraging spending and economic power off of Bruce R. Watkins Parkway, a major freeway through the middle of the city that passes within a few blocks of the 31st and Prospect area. Central city areas that lack inherent growth within their neighborhoods often first move toward redevelopment by leveraging their adjacency to freeways and overall regional access. The central location of this neighborhood and its access to US 71 mean that redevelopment in this area could draw from a wider area within Kansas City.
The diagram suggests several concepts for redevelopment in the focus area vicinity that can be carried out under the City’s existing B3-2 or Community Business zone district which allows for mixed uses and destination-oriented commercial uses:
• The infill of vacant lots fronting 31st Street, between Bruce R. Watkins and Prospect, in order to better connect the 31st and Prospect area with the Bruce R. Watkins freeway and to, as a result, better take advantage of the significant traffic volumes and regional marketability of the access to Bruce R. Watkins. Redevelopment projects along 31st Street would ideally include more active uses, including retail, restaurants,
or office uses, on the ground floor of buildings, with residential uses on upper floors. This pattern of construction would help to create a more attractive “Main Street” in this part of the city and help to draw visitors and business off of 71 Highway and into the neighborhood. This more urban pattern of development would also help to knit the neighborhoods to the north and south of 31st Street together into a common district and of course would overcome the stigma of vacancies and disinvestment that is highly evident as one travels down 31st Street at the current time.
• Redevelopment of the shopping center at the southwest corner of 31st and Prospect. This property, the site of a failed strip center anchored by a grocery store from the late 1980s, should be designed to provide flexibility as potential space for a variety of uses, though the community would like to see this site used for a grocery store as it has been in the past. For example, orienting the buildings around a courtyard could create a community gathering place that would better attract business, and would help to retain and attract tenants in the future. Developing buildings that include retail or office uses on the ground floor, and residential uses on upper floors, would also help to diversify the economic position of these projects and create more of an active environment at all hours of the day.
• Redevelopment of properties to the north of 31st and Prospect. While the area around 31st and Prospect may more easily orient to the west, given the presence of Bruce R. Watkins a handful of blocks away, the city should also work to fill in the urban fabric of the area to the north of the library. Again, future redevelopment in this block should involve active uses on ground floors and residential or perhaps office uses on upper floors. This orientation would help to create a more substantial and attractive streetscape along Prospect going forward.
This plan recommends that the City of Kansas City marshal all of the potential resources at its disposal to help facilitate the redevelopment of the area. Given it is a large city, it has numerous departments that can help in this regard. Economic development and redevelopment agencies in the city should assist in assembling properties, attracting developers, and actively marketing properties assembled for redevelopment. The City should also work carefully with property owners to educate them about how to develop both vertically and horizontally in terms of mixed-use efforts. Developing vertically, in particular, can pose significant challenges for developers, and the city’s agencies can help develop strategies or incentives that may make vertical development easier.
Highway 40 Corridor Plan | Focus Area Plans 108 | Recommendations
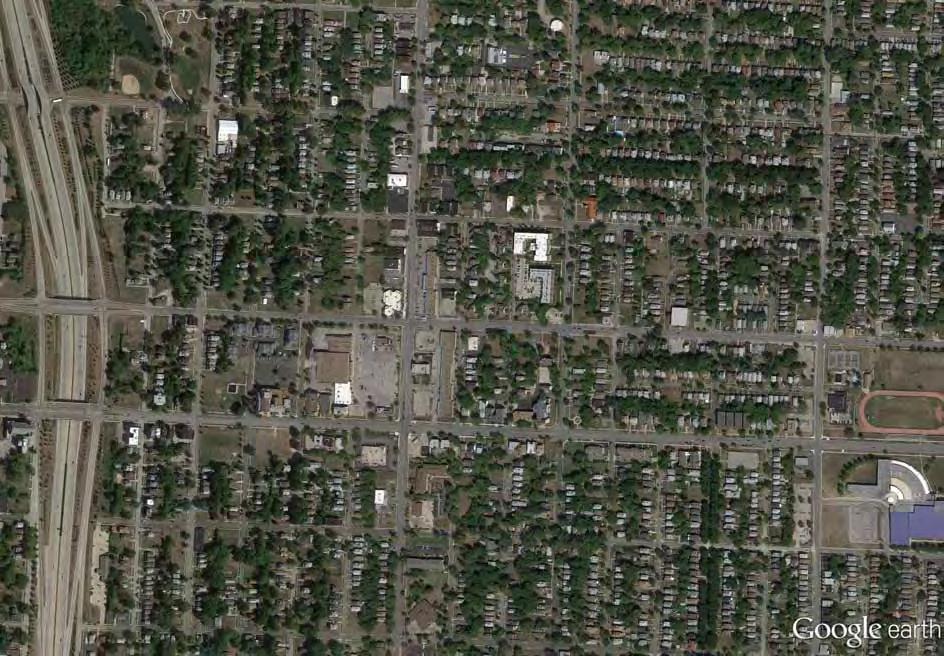


Recommendations | 109 Figure 38: Land Use Potential - 31st Street and Prospect Avenue Potential Redevelopment Opportunities METROPOLITAN MISSIONARY BAPTIST CHURCH LINWOOD BLVD 31ST STREET S PARK AVENUE PROSPECT AVENUE EUCLID AVENUE 71 CHESTNUT AVENUE MIXED USE COMMUNITY RESIDENTIAL MEDIUM/ HIGH DENSITY RESIDENTIAL MEDIUM DENSITY INSTITUTIONAL PARKS MIXED USE NEIGHBORHOOD LIBRARY
Blue ridge Cutoff and 40 Highway Overview
The area around 40 Highway and Blue Ridge Cutoff developed primarily with a mix of highway oriented retail uses, such as gas stations, fast food outlets, car lots, and service businesses, after World War II and never reached the level of prominence of other intersections along the corridor such as Noland Road or 7 Highway. Although it passes by the Truman Sports Complex, Blue Ridge Cutoff primarily serves as a residential oriented arterial, connecting neighborhoods in Independence, Kansas City, Missouri, and Raytown.
The area within a 1/2 mile walking distance from the intersection has a population of 1,752 and an average density of 1.9 dwelling units per acre with mostly single family or low density residential housing centered around the commercial uses at the intersection. The southern and western part of the focus area lies in Kansas City, with the northeast part of the node falling under the City of Independence’s jurisdiction. Independence does not have any current plans in place for this area specifically. Collaboration between the two communities will be critical to creating a cohesive and desirable node.
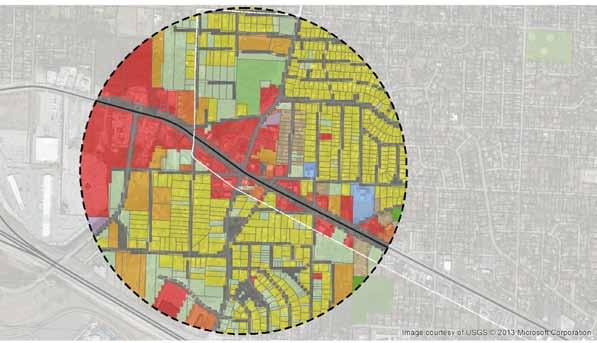
The portion of the corridor that passes through the Blue Ridge Cutoff focus area is served by an existing east-west bus route with stops at the intersection. The pedestrian network is almost entirely absent from the 1/2 mile walking distance from the intersection with only small sections of sidewalk in place. The area lacks designated bicycle facilities, but has proposed bicycle routes along 40 Highway as well as along Blue Ridge Cutoff to the north and south.
Qu I CK S TATS
Population (2010) 1,752
Households (2010) 931
Density - Dwelling Units/Acre (2010) 1.9
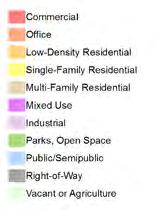
Highway 40 Corridor Plan | Focus Area Plans 110 | Recommendations
56% 1% 2% 1% 1% 1% 11% 5% Commercial Industrial Low Density Residential Multi-Family Residential Office Parks, Open Space Public/Semipublic Single Family Residential Vacant/Agriculture 44% 1% 4% 6% 4% 19% 13% Commercial Industrial Low Density Residential Multi-Family Residential Office Parks, Open Space Public/Semipublic Single Family Residential Vacant/Agriculture
Figure 39: Existing Land Use
1/2MileWalkingDistance
KansasCityIndependence
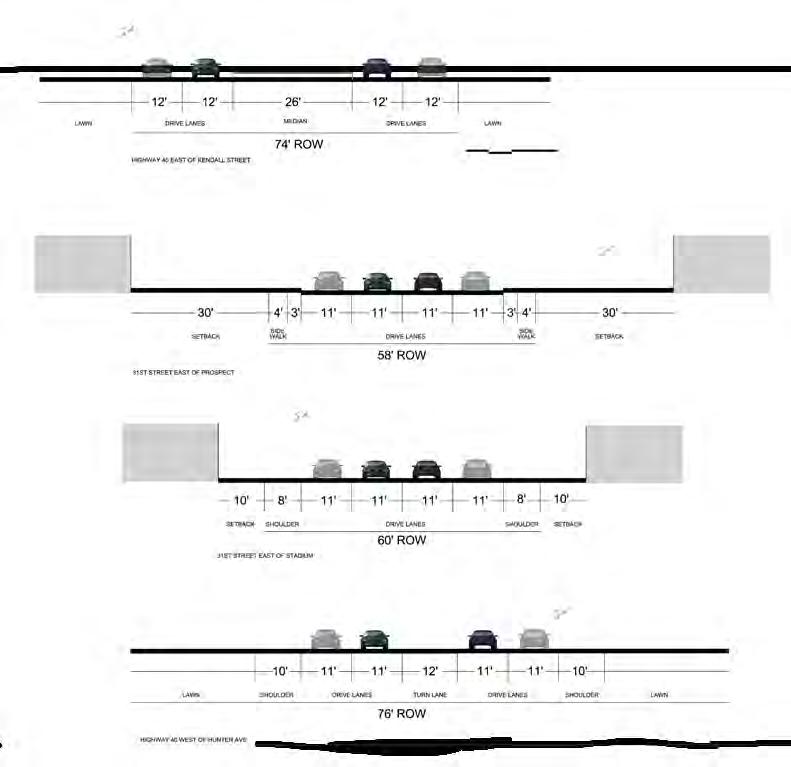

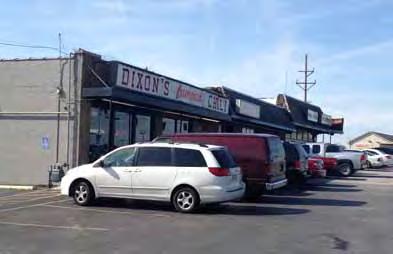
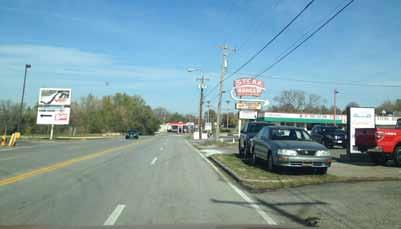
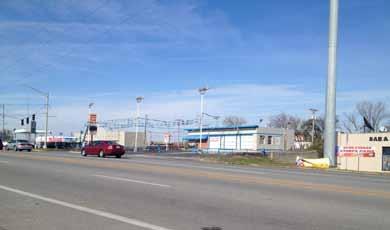
Recommendations | 111
1/2MileWalkingDistance
Figure 41: Existing Road Section of 40 Highway West of Hunter Avenue
Top: Dixons’ Chili, southeast corner of 40 Highway and Blue Ridge Cutoff
Middle: The northeast corner of 40 Highway and Blue Ridge Cutoff
Bottom: Looking north from 40 Highway and Blue Ridge Cutoff
40 Highway and Blue ridge Cutoff recommendations
The project team developed three scenarios for the future land use development of the area around 40 Highway and Blue Ridge Cutoff for review and input by stakeholders and the public.
Scenario One – Status Quo
This land use diagram illustrates a scenario in which the existing land uses in the area would largely remain in place, including a focus on light industrial uses to the west, toward I-435, and highway commercial development around 40 Highway and Blue Ridge Cutoff and to the east. These various areas would remain focused on one land use on a given parcel and would not include any mixing of other land uses, such as residential or office.
Scenario Two – Hybrid
This scenario assumes that areas located beyond walking distance of the 40 Highway and Blue Ridge Cutoff intersection would retain their existing land uses (commercial, or light industrial). However, the area immediately around the intersection would convert over time to more of a mixed-use orientation including residential, retail, and office in order to create more of a “neighborhood center”. This scenario assumes that the 40 Highway and Blue Ridge Cutoff area could evolve as a neighborhood focus area that includes local serving retail (such as pharmacies and other everyday uses), higher density residential uses such as townhomes, apartments, and condominiums, and limited office uses (such as local serving medical office properties). While the retail and restaurants at 40 Highway and Blue Ridge Cutoff could attract a degree of business from outside the area (through the connection via Blue Ridge Cutoff to I-70) this node would continue to serve nearby
neighborhoods and populations in Kansas City, Missouri and Independence.
Scenario Three – Neighborhood Mixed-Use
The third scenario anticipates a more complete mixed-use community surrounding the 40 Highway and Blue Ridge Cutoff intersection, including the development of a larger program of townhomes and single family residential uses to the north, on either side of Blue Ridge Cutoff. This scenario, in contrast to scenario two, anticipates a larger overall program of development, including residential and retail uses around the intersection, with the expectation that a larger residential base around this focus area would generate its own local serving retail demand over time.
Based upon input from the public and stakeholders, the 40 Highway plan recommends that the two cities move forward with adoption of the land use plan for Scenario Three as part of their long term plans. The following identifies some additional recommendations for the future development of the 40 Highway and Blue Ridge Cutoff area:
The neighborhood mixed-use area around 40 Highway and Blue Ridge Cutoff could develop as a highway themed center, drawing from the nostalgia of the old highway and its “kitschy” feel from the 1940s and 1950s. The district could draw from the nostalgia of Dixon’s Chili and other 1950s era restaurants in the area to create a unique district in the Kansas City area that should draw visitors from a larger portion of the metropolitan area. Similar to districts that celebrate the heritage of routes such as Route 66, the communities could draw from the historical and heritage appeal of US 40 to create a unique and somewhat quirky destination area along the corridor.
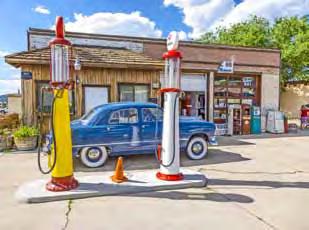
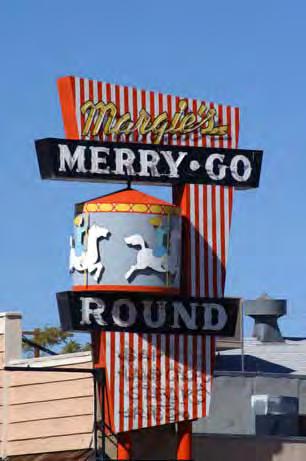
Highway 40 Corridor Plan | Focus Area Plans 112 | Recommendations
Potential kitschy, highway development could develop as a theme for this node.
Scenario 1 - Status Quo
Scenario 3 - Neighborhood Mixed Use
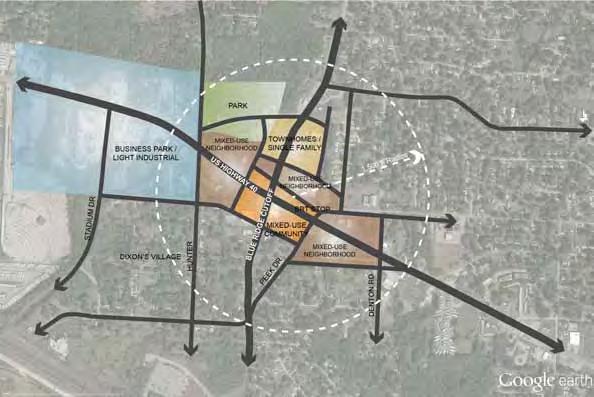
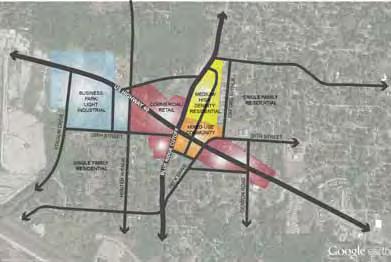
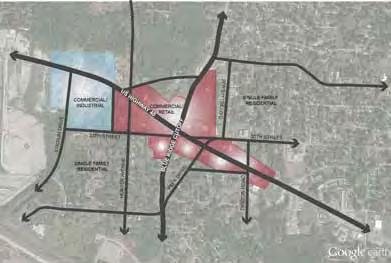
Scenario 2 - Hybrid
These illustrations show potential ideas for how future redevelopment, could proceed over time. (They do not constitute a formal development proposal and are intended only to show potential ideas)
Recommendations | 113
Figure 42: Blue Ridge Cutoff - Land Use Potential
noland road and 40 Highway Overview
The area around 40 Highway and Noland Road contains the largest concentration of land that could be redeveloped along the entire 15 mile corridor, with a total area of 168 acres (as outlined in the diagrams that follow). The existing breakdown of acreage in this focus area includes primarily commercial acreage (56 percent) followed by single family residential (11 percent). The area within a half mile of the intersection, as of the 2010 census, contained 2.491 residents and 1,338 households. The calculated density of the area was low, with an average density of 2.7 housing units per acre. However, there are a few multi-family complexes to the north and south of the intersection along Noland Road. As of 2010 there was a 12 percent vacancy rate for commercial and residential properties combined.
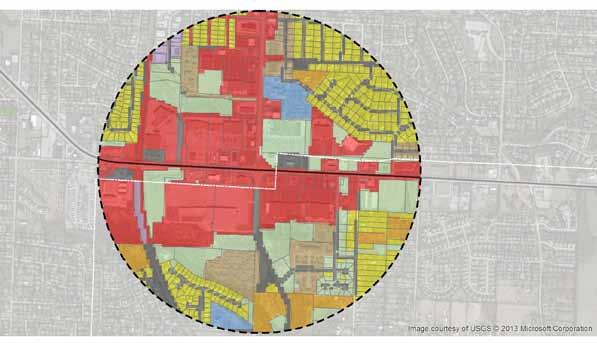
There are existing bus routes serving the area with a handful of stops. The residential development in proximity to the node is poorly connected to the commercial area for all modes of travel. Sidewalks are present to the east of Noland Road along 40 Highway, but they are missing for the most part along Noland and many of the existing residential and commercial streets. There are no existing bike facilities, but similar to the other nodes, this section of 40 Highway is identified for a bike facility in the Metrogreen Regional Bike and Greenway Plan.
The area to the north of 40 Highway is part of the City of Independence, while the area to the south lies in Kansas City’s jurisdiction. Kansas City has designated this area as a new pedestrian zone and plans for this area include a Mixed Use Community type development as well as the area serving as the major gateway to the Little Blue Valley area of the City. The Little Blue Valley Area Plan which was completed in December 2012 includes recommendations for this section of 40 Highway, which is identified as an “Image Street”, where aesthetic and streetscape enhancements should be prioritized in addition to pedestrian safety and compact nodes.
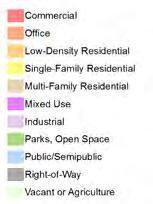
Highway 40 Corridor Plan | Focus Area Plans 114 | Recommendations
56% 1% 2% 1% 1% 1% 11% 5% Commercial Industrial Low Density Residential Multi-Family Residential Office Parks, Open Space Public/Semipublic Single Family Residential Vacant/Agriculture 13% Commercial Industrial Low Density Residential 1/2MileWalkingDistance
Population (2010) 2,491 Households (2010) 1,338 Density - Dwelling Units/Acre (2010) 2.7
Independence
Figure 43: Existing Land Use
Qu I CK S TATS
Kansas City
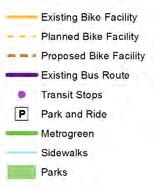
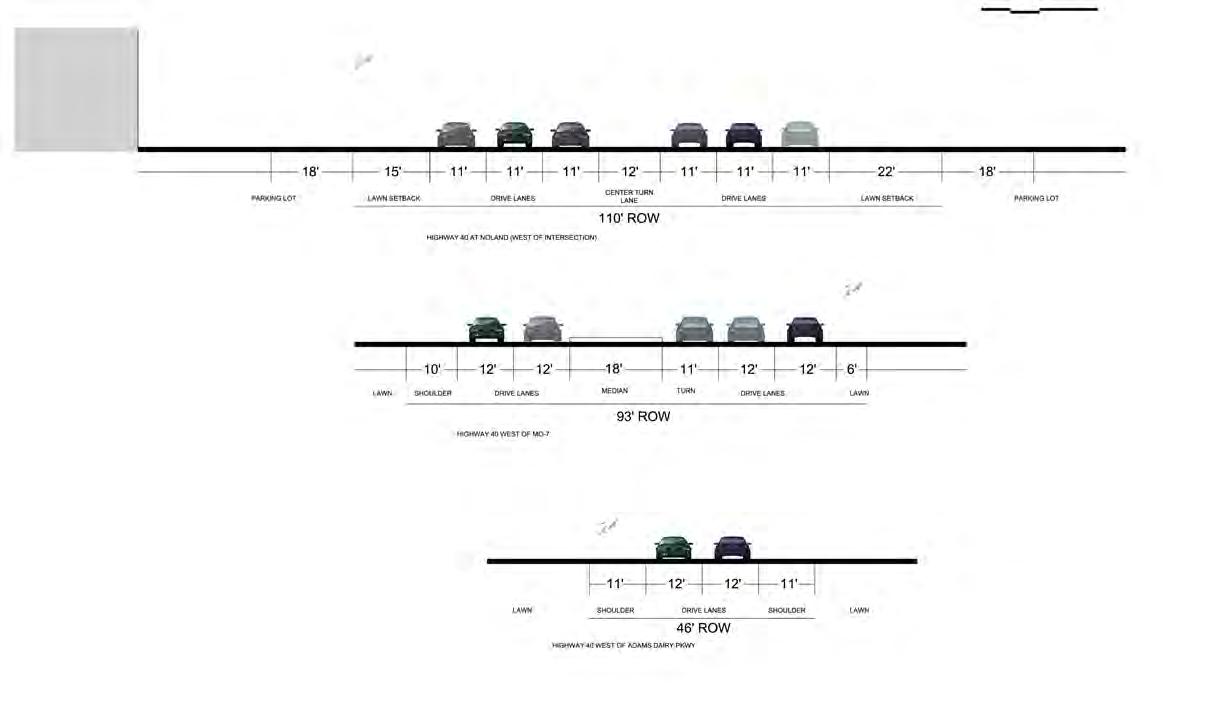

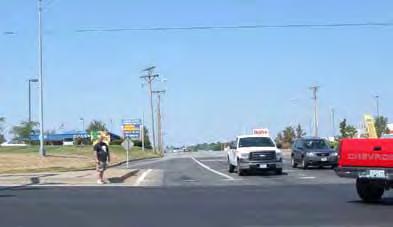
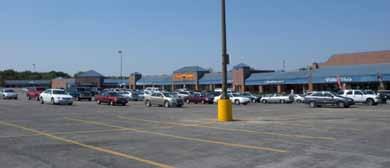 Figure 44: Transit and Bike Facilities
1/2MileWalkingDistance
Figure 45: Existing Road Section - 40 Highway at Noland (West of Intersection)
Top: Limited pedestrian infrastructure presents a challenge to pedestrians crossing 40 Highway
Bottom: Noland Fashion Square on the northwest corner of Noland and 40 Highway
noland road and 40 Highway recommendations
The project team presented three land use scenarios to stakeholders and the public for the 40 Highway and Adams Dairy Parkway focus area, as outlined as follows.
Scenario One – Status Quo
An initial scenario assumed that the existing land uses around Noland Road essentially remain unchanged. As the diagram shows, this would result in a huge amount of retail or commercial space, given the current vacancies and weaknesses in the subject properties and the surrounding market in Independence.
Scenario Two – Hybrid Approach
This approach assumes that most of the outer parts of this focus area would retain their existing retail or commercial land uses, but the area right around 40 Highway and Noland Road would redevelop into a small “mixed-use’ area including retail as well as some residential uses. This mixed-use area would likely orient to the west of Noland Road, given the weakness of the properties on the northwestern and southwestern quadrants of the Noland Road intersection. This scenario assumes that local property owners would try a pilot project of mixed use of one to two blocks long, but that most of the surrounding land uses would remain the same, at least for now.
Scenario Three – Full Mixed-Use
This scenario calls for the development of a full neighborhood center at 40 Highway and Noland Road including a balanced mix of retail, office, and residential land uses. As articulated in earlier sections of the report, this scenario would assume that the community would allow and promote the development of residential uses at sufficient densities to warrant upgrades in transit service along 40 Highway. Similarly, the city would work to entice office users that would provide for sufficient employment density to entice the construction or provision of enhanced bus service along the corridor over time.
Members of the public and stakeholders in the Kansas City and Independence communities expressed support for Scenario Three as the preferred long term vision for the area. Local residents realize that it may take some time and patience to realize the program outlined in Scenario Three, but believe it has the best chance of providing for the long term economic development of this portion of the community and the overall corridor.
Highway 40 Corridor Plan | Focus Area Plans 116 | Recommendations
Scenario 1 - Status
Scenario 3 - Full Mixed-Use
Scenario 2 - Hybrid
These illustrations show potential ideas for how future redevelopment, could proceed over time. (They do not constitute a formal development proposal and are intended only to show potential ideas)
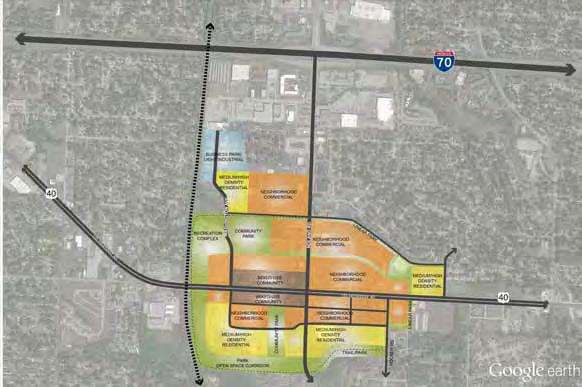
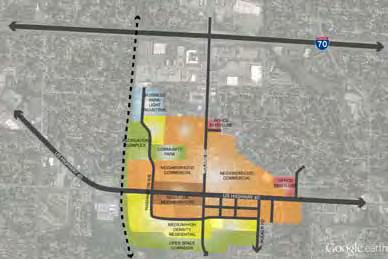
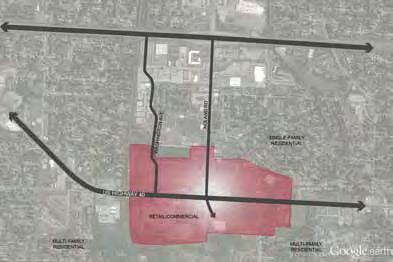
Recommendations | 117
Figure 46: Noland Road - Land Use Potential
Quo
Adams dairy Parkway and 40 Highway Overview
The area around 40 Highway and Adams Dairy Parkway primarily includes industrial uses (47 percent), single family residential, and commercial. However, the City of Blue Springs indicates that the industrial uses in this area are likely to relocate in the near future. The potential development of the Missouri Innovation Park to the north and east has the potential to change the position of this focus area from an industrial oriented area to a research and development / employment center.
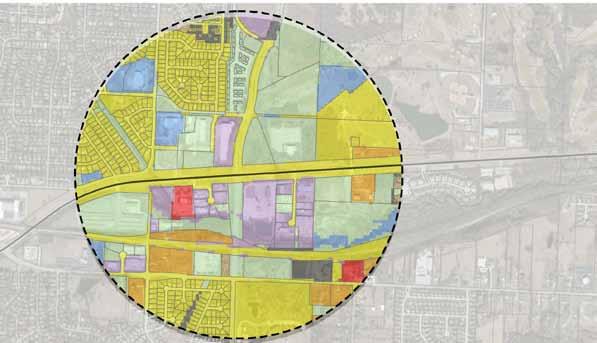
The area within a 1/2 mile walking distance from the intersection has a population of 2,505 and a density of 2.0 dwelling units per acre attributed with the mostly single family residential and a few parcels of low-density residential development. The focus area has an industrial feel and land uses amidst suburban, single family home developments and open space to the northeast where Adams Pointe Golf Club is located.
The Adams Dairy Parkway focus area is located in the City of Blue Springs and has been identified by the City as a development opportunity district. These districts are targeted for public investment, land assembly and innovative financing tools to encourage redevelopment. At this node the City’s goal is to “encourage appropriate commercial and multi-family housing opportunities along 40 Highway”.
Highway 40 Corridor Plan | Focus Area Plans 118 | Recommendations
4% 2% 1% 3% 47% 11% Commercial Industrial Low Density Residential Multi-Family Residential Office Parks, Open Space Public/Semipublic Single Family Residential Vacant/Agriculture 1/2MileWalkingDistance Qu I CK S TATS Population (2010) 2,505 Households (2010) 996 Density - Dwelling Units/Acre (2010) 2.0
Figure 47: Existing Land Use at Adams Dairy Parkway and 40 Highway
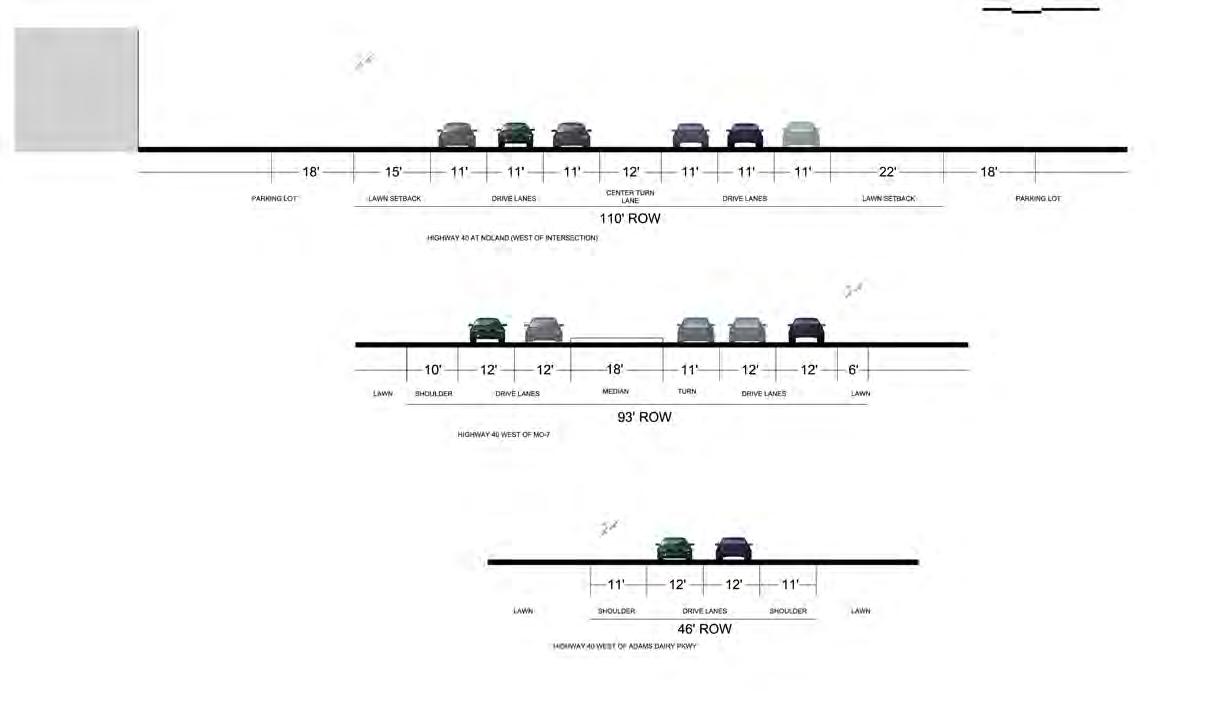

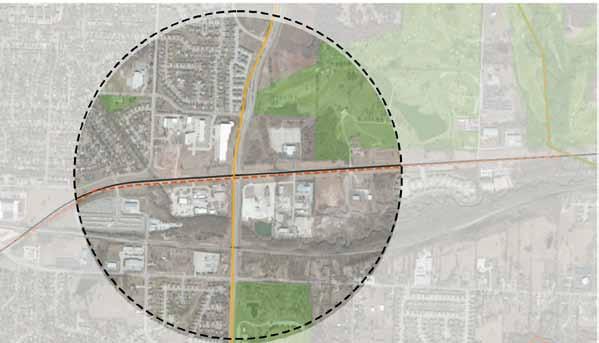
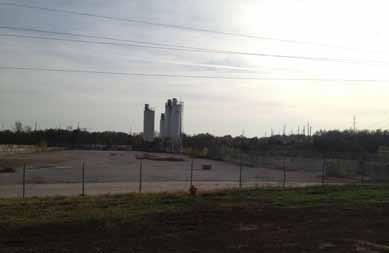

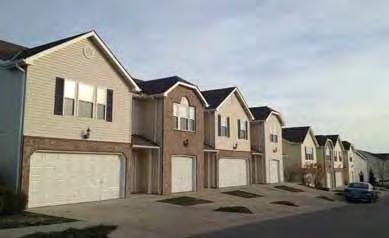
Recommendations | 119
1/2MileWalkingDistance
Figure 49: Existing Road Section - 40 Highway West of Adams Dairy Parkway
Top and Middle: Industrial uses and open space are adjacent to the 40 Highway and Adams Dairy Parkway Node.
Bottom: Multi-family housing development to the northwest of 40 Highway and Adams Dairy Parkway
40 Highway and Adams dairy Parkway recommendations
The public considered three scenarios for future land use around this focus area as outlined as follows.
Scenario One - Status Quo
The status quo scenario essentially assumes that the existing industrial uses would remain in this focus area for the long term. This scenario was fairly quickly dismissed as unrealistic by the public and stakeholders.
Scenario Two - Hybrid
This scenario calls for a small mixed use area around 40 Highway and Adams Dairy to include employment uses, retail, and some residential, but the balance of the focus area would remain general commercial and not change markedly from the existing condition. This scenario is more likely in the event that enhanced transit or commuter rail service does not arrive along this part of 40 Highway over the long term. Without additional transit connectivity or growth from the Missouri Innovation Park, this node would likely develop as a very small neighborhood mixed use node.
Scenario Three - Full Mixed-Use Neighborhood / Employment Center
In this scenario, commuter rail along with enhanced transit along 40 Highway, combined with the development of the Missouri Innovation Park as a key employment center at the east end of the metro area, would help to spur the growth of a notable neighborhood center or mixed use area geared around employment uses. The intent of this scenario is to not compete directly with Downtown Blue Springs or with the more regionally oriented commercial located at Adams Dairy Landing. Instead, this area would develop as a complement to office and research facilities locating in the Missouri Innovation Park. Therefore, the most likely uses to grow at this center would involve small restaurants, convenience retail, and service uses. A significant residential component could develop at this focus area,
including townhomes or apartments, to provide very convenient housing for employees at the research park. The combination of various uses at this center in a more vibrant “Main Street” orientation could help to recruit workers to the park and help to support the overall economic development efforts of the Missouri Innovation Research Park.
In discussions with the public and stakeholders, Scenario Three garnered the most support. The project team recommends that the City of Blue Springs adopt this general plan for the 40 Highway and Adams Dairy Parkway area as part of its comprehensive plan update this year.
Highway 40 Corridor Plan | Focus Area Plans 120 | Recommendations
Scenario 2 - Hybrid
These illustrations show potential ideas for how future redevelopment, could proceed over time. (They do not constitute a formal development proposal and are intended only to show potential ideas)
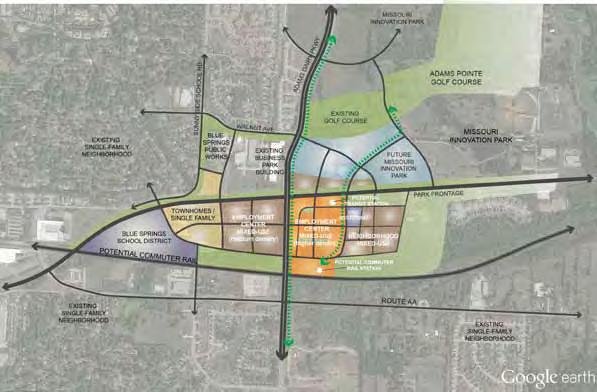
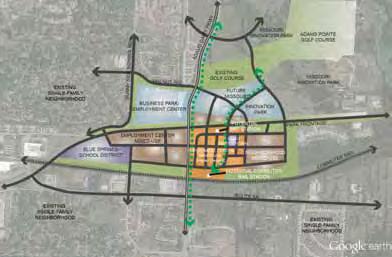
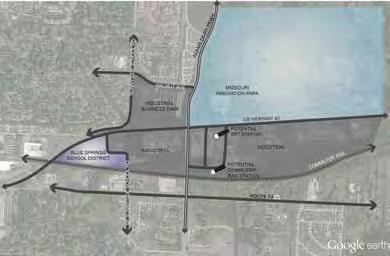
Recommendations | 121
Scenario 1 - Status Quo
Scenario 3 - Full Mixed-Use Neighborhood / Employment Center
Figure 50: Adams Dairy Parkway - Land Use Potential
Additional redevelopment Opportunities
31st and Van Brunt
The 31st and Van Brunt area actually includes an intersection that receives traffic from five directions. The intersection creates confusion for many visitors to the area, and also consumes a good deal of land that could be used for development or open space. The future planning for this area should outline potential street realignments and traffic signal upgrades that would simplify this intersection and its traffic flow and provide more area for future development. The conceptual diagram provided illustrates how the area between 31st Street and Interstate 70 could be redeveloped in more of a mixed-use orientation. Future development on either side of Van Brunt could contain a mixture of retail and restaurant uses that take advantage of the access to the interstate and could also include a limited number of residential units that could be marketed to individuals seeking a shorter commute to downtown Kansas City. The City could also work to improve trail and greenspace connections along Stadium Drive to the south and east, to the Blue River area and adjacent trails, and also work to further enhance the trail and greenspace linkages along Emanuel Cleaver II Boulevard to the south.
40 Highway and Lee’s Summit Road
In addition to the key focus area at 40 Highway and Noland Road, the communities of Kansas City, Missouri and Independence have the potential to create a better developed focus area at 40 Highway and Lee’s Summit Road. The area is located fairly close to the larger scale retail developments to the east of I-470 and 40 Highway, and as a result this area is more likely to take on a neighborhood orientation as opposed to including regional-oriented land uses or tenants. The area to the south and west of the intersection could be developed as a mixed use development that includes townhomes, patio homes, and senior housing living options and includes a small area of convenience retail. The area to the north and east of 40 and Lee’s Summit Road could be improved to create a better connection from Lee’s Summit Road to the Bass Pro Shops development through trail and greenspace connections. The City of Independence could also work to improve trails or streetscapes to connect Adair Park on Lee’s Summit Road with the 40 Highway, to the south.
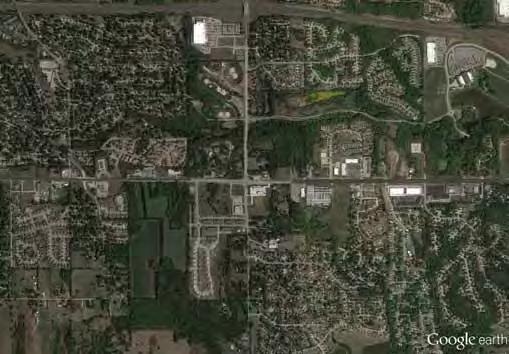
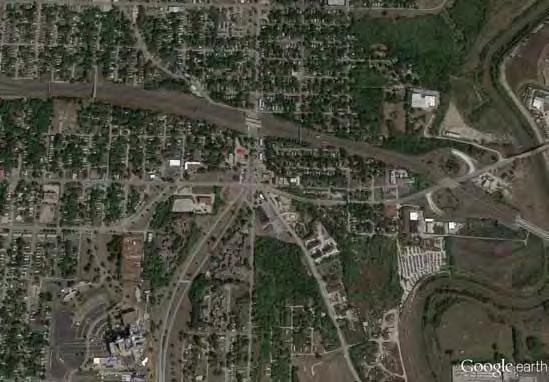
Highway 40 Corridor Plan | Focus Area Plans 122 | Recommendations BIKE / PED TRAIL BIKE / PED TRAIL E M A NUEL CLEAVER IIBLVD STADIUM DR 1,500ft Radius SCHOOL MULTI FAMILY URBAN MIXED USE LIBERTY PARK REDEVELOPMENT POTENTIAL 31ST STREET PARKWAY FRONTAGE URBAN MIXED USE VAN BRUNT BLVD 30TH STREET 40
Figure 51: Van Brunt - Land Use Potential
LEE’S SUMMIT RD 1,500ftRadius 40 US NEIGHBORHOOD MIXED USE NEIGHBORHOOD MIXED USE RETAIL RETAIL SALVATION ARMY 3 TRAILS CAMP ADAIR PARK NEW PARK RESIDENTIAL EXISTING SINGLE FAMILY LINEAR PARK POTENTIAL BUS RAPID TRANSIT LINE EXISTING SINGLE FAMILY EXISTING SINGLE FAMILY
Figure 52: Lee’s Summit - Land Use Potential Scenario 1 and 2
IMPLEMENTATION STRATEGIES
Implementation Strategies | 123 6
Implementation Strategies
The design team recommends that the cities along 40 Highway pursue the following implementation items over the next several years in order to maintain momentum and lay the groundwork for ongoing planning and development designed to change the overall position of the corridor. While the market will dictate much of what happens at various nodes, the Cities can serve as an agent of change through proactive policies that encourage private sector investment to further their vision for the corridor.
Completion of Full Master Plan for the 40 Highway Corridor
This document represents the summary of an initial transportation, market and visioning exercise for the 40 Highway Corridor in which the communities provided information concerning their preferred concepts for redevelopment, mixed-use development, and the creation of neighborhood centers and related districts of revitalization along the 40 Highway Corridor, particularly at the focus areas. Although this document includes the recommendations of the design team (consultants) based upon best practices from national experience, it does not include detailed plans for the length of the corridor.
The communities should consider completing a more detailed master plan for the 40 Highway Corridor. This plan would include specific recommendations for transportation improvements (including the specific alignments of back streets, park connections, and so forth) for the entire length of the corridor. The majority of the public at the open houses in April/May 2013 supported the idea of collaboration and the completion of more detailed plans for 40 Highway over time. The more detailed plans would help to outline and determine improvements for particular segments of the corridor and help the city staff in each community in proceeding with detailed design and contracting for specific improvements along the corridor over time.
Comprehensive Plan updates
Kansas City and Blue Springs already have redevelopment and plans for mixed uses written into their comprehensive plans at the nodes specified in this plan and Independence has expressed a desire to coordinate any future planning for the Noland Road and Blue Ridge Cutoff focus areas to ensure that these areas maintain a consistent and coordinated focus in terms of development. The adjacent cities
should establish momentum for the implementation of the planning efforts along 40 Highway by adopting the recommendations from the more detailed, full master plan for the corridor into their respective comprehensive plans. The comprehensive plan updates should include text and graphics that depict the streetscape strategy, locations of future parks and open space connections, future civic spaces, and future street locations (including side streets running parallel to 40 Highway).
Infill Development Incentives
While there are benefits to infill development, there can be challenges associated with building on an infill property, such as environmental contamination, outdated infrastructure or fragmented parcels. To compensate for the possible financial hardships of developing infill properties, the city should consider additional incentives. A zoning code overlay district could outline development incentives to allow additional development capacity in exchange for a public benefit or amenity, determined on a case-by-case basis. The incentives that can be applied to non-residential developments include density bonuses, increases in floor area ratio (FAR) and master signage plan approval, which can be expanded to apply within the 40 Highway Corridor. The cities should implement zoning changes to demonstrate the fiscal and aesthetic benefits including:
• Reduced parking requirements and increased height limits and densities allow for more intensive development of the property creating a more profitable economic equation for land owners and developers.
• Zoning that provides for a wider range of land uses will create an incentive for larger projects that will make land assembly desirable.
• A form-based code would allow for a streamlined approval process with fewer conditional uses and more uses by right.
• Allow a range of uses as “permitted”. In addition, expedited or streamlined approval processes or shortening permitting processes is an incentive to developers.
Highway 40 Corridor Plan | Focus Area Plans 124 | Implementation Strategies
Form Based Code
Conventional zoning is primarily concerned with separation of uses, whereas a transect zoning system replaces conventional separateduse zoning systems that have encouraged a car-dependent culture and land-consuming sprawl. The transect zones are form-based districts that provide the basis for real neighborhood structure, which requires walkable streets, mixed use development forms, transportation options, and housing diversity. The transect or T zones vary by the level of intensity of their natural, built, and social components.
Much of the projected land use reflects this mixed-use approach for the future of the 40 Highway Corridor. This offers flexibility of use, but will be more specific with regard to physical form (building setback, height, parking, relationship to the street). While the real estate market will determine the exact mix of product types and exact densities of new development, the future land use definitions suggest recommended densities. The intent of form regulations is to create development that retains well conceived urban design concepts over many decades, as tenants and individual businesses come and go.
There are alternative approaches available to 40 Highway in implementing a form-based code along the corridor. The overall goal is to positively affect the form of neighborhood center locations, with less priority on building form between the centers.
• Require that any parcels (or assembled parcels) over four acres conform to the form-based code.
• Require that lands that fall within the identified neighborhood centers conform to the form-based code.
• Provide the option to “opt-in” to the form-based code. An “optin” form-based code is beneficial when the goal is to provide an attractive opportunity to apply form based design principles. Property owners are provided the opportunity to voluntarily “opt in” to a form-based code within the centers and mixed-use designations along the corridor. This would ensure that property owners retain their property rights provided by the current zoning, but have the
Implementation Strategies | 125
T4 General Urban Zone T3 Suburban Zone T2 Rural Zone T5 Urban Center Zone Natural Zone BRUCE R WATKINS BLUE RIDGE C UTOFF PROSPECT AV E 23rd VAN B TDNUR B LV D STADIUMDR 435 470 7 NOLAND RD L E E’ S SUMMIT RD S LIT T LE BL YKPEU 291 NW W O O SD C H A P L E DR A D AMS DAIRY PKY 31st STREET 40 40 40 S EMANUEL CLEAVERBLVD
Figure 53: Transect Diagram
option of choosing more flexible development regulations at their own discretion. This approach has been successfully completed in many communities. For example, as redevelopment proposals arise in Flagstaff, Arizona, a community with opt-in form based code structures, property owners are contractually “opting in” to the form based districts because of the flexibility in use and attractive development opportunities. These form-based districts, or transect districts, are located where more compact, mixed-use development is desired. Other areas of the city may remain under the traditional zoning codes.
development Strategies
The cities may wish to stimulate redevelopment of particular parcels or focus areas along the corridor through one of the following strategies:
Joint Public / Private Development Opportunities
The cities could contribute any publicly owned parcels along the corridor to a joint development deal with one or more private landowners in order to assemble and launch a redevelopment project at a particular location along the corridor. The city could also contribute equity in the form of cash to a joint public private partnership to promote redevelopment along 40 Highway.
Public Investment
Beyond the overall cost of public improvements along 40 Highway, the cities may wish to facilitate development on parcels by providing for additional capital projects (such as streetscape improvements, parks and other community facilities) for areas or parcels along 40 Highway. The city may also assist private development projects by providing for the operations or maintenance of various improvements (such as streetscape features).
Property Assembly
The cities could help the private sector overcome one of the biggest hurdles to redevelopment on any corridor – property assembly. By either quietly or proactively buying key parcels along 40 Highway and then helping to facilitate redevelopment deals that involve these particular
parcels, the cities can help to jump start redevelopment at various locations along the corridor.
Regulatory Changes
The cities could help to facilitate redevelopment by helping to alter or streamline regulations such as zoning, design guidelines, parking ratios, and other regulations.
Formation of a Corridor Business Association
The cities and the local business community should work to establish a business association for the corridor. Business associations around the country typically work to develop the brand image, advertising campaigns, and promotions for a given shopping district. They also may work with local governments to coordinate maintenance. Business associations resemble merchants’ associations in that they help a given district speak as a collective voice and therefore more clearly articulate its viewpoints and secure support from the larger community. In terms of promotions, a business association along 40 Highway could help coordinate festivals, farmers’ markets, and other regular events to bring more people into the district. An association would help the business community along 40 Highway speak collectively concerning the redevelopment and ongoing operation of the corridor over the next few decades.
Highway 40 Corridor Plan | Focus Area Plans 126 | Implementation Strategies
Funding Sources
The cities along the corridor may pursue a variety of funding sources and strategies to implement enhancements over time. City leaders and city staff in each community should examine these potential tools and determine the viability of each in helping to provide funds for 40 Highway improvements in the future.
In addition to the funding categories identified below, the cities may explore various of funding sources at the federal or state level in order to provide resources to complete various improvements along 40 Highway over time. The Transportation Improvement Program (TIP) provides funding for streetscape and transportation projects through the resources of East West Gateway Council of Governments. The CMAQ and recently created Transportation Alternatives Program (TAP) is another likely source of funding for corridor improvements. The potential to secure funding through these resources is dependant on a variety of factors, including the pool of available money, and the funding formulas used to rank applications made by local jurisdictions. In addition, the federal TIGER program has provided for a variety of streetscape and transportation improvements in Kansas City and represents another potential source of funding for 40 Highway improvements.
Tax Increment Financing (TIF)
TIF allows the use of a portion of local property and sales taxes to assist in the funding of redevelopment of certain designated areas in a community. Areas identified for TIF must be deemed to be part of a “blighted,” “conservation” or an “economic development” area. TIF essentially uses the additional sales tax revenue that is generated above and beyond the current level of revenue, as a result of a redevelopment, in order to fund a variety of project costs. Eligible project cost categories include professional services, land acquisition, rehabilitation of buildings, new infrastructure, and relocation of existing businesses or residents.
Transportation development district (Tdd)
A transportation development district (TDD) provides another tool that the public and private sectors in Missouri may use, either separately or in conjunction with other economic development tools, to support economic growth in local communities. State statutes provide a great
deal of flexibility with regard to TDD formation and execution, and therefore local communities across the state have pursued TDDs as a popular economic development tool over the last twenty-plus years.
The state’s TDD Act, enacted in 1990, allows for the formation of local transportation development districts (or “TDDs”) to fund, promote, plan, design, construct, improve, maintain, and operate one or more transportation projects within the district’s boundaries. Eligible projects may include bridges, streets, highways, interchanges, intersections, signage, signalization, parking lots, bus stops, stations, garages, terminals, hangars, shelters, rest areas, docks, wharves, lake or river ports, airports, railroads, light rail, or other mass transit and any similar or related improvements or infrastructure. A District may be formed through a petition of local residents, the consent of all property owners in the designated area, or by a local governing body or transit agency. Before the construction or funding of any projects within the TDD, the District must submit project information and budgets to the Missouri Highways and Transportation Commission for approval. In cases where the proposed improvements will not fall under the jurisdiction of the state Commission (MoDOT), the local jurisdiction must review and approve project information and budgets.
Similar to TIF, in the case of TDDs the property owner / developer pays nothing for the publicly financed improvements funded by the TDD, but is ultimately responsible to bondholders if the tax revenue generated by the improvements is insufficient to make the payments.
TDDs raise revenues within the boundaries of the district through the following types of mechanisms:
Bonds, notes, and other obligations: The TDD may issue obligations in order to raise money to finance transportation improvements in the district.
Sales Tax: A TDD may impose a district sales tax, in increments of one-eighth of one percent up to a maximum of one percent, on the receipts from all retail sales made in the district. Retailers in the district must prominently display the rate of the sales tax imposed or increased as a result of the TDD sales tax, in the cash register area.
Alternate Sales Tax: In cases where a TDD district encompasses an entire city or county, the relevant governing bodies (with voter approval) may impose an Alternate TDD Sales Tax on all retail sales made in the
Implementation Strategies | 127
District. The Alternate TDD Sales Tax may be imposed at a rate of oneeighth of one percent, one-fourth of one percent, three-eighths of one percent, one-half of one percent, or one percent and must be uniform across the District.
Property Tax: Assuming approval by at least four-sevenths of the qualified voters in the TDD District, the TDD District may impose a property tax in the amount not to exceed the annual rate of ten cents on each one hundred dollars of assessed valuation.
Special Assessments: The TDD District may assess one or more special assessments for specially designated project improvements if approved by the majority of qualified voters or the owners of record of all of the real property located in the district who sign a special assessment petition.
Toll roads: The TDD District may charge and collect tolls or fees for the use of a transportation project. In order to do this, the District may relocate an existing state highway, subject to approval by the Commission, or an existing local public street or road, subject to approval by the local governmental body with jurisdiction over the road.
TDDs, in contrast to Tax Increment Financing, raise their own taxes and do not simply divert tax revenues from another political entity (such as a school district or local city or town). In addition, TDDs have emerged as a good complement to an existing or new TIF district, especially in cases where the TDD can pay for a portion of transportation improvements and thereby allow the TIF to fund other public improvements, such as utilities, streetscape, or other infrastructure. Given the political controversy that has surrounded the use of TIF in recent years, the TDD concept has a fairly bright future across Missouri in helping to promote and support local economic development efforts.
neighborhood Improvement district (nId)
A Neighborhood Improvement District is a geographically bounded area within which certain public improvements are financed by a city through the issuance of notes or bonds, which are in turn repaid by levying assessments against the property within a NID. NIDs offer distinct advantages in executing economic development for a city and a particular District. Because the city in question issues general obligation bonds, the public improvements associated with the NID can be financed at lower interest rates. Second, a NID can be established
and an assessment imposed without a city-wide election. Third, a city may group two or more NID projects together into one bond issue in order to further reduce financing and project costs. Finally, the NID Act in Missouri allows for a fairly broad range of public improvements to be financed without a requirement that the area be considered to be “blighted” in order to be included in a NID designation.
Eligible Improvements and Costs
Under the Missouri NID Act, eligible improvements and costs may include streets, lighting, parks and recreational facilities, sidewalks, utility service connections, sewer and storm water systems, flood control works, off-street parking structures, bridges, overpasses, tunnels, and “any other public facilities or improvements deemed necessary by the governing body of the city or county”. The NID Act also allows for certain incidental costs to be financed, such as land acquisition and engineering, legal, and financing fees and costs. The act also carries provisions for maintenance of the public improvements during the term of the bonds or notes pertaining to the improvements.
NIDs can be established by either 1) a petition of at least two-thirds of the owners of record of all of the real property located within the proposed NID district, or 2) by the City submitting a question to all qualified voters residing within the proposed NID at a general or special election called for the purpose of approving bonds associated with the NID.
NIDs carry some distinct advantages compared to TIF in Missouri. Whereas TIF is financed by limited obligation bonds, the general obligation bonds issued as part of NID deals allow for lower interest rates. Whereas TIF requires a blight designation for the affected district or area, NIDs do not carry such requirements. Another distinction between NID and TIF is that, in the case of TIF, property owners or developers do not pay anything initially for the publicly financed improvements but are ultimately responsible to the bondholders if the tax revenue generated by the improvements is insufficient to make the payments. In contrast, under NID, property owners pay up front for public improvements through assessments over and above any property or sales taxes they already pay, but the municipality is ultimately responsible to the bondholders if property owners are unable to make the necessary payments.
Highway 40 Corridor Plan | Focus Area Plans 128 | Implementation Strategies
Community Improvement district (CId)
In contrast to Transportation Development Districts, that are only able to fund transportation-related improvements, a CID can finance a wide array of public improvements and services that can enhance the district. A CID can be established by a government entity or a non-profit and requires the approval of a petition signed by either the property owners that collectively own at least 50 percent of the assessed value in the proposed district, or a total of more than 50 per capita of all owners of real property within the proposed district. The petition must outline a five year plan that describes the purposes of the proposed district, the services it will provide, the improvements it will make and an estimate of the costs of the project. Once the petition is filed, the governing body of the particular municipality in question must hold a public hearing and approve the creation of the proposed district by ordinance. In contrast to a Neighborhood Improvement District, a CID is a separate legal entity, and operates distinct and apart from the municipality that creates the district.
The CID may finance improvements through the imposition of 1) special assessments for those improvements that specifically benefit the properties within the district, 2) property taxes, or 3) a sales tax up to a maximum of one percent. A CID may finance the costs of a project through the charging of fees, rents, and charges for district property or services, or grants, gifts, and donations. A CID may also issue bonds, notes, and other obligations in order to fund improvements.
A CID may finance the following types of improvements within its boundaries:
• Pedestrian or shopping malls and plazas
• Parks, lawns, trees, and any other landscape
• Convention centers, arenas, aquariums, aviaries and meeting facilities
• Sidewalks, streets, alleys, bridges, ramps, tunnels, overpasses and underpasses, traffic signs and signals, utilities, drainage, water, storm and sewer systems and other site improvements
• Streetscape, lighting, benches or other seating furniture, trash receptacles, marquees, awnings, canopies, walls and barriers
• Telephone and information booths, bus stop and other shelters, rest rooms and kiosks
• Music, news and child care facilities
• Lakes, dams and waterways
• Paintings, murals, display cases, sculptures and fountains
• Parking lots, garages or other facilities
A CId may also provide a variety of public services, including the following:
• With the municipality’s consent, prohibiting or restricting vehicular and pedestrian traffic and vendors on streets
• Operating or contracting for the provision of music, news, childcare or parking facilities, and buses, mini-buses or other modes of transportation
• Leasing space for sidewalk café tables and chairs
• Providing or contracting for the provision of security personnel, equipment or facilities for the protection of property and persons
• Promoting business activity, development and retention
• Providing or contracting for cleaning, maintenance and other services to public and private property and persons
• Promoting tourism, recreational or cultural activities or special events
• Providing refuse collection and disposal services
• Contracting for or conducting economic, planning, marketing or other studies
Enhanced Enterprise Zones (EEZs)
The Enhanced Enterprise Zone Tax Benefit Program, sponsored by the Missouri Department of Economic Development, provides various tax credits to new or expanding businesses in a Missouri Enhanced Enterprise Zone. These zones are specific geographic areas designated by local governments that must be certified by the
Implementation Strategies | 129
Department of Economic Development. The program offers state tax credits, accompanied by local real property tax abatements, to eligible businesses in the EEZ. To receive the tax credits, a business facility must provide for two new employees and $100,000 in new investments (in the case of a new or expanded business facility), or two new employees and $1 million in new investment (in the case of a replacement business facility). Companies receiving EEZ tax credits must provide health insurance to all full time employees in Missouri in order to qualify for the program. Eligible investment expenditures include the original cost of machinery, equipment, furniture, fixtures, land and buildings, and or eight times the annual rental rate paid for these items. Ineligible businesses for the EEZ program include gambling establishments, retail trade entities, educational services entities, religious organizations, public administration entities (governments), and food and drinking places.
Chapter 353 Tax Abatement
The State of Missouri offers a Chapter 353 Tax Abatement as an incentive that can be used by cities to encourage the redevelopment of blighted areas by providing real property tax abatements. Under this program, an “Urban Redevelopment Corporation” must be organized pursuant to the Urban Redevelopment Corporations Law in the state of Missouri and the area designated for tax abatements must be deemed a “blighted area” under state law. Under the program, tax abatements are available for up to 25 years. During the first 10 years, the property is not subject to real property taxes except in the amount of real property taxes assessed on the land, exclusive of improvements. During the next 15 years, the real property may be assessed up to 50 percent of its true value. Payments in lieu of taxes (PILOTs) may be imposed on the Urban Redevelopment Corporation by contract with the city. PILOTs are paid on an annual basis to replace all or part of the real estate taxes that are abated.
In areas that are challenged by economic decline or blight, the Chapter 353 provisions provide an additional tool for local governments to provide incentives for economic redevelopment.
Sales Tax reimbursement Agreements
The State of Missouri allows Sales Tax Reimbursement agreements as a funding mechanism to fund infrastructure associated with new developments. Under these agreements, municipalities have the ability to annually appropriate the increase in sales taxes created by new private capital investment to offset a portion of project investment costs. Under this type of agreement, a portion of City sales taxes captured from the increased sales generated by the project would be reimbursed to the developer or company for eligible expenses. This provision, then, helps to provide an incentive for redevelopment or new development along corridors such as 40 Highway.
The state has laid out a number of criteria that must be followed or satisfied in order to allow for a Sales Tax Reimbursement Agreement.
• The applicant must demonstrate that the project would prevent a significant loss in existing sales tax revenue or make a significant contribution to the overall health and well-being of the local economy.
• The project must show a clear demonstration of the public purpose and the economic benefit provided through the agreement and how the agreement would further the city’s economic development goals.
• The application must show that the project would not occur “but for” the incentives offered. The incentive should make a difference in determining the decision of the particular business to expand or remain in the city and it must be proven that this would not have otherwise occurred without the availability of the sales tax reimbursement.
• The firm that would benefit from the sales tax reimbursement must show its financial stability and capacity to complete the project.
• The application must ensure that the city or any other taxing jurisdiction affected by the incentive is not receiving less total sales tax revenue from the property than was received prior to the granting of the sales tax reimbursement provision.
• The sales tax reimbursement is generally not allowed to extend for greater than ten years.
Highway 40 Corridor Plan | Focus Area Plans 130 | Implementation Strategies
Additional Funding Sources for Greenways
In addition to the normal tools in Missouri such as NIDs, CIDs, TDDs, and TIFs, the cities may wish to consider additional funding strategies identified to provide for greenway enhancements (such as those tied to Metrogreen along the 40 Highway corridor). These additional strategies may include but not be limited to the following:
Bond Referendums for Greenways
Communities across the nation have successfully placed on local ballots propositions to support greenway development, ranging from small towns to larger cities. For example, a few years ago residents in Casper, Wyoming passed a greenway bond referendum to provide for the first three miles of a local greenway.
Greenway Trust Fund
Many communities around the country have created trust funds for land acquisition and facility development. A trust fund may help in acquiring parcels that would otherwise be lost if not acquired by private sector initiative.
Community Development Block Grants (CDBG)
The US Department of Housing and Urban Development provides states with annual direct grants that are then awarded to local communities in part for park and greenway projects.
Illustratives
The illustratives that follow illustrate how the character and visual quality of the 40 Highway Corridor could evolve over time. The MoDOT and the cities could initially work to install street trees along the corridor in order to provide additional areas of shade and improve the aesthetic appeal. Over time, the addition of the multi-use path and additional streetscape elements such as street lighting and signage could further improve the appearance and functionality of the corridor. Eventually, improved transit service could arrive in the area to support redevelopment at key focus areas.
Implementation Strategies | 131
Existing Conditions
Looking westbound on 40 Highway at Adams Dairy Parkway
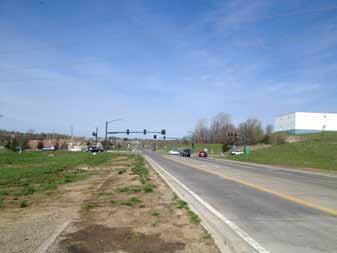
Phase One
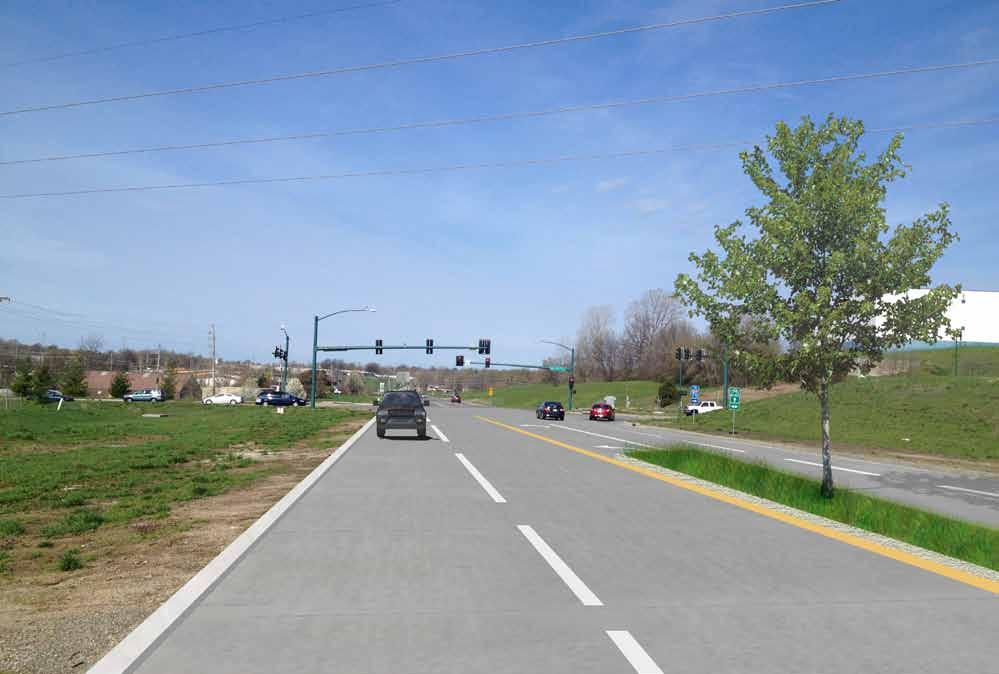
Highway 40 Corridor Plan | Focus Area Plans 132 | Implementation Strategies
Phase Two
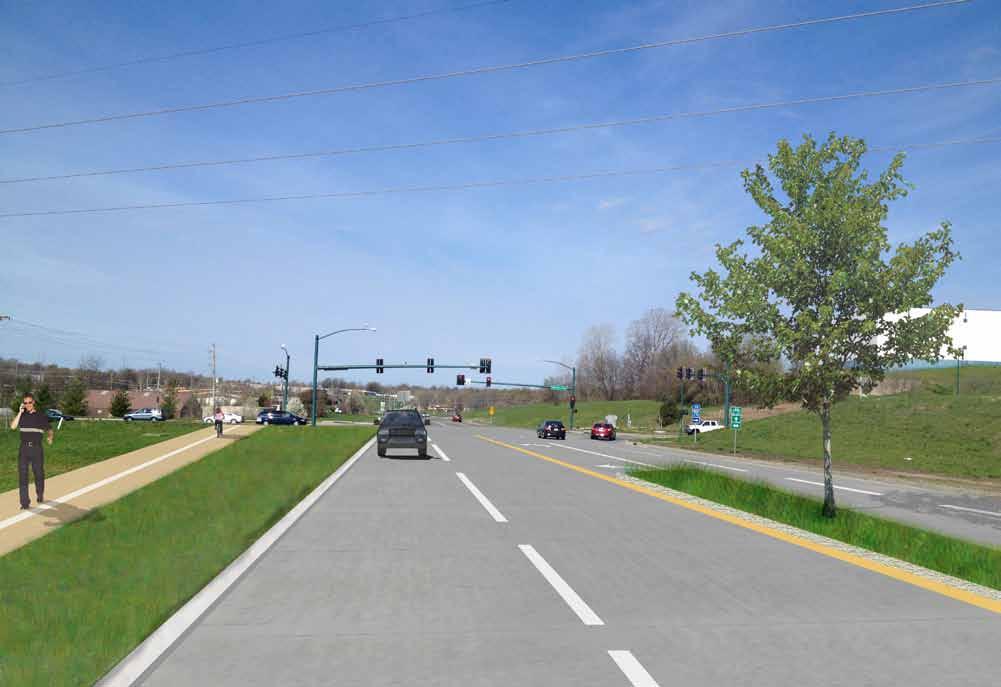
Implementation Strategies | 133
Phase Three
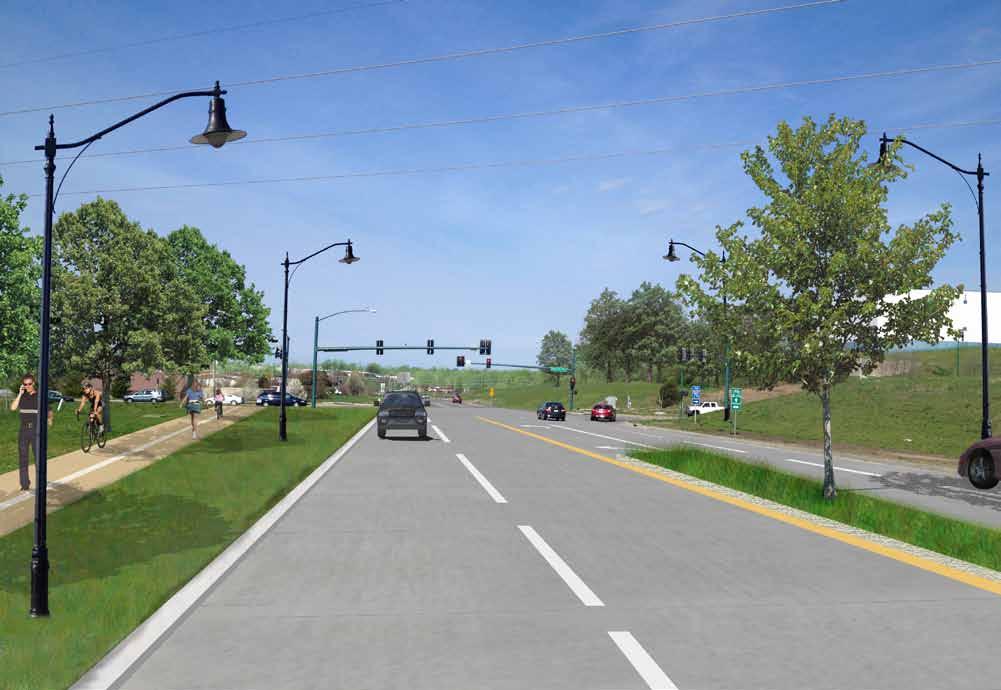
Highway 40 Corridor Plan | Focus Area Plans 134 | Implementation Strategies
Existing Conditions
Looking south toward 40 Highway on Washington Street in Independence
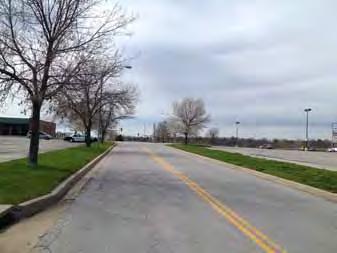
Phase One
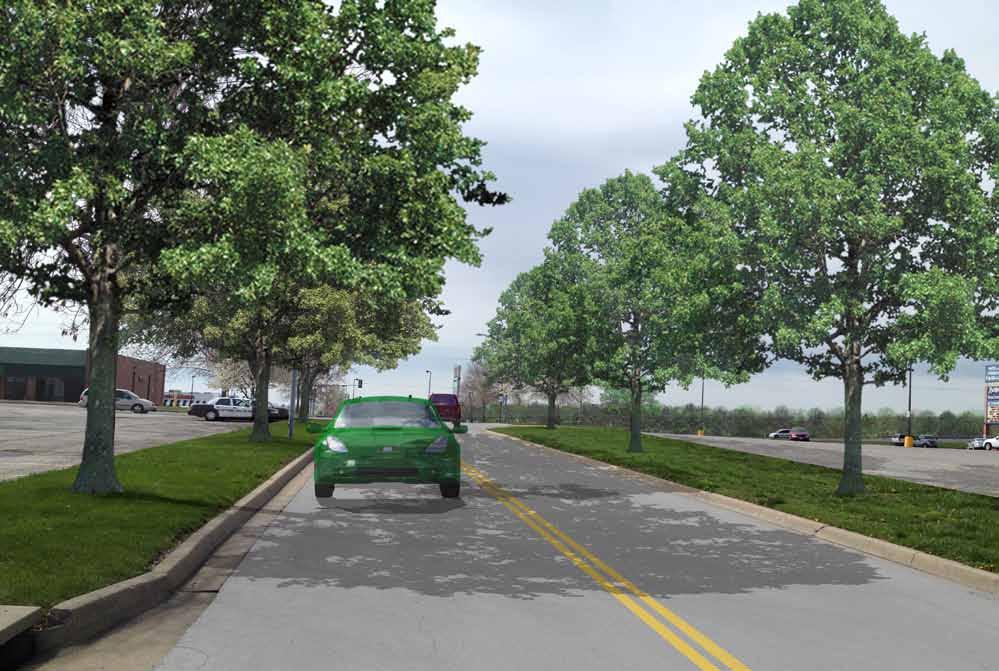
Implementation Strategies | 135
Phase Two
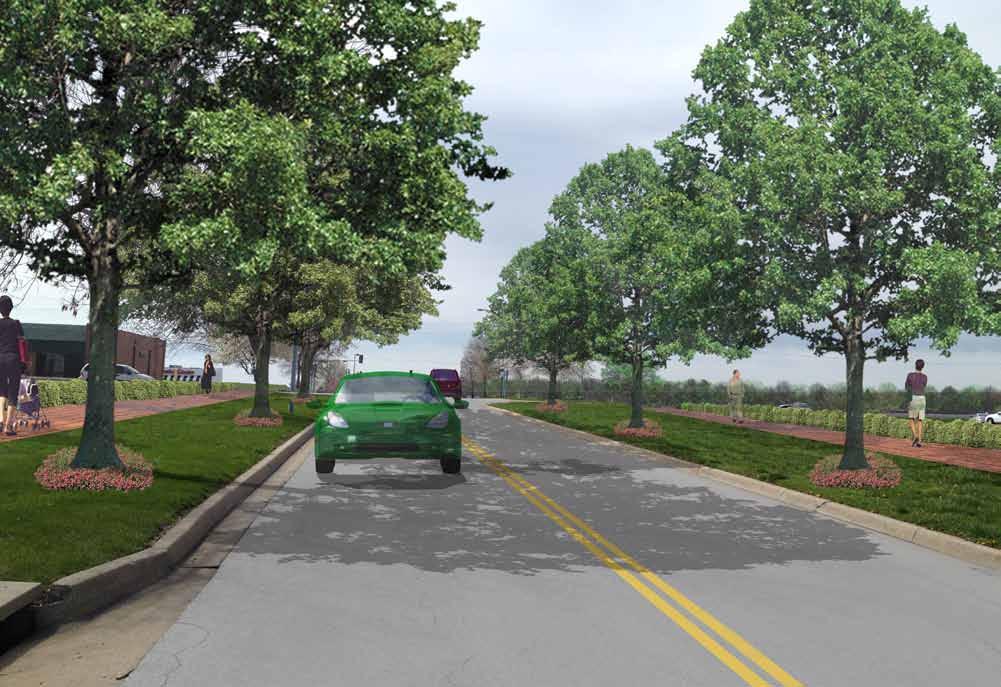
Highway 40 Corridor Plan | Focus Area Plans 136 | Implementation Strategies
Phase Three
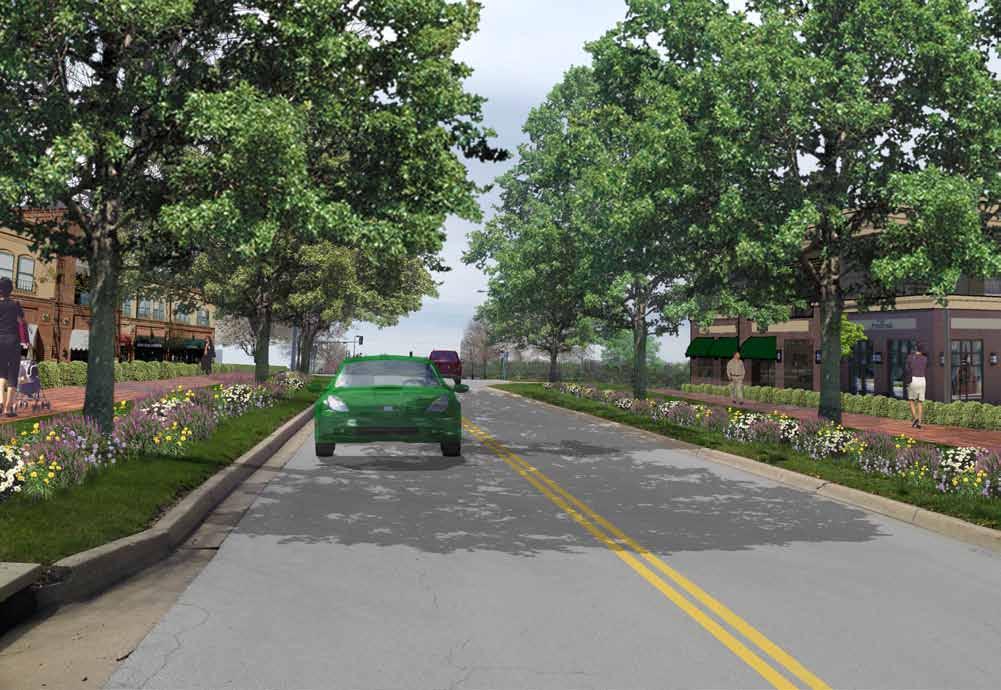
Implementation Strategies | 137
