MEMO
Date: December 2021
To: Audit Finance Committee
From: Finance
NOVEMBER CITY‐WIDE TAX REVENUE
Real Estate Tax
The City collects property tax in the General Fund and the Health, Parks and Recreation Funds. The City receives real estate taxes in November. Taxes decreased from 2020-21 by $129,417 due the prior year recoupments issued by Jackson County that reduced the City’s assessed property valuation. Recoupments are the settlements by the residents that appeal their property valuations
Budgeted split was set with 68% to General Fund with the remaining 32% to Health Levy Fund and Recreation Prop Fund. The 32% is then split with 32% to Health Levy Fund and 68% to Recreation Prop Fund

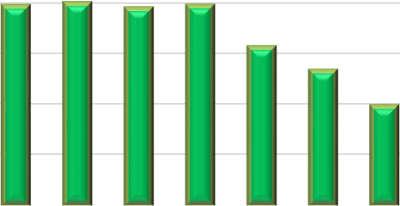
Property Tax Comparison Year 2020-21 vs 2021-22
2021‐22 2020‐21 General Fund $5,704,254 $5,789,755 Health Levy Fund 858,994 873,047 Recreation Prop Fund 1,825,361 1,855,224 Total $8,388,609 $8,518,026 5,704,254 5,789,755 858,994 873,047 1,825,361 1,855,224 0 2,000,000 4,000,000 6,000,000 8,000,000 10,000,000 2021-22 2020-21
General Fund Health Levy Fund Recreation Prop Fund
Sales Tax

As shown with the red dot on the Sales Tax revenue graph below, November sales tax collections are in line with last year’ collections.
Use Tax
The cap for Animal Shelter (Fund 010) is $762,750.
The cap for Police Use Tax (Fund 018) is $3,032,000.


The funds received after the caps have been met are then prorated based on the sales tax rate for each of the funds receiving sales tax. Distribution for the amount is as follows:
Nov 2021 Year to Date Fund Collections Collections Animal Services Use $ - $ 762,750 Police Use $ 470,046 $ 1,607,784 General $ - $Street Sales $ - $Parks Sales $ - $Stormwater sales $ - $Police Sales $ - $Fire Sales $ - $$ 470,046 $ 2,370,534500,000.00 1,000,000.00 1,500,000.00 2,000,000.00 2,500,000.00
GENERAL FUND
2019-20 2020-21 2021-22 15,000,000 16,000,000 17,533,711 17,745,438 18,295,167 8,338,262 0 2,000,000 4,000,000 6,000,000 8,000,000 10,000,000 12,000,000 14,000,000 16,000,000 18,000,000 20,000,000 2016-17 2017-18 2018-19 2019-20 2020-21 2021-22
Sales Tax Revenue General Fund 002 November 30, 2021
SALES TAX REVENUE ‐
002
Annual
Use Tax Monthly for 2021-2022
Use Tax Annual Comprison For Years Ending 2020-2022
TRANSIENT GUEST TAX
The City receives taxes from the gross daily rent due from or paid by transient guests of all hotels and motels, bed and breakfast inns and campgrounds. Each operator will, on or before the twentieth day of the month following the close of each month, make a return of taxes collected for transient occupancy.
Use of funds are used for Historic site maintenance and Tourism sales and services. The November collections are trending higher than collections for November in 2019 and 2020.
Guest Tax By Month
Guest
Fiscal Years
217,198 258,488 263,056 24,008 - - - - - -217,198 258,488 263,056 398,995 470,046100,000 200,000 300,000 400,000 500,000 600,000 Jul Aug Sep Oct Nov Dec Jan Feb Mar Apr May Jun
010 Animal 018 Police Other-Over Cap 0 100000 200000 300000 400000 500000 600000
2020 2021 2022 $0 $50,000 $100,000 $150,000 $200,000 $250,000
Fiscal Years 2019, 2020 & YTD 2021 2019-2020 2020-2021 2021-2022 1,963,550 1,991,864 1,938,962 1,967,003 1,554,582 1,321,757 970,608 $0 $500,000 $1,000,000 $1,500,000 $2,000,000 $2,500,000 2016 2017 2018 2019 2020 2021 2022
Tax Annual
2016 - YTD 2022
Receipts
FUND BALANCE
The City’s policy for minimum fund balances are as follows:
o General Fund – 16% of annual operating revenues.
o Special Revenue Funds designated for capital purposes – 5% of annual operating revenues.
o Special Revenue Funds supporting personnel and ongoing operations – 16% of annual operating revenues
The following page show the fund balance calculation for November 30, 2021
o The General Fund, Street Sales Tax, Fire Protection Sales Tax, and Power and Light fund are below their targets.
o City Policy is that a plan needs to be developed to replenish the fund balance to target within five-years.
Some funds show surplus over the target. These surpluses need to be balanced with capital spending plans showing the use of those surpluses. The page after includes the adopted six-year CIP showing capital expenditures for each fund
Fund November 30, Balance Policy Basis of Calculation Actual % 5% Policy 16% Policy Over (Under) General 9,886,560 16% of operating expenditures 78,017,743 13% - 12,482,839 (2,596,279) $ Street Sales Tax 857,384 Between 5% and 16% of Revenues 9,035,391 9% - 1,445,663 (588,279) Park Improvement 2,364,296 Between 5% and 16% of Revenues 5,037,657 47% - 806,025 1,558,271 Storm Water 8,407,537 Between 5% and 16% of Revenues 4,637,032 181% - 741,925 7,665,612 Police Public Safety Sales 1,644,504 5% of Annual Revenues 2,459,201 67% 122,960 - 1,521,544 Fire Protection Sales Tax 264,511 Between 5% and 16% of Revenues 2,271,486 12% - 363,438 (98,927) Animal Shelter Use 652,539 Between 5% and 16% of Revenues 762,750 86% - 122,040 530,499 Police Use 4,663,872 Between 5% and 16% of Revenues 3,039,000 153% - 486,240.00 4,177,632 Health Property Tax 755,973 Between 5% and 16% of Revenues 1,386,432 55% - 221,829.12 534,144 Parks and Rec Property Tax 1,554,124 Between 5% and 16% of Revenues 2,146,831 72% - 343,493 1,210,631 Tourism 934,821 Between 5% and 16% of Revenues 1,683,926 56% - 269,428.16 665,393 Power and Light 46,469,029 Risk Based Calculation 67,000,000 - - - (20,530,971) Water 43,482,545 Risk Based Calculation 15,300,000 0% - - 28,182,545 Water Pollution Control 31,885,024 Risk Based Calculation 16,550,000 - - - 15,335,024
OF INDEPENDENCE,
Reserve Balance per Policy For the period ended November 30, 2021
CITY
MISSOURI
Capital Improvement Program 2022‐2027
Total 6‐year Fund 2022 2023 2024 2025 2026 2027 CIP General - - - - - -Street Sales 6,499,336 6,473,836 6,415,899 6,176,579 6,395,871 7,250,256 39,211,777 Park Improvement - - - - - -Storm Water 1,772,500 2,822,500 2,892,500 1,720,000 1,780,000 1,760,000 12,747,500 Police Public Safety Sales 2,573,508 1,834,663 1,898,917 550,000 - - 6,857,088 Fire Protection Sales Tax - - - - - -Animal Shelter Use - - - - - -Police Use Health Property Tax------Parks and Rec Property Tax - - - - - -Tourism 275,000 75,000 75,000 75,000 75,000 75,000 650,000 Power and Light 6,003,956 4,560,000 3,540,000 2,000,000 950,000 960,000 18,013,956 Water 6,420,000 7,200,000 3,025,000 9,600,000 9,325,000 1,275,000 36,845,000 Water Pollution Control 3,937,500 3,878,900 3,978,750 4,008,000 3,977,000 4,000,000 23,780,150 27,483,822 26,846,922 21,828,090 24,131,604 22,504,897 15,322,283 138,105,471
ITEMS OF NOTE for NOVEMBER 2021 General Fund
The actual year-to-date General Fund revenues and other financing sources, through November 30th, compared to the amended budget are 49.84%, and actual expenditures and other financing uses are 42.39%. These percentages are in line with the cumulative total trend of 41.67% (November is month 5 and 5 divided by 12 = 41.67%). The attached summary reports reflect the November year-to-date actual revenues and expenditures compared to total budget.
There are a couple of revenue streams that are trending significantly below the 41.67%.
Franchise Taxes are at 31.22%.
Fines and Forfeitures are at 21.56%.
Real Estate taxes are at 99.36% because the billings are booked annually when the County issues the tax bills, and then revenues are updated monthly for tax adjustments.
The American Rescue Plan (ARP) funds of $3,122,000 have been transferred to the General Fund for loss of revenue. Without the ARP funds the revenues and other financing sources would be at 45.67%.
There are a couple of departments where expenditures are trending above the 41.67%.
City Clerk is at 63.30% - this is due to a payment for election costs in October that utilized 100% of the budget for this line item.
Fire is at 46.11% - this is mainly due to over-time and minimum staffing and encumbrances being entered at the start of the year that cover the entire fiscal year or multiple future months.
Law is at 45.39% - this is due to a purchase being made in September that utilized 100% of the budget for this line item (land purchase).
UTILITY FUND NOTES
Power and Light
The actual year-to-date Power and Light operating revenues, through November 30, 2021, compared to the amended budget are 44.96%. Operating expenditures are 42.58%. This percentage is compared to the cumulative total trend of 41.67% (November is month 5 and 5 divided by 12 = 41.67%). Total Transfers and Special Items are at 47.66% which includes Payments in Lieu of taxes for the month of November. The attached summary reports reflect the November 2021 year-to-date actual revenues and expenditures compared to total budget.
Water
The actual year-to-date Water operating revenues, through November 30, 2021, compared to the amended budget are 45.97%. Operating expenditures are 27.67%. This percentage is compared to the cumulative total trend of 41.67% (November is month 5 and 5 divided by 12 = 41.67%). Total Transfers are at 44.31% which includes Payments in Lieu of taxes for the month of November. The attached summary reports reflect the November 2021 year-to-date actual revenues and expenditures compared to total budget.
Sanitary Sewer
The actual year-to-date Sanitary Sewer operating revenues, through November 30, 2021, compared to the amended budget are 44.36%. Operating expenditures are 19.93%. This percentage is compared to the cumulative total trend of 41.67% (November is month 5 and 5 divided by 12 = 41.67%). Total Transfers are at 40.83% which includes Payments in Lieu of taxes for the month of November. The attached summary reports reflect the November 2021 year-to-date actual revenues and expenditures compared to total budget.

Monthly Financial and Operating Report November 2021
Table of Contents General Fund 1 Sales Tax Funds Street Improvements Sales Tax Fund 2 Park Improvements Sales Tax Fund 3 Storm Water Sales Tax Fund 4 Police Public Safety Sales Tax Fund 5 Fire Protection Sales Tax Fund 6 Use Tax Funds Animal Shelter 7 Police 8 Property Tax Levy Funds Health Property Tax Levy 9 Parks and Recreation Property Tax Levy 10 Special Revenue Funds Tourism Fund 11 Independence Square Benefit District 12 Community Development Block Grant Fund 13 Rental Rehabilitation 14 License Surcharge 15 Grants 16 American Rescue Plan (ARP) 17 Enterprise Funds Power and Light 18 - 19 Water 20 - 21 Water Pollution Control 22 - 23 Events Center Debt Service 24 Internal Service Funds Central Garage 25 Staywell Health Care 26 Worker's Compensation 27 Risk Management 28 Enterprise Resource Planning 29 Debt Service Fund Debt Service - Neighborhood Improvement Districts 30 Capital Improvement Funds Street Improvements Capital Project Fund 31 Revolving Public Improvements Capital Project Fund 32 Building and Other Improvements Capital Project Fund 33 Storm Drainage Capital Project Fund 34 Park Improvements Capital Project Fund 35 Private Purpose Expendable Trust Fund - Vaile Mansion 36 Independence Events Center CID 37 Crackerneck Creek TDD 38 Tax Increment Financing Summary 39 Mid-Town Truman Rd TIF 40 Santa Fe TIF 41 Hartman Heritage TIF 42 Drumm Farm TIF 43 Eastland TIF 44 North Independence TIF 45 Mt Washington TIF 46 Crackerneck Creek TIF 47 Old Landfill TIF 48 Trinity TIF 49 HCA TIF 50 Cinema East TIF 51 23rd & Noland Project 1 TIF 52 23rd & Noland Project 2 TIF 53 23rd & Noland Project 3 TIF 54 23th & Noland Project 4 TIF 55 Independence Square TIF 56 I-70 & Little Blue Parkway Project 1 TIF 57 I-70 & Little Blue Parkway Project 3 TIF 58 Marketplace Project 1 TIF 59 Marketplace Project 2 TIF 60 TIF Application Fees 61 TIF Supplemental Appropriation Fund 62
CITY OF INDEPENDENCE, MISSOURI Budgetary Comparison Schedule General Fund
For the period ended November 30, 2021
Actual Variance Percent Percent Budgeted Amounts Amounts with Final Actual From Original Amended (Budget Basis) Budget 41.67% of Year Budget Revenues: Real Estate Tax $ 5,732,000 5,732,000 5,696,478 (35,522) 99.38% 57.71% Sales Tax 18,617,431 18,617,431 8,338,262 (10,279,169) 44.79% 3.12% Use Tax 448,000 448,000 (448,000) 0.00% -41.67% Cigarette Tax 420,000 420,000 164,977 (255,023) 39.28% -2.39% Franchise Tax 8,171,990 8,171,990 2,551,398 (5,620,592) 31.22% -10.45% Licenses and Permits 4,043,350 3,991,500 2,228,871 (1,762,629) 55.84% 14.17% Intergovernmental 5,330,000 5,330,000 2,149,818 (3,180,182) 40.33% -1.34% Charges for Current Services 1,915,000 1,908,000 711,173 (1,196,827) 37.27% -4.40% Interfund Charges for Support Services 5,035,500 5,035,500 2,098,125 (2,937,375) 41.67% 0.00% Fines and Forfeitures 3,710,000 3,710,000 799,954 (2,910,046) 21.56% -20.11% Investment Income (Loss) 194,000 194,000 62,068 (131,932) 31.99% -9.68% Other Revenue 541,894 541,894 270,377 (271,517) 49.89% 8.22% Total Revenues 54,159,165 54,100,315 25,071,501 (29,028,814) 46.34% 4.67% Other Financing Sources: Payments In Lieu of Taxes 20,696,578 20,696,578 9,088,036 (11,608,542) 43.91% 2.24% Operating Transfers In - American Rescue Plan 3,122,000 3,122,000 0.00% -41.67% Total Other Financing Sources 20,696,578 20,696,578 12,210,036 (8,486,542) 59.00% 17.33% Total Revenues and Other Financing Sources 74,855,743 74,796,893 37,281,537 (37,515,356) 49.84% 8.17% Expenditures: City Council 711,350 711,350 272,313 439,037 38.28% -3.39% City Clerk 325,744 376,244 238,177 138,067 63.30% 21.63% City Manager 1,185,232 1,185,232 456,047 729,185 38.48% -3.19% Municipal Court 1,264,139 1,225,139 475,617 749,522 38.82% -2.85% Law 611,371 771,371 350,101 421,270 45.39% 3.72% Finance 6,264,935 6,303,935 2,614,840 3,689,095 41.48% -0.19% Community Development 4,576,184 4,576,184 1,883,329 2,692,855 41.16% -0.51% Police 33,155,226 33,155,226 13,532,167 19,623,059 40.81% -0.86% Fire 23,852,022 23,852,022 10,998,317 12,853,705 46.11% 4.44% Health 2,941 (2,941) 0.00% -41.67% Municipal Services (Public Works) 5,995,281 5,828,028 2,281,509 3,546,519 39.15% -2.52% Parks and Recreation 167,253 47,638 119,615 28.48% -13.19% Contingencies 17,028 17,028 17,028 0.00% -41.67% Debt service 59,231 59,231 59,231 0.00% -41.67% Total Expenditures 78,017,743 78,228,243 33,152,996 45,075,247 42.38% 0.71% Other Financing Uses: Transfers Out 10,000 10,000 10,000 100.00% 58.33% Total Expenditures and Other Financing Uses 78,027,743 78,238,243 33,162,996 45,075,247 42.39% 0.72% Excess of Revenue and Other Financing Sources Over (Under) Expenditures and Other Financing Uses, Budget Basis $ (3,172,000) (3,441,350) 4,118,541 7,559,891 Unassigned Fund Balance at Beginning of Year 5,708,549 Cancellation of prior year encumbrances 55,615 Change in other fund balance components during the year 5,261 Year-end investment market value adjustment Ending Unassigned Fund Balance, 11/30/21 9,887,966 Restricted 118,750 Committed 11,112 Assigned 1,715,199 Total Fund Balance $ 11,733,027
1
CITY OF INDEPENDENCE, MISSOURI Budgetary
Actual Variance Percent Percent Budgeted Amounts Amounts with Final Actual From Original Amended (Budget Basis) Budget 41.67% of Year Budget Revenues: Sales Taxes $ 8,770,391 8,770,391 3,964,767 (4,805,624) 45.21% 3.54% Use Tax 224,000 224,000 (224,000) 0.00% -41.67% Charges for Services 0.00% -41.67% Intergovernmental Revenue 0.00% -41.67% Investment Income (Loss) 41,000 41,000 35,045 (5,955) 85.48% 43.81% Other Revenue 0.00% -41.67% Total Revenues 9,035,391 9,035,391 3,999,812 (5,035,579) 44.27% 2.60% Other Financing Sources: Transfers in 0.00% -41.67% Total other financing sources 0.00% -41.67% Total revenues and other financing sources 9,035,391 9,035,391 3,999,812 (5,035,579) 44.27% 2.60% Expenditures: General Government 0.00% -41.67% Street Maintenance 1,166,177 1,166,177 680,558 485,619 58.36% 16.69% Capital Outlay 6,486,836 22,952,225 4,538,113 18,414,112 19.77% -21.90% Debt Service 474,576 474,576 217,074 257,502 45.74% 4.07% Total Expenditures 8,127,589 24,592,978 5,435,745 19,157,233 22.10% -19.57% Other Financing Uses: Transfers Out 0.00% -41.67% Total Other Financing Uses 0.00% -41.67% Total Expenditures and Other Financing Uses 8,127,589 24,592,978 5,435,745 19,157,233 22.10% -19.57% Excess of Revenues Over (Under) Expenditures and Other Financing Uses $ 907,802 (15,557,587) (1,435,933) 14,121,654 Unassigned Fund Balance at Beginning of Year 1,885,478 Cancellation of Prior Year Encumbrances Change in Other Fund Balance Components During the Year 407,839 Year-end investment market value adjustment Ending Unassigned Fund Balance, 11/30/21 857,384 Fund Balance Components: Restricted - Current Year Encumbrances 4,327,085 Restricted - Prior Year Encumbrances 2,595,207 Restricted - Debt Reserve Project Accounts - Capital Projects 13,431,753 Total Fund Balance $ 21,211,429
Comparison Schedule Street Improvements Sales Tax Fund For the period ended November 30, 2021 2
CITY OF INDEPENDENCE, MISSOURI Budgetary Comparison Schedule Park Improvements Sales Tax Fund For the period ended November 30, 2021
Actual Variance Percent Percent Budgeted Amounts Amounts with Final Actual From Original Amended (Budget Basis) Budget 41.67% of Year Budget Revenues: Sales Taxes $ 4,385,212 4,385,212 1,982,384 (2,402,828) 45.21% 3.54% Use Tax 112,000 112,000 (112,000) 0.00% -41.67% Charges for services 519,752 519,752 178,883 (340,869) 34.42% -7.25% Intergovernmental 0.00% -41.67% Investment Income (Loss) 18,180 18,180 17,944 (236) 98.70% 57.03% Other Revenue 2,513 2,513 6,554 4,041 260.80% 219.13% Total Revenues 5,037,657 5,037,657 2,185,765 (2,851,892) 43.39% 1.72% Other Financing Sources: Transfers In 240,092 240,092 (240,092) 0.00% -41.67% Transfers In - American Rescue Plan 1,617,285 1,617,285 0.00% -41.67% Proceeds from Bond Issuance/Capital Lease 0.00% -41.67% Total Other Financing Sources 240,092 240,092 1,617,285 1,377,193 673.61% 631.94% Total Revenues and Other Financing Sources 5,277,749 5,277,749 3,803,050 (1,474,699) 72.06% 30.39% Expenditures: Culture and Recreation 4,373,935 4,373,935 1,965,273 2,408,662 44.93% 3.26% Capital Outlay 506,000 1,394,608 72,728 1,321,880 5.21% -36.46% Debt Service 207,215 207,215 207,215 0.00% -41.67% Total Expenditures 5,087,150 5,975,758 2,038,001 3,937,757 34.10% -7.57% Other Financing Uses: Transfers Out 0.00% -41.67% Total Other Financing Uses 0.00% -41.67% Total Expenditures and Other Financing Uses 5,087,150 5,975,758 2,038,001 3,937,757 34.10% -7.57% Excess of Revenues Over (Under) Expenditures and Other Financing Uses $ 190,599 (698,009) 1,765,049 2,463,058 Unassigned Fund Balance at Beginning of Year 599,247 Cancellation of Prior Year Encumbrances Change in Other Fund Balance Components During the Year Year-end investment market value adjustment Ending Unassigned Fund Balance, 11/30/21 2,364,296 Other Fund Balance Components: Restricted - Current Year Encumbrances 441,179 Restricted - Prior Year Encumbrances 75,344 Total Fund Balance $ 2,880,819
3
CITY OF INDEPENDENCE, MISSOURI Budgetary Comparison Schedule
Storm Water Sales Tax Fund
For the period ended November 30, 2021
Actual Variance Percent Percent Budgeted Amounts Amounts with Final Actual From Original Amended (Budget Basis) Budget 41.67% of Year Budget Revenues: Sales Taxes $ 4,385,212 4,385,212 1,982,385 (2,402,827) 45.21% 3.54% Use Tax 112,000 112,000 (112,000) -41.67% Investment Income (loss) 132,000 132,000 75,046 (56,954) 56.85% 15.18% Other Revenue 7,820 7,820 7,876 56 100.72% 59.05% Total revenues 4,637,032 4,637,032 2,065,307 (2,571,725) 44.54% 2.87% Expenditures: Storm water Administration 272,856 272,856 125,058 147,798 45.83% 4.16% Maintenance 2,381,657 2,381,657 1,340,632 1,041,025 56.29% 14.62% Permit completion 318,000 318,000 297,300 20,700 93.49% 51.82% Capital outlay 1,760,000 4,999,175 1,371,287 3,627,888 27.43% -14.24% Total Expenditures 4,732,513 7,971,688 3,134,277 4,837,411 39.32% -2.35% Total Ependitures and Other Financing Uses 4,732,513 7,971,688 3,134,277 4,837,411 Excess of Revenues Over (Under) Expenditures and Other Financing Uses $ (95,481) (3,334,656) (1,068,970) 2,265,686 Unassigned Fund Balance at Beginning of Year 9,476,507 Cancellation of Prior Year Encumbrances Change in Other Fund Balance Components During the Year Year-end investment market value adjustment Ending Unassigned Fund Balance, 11/30/21 8,407,537 Other Fund Balance Components: Restricted - Current Year Encumbrances 1,859,691 Restricted - Prior Year Encumbrances 446,361 Restricted - Regional Detention Construction 18,759 Restricted - Regional Detention Maintenance 40,311 Restricted - Emergency Response Relief 500,000 Total Fund Balance $ 11,272,659
4
CITY OF INDEPENDENCE, MISSOURI Budgetary Comparison Schedule Police Public Safety Sales Tax Fund For the period ended November 30, 2021
Actual Variance Percent Percent Budgeted Amounts Amounts with Final Actual From Original Amended (Budget Basis) Budget 41.67% of Year Budget Revenues: Sales Taxes $ 2,358,694 2,358,694 1,052,619 (1,306,075) 44.63% 2.96% Use Tax 56,000 56,000 (56,000) 0.00% -41.67% Investment Income (Loss) 37,000 37,000 16,035 (20,965) 43.34% 1.67% Other Revenue 7,507 7,507 28,504 20,997 379.70% 338.03% Total Revenues 2,459,201 2,459,201 1,097,158 (1,362,043) 44.61% 2.94% Expenditures: Public Safety Communications 675,922 675,922 460,898 215,024 68.19% 26.52% Facilities 104,500 104,500 53,738 50,762 51.42% 9.75% Equipment 1,924,697 1,924,697 1,215,491 709,206 63.15% 21.48% Debt Service 0.00% -41.67% Total Expenditures 2,705,119 2,705,119 1,730,127 974,992 63.96% 22.29% Other Financing Uses: Transfers Out/Capital Outlay 0.00% -41.67% Total Other Financing Uses 0.00% -41.67% Total Expenditures and Other Financing Uses 2,705,119 2,705,119 1,730,127 974,992 63.96% 22.29% Excess of Revenues Over (Under) Expenditures and Other Financing Uses $ (245,918) (245,918) (632,969) (387,051) Unassigned Fund Balance at Beginning of Year 2,277,473 Cancellation of Prior Year Encumbrances Change in Other Fund Balance Components During the Year Year-end investment market value adjustment Ending Unassigned Fund Balance, 11/30/21 1,644,504 Other Fund Balance Components: Restricted - Current Year Encumbrances 954,390 Restricted - Prior Year Encumbrances 75,192 Total Fund Balance $ 2,674,086
5
CITY OF INDEPENDENCE, MISSOURI Budgetary Comparison Schedule Fire Protection Sales Tax Fund For the period ended November 30, 2021
Actual Variance Percent Percent Budgeted Amounts Amounts with Final Actual From Original Amended (Budget Basis) Budget 41.67% of Year Budget Revenues: Sales Taxes $ 2,192,486 2,192,486 991,194 (1,201,292) 45.21% 3.54% Use Tax 56,000 56,000 (56,000) 0.00% -41.67% Investment Income (Loss) 17,000 17,000 12,990 (4,010) 76.41% 34.74% Other Revenue 6,000 6,000 11,500 5,500 191.67% 150.00% Total Revenues 2,271,486 2,271,486 1,015,684 (1,255,802) 44.71% 3.04% Expenditures: Public Safety 2,763,693 2,763,693 1,432,371 1,331,322 51.83% 10.16% Debt Service 73,236 73,236 73,236 0.00% -41.67% Total Expenditures 2,836,929 2,836,929 1,432,371 1,404,558 50.49% 8.82% Other Financing Uses: Transfers Out/Capital Outlay 0.00% -41.67% Total Other Financing Uses 0.00% -41.67% Total Expenditures and Other Financing Uses 2,836,929 2,836,929 1,432,371 1,404,558 50.49% 8.82% Excess of Revenues Over (Under) Expenditures and Other Financing Uses $ (565,443) (565,443) (416,687) 148,756 Unassigned Fund Balance at Beginning of Year 678,965 Cancellation of Prior Year Encumbrances 2,233 Change in Other Fund Balance Components During the Year Year-end investment market value adjustment Ending Unassigned Fund Balance, 11/30/21 264,511 Other Fund Balance Components: Restricted - Current Year Encumbrances 154,095 Restricted - Prior Year Encumbrances 1,381,590 Total Fund Balance $ 1,800,196
6
CITY OF INDEPENDENCE, MISSOURI Budgetary Comparison Schedule
Animal Shelter Use Tax
For the period ended November 30, 2021
Actual Variance Percent Percent Budgeted Amounts Amounts with Final Actual From Original Amended (Budget Basis) Budget 41.67% of Year Budget Revenues: Use Tax $ 762,750 762,750 762,750 100.00% 58.33% Intergovernmental Revenue 0.00% -41.67% Investment Income (Loss) 1,272 1,272 0.00% -41.67% Other Revenue 0.00% -41.67% Total Revenues 762,750 762,750 764,022 1,272 100.17% 58.50% Expenditures: General Government -41.67% Animal Services 728,545 728,545 264,606 463,939 36.32% -5.35% Capital Outlay 0.00% -41.67% Debt Service 0.00% -41.67% Total Expenditures 728,545 728,545 264,606 463,939 36.32% -5.35% Other Financing Uses: Transfers In 0.00% -41.67% Transfers Out 0.00% -41.67% Total Other Financing Uses 0.00% -41.67% Total Expenditures and Other Financing Uses 728,545 728,545 264,606 463,939 36.32% -5.35% Excess of Revenues Over (Under) Expenditures and Other Financing Uses $ 34,205 34,205 499,416 465,211 Unassigned Fund Balance at Beginning of Year 153,123 Cancellation of Prior Year Encumbrances Change in Other Fund Balance Components During the Year Ending Unassigned Fund Balance, 11/30/21 652,539 Fund Balance Components: Restricted - Current Year Encumbrances Restricted - Prior Year Encumbrances 1,436 Total Fund Balance $ 653,975
7
CITY OF INDEPENDENCE, MISSOURI Budgetary Comparison Schedule
Police Use Tax
For the period ended November 30, 2021
Actual Variance Percent Percent Budgeted Amounts Amounts with Final Actual From Original Amended (Budget Basis) Budget 41.67% of Year Budget Revenues: Use Tax $ 3,032,000 3,032,000 1,607,783 (1,424,217) 53.03% 11.36% Investment Income (Loss) 7,000 7,000 26,924 19,924 384.63% 342.96% Other Revenue 0.00% -41.67% Total Revenues 3,039,000 3,039,000 1,634,707 (1,404,293) 53.79% 12.12% Expenditures: Public Safety 2,258,155 2,258,155 517,327 1,740,828 22.91% -18.76% Debt Service 0.00% -41.67% Total Expenditures 2,258,155 2,258,155 517,327 1,740,828 22.91% -18.76% Other Financing Uses: Transfers Out/Capital Outlay 0.00% -41.67% Total Other Financing Uses 0.00% -41.67% Total Expenditures and Other Financing Uses 2,258,155 2,258,155 517,327 1,740,828 22.91% -18.76% Excess of Revenues Over (Under) Expenditures and Other Financing Uses $ 780,845 780,845 1,117,380 336,535 Unassigned Fund Balance at Beginning of Year 3,546,492 Cancellation of Prior Year Encumbrances Change in Other Fund Balance Components During the Year Year-end investment market value adjustment Ending Unassigned Fund Balance, 11/30/21 4,663,872 Other Fund Balance Components: Restricted - Current Year Encumbrances Restricted - Prior Year Encumbrances Total Fund Balance $ 4,663,872
8
CITY OF INDEPENDENCE, MISSOURI
Budgetary Comparison Schedule Health Property Tax Levy For the period ended November 30, 2021 Actual Variance Percent Percent Budgeted Amounts Amounts with Final Actual From Original Amended (Budget Basis) Budget 41.67% of Year Budget Revenues: Taxes $ 870,000 870,000 858,234 (11,766) 98.65% 56.98% Charges for Services 150,000 157,000 53,930 (103,070) 34.35% -7.32% Licenses & Permits 366,432 418,282 170,851 (247,431) 40.85% -0.82% Investment Income (Loss) 1,704 1,704 0.00% -41.67% Other Revenue 2,836 2,836 0.00% -41.67% Total Revenues 1,386,432 1,445,282 1,087,555 (357,727) 75.25% 33.58% Other Financing Sources: Transfers In - American Rescue Plan 300,000 300,000 0.00% -41.67% Total Other Financing Uses 300,000 300,000 0.00% -41.67% Total Revenues and Other Sources 1,386,432 1,445,282 1,387,555 (57,727) 96.01% 54.34% Expenditures: Animal Services 884,518 884,518 395,127 489,391 44.67% 3.00% Health Services 778,674 778,674 289,746 488,928 37.21% -4.46% Total Expenditures 1,663,192 1,663,192 684,873 978,319 41.18% -0.49% Other Financing Uses: Transfers Out 0.00% -41.67% Total Other Financing Uses 0.00% -41.67% Total Expenditures and Other Uses 1,663,192 1,663,192 684,873 978,319 41.18% -0.49% Excess of Revenues Over (Under) Expenditures and Other Financing Uses $ (276,760) (217,910) 702,682 920,592 Unassigned Fund Balance at Beginning of Year 52,841 Cancellation of Prior Year Encumbrances Change in Other Fund Balance Components During the Year Ending Unassigned Fund Balance, 11/30/21 755,523 Other Fund Balance Components: Restricted - Current Year Encumbrances 27,418 Restricted - Prior Year Encumbrances 2,947 Total Fund Balance $ 785,888
9
CITY OF INDEPENDENCE, MISSOURI
Budgetary Comparison Schedule Parks and Recreation Property Tax Levy For the period ended November 30, 2021 Actual Variance Percent Percent Budgeted Amounts Amounts with Final Actual From Original Amended (Budget Basis) Budget 41.67% of Year Budget Revenues: Taxes $ 1,850,000 1,850,000 1,823,747 (26,253) 98.58% 56.91% Intergovernmental 65,985 65,985 20,480 (45,505) 31.04% -10.63% Charges for Services 230,746 230,746 78,955 (151,791) 34.22% -7.45% Investment Income (Loss) 100 100 6,087 5,987 6087.00% 6045.33% Other Revenue 4,755 4,755 0.00% -41.67% Total Revenues 2,146,831 2,146,831 1,934,024 (212,807) 90.09% 48.42% Expenditures: Parks and Recreation 2,099,104 2,099,104 791,444 1,307,660 37.70% -3.97% Total Expenditures 2,099,104 2,099,104 791,444 1,307,660 37.70% -3.97% Other Financing Uses – Transfers Out 0.00% -41.67% Total Other Financing Uses 0.00% -41.67% Total Expenditures and Other Uses 2,099,104 2,099,104 791,444 1,307,660 37.70% -3.97% Excess of Revenues Over (Under) Expenditures and Other Financing Uses $ 47,727 47,727 1,142,580 1,094,853 Unassigned Fund Balance at Beginning of Year 410,588 Cancellation of Prior Year Encumbrances Change in Other Fund Balance Components During the Year Ending Unassigned Fund Balance, 11/30/21 1,553,168 Other Fund Balance Components: Restricted - Current Year Encumbrances 20,669 Restricted - Prior Year Encumbrances 6,156 Total Fund Balance $ 1,579,993 10
CITY OF INDEPENDENCE, MISSOURI
Budgetary Comparison Schedule Tourism Fund For the period ended November 30, 2021 Actual Variance Percent Percent Budgeted Amounts Amounts with Final Actual From Original Amended (Budget Basis) Budget 41.67% of Year Budget Revenues: Transient Guest Taxes $ 1,652,283 1,652,283 970,608 (681,675) 58.74% 17.07% Charges for Services 30,000 5,687 (24,313) 18.96% -22.71% Investment Income (Loss) 26,593 26,593 9,767 (16,826) 36.73% -4.94% Other Revenue 5,050 5,050 3,151 (1,899) 62.40% 20.73% Total Revenues 1,683,926 1,713,926 989,213 (724,713) 57.72% 16.05% Other Financing Sources: Transfers In - American Resuce Plan 0.00% -41.67% Total Other Financing Uses 0.00% -41.67% Total Revenues and Other Sources 1,683,926 1,713,926 989,213 (724,713) 57.72% 16.05% Expenditures: Tourism 2,550,789 2,617,529 806,861 1,810,668 30.83% -10.84% Total Expenditures 2,550,789 2,617,529 806,861 1,810,668 30.83% -10.84% Other Financing Uses – Transfers Out 240,092 240,092 240,092 0.00% -41.67% Total Other Financing Uses 240,092 240,092 240,092 0.00% -41.67% Total Expenditures and Other Uses 2,790,881 2,857,621 806,861 2,050,760 28.24% -13.43% Excess of Revenues Over (Under) Expenditures and Other Financing Uses $ (1,106,955) (1,143,695) 182,352 1,326,047 Unassigned Fund Balance at Beginning of Year 752,469 Cancellation of Prior Year Encumbrances Change in Other Fund Balance Components During the Year Year-end investment market value adjustment Ending Unassigned Fund Balance, 11/30/21 934,821 Other Fund Balance Components: Restricted - Current Year Encumbrances 258,219 Restricted - Prior Year Encumbrances 20,258 Restricted - Operating Reserve 376,368 Total Fund Balance $ 1,589,666
11
Independence Square Benefit District For the period ended November 30, 2021 Actual Variance Percent Percent Budgeted Amounts Amounts with Final Actual From Original Amended (Budget Basis) Budget 41.67% of Year Budget Revenues: Taxes $ 26,375 26,375 0.00% -41.67% Investment Income (Loss) 703 703 0.00% -41.67% Other Revenue 0.00% -41.67% Total Revenues 27,078 27,078 0.00% -41.67% Expenditures: Capital Outlay 422 (422) 0.00% -41.67% Total Expenditures 422 (422) 0.00% -41.67% Other Financing Uses – Transfers Out 0.00% -41.67% Total Other Financing Uses 0.00% -41.67% Total Expenditures and Other Uses 422 (422) 0.00% -41.67% Excess of Revenues Over (Under) Expenditures and Other Financing Uses $ 26,656 26,656 Unassigned Fund Balance at Beginning of Year 7,663 Cancellation of Prior Year Encumbrances Change in Other Fund Balance Components During the Year Ending Unassigned Fund Balance, 11/30/21 34,319 Other Fund Balance Components: Restricted - Current Year Encumbrances Restricted - Prior Year Encumbrances Total Fund Balance $ 34,319 12
CITY OF INDEPENDENCE, MISSOURI Budgetary Comparison Schedule
MISSOURI
Actual Variance Percent Percent Budgeted Amounts Amounts with Final Actual From Original Amended (Budget Basis) Budget 41.67% of Year Budget Revenues: Federal Grant - CDBG $ 1,605,692 1,605,692 429,121 (1,176,571) 26.72% -14.95% Other Revenue -41.67% Total Revenues 1,605,692 1,605,692 429,121 (1,176,571) 26.72% -14.95% Expenditures: CDBG Administration 166,173 166,173 68,012 98,161 40.93% -0.74% CDBG Expenditures 1,455,527 1,455,527 932,657 522,870 64.08% 22.41% Total Expenditures 1,621,700 1,621,700 1,000,669 621,031 61.70% 20.03% Other Financing Uses: Transfers Out 0.00% -41.67% Total Other Financing Uses 0.00% -41.67% Total Expenditures and Other Uses 1,621,700 1,621,700 1,000,669 621,031 61.70% 20.03% Excess of Revenues Over (Under) Expenditures and Other Financing Uses $ (16,008) (16,008) (571,548) (555,540) Unassigned Fund Balance at Beginning of Year (96,680) Cancellation of Prior Year Encumbrances 28,467 Change in Other Fund Balance Components During the Year Ending Unassigned Fund Balance, 11/30/21 (639,761) Other Fund Balance Components: Restricted - Current Year Encumbrances 591,024 Restricted - Prior Year Encumbrances 48,023 Total Fund Balance $ (714)
Community Development Block Grant Fund For the period ended November 30, 2021 13
CITY OF INDEPENDENCE,
Budgetary Comparison Schedule
CITY OF INDEPENDENCE, MISSOURI Budgetary Comparison Schedule Rental Rehabilitation
For the period ended November 30, 2021
Actual Variance Percent Percent Budgeted Amounts Amounts with Final Actual From Original Amended (Budget Basis) Budget 41.67% of Year Budget Revenues: HOME Program Grant $ 482,477 482,477 82,071 (400,406) 17.01% -24.66% Total Revenues 482,477 482,477 82,071 (400,406) 17.01% -24.66% Expenditures: HOME Administration 63,607 63,607 29,867 33,740 46.96% 5.29% Multi Family Housing 359,759 359,759 359,759 0.00% -41.67% Community Housing Development 102,788 102,788 102,788 0.00% -41.67% Total Expenditures 526,154 526,154 29,867 496,287 5.68% -35.99% Excess of Revenues Over (Under) Expenditures and Other Financing Uses $ (43,677) (43,677) 52,204 95,881 Unassigned Fund Balance at Beginning of Year (401,485) Cancellation of Prior Year Encumbrances Change in Other Fund Balance Components During the Year Ending Unassigned Fund Balance, 11/30/21 (349,281) Other Fund Balance Components: Restricted - Current Year Encumbrances Restricted - Prior Year Encumbrances 349,287 Total Fund Balance $ 6
14
CITY OF INDEPENDENCE, MISSOURI Budgetary Comparison Schedule
License Surcharge
For the period ended November 30, 2021
Actual Variance Percent Percent Budgeted Amounts Amounts with Final Actual From Original Amended (Budget Basis) Budget 41.67% of Year Budget Revenues: Licenses and Permits $ (3,370) (3,370) 0.00% -41.67% Investment Income (Loss) 17,000 17,000 9,260 (7,740) 54.47% 12.80% Other Revenue 0.00% -41.67% Total Revenues 17,000 17,000 5,890 (11,110) 34.65% -7.02% Expenditures: General Government 0.00% -41.67% Total expenditures 0.00% -41.67% Other Financing Uses: Transfers Out/Capital Outlay 0.00% -41.67% Total Other Financing Uses 0.00% -41.67% Total Expenditures and Other Financing Uses 0.00% -41.67% Excess of Revenues Over (Under) Expenditures and Other Financing Uses $ 17,000 17,000 5,890 (11,110) Unassigned Fund Balance at Beginning of Year 1,251,500 Cancellation of Prior Year Encumbrances Change in Other Fund Balance Components During the Year Year-end investment market value adjustment Ending Unassigned Fund Balance, 11/30/21 1,257,390 Other Fund Balance Components: Restricted - Current Year Encumbrances Restricted - Prior Year Encumbrances Total Fund Balance $ 1,257,390
15
CITY OF INDEPENDENCE, MISSOURI Budgetary Comparison Schedule Grants
For the period ended November 30, 2021
Actual Variance Percent Percent Budgeted Amounts Amounts with Final Actual From Original Amended (Budget Basis) Budget 41.67% of Year Budget Revenues: Intergovernmental $ 1,343,409 3,936,904 633,498 (3,303,406) 16.09% -25.58% Charges for Services 105,103 105,103 85,938 (19,165) 81.77% 40.10% Other Revenue 63,885 128 (63,757) 0.20% -41.47% Total Revenues 1,448,512 4,105,892 719,564 (3,386,328) 17.53% -24.14% Other financing sources: Transfers In 0.00% -41.67% Total other financing sources 0.00% -41.67% Total revenues and other financing sources 1,448,512 4,105,892 719,564 (3,386,328) 17.53% -24.14% Expenditures: Public Safety 422,758 1,592,695 775,937 816,758 48.72% 7.05% General Government 138,063 247,282 11,115 236,167 4.49% -37.18% Culture and Recreation 72,876 78,796 (5,920) 108.12% 66.45% Community Development 500,000 1,356,103 2,299,129 (943,026) 169.54% 127.87% Animal Services 8,506 8,506 0.00% -41.67% Health Services 375,721 619,786 117,396 502,390 18.94% -22.73% Total Expenditures 1,436,542 3,897,248 3,282,373 614,875 84.22% 42.55% Other Financing Uses: Transfers Out/Capital Outlay 0.00% -41.67% Total Other Financing Uses 0.00% -41.67% Total Expenditures and Other Financing Uses 1,436,542 3,897,248 3,282,373 614,875 84.22% 42.55% Excess of Revenues Over (Under) Expenditures and Other Financing Uses $ 11,970 208,644 (2,562,809) (2,771,453) Unassigned Fund Balance at Beginning of Year (338,049) Cancellation of Prior Year Encumbrances Change in Other Fund Balance Components During the Year Ending Unassigned Fund Balance, 11/30/21 (2,900,858) Other Fund Balance Components: Restricted - Current Year Encumbrances 2,077,791 Restricted - Prior Year Encumbrances 269,507 Total Fund Balance $ (553,560)
16
CITY OF INDEPENDENCE, MISSOURI Budgetary Comparison Schedule American
For
Actual Variance Percent Percent Budgeted Amounts Amounts with Final Actual From Original Amended (Budget Basis) Budget 41.67% of Year Budget Revenues: Intergovernmental $ 9,196,223 9,196,223 0.00% -41.67% Charges for Services 0.00% -41.67% Other Revenue 0.00% -41.67% Total Revenues 9,196,223 9,196,223 0.00% -41.67% Other financing sources: Transfers in 0.00% -41.67% Total other financing sources 0.00% -41.67% Total revenues and other financing sources 9,196,223 9,196,223 0.00% -41.67% Expenditures: CARES Act 1,952,928 (1,952,928) 0.00% -41.67% Total Expenditures 1,952,928 (1,952,928) 0.00% -41.67% Other Financing Uses: Transfers Out - American Rescue Plan 7,389,285 (7,389,285) 0.00% -41.67% Total Other Financing Uses 7,389,285 (7,389,285) 0.00% -41.67% Total Expenditures and Other Financing Uses 9,342,213 (9,342,213) 0.00% -41.67% Excess of Revenues Over (Under) Expenditures and Other Financing Uses $ (145,990) (145,990) Unassigned Fund Balance at Beginning of Year Cancellation of Prior Year Encumbrances Change in Other Fund Balance Components During the Year Ending Unassigned Fund Balance, 11/30/21 (145,990) Other Fund Balance Components: Restricted - Current Year Encumbrances 145,990 Restricted - Prior Year Encumbrances Total Fund Balance $
Rescue Plan (ARP)
the period ended November 30, 2021 17
CITY OF INDEPENDENCE, MISSOURI Budgetary Comparison Schedule
Power and Light
For the period ended November 30, 2021
Actual Variance Percent Percent Budgeted Amounts Amounts with Amended Actual From Original Amended (Budget Basis) Budget 41.67% of Year Budget Operating Revenues: Charges for Services $ 130,609,070 130,609,070 59,017,384 (71,591,686) 45.19% 3.52% Penalties 1,106,786 1,106,786 592,058 (514,728) 53.49% 11.82% Connection Charges 280,151 280,151 12,000 (268,151) 4.28% -37.39% Miscellaneous 22,378 22,378 0.00% -41.67% Temporary Service 1,350 1,350 0.00% -41.67% Rental Income 340,239 340,239 17,102 (323,137) 5.03% -36.64% Transmission Wheeling 5,000,000 5,000,000 2,084,068 (2,915,932) 41.68% 0.01% Total Operating Revenues 137,336,246 137,336,246 61,746,340 (75,589,906) 44.96% 3.29% Operating Expenses: Personnel Services 29,687,152 29,693,152 12,894,298 16,798,854 43.43% 1.76% Other Services 27,329,604 27,323,604 12,122,691 15,200,913 44.37% 2.70% Supplies 60,402,130 60,400,130 26,397,417 34,002,713 43.70% 2.03% Capital Projects 6,003,956 11,609,690 4,339,881 7,269,809 37.38% -4.29% Capital Operating 1,617,600 1,619,600 76,728 1,542,872 4.74% -36.93% Debt Service 9,992,712 9,992,712 4,166,383 5,826,329 41.69% 0.02% Other Expenses 275,000 275,000 275,000 0.00% -41.67% Total Operating Expenses 135,308,154 140,913,888 59,997,398 80,916,490 42.58% 0.91% Nonoperating Revenues (Expenses): Investment Income 202,902 202,902 53,469 (149,433) 26.35% -15.32% Interfund Charges for Support Services 1,828,147 1,828,147 731,801 (1,096,346) 40.03% -1.64% Miscellaneous Revenue (Expense) 715,639 715,639 281,188 (434,451) 39.29% -2.38% Total Nonoperating Revenue (Expenses) 2,746,688 2,746,688 1,066,458 (1,680,230) 38.83% -2.84% 4,774,780 (830,954) 2,815,400 3,646,354 -338.82% -380.49% Capital Contributions 0.00% -41.67% Transfers Out – Utility Payments In Lieu of Taxes (13,000,000) (13,000,000) (6,195,634) (6,804,366) 47.66% 5.99% Transfers In 0.00% -41.67% Transfers Out 0.00% -41.67% Total Transfers and Special Items (13,000,000) (13,000,000) (6,195,634) (6,804,366) 47.66% 5.99% Excess of Revenue and Other Financing Sources Over (Under) Expenditures and Other Financing Uses, Budget Basis $ (8,225,220) (13,830,954) (3,380,234) 10,450,720 Beginning Available Resources 49,849,263 Ending Available Resources 46,469,029 Revenue Risk 10,900,000 Capital Reserve 12,600,000 Expense Risk 12,900,000 Working Capital 30,600,000 Targeted Reserve Level 67,000,000 Total Non-Restricted Resources Available $ (20,530,971) Income (Loss) Before Transfers
18
Power and Light - Open Capital Projects
PROJECT PROJECT TITLE ORIGINAL BUDGET NET BUDGET AMENDMENTS REVISED BUDGET ENCUMBRANCES ACTUALS AVAILABLE BUDGET 200815 T&D Sys IMPROVEMENTS $ 250,000.00 641,486.08 891,486.08 84,444.46 223,920.00 583,121.62 200824 Prod Plt MISC PROJECTS - 68,257.76 68,257.76 - - 68,257.76 200828 FIBER OPTIC PROGRAM 105,956.00 93,394.03 199,350.03 16,768.25 59,207.23 123,374.55 201106 69 KV SUBSTATION FACILITIES 300,000.00 138,222.55 438,222.55 1,435.00 - 436,787.55 201405 SUBSTATION SECURITY PROJECT - 259,644.39 259,644.39 - 24,494.75 235,149.64 201509 NEW BILLING Sys - 22,047.36 22,047.36 - - 22,047.36 201510 Sys OpS / DISPATCH - 44,634.77 44,634.77 35,122.10 - 9,512.67 201603 69 KV Trans LINE REBUIL 800,000.00 1,348,663.48 2,148,663.48 2,463,715.42 17,039.47 (332,091.41) 201604 Sys OpS / UPS UPGRAD - 45,493.59 45,493.59 - - 45,493.59 201605 Sys OpS WORK AREA - 619,842.18 619,842.18 - - 619,842.18 201606 NEW FINANCIAL MANAGEMENT SYS - 200,000.00 200,000.00 - - 200,000.00 201702 Prod FACILITIES IMPROVE - 586,830.00 586,830.00 - - 586,830.00 201703 BV GROUND WATER - 445,491.07 445,491.07 134,390.24 23,515.81 287,585.02 201706 SUBSTATION K SWITCHGEAR & - 4,006,011.31 4,006,011.31 3,866,876.84 167,559.96 (28,425.49) 201707 MASTER PLAN-FUTURE GENERATIO - 32,500.00 32,500.00 - - 32,500.00 201710 Mo CITY DIVESTITURE - 530,640.70 530,640.70 501,564.04 29,076.16 0.50 201804 SUBSTATION E SWITCHGEAR REPLACEMENT 950,000.00 2,543,308.28 3,493,308.28 1,520,645.04 300,110.24 1,672,553.00 202004 Above Ground Fuel Storage Tanks - 41,800.00 41,800.00 - - 41,800.00 202005 Blue Valley - Eckles Rd 161kV Trans - (41,604.90) (41,604.90) - - (41,604.90) 202101 Substation Fiber Optic Network 750,000.00 125,000.00 875,000.00 - 36,736.38 838,263.62 202102 Traffic Controller Upgrades 60,000.00 (4,000.00) 56,000.00 - - 56,000.00 202103 Traffic Camera System Upgrades 20,000.00 11,837.00 31,837.00 - - 31,837.00 202107 Motorola APX Radio Purchase Phase 2 70,000.00 1,706.82 71,706.82 - 3,989.93 67,716.89 202109 Substation Modeling 100,000.00 150,000.00 250,000.00 - - 250,000.00 202110 20MVAR Capacitor Bank Sub A - 800,000.00 800,000.00 164,865.71 81,590.31 553,543.98 202111 Transmission Pole Replacement Prog 300,000.00 100,000.00 400,000.00 31,252.30 - 368,747.70 202201 Substation A Transformer T-9 Mtce 180,000.00 - 180,000.00 - - 180,000.00 202204 Relay Test Set 80,000.00 - 80,000.00 - - 80,000.00 202205 Desert Storm Switchgear Cabinets 250,000.00 - 250,000.00 - - 250,000.00 202208 Traffic Signal Detection Systems 50,000.00 - 50,000.00 - - 50,000.00 202210 IPL Service Center PBX Upgrade to I 70,000.00 - 70,000.00 - - 70,000.00 202211 H-5 Hot Gas Path Inspection 1,518,000.00 - 1,518,000.00 1,909,344.00 - (391,344.00) 9669 SERVICE CTR FACILITY IMPROVE. 150,000.00 220,084.17 370,084.17 7,174.50 - 362,909.67 $ 6,003,956.00 13,031,290.64 19,035,246.64 10,737,597.90 967,240.24 7,330,408.50 Current Year Prior Year Budget Budget (Enc Roll) Total Budget 11,609,689.70 $ 7,425,556.94 19,035,246.64 Less Expenditures 36,336.27 930,903.97 967,240.24 Less Encumbrances 4,303,544.93 6,434,052.97 10,737,597.90 Total Available 7,269,808.50 $ 60,600.00 7,330,408.50
of November 30, 2021 19
As
CITY OF INDEPENDENCE, MISSOURI Budgetary Comparison Schedule
Water
For the period ended November 30, 2021
Actual Variance Percent Percent Budgeted Amounts Amounts with Amended Actual From Original Amended (Budget Basis) Budget 41.67% of Year Budget Operating Revenues: Charges for Services $ 32,720,000 32,720,000 14,978,931 (17,741,069) 45.78% 4.11% Penalties 120,000 120,000 102,880 (17,120) 85.73% 44.06% Connection/Disconnection Charges 12,000 12,000 8,745 (3,255) 72.88% 31.21% Miscellaneous 1,000 1,000 7,520 6,520 752.00% 710.33% Returned Check Charges 23,000 23,000 11,775 (11,225) 51.20% 9.53% Rental Income 85,000 85,000 34,518 (50,482) 40.61% -1.06% Meter Repairs 0.00% -41.67% Merchandising Jobbing 7,601 7,601 0.00% -41.67% Total Operating Revenues 32,961,000 32,961,000 15,151,970 (17,809,030) 45.97% 4.30% Operating expenses: Personnel Services 9,507,888 9,561,542 3,650,899 5,910,643 38.18% -3.49% Other Services 13,356,698 13,270,370 3,788,631 9,481,739 28.55% -13.12% Supplies 2,466,330 2,466,330 1,830,653 635,677 74.23% 32.56% Capital Projects 6,420,000 19,559,710 1,654,138 17,905,572 8.46% -33.21% Capital Operating 1,072,318 1,158,626 487,925 670,701 42.11% 0.44% Debt Service 2,523,363 2,523,363 2,054,474 468,889 81.42% 39.75% Other Expenses 125,000 125,000 125,000 0.00% -41.67% Total Operating Expenses 35,471,597 48,664,941 13,466,720 35,198,221 27.67% -14.00% Nonoperating Revenues (Expenses): Investment Income 539,138 539,138 302,556 (236,582) 56.12% 14.45% Interfund Charges for Support Services 1,392,092 1,392,092 580,038 (812,054) 41.67% 0.00% Miscellaneous Revenue (Expense) 1,000 1,000 19,089 18,089 1908.90% 1867.23% Total Nonoperating Revenue (Expenses) 1,932,230 1,932,230 901,683 (1,030,547) 46.67% 5.00% (578,367) (13,771,711) 2,586,933 16,358,644 -18.78% -60.45% Transfers Out – Utility Payments In Lieu of Taxes (3,200,000) (3,200,000) (1,417,900) (1,782,100) 44.31% 2.64% Transfers In 0.00% -41.67% Transfers Out 0.00% -41.67% Total Transfers (3,200,000) (3,200,000) (1,417,900) (1,782,100) 44.31% 2.64% Excess of Revenue and Other Financing Sources Over (Under) Expenditures and Other Financing Uses, Budget Basis $ (3,778,367) (16,971,711) 1,169,033 18,140,744 Beginning Available Resources 42,313,512 Ending Available Resources 43,482,545 Revenue Risk 3,800,000 Capital Reserve 4,300,000 Expense Risk 400,000 Working Capital 6,800,000 Targeted Reserve Level 15,300,000 Total Non-Restricted Resources Available $ 28,182,545 Income (Loss) Before Transfers
20
Water - Open Capital Projects
PROJECT PROJECT TITLE ORIGINAL BUDGET NET BUDGET AMENDMENTS REVISED BUDGET ENCUMBRANCES ACTUALS AVAILABLE BUDGET 400708 TREATMENT Plt DISCHARGE $ - 300,000.00 300,000.00 - - 300,000.00 400904 EAST INDEPENDENCE INDUST PARK - 674,000.00 674,000.00 - - 674,000.00 401003 FUTURE Prod WELLS - 965,326.00 965,326.00 - - 965,326.00 401301 23RD ST MAIN REPLACEMENT 150,000.00 177,230.57 327,230.57 - - 327,230.57 401402 LAGOON CLEANOUT - 302,560.00 302,560.00 327,060.00 - (24,500.00) 401505 Dist Sys IMPROVE - 258,054.00 258,054.00 13,273.00 - 244,781.00 401506 TRUMAN ROAD BOOSTER STATION - 106,569.52 106,569.52 34,658.85 - 71,910.67 401601 FILTER BACKWASH OUTFALL - 190,325.00 190,325.00 - - 190,325.00 401602 Plt DISCHARGE OUTFALL - 459,824.48 459,824.48 - - 459,824.48 401605 COURTNEY BEND BASIN CATWALK - 10,020.00 10,020.00 - - 10,020.00 401608 LIME SILO 1,300,000.00 291,070.12 1,591,070.12 209,101.22 255,046.50 1,126,922.40 401703 Maint BUILDING AT CBP - 200,000.00 200,000.00 - - 200,000.00 401704 VAN HORN RESERVOIR IMPROVE - 500,204.23 500,204.23 209,089.00 284,299.23 6,816.00 401706 Main Replacement Ellison Way - 483,814.35 483,814.35 - - 483,814.35 401802 6" Main Replacement James Downey Rd - 250,087.60 250,087.60 - - 250,087.60 401804 Filter Valve House Roof Improvement 75,000.00 22,292.00 97,292.00 - - 97,292.00 401808 VFD Drive Replacements HSP 2 & 4 - 227,728.00 227,728.00 - (3,239.00) 230,967.00 401818 30" Steel Transmission Main Assess - 156,300.00 156,300.00 - - 156,300.00 401821 Main Replacement-32nd/Hunter/Bird - 91,000.00 91,000.00 - - 91,000.00 401822 Main Replacement-24Hwy/Northern/RR - 240,166.00 240,166.00 - - 240,166.00 402002 39th Street Reservoir - 1,200,000.00 1,200,000.00 10,583.40 19,216.60 1,170,200.00 402004 Main Replace Walnut/Leslie/LeesSumm - 143,152.66 143,152.66 12,022.53 49,911.40 81,218.73 402007 Courtney Bend Emergency Generator 1,000,000.00 150,000.00 1,150,000.00 - - 1,150,000.00 402008 Wellfield Overhead Electrical Imp 800,000.00 200,000.00 1,000,000.00 - - 1,000,000.00 402009 Main Replace Sheley/Claremont/Norw - 191,032.00 191,032.00 2,242.00 - 188,790.00 402010 Main Replace Gudgell/Dodgion/KingsH - 1,282,050.00 1,282,050.00 1,165,500.00 - 116,550.00 402011 Main Replace Salisbury/Peck/Geospac - 551,900.00 551,900.00 1,000.00 - 550,900.00 402012 College Avenue Improvements - 250,000.00 250,000.00 - - 250,000.00 402101 Main Replacement Ralston 31st/29th - 350,000.00 350,000.00 20,223.00 - 329,777.00 402102 Main Replacement 3rd St & Jennings - 460,000.00 460,000.00 - - 460,000.00 402103 Main Replacement Truman Road 50,000.00 490,502.00 540,502.00 6,332.00 - 534,170.00 402104 Lime Slaker No 5 - 350,000.00 350,000.00 - - 350,000.00 402105 Main Replacement Sheley - 100,000.00 100,000.00 4,100.00 - 95,900.00 402106 Main Replacement Sheley & Northern - 1,035,000.00 1,035,000.00 49,857.00 - 985,143.00 402107 Facility Improvements/Const/Maint - 250,000.00 250,000.00 - - 250,000.00 402108 Basin Drive Improvements 250,000.00 250,000.00 500,000.00 - - 500,000.00 402201 Roof Improvements 250,000.00 - 250,000.00 - - 250,000.00 402203 Lime Slaker No 1 350,000.00 - 350,000.00 - - 350,000.00 402207 CB Electrical Switchgear Improvemen 200,000.00 - 200,000.00 - - 200,000.00 9749 MAIN REPLACEMENT PROGRAM 1,745,000.00 793,907.19 2,538,907.19 59,357.42 - 2,479,549.77 9952 SECURITY UPGRADES 250,000.00 267,590.82 517,590.82 - - 517,590.82 $ 6,420,000.00 14,221,706.54 20,641,706.54 2,124,399.42 605,234.73 17,912,072.39 Current Year Prior Year Budget Budget (Enc Roll) Total Budget 19,559,709.81 $ 1,081,996.73 20,641,706.54 Less Expenditures 19,216.60 586,018.13 605,234.73 Less Encumbrances 1,634,920.82 489,478.60 2,124,399.42 Total Available 17,905,572.39 $ 6,500.00 17,912,072.39
of November 30, 2021 21
As
CITY OF INDEPENDENCE, MISSOURI Budgetary Comparison Schedule Sanitary Sewer
For the period ended November 30, 2021
Actual Variance Percent Percent Budgeted Amounts Amounts with Amended Actual From Original Amended (Budget Basis) Budget 41.67% of Year Budget Operating revenues: Charges for Services $ 35,151,285 35,151,285 15,521,139 (19,630,146) 44.16% 2.49% Penalties 200,000 200,000 159,771 (40,229) 79.89% 38.22% Total operating revenues 35,351,285 35,351,285 15,680,910 (19,670,375) 44.36% 2.69% Operating expenses: Personnel Services 6,672,780 6,672,780 2,362,300 4,310,480 35.40% -6.27% Other Services 13,843,955 13,718,955 3,929,815 9,789,140 28.65% -13.02% Supplies 1,222,200 1,349,808 412,736 937,072 30.58% -11.09% Capital Projects 3,925,000 15,487,758 697,484 14,790,274 4.50% -37.17% Capital Operating 424,500 421,892 321,697 100,195 76.25% 34.58% Debt Service 6,288,332 6,288,332 1,032,354 5,255,978 16.42% -25.25% Other Expenses 0.00% -41.67% Total Operating Expenses 32,376,767 43,939,525 8,756,386 35,183,139 19.93% -21.74% Nonoperating Revenues (Expenses): Investment Income 104,000 104,000 148,687 44,687 142.97% 101.30% Miscellaneous Revenue (Expense) 7,820 7,820 10,676 2,856 136.52% 94.85% Total Nonoperating Revenue (Expenses) 111,820 111,820 159,363 47,543 142.52% 100.85% 3,086,338 (8,476,420) 7,083,887 15,560,307 -83.57% -125.24% Transfers Out – Utility Payments In Lieu of Taxes (3,596,612) (3,596,612) (1,474,501) (2,122,111) 41.00% -0.67% Transfers In 10,000 10,000 10,000 100.00% 58.33% Transfers Out 0.00% -41.67% Total Transfers (3,586,612) (3,586,612) (1,464,501) (2,122,111) 40.83% -0.84% Excess of Revenue and Other Financing Sources Over (Under) Expenditures and Other Financing Uses, Budget Basis $ (500,274) (12,063,032) 5,619,386 17,682,418 Beginning Available Resources 26,265,638 Ending Available Resources 31,885,024 Revenue Risk 2,750,000 Capital Reserve 6,000,000 Expense Risk 400,000 Working Capital 7,400,000 Targeted Reserve Level 16,550,000 Total Non-Restricted Resources Available $ 15,335,024 Income (Loss) Before Transfers
22
Sanitary Sewer - Open Capital Projects
As of November 30, 2021
PROJECT PROJECT TITLE ORIGINAL BUDGET NET BUDGET AMENDMENTS REVISED BUDGET ENCUMBRANCES ACTUALS AVAILABLE BUDGET 300801 NEIGHBORHOOD PROJECTS $ - 574,405.94 574,405.94 452,267.71 86,755.18 35,383.05 301108 HOLDING BASINS AND PMP STATION - 694,045.55 694,045.55 - - 694,045.55 301201 BURR OAK EAST - 1,035,327.15 1,035,327.15 - - 1,035,327.15 301202 CRACKERNECK-VAN HOOK SEWER - 529,163.59 529,163.59 - - 529,163.59 301505 SEWAGE SLUDGE INCINERATOR IMP - 605,823.97 605,823.97 - - 605,823.97 301603 RCTP FACILITIES ROOF, CEILING - 170,925.00 170,925.00 - - 170,925.00 301604 PRIMARY SLUDGE GRINDERS & - 6,989.69 6,989.69 - - 6,989.69 301701 SCADA UPGRADE - 1,006,730.00 1,006,730.00 1,002.00 78,828.15 926,899.85 301703 ARROWHEAD CENTER - 551,675.62 551,675.62 110,591.89 310,521.81 130,561.92 301705 16TH/SCOTT - 357,780.55 357,780.55 5,390.10 - 352,390.45 301706 TREATMENT FACILITY IMPROVEMENT - 593,007.00 593,007.00 254,787.20 5,612.80 332,607.00 301707 NEIGHBORHOOD IMPROVE 17-18 - 82,650.24 82,650.24 7,606.50 - 75,043.74 301804 ROCK CREEK EFFLUENT STRUCTURE - 361,673.21 361,673.21 23,805.27 12,847.44 325,020.50 301806 Neighborhood Improvements 2018-19 - 442,262.68 442,262.68 4,381.81 - 437,880.87 302001 Fairmount Highlands - 170,000.00 170,000.00 - - 170,000.00 302002 Arlington Improvements - 100,000.00 100,000.00 - - 100,000.00 302003 Bison Park - 424,907.85 424,907.85 92.00 2,644.00 422,171.85 302004 Neighborhood Projects 2019-20 - 580,000.00 580,000.00 - - 580,000.00 302005 Biosolids Handling - 2,919,676.59 2,919,676.59 1,727,594.59 300,325.00 891,757.00 302006 Raw Pumps & Screening - 900,000.00 900,000.00 - - 900,000.00 302007 Electrical Substation Rehab - 158,690.00 158,690.00 - - 158,690.00 302008 RCTP Fence - 450,000.00 450,000.00 377,798.00 - 72,202.00 302009 Truman & Harris - 50,000.00 50,000.00 - - 50,000.00 302101 Sanitation Sewer Evaluation Survey - 199,303.60 199,303.60 52,581.63 53,557.12 93,164.85 302102 Raymond Harkless Mills San Imp - 200,000.00 200,000.00 - - 200,000.00 302103 Pump Station Imp & Maintenance 100,000.00 200,000.00 300,000.00 67,148.00 - 232,852.00 302104 Polymer System Relocation - 100,000.00 100,000.00 - - 100,000.00 302105 Piping Rehabilitation 200,000.00 200,000.00 400,000.00 26,792.50 - 373,207.50 302201 Upper Adair Interceptor 800,000.00 - 800,000.00 - - 800,000.00 302202 Crackerneck Creek Slope Rehab 1,100,000.00 - 1,100,000.00 - 5,600.00 1,094,400.00 302203 Sanitary Sewer Main Reloc from Stre 300,000.00 - 300,000.00 - - 300,000.00 302204 RCTP - Septic Pumper 300,000.00 - 300,000.00 - - 300,000.00 302205 Clarifier Rehabilitation 800,000.00 - 800,000.00 - - 800,000.00 302206 Railing Safety RCPS & SCPS 325,000.00 - 325,000.00 - - 325,000.00 9757 TRENCHLESS TECHNOLOGY - 1,555,740.96 1,555,740.96 245,223.10 141,751.50 1,168,766.36 $ 3,925,000.00 15,220,779.19 19,145,779.19 3,357,062.30 998,443.00 14,790,273.89 Current Year Prior Year Budget Budget (Enc Roll) Total Budget 15,487,758.04 $ 3,658,021.15 19,145,779.19 Less Expenditures 26,773.95 971,669.05 998,443.00 Less Encumbrances 670,710.20 2,686,352.10 3,357,062.30 Total Available 14,790,273.89 $ - 14,790,273.89
23
CITY OF INDEPENDENCE, MISSOURI Budgetary Comparison Schedule Events Center Debt Service For the period ended November 30, 2021
Actual Variance Percent Percent Budgeted Amounts Amounts with Amended Actual From Original Amended (Budget Basis) Budget 41.67% of Year Budget Operating revenues: Charges for Services $ 0.00% -41.67% Miscellaneous 0.00% -41.67% Total operating revenues 0.00% -41.67% Operating Expenses: Personnel Services 0.00% -41.67% Other Services 1,000 1,000 417 583 41.70% 0.03% Supplies 0.00% -41.67% Capital Outlay 3,120,150 4,525,245 1,425,992 3,099,253 31.51% -10.16% Debt Service 5,292,906 5,292,906 1,654,502 3,638,404 31.26% -10.41% Other Expenses 0.00% -41.67% Total Operating Expenses 8,414,056 9,819,151 3,080,911 6,738,240 31.38% -10.29% Nonoperating Revenues (Expenses): Investment Income 71,000 71,000 3,004 (67,996) 4.23% -37.44% Miscellaneous Revenue (Expense) 0.00% -41.67% Sales Tax 5,173,844 5,173,844 1,429,810 (3,744,034) 27.64% -14.03% Total Nonoperating Revenue (Expenses) 5,244,844 5,244,844 1,432,814 (3,812,030) 27.32% -14.35% (3,169,212) (4,574,307) (1,648,097) 2,926,210 36.03% -5.64% Transfers Out – Utility Payments In Lieu of Taxes 0.00% -41.67% Transfers In 75,000 75,000 1,402,688 (1,327,688) 1870.25% 1828.58% Transfers Out 0.00% -41.67% Total Transfers 75,000 75,000 1,402,688 (1,327,688) 1870.25% 1828.58% Excess of Revenue and Other Financing Sources Over (Under) Expenditures and Other Financing Uses, Budget Basis $ (3,094,212) (4,499,307) (245,409) 4,253,898 Unassigned Fund Balance at Beginning of Year (25,273,358) Cancellation of Prior Year Encumbrances Change in Other Fund Balance Components During the Year (1,815,476) Ending Unassigned Fund Balance, 11/30/21 (27,334,243) Restricted: Bond Reserve Project Accounts 6,849,447 Total restricted 6,849,447 Committed: Capital Projects In Process 3,099,253 Total Committed 3,099,253 Assigned: Prior Year Open Encumbrances - Excluding Capital Projects Current Year Open Encumbrances - Excluding Capital Projects Total Assigned Total Fund Balance $ (17,385,543) Income (Loss) Before Transfers
24
CITY OF INDEPENDENCE, MISSOURI Budgetary
Comparison Schedule
Central Garage
For the period ended November 30, 2021
Actual Variance Percent Percent Budgeted Amounts Amounts with Amended Actual From Original Amended (Budget Basis) Budget 41.67% of Year Budget Operating revenues: Charges for Services $ 2,206,668 2,306,668 1,017,008 (1,289,660) 44.09% 2.42% Miscellaneous 2,674 2,674 0.00% -41.67% Total Operating Revenues 2,206,668 2,306,668 1,019,682 (1,286,986) 44.21% 2.54% Operating Expenses: Personnel Services 852,345 852,345 321,188 531,157 37.68% -3.99% Other Services 538,628 538,628 612,720 (74,092) 113.76% 72.09% Supplies 787,055 787,055 775,607 11,448 98.55% 56.88% Capital Outlay 39,000 39,000 29,131 9,869 74.69% 33.02% Other Expenses 0.00% -41.67% Total Operating Expenses 2,217,028 2,217,028 1,738,646 478,382 78.42% 36.75% Nonoperating Revenues (Expenses): Investment Income 8,000 8,000 2,961 (5,039) 37.01% -4.66% Miscellaneous Revenue (Expense) 1,009 1,009 0.00% -41.67% Total Nonoperating Revenue (Expenses) 8,000 8,000 3,970 (4,030) 49.63% 7.96% (2,360) 97,640 (714,994) (812,634) -732.28% -773.95% Transfers Out – Utility Payments In Lieu of Taxes 0.00% -41.67% Transfers In 0.00% -41.67% Transfers Out 0.00% -41.67% Total Transfers 0.00% -41.67% Change In Net Position (Budget Basis) $ (2,360) 97,640 (714,994) (812,634) Unassigned Fund Balance at Beginning of Year (1,334,153) Cancellation of Prior Year Encumbrances 102,083 Change in Other Fund Balance Components During the Year (2,022) GAAP Components - OPEB and LAGERS 1,755,311 Ending Unassigned Fund Balance Non-GAAP Basis, 11/30/21 (193,775) Other Net Position Components: Assigned - Current Year Encumbrances 868,368 Assigned - Prior Year Encumbrances 191 Total Fund Balance $ 674,784 Income (Loss) Before Transfers
25
CITY OF INDEPENDENCE, MISSOURI Budgetary Comparison Schedule
Staywell Health Care
For the period ended November 30, 2021
Actual Variance Percent Percent Budgeted Amounts Amounts with Amended Actual From Original Amended (Budget Basis) Budget 41.67% of Year Budget Operating revenues: Charges for Services $ 15,500,000 15,500,000 7,922,100 (7,577,900) 51.11% 9.44% Miscellaneous 0.00% -41.67% Total Operating Revenues 15,500,000 15,500,000 7,922,100 (7,577,900) 51.11% 9.44% Operating Expenses: Personnel Services 187,200 187,200 10,440 176,760 5.58% -36.09% Other Services 19,166,120 19,166,120 9,780,808 9,385,312 51.03% 9.36% Supplies 0.00% -41.67% Capital Outlay 0.00% -41.67% Other Expenses 0.00% -41.67% Total Operating Expenses 19,353,320 19,353,320 9,791,248 9,562,072 50.59% 8.92% Nonoperating Revenues (Expenses): Investment Income 4,000 4,000 1,971 (2,029) 49.28% 7.61% Miscellaneous Revenue (Expense) 1,013,283 1,013,283 0.00% -41.67% Total Nonoperating Revenue (Expenses) 4,000 4,000 1,015,254 1,011,254 25381.35% 25339.68% (3,849,320) (3,849,320) (853,894) 2,995,426 22.18% -19.49% Transfers In - American Rescue Plan 2,350,000 (2,350,000) 0.00% -41.67% Transfers Out 0.00% -41.67% Total Transfers 2,350,000 (2,350,000) 0.00% -41.67% Change In Net Position (Budget Basis) $ (3,849,320) (3,849,320) 1,496,106 5,345,426 Unassigned Fund Balance at Beginning of Year 289,505 Cancellation of Prior Year Encumbrances Change in Other Fund Balance Components During the Year 135,720 Ending Unassigned Fund Balance Non-GAAP Basis, 11/30/21 1,921,331 Other Net Position Components: Assigned - Current Year Encumbrances 70,000 Assigned - Prior Year Encumbrances Total Fund Balance $ 1,991,331 Income (Loss) Before Transfers
26
CITY OF
MISSOURI Budgetary Comparison Schedule
INDEPENDENCE,
Workers' Compensation
For the period ended November 30, 2021
Actual Variance Percent Percent Budgeted Amounts Amounts with Amended Actual From Original Amended (Budget Basis) Budget 41.67% of Year Budget Operating revenues: Charges for Services $ 4,625,000 4,625,000 1,927,081 (2,697,919) 41.67% 0.00% Miscellaneous 129,049 129,049 0.00% -41.67% Total Operating Revenues 4,625,000 4,625,000 2,056,130 (2,568,870) 44.46% 2.79% Operating Expenses: Personnel Services 13,778 13,778 5,272 8,506 38.26% -3.41% Other Services 4,599,000 4,599,000 2,171,102 2,427,898 47.21% 5.54% Supplies 3,000 3,000 3,000 0.00% -41.67% Capital Outlay 2,000 2,000 2,000 0.00% -41.67% Other Expenses 0.00% -41.67% Total Operating Expenses 4,617,778 4,617,778 2,176,374 2,441,404 47.13% 5.46% Nonoperating Revenues (Expenses): Investment Income 2,303 2,303 0.00% -41.67% Miscellaneous Revenue (Expense) 5,790 5,790 0.00% -41.67% Total Nonoperating Revenue (Expenses) 8,093 8,093 0.00% -41.67% 7,222 7,222 (112,151) (119,373) -1552.91% -1594.58% Transfers In 0.00% -41.67% Transfers Out 0.00% -41.67% Total Transfers 0.00% -41.67% Change In Net Position (Budget Basis) $ 7,222 7,222 (112,151) (119,373) Unassigned Fund Balance at Beginning of Year (8,356,420) Cancellation of Prior Year Encumbrances Change in Other Fund Balance Components During the Year (198,698) Year-end investment market value adjustment Ending Unassigned Fund Balance Non-GAAP Basis, 11/30/21 (8,667,269) Other Net Position Components: Restricted - Work Comp Escrow Assigned - Current Year Encumbrances 121,669 Assigned - Prior Year Encumbrances 10,675 Total Fund Balance $ (8,534,925) Income (Loss) Before Transfers
27
CITY OF INDEPENDENCE, MISSOURI Budgetary Comparison Schedule Risk Management
For the period ended November 30, 2021
Actual Variance Percent Percent Budgeted Amounts Amounts with Amended Actual From Original Amended (Budget Basis) Budget 41.67% of Year Budget Operating revenues: Charges for Services $ 2,995,000 2,995,000 1,239,625 (1,755,375) 41.39% -0.28% Miscellaneous 0.00% -41.67% Total Operating Revenues 2,995,000 2,995,000 1,239,625 (1,755,375) 41.39% -0.28% Operating Expenses: Personnel Services 13,778 13,778 5,272 8,506 38.26% -3.41% Other Services 2,977,000 2,977,000 1,381,982 1,595,018 46.42% 4.75% Supplies 3,000 3,000 3,000 0.00% -41.67% Capital Outlay 0.00% -41.67% Other Expenses 0.00% -41.67% Total Operating Expenses 2,993,778 2,993,778 1,387,254 1,606,524 46.34% 4.67% Nonoperating Revenues (Expenses): Investment Income 10,212 10,212 0.00% -41.67% Miscellaneous Revenue (Expense) 0.00% -41.67% Total Nonoperating Revenue (Expenses) 10,212 10,212 0.00% -41.67% 1,222 1,222 (137,417) (138,639) -11245.25% -11286.92% Transfers Out – Utility Payments In Lieu of Taxes 0.00% -41.67% Transfers In 0.00% -41.67% Transfers Out 0.00% -41.67% Total Transfers 0.00% -41.67% Change In Net Position (Budget Basis) $ 1,222 1,222 (137,417) (138,639) Unassigned Fund Balance at Beginning of Year 1,345,764 Cancellation of Prior Year Encumbrances Change in Other Fund Balance Components During the Year Year-end investment market value adjustment Ending Unassigned Fund Balance Non-GAAP Basis, 11/30/21 1,208,347 Other Net Position Components: Assigned - Current Year Encumbrances 50,151 Assigned - Prior Year Encumbrances 7,382 Total Fund Balance $ 1,265,880 Income (Loss) Before Transfers
28
CITY OF INDEPENDENCE, MISSOURI
Budgetary Comparison Schedule
Enterprise Resource Planning
For the period ended November 30, 2021
Actual Variance Percent Percent Budgeted Amounts Amounts with Amended Actual From Original Amended (Budget Basis) Budget 41.67% of Year Budget Operating revenues: Charges for Services $ 2,200,000 2,200,000 916,667 (1,283,333) 41.67% 0.00% Miscellaneous 0.00% -41.67% Total Operating Revenues 2,200,000 2,200,000 916,667 (1,283,333) 41.67% 0.00% Operating Expenses: Personnel Services 655,218 655,218 232,787 422,431 35.53% -6.14% Other Services 1,147,200 1,147,200 59,159 1,088,041 5.16% -36.51% Supplies 0.00% -41.67% Capital Outlay 50,000 50,000 5,946 44,054 11.89% -29.78% Other Expenses 0.00% -41.67% Total Operating Expenses 1,852,418 1,852,418 297,892 1,554,526 16.08% -25.59% Nonoperating Revenues (Expenses): Investment Income 0.00% -41.67% Miscellaneous Revenue (Expense) 0.00% -41.67% Total Nonoperating Revenue (Expenses) 0.00% -41.67% 347,582 347,582 618,775 271,193 178.02% 136.35% Transfers Out – Utility Payments In Lieu of Taxes 0.00% -41.67% Transfers In – CARES Act 0.00% -41.67% Transfers Out 0.00% -41.67% Total Transfers 0.00% -41.67% Change In Net Position (Budget Basis) $ 347,582 347,582 618,775 271,193 Unassigned Fund Balance at Beginning of Year 1,350,925 Cancellation of Prior Year Encumbrances Change in Other Fund Balance Components During the Year GAAP Components - OPEB and LAGERS (45,193) Ending Unassigned Fund Balance Non-GAAP Basis, 11/30/21 1,924,507 Other Net Position Components: Assigned - Current Year Encumbrances 35,751 Assigned - Prior Year Encumbrances 106,525 Total Fund Balance $ 2,066,783 Income (Loss) Before Transfers
29
CITY OF INDEPENDENCE, MISSOURI Budgetary Comparison
Actual Variance Percent Percent Budgeted Amounts Amounts with Final Actual From Original Amended (Budget Basis) Budget 41.67% of Year Budget Revenues: Charges for Services $ 9,289 9,289 (9,289) 0.00% -41.67% Investment Income (Loss) 200 200 112 (88) 56.00% 14.33% Other Revenue 0.00% -41.67% Total Revenues 9,489 9,489 112 (9,377) 1.18% -40.49% Expenditures: General Government 0.00% -41.67% Debt Service 9,586 9,586 1,085 8,501 11.32% -30.35% Total Expenditures 9,586 9,586 1,085 8,501 11.32% -30.35% Other Financing Uses: Transfers Out/Capital Outlay 0.00% -41.67% Total Other Financing Uses 0.00% -41.67% Total expenditures and other financing uses 9,586 9,586 1,085 8,501 11.32% -30.35% Excess of Revenues Over (Under) Expenditures and Other Financing Uses, Budget Basis $ (97) (97) (973) (876) Unassigned Fund Balance at Beginning of Year 106,985 Cancellation of Prior Year Encumbrances Change in Other Fund Balance Components During the Year Year-End Investment Market Value Adjustment Ending Unassigned Fund Balance, 11/30/21 106,012 Other Fund Balance Components: Restricted - Current Year Encumbrances Restricted - Prior Year Encumbrances Total Fund Balance $ 106,012
Debt Service - Neighborhood Improvement Districts For the period ended November 30, 2021 30
Schedule
Actual Variance Percent Percent Budgeted Amounts Amounts with Final Actual From Original Amended (Budget Basis) Budget 41.67% of Year Budget Revenues: Charges for Services $ 1,884 1,884 0.00% -41.67% Investment Income 2,000 2,000 328 (1,672) 16.40% -25.27% Intergovernmental 0.00% -41.67% Other Revenue 0.00% -41.67% Total Revenues 2,000 2,000 2,212 212 110.60% 68.93% Other Financing Sources: Transfers In 0.00% -41.67% Total Other Financing Sources 0.00% -41.67% Total Revenues and Other Financing Sources 2,000 2,000 2,212 212 110.60% 68.93% Expenditures: Public Works 0.00% -41.67% Culture and Recreation 0.00% -41.67% Capital Outlay 124,236 6,760 117,476 5.44% -36.23% Total Expenditures 124,236 6,760 117,476 5.44% -36.23% Other Financing Uses: Transfers Out/Capital Outlay 0.00% -41.67% Total Other Financing Uses 0.00% -41.67% Total Expenditures and Other Financing Uses 124,236 6,760 117,476 5.44% -36.23% Excess of Revenues Over (Under) Expenditures and Other Financing Uses, Budget Basis $ 2,000 (122,236) (4,548) 117,688 Unassigned Fund Balance at Beginning of Year (137,026) Cancellation of Prior Year Encumbrances Change in Other Fund Balance Components During the Year Year-End Investment Market Value Adjustment Ending Unassigned Fund Balance, 11/30/21 (141,574) Other Fund Balance Components: Committed - Current Year Encumbrances Committed - Prior Year Encumbrances 133,926 Total Fund Balance $ (7,648)
Comparison Schedule
Street Improvements Capital Project Fund For the period ended November 30, 2021 31
Budgetary
CITY OF INDEPENDENCE, MISSOURI
CITY OF INDEPENDENCE, MISSOURI Budgetary Comparison Schedule Revolving Public Improvements Capital Project Fund For the period ended November 30, 2021
Actual Variance Percent Percent Budgeted Amounts Amounts with Final Actual From Original Amended (Budget Basis) Budget 41.67% of Year Budget Revenues: Charges for Services $ 0.00% -41.67% Investment Income (Loss) 162 162 0.00% -41.67% Other Revenue 0.00% -41.67% Total Revenues 162 162 0.00% -41.67% Expenditures: Public Works 0.00% -41.67% Culture and Recreation 0.00% -41.67% Capital Outlay 0.00% -41.67% Total Expenditures 0.00% -41.67% Other Financing Uses: Transfers Out/Capital Outlay 0.00% -41.67% Total Other Financing Uses 0.00% -41.67% Total Expenditures and Other Financing Uses 0.00% -41.67% Excess of Revenues Over (Under) Expenditures and Other Financing Uses, Budget Basis $ 162 162 Unassigned Fund Balance at Beginning of Year 21,613 Cancellation of Prior Year Encumbrances Change in Other Fund Balance Components During the Year Year-End Investment Market Value Adjustment Ending Unassigned Fund Balance, 11/30/21 21,775 Other Fund Balance Components: Committed - Current Year Encumbrances Committed - Prior Year Encumbrances Total Fund Balance $ 21,775
32
CITY OF INDEPENDENCE, MISSOURI Budgetary Comparison Schedule Buildings and Other Improvements Capital Project Fund For the period ended November 30, 2021
Actual Variance Percent Percent Budgeted Amounts Amounts with Final Actual From Original Amended (Budget Basis) Budget 41.67% of Year Budget Revenues: Charges for Services $ 0.00% -41.67% Investment Income 1,857 1,857 0.00% -41.67% Other Revenue 100,800 100,800 100,800 100.00% 58.33% Total revenues 100,800 100,800 102,657 1,857 101.84% 60.17% Other Financing Sources: Transfers In 0.00% -41.67% Total Other Financing Sources 0.00% -41.67% Total Revenues and Other Financing Sources 100,800 100,800 102,657 1,857 101.84% 60.17% Expenditures: Public Works 0.00% -41.67% Culture and Recreation 0.00% -41.67% Capital Outlay 506,900 783,998 26,792 757,206 3.42% -38.25% Total Expenditures 506,900 783,998 26,792 757,206 0.00% -41.67% Other Financing Uses: Transfers Out/Capital Outlay 0.00% -41.67% Total Other Financing Uses 0.00% -41.67% Total expenditures and other financing uses 506,900 783,998 26,792 757,206 3.42% -38.25% Excess of Revenues Over (Under) Expenditures and Other Financing Uses, Budget Basis $ (406,100) (683,198) 75,865 759,063 Unassigned Fund Balance at Beginning of Year (701,084) Cancellation of Prior Year Encumbrances Change in Other Fund Balance Components During the Year Year-End Investment Market Value Adjustment Ending Unassigned Fund Balance, 11/30/21 (625,219) Other Fund Balance Components: Committed - Current Year Encumbrances 26,792 Committed - Prior Year Encumbrances 572,663 Total Fund Balance $ (25,764)
33
Actual Variance Percent Percent Budgeted Amounts Amounts with Final Actual From Original Amended (Budget Basis) Budget 41.67% of Year Budget Revenues: Charges for Services $ 0.00% -41.67% Investment Income 0.00% -41.67% Other Revenue 0.00% -41.67% Total revenues 0.00% -41.67% Expenditures: Public Works 0.00% -41.67% Culture and Recreation 0.00% -41.67% Capital Outlay 0.00% -41.67% Total Expenditures 0.00% -41.67% Other Financing Uses: Transfers Out/Capital Outlay 0.00% -41.67% Total Other Financing Uses 0.00% -41.67% Total expenditures and other financing uses 0.00% -41.67% Excess of Revenues Over (Under) Expenditures and Other Financing Uses, Budget Basis $ Unassigned Fund Balance at Beginning of Year (16,155) Cancellation of Prior Year Encumbrances Change in Other Fund Balance Components During the Year Ending Unassigned Fund Balance, 11/30/21 (16,155) Fund Balance Components: Committed - Current Year Encumbrances Committed - Prior Year Encumbrances Total Fund Balance $ (16,155) CITY OF INDEPENDENCE, MISSOURI Budgetary Comparison Schedule Storm Drainage Capital Project Fund For the period ended November 30, 2021 34
CITY OF INDEPENDENCE, MISSOURI Budgetary Comparison Schedule Park Improvements Capital Project Fund For the period ended November 30, 2021
Actual Variance Percent Percent Budgeted Amounts Amounts with Final Actual From Original Amended (Budget Basis) Budget 41.67% of Year Budget Revenues: Charges for Services $ 0.00% -41.67% Investment Income (Loss) 243 243 0.00% -41.67% Other Revenue 0.00% -41.67% Total revenues 243 243 0.00% -41.67% Expenditures: Public Works 0.00% -41.67% Culture and Recreation 0.00% -41.67% Capital Outlay 0.00% -41.67% Total Expenditures 0.00% -41.67% Other Financing Uses: Transfers Out/Capital Outlay 0.00% -41.67% Total Other Financing Uses 0.00% -41.67% Total expenditures and other financing uses 0.00% -41.67% Excess of Revenues Over (Under) Expenditures and Other Financing Uses, Budget Basis $ 243 243 Unassigned Fund Balance at Beginning of Year 31,479 Cancellation of Prior Year Encumbrances Change in Other Fund Balance Components During the Year Year-End Investment Market Value Adjustment Ending Unassigned Fund Balance, 11/30/21 31,722 Fund Balance Components: Committed - Current Year Encumbrances Committed - Prior Year Encumbrances Total Fund Balance $ 31,722
35
CITY OF INDEPENDENCE, MISSOURI Budgetary Comparison Schedule
Actual Variance Percent Percent Budgeted Amounts Amounts with Final Actual From Original Amended (Budget Basis) Budget 41.67% of Year Budget Revenues: Charges for Services $ 10,500 10,500 (10,500) 0.00% -41.67% Investment Income 36 36 0.00% -41.67% Other Revenue 0.00% -41.67% Total Revenues 10,500 10,500 36 (10,464) 0.34% -41.33% Expenditures: Public Works 0.00% -41.67% Culture and Recreation 10,310 10,310 3,195 7,115 30.99% -10.68% Capital Outlay 0.00% -41.67% Total Expenditures 10,310 10,310 3,195 7,115 30.99% -10.68% Other Financing Uses: Transfers Out/Capital Outlay 0.00% -41.67% Total Other Financing Uses 0.00% -41.67% Total Expenditures and Other Financing Uses 10,310 10,310 3,195 7,115 30.99% -10.68% Excess of revenues over (under) expenditures and Other Financing Uses, Budget Basis $ 190 190 (3,159) (3,349) Unassigned Net Position at Beginning of Year 903 Cancellation of Prior Year Encumbrances Change in Other Fund Balance Components During the Year Year-End Investment Market Value Adjustment Unassigned Net Position, 11/30/21 (2,256) Other Net Position Components: Committed - Current Year Encumbrances Committed - Prior Year Encumbrances Total Net Position $ (2,256)
Private Purpose Expendable Trust Fund - Vaile Mansion For the period ended November 30, 2021 36
CITY OF INDEPENDENCE, MISSOURI Budgetary Comparison Schedule Independence Events Center CID
For the period ended November 30, 2021
Actual Variance Percent Percent Budgeted Amounts Amounts with Final Actual From Original Amended (Budget Basis) Budget 41.67% of Year Budget Revenues: Sales Taxes $ 8,106,070 8,106,070 2,944,767 (5,161,303) 36.33% -5.34% Investment Income 75,000 75,000 8,244 (66,756) 10.99% -30.68% Total Revenues 8,181,070 8,181,070 2,953,011 (5,228,059) 36.10% -5.57% Expenditures: Administrative Fee 162,121 162,121 58,895 103,226 36.33% -5.34% Insurance 2,150 2,150 3,169 (1,019) 147.40% 105.73% Legal 55,300 55,300 55,300 0.00% -41.67% Audit 5,500 5,500 5,300 200 96.36% 54.69% Banking 6,500 6,500 4,060 2,440 62.46% 20.79% Contract Services 0.00% -41.67% Capital Outlay 0.00% -41.67% Other 0.00% -41.67% Total Expenditures 231,571 231,571 71,424 160,147 30.84% -10.83% Other Financing Uses: Transfers Out - EATS (1,175,000) (1,175,000) (227,411) (947,589) 19.35% -22.32% Transfers Out - Debt Service (City) (4,205,456) (4,205,456) (1,202,398) (3,003,058) 28.59% -13.08% Transfers Out - Captial Projects (3,120,150) (3,120,150) (1,402,688) (1,717,462) 44.96% 3.29% Total Other Financing Uses (8,500,606) (8,500,606) (2,832,497) (5,668,109) 33.32% -8.35% Excess of Revenue and Other Financing Sources Over (Under) Expenditures and Other Financing Uses, Budget Basis $ (551,107) (551,107) 49,090 600,197 Unassigned Fund Balance at Beginning of Year 9,171,998 Cancellation of Prior Year Encumbrances Change in Other Fund Balance Components During the Year Unassigned Ending Fund Balance, 11/30/21 9,221,088 Other Fund Balance Components: Restricted - current year encumbrances 5,300 Restricted - prior year encumbrances 300,000 Total Fund Balance $ 9,526,388
37
Actual Variance Percent Percent Budgeted Amounts Amounts with Final Actual From Original Amended (Budget Basis) Budget 41.67% of Year Budget Revenues: Sales taxes $ 467,996 467,996 177,824 (290,172) 38.00% -3.67% Investment income 300 300 120 (180) 40.00% -1.67% Total revenues 468,296 468,296 177,944 (290,352) 38.00% -3.67% Expenditures: Administrative fee 9,360 9,360 3,556 5,804 37.99% -3.68% Insurance 2,150 2,150 896 1,254 41.67% 0.00% Legal 0.00% -41.67% Audit 5,500 5,500 5,300 200 96.36% 54.69% Banking 350 350 171 179 48.86% 7.19% Contract services 850 850 850 0.00% -41.67% Capital outlay 0.00% -41.67% Other 0.00% -41.67% Total expenditures 18,210 18,210 9,923 8,287 54.49% 12.82% Other financing uses: Transfers out - EATS (233,998) (233,998) (88,912) (145,086) 38.00% -3.67% Transfers out - Debt Service (City) (215,000) (215,000) (160,000) (55,000) 74.42% 32.75% Total other financing uses (448,998) (448,998) (248,912) (200,086) 55.44% 13.77% Excess of Revenue and Other Financing Sources Over (Under) Expenditures and Other Financing Uses, Budget Basis $ 1,088 1,088 (80,891) (81,979) Unassigned Fund Balance at Beginning of Year 137,827 Cancellation of Prior Year Encumbrances Change in Other Fund Balance Components During the Year (223) Unassigned Ending Fund Balance, 11/30/21 56,713 Other Fund Balance Components: Restricted - Current Year Encumbrances 5,300 Restricted - Prior Year Encumbrances Restricted - City Transportation 6,675 Total Fund Balance $ 68,688
TDD
38
CITY OF INDEPENDENCE, MISSOURI Budgetary Comparison Schedule Crackerneck
Creek
For the period ended November 30, 2021
CITY OF INDEPENDENCE, MISSOURI Budgetary Comparison Schedule Tax Increment Financing Summary For the Period Ended November 30, 2021
Actual Variance Percent Percent Budgeted Amounts Amounts with Final Actual From Original Amended (Budget Basis) Budget 41.67% of Year Budget Revenues: Taxes $ 15,970,917 15,970,917 13,278,935 (2,778,172) 83.14% 41.47% Investment Income (Loss) 294,000 294,000 178,396 (115,606) 60.68% 19.01% Other revenue 1,310,958 1,310,958 412,619 (898,339) 31.47% -10.20% Total Revenues 17,575,875 17,575,875 13,869,950 (3,792,117) 78.91% 37.24% Other Financing Sources: Transfers In 1,327,471 1,327,471 227,412 (1,100,059) 17.13% -24.54% Total Other Financing Sources 1,327,471 1,327,471 227,412 (1,100,059) 17.13% -24.54% Total Revenues and Other Financing Sources 18,903,346 18,903,346 14,097,362 (4,892,176) 74.58% 32.91% Expenditures: Tax Increment Financing 2,171,231 2,171,231 58,168 2,113,063 2.68% -38.99% Debt Service Principal 9,423,109 9,423,109 231,971 9,191,138 2.46% -39.21% Interest and Fiscal Agent Fees 5,082,094 5,082,094 2,237,464 2,844,630 44.03% 2.36% Debt Issuance Costs 0.00% -41.67% Total Expenditures 16,676,434 16,676,434 2,527,603 14,148,831 15.16% -26.51% Other Financing Uses: Issuance of Debt 0.00% -41.67% Reoffering Premium/Original Issue Discount 0.00% -41.67% Payment to Refund Loans Escrow Agent 0.00% -41.67% Transfers Out 227,412 (227,412) 0.00% -41.67% Total Other Financing Uses 227,412 (227,412) 0.00% -41.67% Total Expenditures and Other Financing Uses 16,676,434 16,676,434 2,755,015 13,921,419 16.52% -25.15% Excess of Revenues Over (Under) Expenditures and other financing uses $ 2,226,912 2,226,912 11,342,347 9,115,435 Unassigned Fund Balance at Beginning of Year 19,666,053 Cancellation of Prior Year Encumbrances Change in Other Fund Balance Components During the Year Year-End Investment Market Value Adjustment Unassigned Ending Fund Balance, 11/30/21 31,008,400 Other Fund Balance Components: Restricted - Current Year Encumbrances Restricted - Prior Year Encumbrances 15,226 Restricted - Trust Debt Service 26,406,785 Total Fund Balance $ 57,430,411
39
CITY OF INDEPENDENCE, MISSOURI Budgetary Comparison Schedule
Mid-Town Truman Rd TIF
For the Period Ended November 30, 2021
Actual Variance Percent Percent Budgeted Amounts Amounts with Final Actual From Original Amended (Budget Basis) Budget 41.67% of Year Budget Revenues: Taxes $ 0.00% -41.67% Investment Income (Loss) 12 12 0.00% -41.67% Other Revenue 0.00% -41.67% Total Revenues 12 12 0.00% -41.67% Expenditures: Tax Increment Financing 0.00% -41.67% Debt Service Principal 0.00% -41.67% Interest and Fiscal Agent Fees 0.00% -41.67% Debt Issuance Costs 0.00% -41.67% Total Expenditures 0.00% -41.67% Other Financing Uses: Issuance of Debt 0.00% -41.67% Reoffering Premium/Original Issue Discount 0.00% -41.67% Payment to Refund Loans Escrow Agent 0.00% -41.67% Transfers Out 0.00% -41.67% Total Other Financing Uses 0.00% -41.67% Total Expenditures and Other Financing Uses 0.00% -41.67% Excess of Revenues Over (Under) Expenditures and Other Financing Uses $ 12 12 Unassigned Fund Balance at Beginning of Year 1,574 Cancellation of Prior Year Encumbrances Change in Other Fund Balance Components During the Year Year-End Investment Market Value Adjustment Unassigned Ending Fund Balance, 11/30/21 1,586 Other Fund Balance Components: Restricted - Current Year Encumbrances Restricted - Prior Year Encumbrances Restricted - Trust Debt Service Total Fund Balance $ 1,586
40
CITY OF INDEPENDENCE, MISSOURI Budgetary Comparison Schedule
Santa Fe TIF
For the Period Ended November 30, 2021
Actual Variance Percent Percent Budgeted Amounts Amounts with Final Actual From Original Amended (Budget Basis) Budget 41.67% of Year Budget Revenues: Taxes $ 26,271 26,271 36,048 9,777 137.22% 95.55% Investment Income (Loss) 1,294 1,294 0.00% -41.67% Other Revenue 102,958 102,958 46,092 (56,866) 44.77% 3.10% Total Revenues 129,229 129,229 83,434 (45,795) 64.56% 22.89% Other Financing Sources: Transfers In 187,942 187,942 (187,942) 0.00% -41.67% Total Other Financing Sources 187,942 187,942 (187,942) 0.00% -41.67% Total Revenues and Other Financing Sources 317,171 317,171 83,434 (233,737) 26.31% -15.36% Expenditures: Tax Increment Financing 7,801 7,801 2,500 5,301 32.05% -9.62% Debt Service Principal 205,000 205,000 100,000 105,000 48.78% 7.11% Interest and Fiscal Agent Fees 327,938 327,938 164,806 163,132 50.26% 8.59% Debt Issuance Costs 0.00% -41.67% Total Expenditures 540,739 540,739 267,306 273,433 49.43% 7.76% Other Financing Uses: Issuance of Debt 0.00% -41.67% Reoffering Premium/Original Issue Discount 0.00% -41.67% Payment to Refund Loans Escrow Agent 0.00% -41.67% Transfers Out 0.00% -41.67% Total Other Financing Uses 0.00% -41.67% Total Expenditures and Other Financing Uses 540,739 540,739 267,306 273,433 49.43% 7.76% Excess of Revenues Over (Under) Expenditures and Other Financing Uses $ (223,568) (223,568) (183,872) 39,696 Unassigned Fund Balance at Beginning of Year (1,115,449) Cancellation of Prior Year Encumbrances Change in Other Fund Balance Components During the Year Unassigned Ending Fund Balance, 11/30/21 (1,299,321) Other Fund Balance Components: Restricted - Current Year Encumbrances Restricted - Prior Year Encumbrances Restricted - Trust Debt Service 557,832 Total Fund Balance $ (741,489)
41
CITY OF INDEPENDENCE, MISSOURI Budgetary Comparison Schedule
Actual Variance Percent Percent Budgeted Amounts Amounts with Final Actual From Original Amended (Budget Basis) Budget 41.67% of Year Budget Revenues: Taxes $ 1,446,920 1,446,920 163,347 (1,283,573) 11.29% -30.38% Investment Income (Loss) 0.00% -41.67% Other Revenue 0.00% -41.67% Total Revenues 1,446,920 1,446,920 163,347 (1,283,573) 11.29% -30.38% Other Financing Sources: Transfers In 118,097 118,097 35,687 (82,410) 30.22% -11.45% Total Other Financing Sources 118,097 118,097 35,687 (82,410) 30.22% -11.45% Total Revenues and Other Financing Sources 1,565,017 1,565,017 199,034 (1,365,983) 12.72% -28.95% Expenditures: Tax Increment Financing 121,261 121,261 1,284 119,977 1.06% -40.61% Debt Service Principal 0.00% -41.67% Interest and Fiscal Agent Fees 0.00% -41.67% Debt Issuance Costs 0.00% -41.67% Total Expenditures 121,261 121,261 1,284 119,977 1.06% -40.61% Other Financing Uses: Issuance of Debt 0.00% -41.67% Reoffering Premium/Original Issue Discount 0.00% -41.67% Payment to Refund Loans Escrow Agent 0.00% -41.67% Transfers Out 35,687 (35,687) 0.00% -41.67% Total Other Financing Uses 35,687 (35,687) 0.00% -41.67% Total Expenditures and Other Financing Uses 121,261 121,261 36,971 84,290 30.49% -11.18% Excess of Revenues Over (Under) Expenditures and Other Financing Uses $ 1,443,756 1,443,756 162,063 (1,281,693) Unassigned Fund Balance at Beginning of Year (2,999,627) Cancellation of Prior Year Encumbrances Change in Other Fund Balance Components During the Year Unassigned Ending Fund Balance, 11/30/21 (2,837,564) Other Fund Balance Components: Restricted - Current Year Encumbrances Restricted - Prior Year Encumbrances Restricted - Trust Debt Service Total Fund Balance $ (2,837,564)
Heritage TIF
the Period Ended November
42
Hartman
For
30, 2021
CITY OF INDEPENDENCE, MISSOURI Budgetary Comparison Schedule
Drumm Farm TIF
For the Period Ended November 30, 2021
Actual Variance Percent Percent Budgeted Amounts Amounts with Final Actual From Original Amended (Budget Basis) Budget 41.67% of Year Budget Revenues: Taxes $ 568,730 568,730 6,412 (562,318) 1.13% -40.54% Investment Income (Loss) 25,000 25,000 12,131 (12,869) 48.52% 6.85% Other Revenue 0.00% -41.67% Total Revenues 593,730 593,730 18,543 (575,187) 3.12% -38.55% Expenditures: Tax Increment Financing 15,338 15,338 2,500 12,838 16.30% -25.37% Debt Service Principal 415,000 415,000 415,000 0.00% -41.67% Interest and Fiscal Agent Fees 12,450 12,450 12,450 0.00% -41.67% Debt Issuance Costs 0.00% -41.67% Total Expenditures 442,788 442,788 2,500 440,288 0.56% -41.11% Other Financing Uses: Issuance of Debt 0.00% -41.67% Reoffering Premium/Original Issue Discount 0.00% -41.67% Payment to Refund Loans Escrow Agent 0.00% -41.67% Transfers Out 0.00% -41.67% Total Other Financing Uses 0.00% -41.67% Total Expenditures and Other Financing Uses 442,788 442,788 2,500 440,288 0.56% -41.11% Excess of Revenues Over (Under) Expenditures and Other Financing Uses $ 150,942 150,942 16,043 (134,899) Unassigned Fund Balance at Beginning of Year 1,579,935 Cancellation of Prior Year Encumbrances Change in Other Fund Balance Components During the Year Year-End Investment Market Value Adjustment Unassigned Ending Fund Balance, 11/30/21 1,595,978 Other Fund Balance Components: Restricted - Current Year Encumbrances Restricted - Prior Year Encumbrances Restricted - Trust Debt Service Total Fund Balance $ 1,595,978
43
CITY OF INDEPENDENCE, MISSOURI Budgetary Comparison Schedule
Eastland TIF
For the Period Ended November 30, 2021
Actual Variance Percent Percent Budgeted Amounts Amounts with Final Actual From Original Amended (Budget Basis) Budget 41.67% of Year Budget Revenues: Taxes $ 5,053,492 5,053,492 3,947,269 (1,106,223) 78.11% 36.44% Investment Income (Loss) 165,000 165,000 108,551 (56,449) 65.79% 24.12% Other Revenue 0.00% -41.67% Total Revenues 5,218,492 5,218,492 4,055,820 (1,162,672) 77.72% 36.05% Other Financing Sources: Transfers In 664,783 664,783 176,993 (487,790) 26.62% -15.05% Total Other Financing Sources 664,783 664,783 176,993 (487,790) 26.62% -15.05% Total Revenues and Other Financing Sources 5,883,275 5,883,275 4,232,813 (1,650,462) 71.95% 30.28% Expenditures: Tax Increment Financing 457,612 457,612 1,875 455,737 0.41% -41.26% Debt Service Principal 3,980,000 3,980,000 3,980,000 0.00% -41.67% Interest and Fiscal Agent Fees 57,000 57,000 80,500 (23,500) 141.23% 99.56% Debt Issuance Costs 0.00% -41.67% Total Expenditures 4,494,612 4,494,612 82,375 4,412,237 1.83% -39.84% Other Financing Uses: Issuance of Debt 0.00% -41.67% Reoffering Premium/Original Issue Discount 0.00% -41.67% Payment to Refund Loans Escrow Agent 0.00% -41.67% Transfers Out 176,993 (176,993) 0.00% -41.67% Total Other Financing Uses 176,993 (176,993) 0.00% -41.67% Total Expenditures and Other Financing Uses 4,494,612 4,494,612 259,368 4,235,244 5.77% -35.90% Excess of Revenues Over (Under) Expenditures and Other Financing Uses $ 1,388,663 1,388,663 3,973,445 2,584,782 Unassigned Fund Balance at Beginning of Year 15,004,007 Cancellation of Prior Year Encumbrances Change in Other Fund Balance Components During the Year Year-End Investment Market Value Adjustment Unassigned Ending Fund Balance, 11/30/21 18,977,452 Other Fund Balance Components: Restricted - Current Year Encumbrances Restricted - Prior Year Encumbrances Restricted - Trust Debt Service 897,682 Total Fund Balance $ 19,875,134
44
CITY OF INDEPENDENCE, MISSOURI Budgetary Comparison Schedule North Independence TIF
For the Period Ended November 30, 2021
Actual Variance Percent Percent Budgeted Amounts Amounts with Final Actual From Original Amended (Budget Basis) Budget 41.67% of Year Budget Revenues: Taxes $ 57,965 57,965 37,728 (20,237) 65.09% 23.42% Investment Income (Loss) 1 1 0.00% -41.67% Other Revenue 0.00% -41.67% Total Revenues 57,965 57,965 37,729 (20,236) 65.09% 23.42% Expenditures: Tax Increment Financing 1,645 1,645 1,645 0.00% -41.67% Debt Service Principal 10,000 10,000 10,000 0.00% -41.67% Interest and Fiscal Agent Fees 45,530 45,530 7,700 37,830 16.91% -24.76% Debt Issuance Costs 0.00% -41.67% Total Expenditures 57,175 57,175 7,700 49,475 13.47% -28.20% Other Financing Uses: Issuance of Debt 0.00% -41.67% Reoffering Premium/Original Issue Discount 0.00% -41.67% Payment to Refund Loans Escrow Agent 0.00% -41.67% Transfers Out 0.00% -41.67% 0.00% -41.67% Total Other Financing Uses 0.00% -41.67% Total Expenditures and Other Financing Uses 57,175 57,175 7,700 49,475 13.47% -28.20% Excess of Revenues Over (Under) Expenditures and Other Financing Uses $ 790 790 30,029 29,239 Unassigned Fund Balance at Beginning of Year 11,934 Cancellation of Prior Year Encumbrances Change in Other Fund Balance Components During the Year Unassigned Ending Fund Balance, 11/30/21 41,963 Other Fund Balance Components: Restricted - Current Year Encumbrances Restricted - Prior Year Encumbrances Restricted - Trust Debt Service Total Fund Balance $ 41,963
45
CITY
MISSOURI
For the Period Ended November 30, 2021
Actual Variance Percent Percent Budgeted Amounts Amounts with Final Actual From Original Amended (Budget Basis) Budget 41.67% of Year Budget Revenues: Taxes $ 2,179 2,179 2,101 (78) 96.42% 54.75% Investment Income (Loss) 1,000 1,000 371 (629) 37.10% -4.57% Other Revenue 0.00% -41.67% Total Revenues 3,179 3,179 2,472 (707) 77.76% 36.09% Other Financing Sources: Transfers In 0.00% -41.67% Capital lease proceeds 0.00% Total Other Financing Sources 0.00% -41.67% Total Revenues and Other Financing Sources 3,179 3,179 2,472 (707) 77.76% 36.09% Expenditures: Tax Increment Financing 63 63 63 0.00% -41.67% Debt Service Principal 0.00% -41.67% Interest and Fiscal Agent Fees 0.00% -41.67% Debt Issuance Costs 0.00% -41.67% Total Expenditures 63 63 63 0.00% -41.67% Other Financing Uses: Issuance of Debt 0.00% -41.67% Reoffering Premium/Original Issue Discount 0.00% -41.67% Payment to Refund Loans Escrow Agent 0.00% -41.67% Transfers Out 0.00% -41.67% Total Other Financing Uses 0.00% -41.67% Total Expenditures and Other Financing Uses 63 63 63 0.00% -41.67% Excess of Revenues Over (Under) Expenditures and Other Financing Uses $ 3,116 3,116 2,472 (644) Unassigned Fund Balance at Beginning of Year 49,447 Cancellation of Prior Year Encumbrances Change in Other Fund Balance Components During the Year Year-End Investment Market Value Adjustment Unassigned Ending Fund Balance, 11/30/21 51,919 Other Fund Balance Components: Restricted - Current Year Encumbrances Restricted - Prior Year Encumbrances Restricted - Trust Debt Service Total Fund Balance $ 51,919
Washington
OF INDEPENDENCE,
Budgetary Comparison Schedule Mt
TIF
46
CITY OF INDEPENDENCE, MISSOURI Budgetary Comparison Schedule
Crackerneck Creek TIF
For the Period Ended November 30, 2021
Actual Variance Percent Percent Budgeted Amounts Amounts with Final Actual From Original Amended (Budget Basis) Budget 41.67% of Year Budget Revenues: Taxes $ 1,589,201 1,589,201 918,771 (670,430) 57.81% 16.14% Investment Income (Loss) 77,000 77,000 15,221 (61,779) 19.77% -21.90% Other Revenue 1,208,000 1,208,000 366,527 (841,473) 30.34% -11.33% Total Revenues 2,874,201 2,874,201 1,300,519 (1,573,682) 45.25% 3.58% Other Financing Sources: Transfers In 315,000 315,000 (315,000) 0.00% -41.67% Total Other Financing Sources 315,000 315,000 (315,000) 0.00% -41.67% Total Revenues and Other Financing Sources 3,189,201 3,189,201 1,300,519 (1,888,682) 40.78% -0.89% Expenditures: Tax Increment Financing 48,817 48,817 3,159 45,658 6.47% -35.20% Debt Service Principal 50,000 50,000 50,000 0.00% -41.67% Interest and Fiscal Agent Fees 3,775,226 3,775,226 1,261,244 2,513,982 33.41% -8.26% Debt Issuance Costs 0.00% -41.67% Total Expenditures 3,874,043 3,874,043 1,264,403 2,609,640 32.64% -9.03% Other Financing Uses: Issuance of Debt 0.00% -41.67% Reoffering Premium/Original Issue Discount 0.00% -41.67% Payment to Refund Loans Escrow Agent 0.00% -41.67% Transfers Out 0.00% -41.67% Total Other Financing Uses 0.00% -41.67% Total Expenditures and Other Financing Uses 3,874,043 3,874,043 1,264,403 2,609,640 32.64% -9.03% Excess of Revenues Over (Under) Expenditures and Other Financing Uses $ (684,842) (684,842) 36,116 720,958 Unassigned Fund Balance at Beginning of Year 4,520,449 Cancellation of Prior Year Encumbrances Change in Other Fund Balance Components During the Year Year-End Investment Market Value Adjustment Unassigned Ending Fund Balance, 11/30/21 4,556,565 Other Fund Balance Components: Restricted - Current Year Encumbrances Restricted - Prior Year Encumbrances 15,226 Restricted - Trust Debt Service 21,572,705 Total Fund Balance $ 26,144,496
47
CITY OF INDEPENDENCE, MISSOURI Budgetary Comparison Schedule
Old Landfill TIF
For the Period Ended November 30, 2021
Actual Variance Percent Percent Budgeted Amounts Amounts with Final Actual From Original Amended (Budget Basis) Budget 41.67% of Year Budget Revenues: Taxes $ 496,239 496,239 690,878 194,639 139.22% 97.55% Investment Income (Loss) 2 2 0.00% -41.67% Other Revenue 0.00% -41.67% Total Revenues 496,239 496,239 690,880 194,641 139.22% 97.55% Expenditures: Tax Increment Financing 9,590 9,590 9,590 0.00% -41.67% Debt Service Principal 486,349 486,349 486,349 0.00% -41.67% Interest and Fiscal Agent Fees 14,050 (14,050) 0.00% -41.67% Debt Issuance Costs 0.00% -41.67% Total Expenditures 495,939 495,939 14,050 481,889 2.83% -38.84% Other Financing Uses: Issuance of Debt 0.00% -41.67% Reoffering Premium/Original Issue Discount 0.00% -41.67% Payment to Refund Loans Escrow Agent 0.00% -41.67% Transfers Out 0.00% -41.67% Total Other Financing Uses 0.00% -41.67% Total Expenditures and Other Financing Uses 495,939 495,939 14,050 481,889 2.83% -38.84% Excess of Revenues Over (Under) Expenditures and Other Financing Uses $ 300 300 676,830 676,530 Unassigned Fund Balance at Beginning of Year 9,853 Cancellation of Prior Year Encumbrances Change in Other Fund Balance Components During the Year Unassigned Ending Fund Balance, 11/30/21 686,683 Other Fund Balance Components: Restricted - Current Year Encumbrances Restricted - Prior Year Encumbrances Restricted - Trust Debt Service Total Fund Balance $ 686,683
48
CITY OF INDEPENDENCE, MISSOURI Budgetary Comparison Schedule
Trinity TIF
For the Period Ended November 30, 2021
Actual Variance Percent Percent Budgeted Amounts Amounts with Final Actual From Original Amended (Budget Basis) Budget 41.67% of Year Budget Revenues: Taxes $ 489,107 489,107 388,018 (101,089) 79.33% 37.66% Investment Income (Loss) 6 6 0.00% -41.67% Other Revenue 0.00% -41.67% Total Revenues 489,107 489,107 388,024 (101,083) 79.33% 37.66% Other Financing Sources: Transfers In 32,466 32,466 12,232 (20,234) 37.68% -3.99% Total Other Financing Sources 32,466 32,466 12,232 (20,234) 37.68% -3.99% Total Revenues and Other Financing Sources 521,573 521,573 400,256 (121,317) 76.74% 35.07% Expenditures: Tax Increment Financing 11,267 11,267 11,267 0.00% -41.67% Debt Service Principal 510,360 510,360 510,360 0.00% -41.67% Interest and Fiscal Agent Fees 91,600 (91,600) 0.00% -41.67% Debt Issuance Costs 0.00% -41.67% Total Expenditures 521,627 521,627 91,600 430,027 17.56% -24.11% Other Financing Uses: Issuance of Debt 0.00% -41.67% Reoffering Premium/Original Issue Discount 0.00% -41.67% Payment to Refund Loans Escrow Agent 0.00% -41.67% Transfers Out 12,232 (12,232) 0.00% -41.67% Total Other Financing Uses 12,232 (12,232) 0.00% -41.67% Total Expenditures and Other Financing Uses 521,627 521,627 103,832 417,795 19.91% -21.76% Excess of Revenues Over (Under) Expenditures and Other Financing Uses $ (54) (54) 296,424 296,478 Unassigned Fund Balance at Beginning of Year 69,361 Cancellation of Prior Year Encumbrances Change in Other Fund Balance Components During the Year Unassigned Ending Fund Balance, 11/30/21 365,785 Other Fund Balance Components: Restricted - Current Year Encumbrances Restricted - Prior Year Encumbrances Restricted - Trust Debt Service Total Fund Balance $ 365,785
49
CITY OF INDEPENDENCE, MISSOURI Budgetary Comparison Schedule HCA TIF
For the Period Ended November 30, 2021
Actual Variance Percent Percent Budgeted Amounts Amounts with Final Actual From Original Amended (Budget Basis) Budget 41.67% of Year Budget Revenues: Taxes $ 3,589,345 3,589,345 4,513,034 923,689 125.73% 84.06% Investment Income (Loss) 17,000 17,000 8,645 (8,355) 50.85% 9.18% Other Revenue 0.00% -41.67% Total Revenues 3,606,345 3,606,345 4,521,679 915,334 125.38% 83.71% Other Financing Sources: Transfers In 9,183 9,183 2,500 (6,683) 27.22% -14.45% Total Other Financing Sources 9,183 9,183 2,500 (6,683) 27.22% -14.45% Total Revenues and Other Financing Sources 3,615,528 3,615,528 4,524,179 908,651 125.13% 83.46% Expenditures: Tax Increment Financing 550,170 550,170 2,875 547,295 0.52% -41.15% Debt Service Principal 2,200,000 2,200,000 2,200,000 0.00% -41.67% Interest and Fiscal Agent Fees 863,950 863,950 431,975 431,975 50.00% 8.33% Debt Issuance Costs 0.00% -41.67% Total Expenditures 3,614,120 3,614,120 434,850 3,179,270 12.03% -29.64% Other Financing Uses: Issuance of Debt 0.00% -41.67% Reoffering Premium/Original Issue Discount 0.00% -41.67% Payment to Refund Loans Escrow Agent 0.00% -41.67% Transfers Out 2,500 (2,500) 0.00% -41.67% Total Other Financing Uses 2,500 (2,500) 0.00% -41.67% Total Expenditures and Other Financing Uses 3,614,120 3,614,120 437,350 3,176,770 12.10% -29.57% Excess of Revenues Over (Under) Expenditures and Other Financing Uses $ 1,408 1,408 4,086,829 4,085,421 Unassigned Fund Balance at Beginning of Year 1,165,892 Cancellation of Prior Year Encumbrances Change in Other Fund Balance Components During the Year Year-End Investment Market Value Adjustment Unassigned Ending Fund Balance, 11/30/21 5,252,721 Other Fund Balance Components: Restricted - Current Year Encumbrances Restricted - Prior Year Encumbrances Restricted - Trust Debt Service 3,378,566 Total Fund Balance $ 8,631,287
50
CITY OF INDEPENDENCE, MISSOURI
Budgetary Comparison Schedule
Cinema East TIF
For the Period Ended November 30, 2021
Actual Variance Percent Percent Budgeted Amounts Amounts with Final Actual From Original Amended (Budget Basis) Budget 41.67% of Year Budget Revenues: Taxes $ 257,861 257,861 181,023 (76,838) 70.20% 28.53% Investment Income (Loss) 5 5 0.00% -41.67% Other Revenue 0.00% -41.67% Total Revenues 257,861 257,861 181,028 (76,833) 70.20% 28.53% Expenditures: Tax Increment Financing 5,139 5,139 5,139 0.00% -41.67% Debt Service Principal 252,902 252,902 9,561 243,341 3.78% -37.89% Interest and Fiscal Agent Fees 93,239 (93,239) 0.00% -41.67% Debt Issuance Costs 0.00% -41.67% Total Expenditures 258,041 258,041 102,800 155,241 39.84% -1.83% Other Financing Uses: Issuance of Debt 0.00% -41.67% Reoffering Premium/Original Issue Discount 0.00% -41.67% Payment to Refund Loans Escrow Agent 0.00% -41.67% Transfers Out 0.00% -41.67% Total Other Financing Uses 0.00% -41.67% Total Expenditures and Other Financing Uses 258,041 258,041 102,800 155,241 39.84% -1.83% Excess of Revenues Over (Under) Expenditures and Other Financing Uses $ (180) (180) 78,228 78,408 Unassigned Fund Balance at Beginning of Year 80,315 Cancellation of Prior Year Encumbrances Change in Other Fund Balance Components During the Year Unassigned Ending Fund Balance, 11/30/21 158,543 Other Fund Balance Components: Restricted - Current Year Encumbrances Restricted - Prior Year Encumbrances Restricted - Trust Debt Service Total Fund Balance $ 158,543
51
CITY OF INDEPENDENCE, MISSOURI Budgetary Comparison Schedule
23rd & Noland Project 1 TIF
For the Period Ended November 30, 2021
Actual Variance Percent Percent Budgeted Amounts Amounts with Final Actual From Original Amended (Budget Basis) Budget 41.67% of Year Budget Revenues: Taxes $ 82,194 82,194 48,708 (33,486) 59.26% 17.59% Investment Income (Loss) 11 11 0.00% -41.67% Other Revenue 0.00% -41.67% Total Revenues 82,194 82,194 48,719 (33,475) 59.27% 17.60% Expenditures: Tax Increment Financing 2,063 2,063 2,063 0.00% -41.67% Debt Service Principal 80,131 80,131 80,131 0.00% -41.67% Interest and Fiscal Agent Fees 0.00% -41.67% Debt Issuance Costs 0.00% -41.67% Total Expenditures 82,194 82,194 82,194 0.00% -41.67% Other Financing Uses: Issuance of Debt 0.00% -41.67% Reoffering Premium/Original Issue Discount 0.00% -41.67% Payment to Refund Loans Escrow Agent 0.00% -41.67% Transfers Out 0.00% -41.67% Total Other Financing Uses 0.00% -41.67% Total Expenditures and Other Financing Uses 82,194 82,194 82,194 0.00% -41.67% Excess of Revenues Over (Under) Expenditures and Other Financing Uses $ 48,719 48,719 Unassigned Fund Balance at Beginning of Year 72,840 Cancellation of Prior Year Encumbrances Change in Other Fund Balance Components During the Year Unassigned Ending Fund Balance, 11/30/21 121,559 Other Fund Balance Components: Restricted - Current Year Encumbrances Restricted - Prior Year Encumbrances Restricted - Trust Debt Service Total Fund Balance $ 121,559
52
CITY OF INDEPENDENCE, MISSOURI Budgetary Comparison Schedule 23rd & Noland Project 2 TIF
For the Period Ended November 30, 2021
Actual Variance Percent Percent Budgeted Amounts Amounts with Final Actual From Original Amended (Budget Basis) Budget 41.67% of Year Budget Revenues: Taxes $ 11,729 11,729 13,160 1,431 112.20% 70.53% Investment Income (Loss) 156 156 0.00% -41.67% Other Revenue 0.00% -41.67% Total Revenues 11,729 11,729 13,316 1,587 113.53% 71.86% Expenditures: Tax Increment Financing 246 246 246 0.00% -41.67% Debt Service Principal 11,483 11,483 21,000 (9,517) 182.88% 141.21% Interest and Fiscal Agent Fees 0.00% -41.67% Debt Issuance Costs 0.00% -41.67% Total Expenditures 11,729 11,729 21,000 (9,271) 179.04% 137.37% Other Financing Uses: Issuance of Debt 0.00% -41.67% Reoffering Premium/Original Issue Discount 0.00% -41.67% Payment to Refund Loans Escrow Agent 0.00% -41.67% Transfers Out 0.00% -41.67% Total Other Financing Uses 0.00% -41.67% Total Expenditures and Other Financing Uses 11,729 11,729 21,000 (9,271) 179.04% 137.37% Excess of Revenues Over (Under) Expenditures and Other Financing Uses $ (7,684) (7,684) Unassigned Fund Balance at Beginning of Year 23,261 Cancellation of Prior Year Encumbrances Change in Other Fund Balance Components During the Year Year-End Investment Market Value Adjustment Unassigned Ending Fund Balance, 11/30/21 15,577 Other Fund Balance Components: Restricted - Current Year Encumbrances Restricted - Prior Year Encumbrances Restricted - Trust Debt Service Total Fund Balance $ 15,577
53
CITY OF INDEPENDENCE, MISSOURI Budgetary Comparison Schedule
23rd & Noland Project 3 TIF
For the Period Ended November 30, 2021
Actual Variance Percent Percent Budgeted Amounts Amounts with Final Actual From Original Amended (Budget Basis) Budget 41.67% of Year Budget Revenues: Taxes $ 24,348 24,348 13,596 (10,752) 55.84% 14.17% Investment Income (Loss) 303 303 0.00% -41.67% Other Revenue 0.00% -41.67% Total Revenues 24,348 24,348 13,899 (10,449) 57.08% 15.41% Expenditures: Tax Increment Financing 24,438 24,438 24,438 0.00% -41.67% Debt Service Principal 0.00% -41.67% Interest and Fiscal Agent Fees 0.00% -41.67% Debt Issuance Costs 0.00% -41.67% Total Expenditures 24,438 24,438 24,438 0.00% -41.67% Other Financing Uses: Issuance of Debt 0.00% -41.67% Reoffering Premium/Original Issue Discount 0.00% -41.67% Payment to Refund Loans Escrow Agent 0.00% -41.67% Transfers Out 0.00% -41.67% Total Other Financing Uses 0.00% -41.67% Total Expenditures and Other Financing Uses 24,438 24,438 24,438 0.00% -41.67% Excess of Revenues Over (Under) Expenditures and Other Financing Uses $ (90) (90) 13,899 13,989 Unassigned Fund Balance at Beginning of Year 6,738 Cancellation of Prior Year Encumbrances Change in Other Fund Balance Components During the Year Year-End Investment Market Value Adjustment Unassigned Ending Fund Balance, 11/30/21 20,637 Other Fund Balance Components: Restricted - Current Year Encumbrances Restricted - Prior Year Encumbrances Restricted - Trust Debt Service Total Fund Balance $ 20,637
54
CITY OF INDEPENDENCE, MISSOURI Budgetary Comparison Schedule 23rd & Noland Project 4 TIF For the Period Ended November 30, 2021
Actual Variance Percent Percent Budgeted Amounts Amounts with Final Actual From Original Amended (Budget Basis) Budget 41.67% of Year Budget Revenues: Taxes $ 462,503 462,503 311,054 (151,449) 67.25% 25.58% Investment Income (Loss) 3,084 3,084 0.00% -41.67% Other Revenue 0.00% -41.67% Total Revenues 462,503 462,503 314,138 (148,365) 67.92% 26.25% Expenditures: Tax Increment Financing 462,503 462,503 462,503 0.00% -41.67% Debt Service Principal 0.00% -41.67% Interest and Fiscal Agent Fees 0.00% -41.67% Debt Issuance Costs 0.00% -41.67% Total Expenditures 462,503 462,503 462,503 0.00% -41.67% Other Financing Uses: Issuance of Debt 0.00% -41.67% Reoffering Premium/Original Issue Discount 0.00% -41.67% Payment to Refund Loans Escrow Agent 0.00% -41.67% Transfers Out 0.00% -41.67% Total Other Financing Uses 0.00% -41.67% Total Expenditures and Other Financing Uses 462,503 462,503 462,503 0.00% -41.67% Excess of Revenues Over (Under) Expenditures and Other Financing Uses $ 314,138 314,138 Unassigned Fund Balance at Beginning of Year 73,562 Cancellation of Prior Year Encumbrances Change in Other Fund Balance Components During the Year Year-End Investment Market Value Adjustment Unassigned Ending Fund Balance, 11/30/21 387,700 Other Fund Balance Components: Restricted - Current Year Encumbrances Restricted - Prior Year Encumbrances Restricted - Trust Debt Service Total Fund Balance $ 387,700
55
CITY OF INDEPENDENCE, MISSOURI Budgetary Comparison Schedule Independence Square TIF
For the Period Ended November 30, 2021
Actual Variance Percent Percent Budgeted Amounts Amounts with Final Actual From Original Amended (Budget Basis) Budget 41.67% of Year Budget Revenues: Taxes $ 145,470 145,470 304,571 159,101 209.37% 167.70% Investment Income (Loss) 8,000 8,000 12,652 4,652 158.15% 116.48% Other Revenue 0.00% -41.67% Total Revenues 153,470 153,470 317,223 163,753 206.70% 165.03% Expenditures: Tax Increment Financing 7,799 7,799 43,615 (35,816) 559.24% 517.57% Debt Service Principal 0.00% -41.67% Interest and Fiscal Agent Fees 0.00% -41.67% Debt Issuance Costs 0.00% -41.67% Total Expenditures 7,799 7,799 43,615 (35,816) 559.24% 517.57% Other Financing Uses: Issuance of Debt 0.00% -41.67% Reoffering Premium/Original Issue Discount 0.00% -41.67% Payment to Refund Loans Escrow Agent 0.00% -41.67% Transfers Out 0.00% -41.67% Total Other Financing Uses 0.00% -41.67% Total Expenditures and Other Financing Uses 7,799 7,799 43,615 (35,816) 559.24% 517.57% Excess of Revenues Over (Under) Expenditures and Other Financing Uses $ 145,671 145,671 273,608 127,937 Unassigned Fund Balance at Beginning of Year 648,571 Cancellation of Prior Year Encumbrances Change in Other Fund Balance Components During the Year Year-End Investment Market Value Adjustment Unassigned Ending Fund Balance, 11/30/21 922,179 Other Fund Balance Components: Restricted - Current Year Encumbrances Restricted - Prior Year Encumbrances Restricted - Trust Debt Service Total Fund Balance $ 922,179
56
CITY OF INDEPENDENCE, MISSOURI Budgetary Comparison Schedule
I-70 & Little Blue Parkway Project 1 TIF
For the Period Ended November 30, 2021
Actual Variance Percent Percent Budgeted Amounts Amounts with Final Actual From Original Amended (Budget Basis) Budget 41.67% of Year Budget Revenues: Taxes $ 1,152,029 1,152,029 1,198,066 46,037 104.00% 62.33% Investment Income (Loss) 1,000 1,000 13,467 12,467 1346.70% 1305.03% Other Revenue 0.00% -41.67% Total Revenues 1,153,029 1,153,029 1,211,533 58,504 105.07% 63.40% Expenditures: Tax Increment Financing 23,927 23,927 23,927 0.00% -41.67% Debt Service Principal 1,128,102 1,128,102 101,410 1,026,692 8.99% -32.68% Interest and Fiscal Agent Fees 0.00% -41.67% Debt Issuance Costs 0.00% -41.67% Total Expenditures 1,152,029 1,152,029 101,410 1,050,619 8.80% -32.87% Other Financing Uses: Issuance of Debt 0.00% -41.67% Reoffering Premium/Original Issue Discount 0.00% -41.67% Payment to Refund Loans Escrow Agent 0.00% -41.67% Transfers Out 0.00% -41.67% Total Other Financing Uses 0.00% -41.67% Total Expenditures and Other Financing Uses 1,152,029 1,152,029 101,410 1,050,619 8.80% -32.87% Excess of Revenues Over (Under) Expenditures and Other Financing Uses $ 1,000 1,000 1,110,123 1,109,123 Unassigned Fund Balance at Beginning of Year 258,617 Cancellation of Prior Year Encumbrances Change in Other Fund Balance Components During the Year Year-End Investment Market Value Adjustment Unassigned Ending Fund Balance, 11/30/21 1,368,740 Other Fund Balance Components: Restricted - Current Year Encumbrances Restricted - Prior Year Encumbrances Restricted - Trust Debt Service Total Fund Balance $ 1,368,740
57
CITY OF INDEPENDENCE, MISSOURI Budgetary Comparison Schedule
I-70 & Little Blue Parkway Project 3 TIF For the Period Ended November 30, 2021
Actual Variance Percent Percent Budgeted Amounts Amounts with Final Actual From Original Amended (Budget Basis) Budget 41.67% of Year Budget Revenues: Taxes $ 382,156 382,156 256,465 (125,691) 67.11% 25.44% Investment Income (Loss) 2,477 2,477 0.00% -41.67% Other Revenue 0.00% -41.67% Total Revenues 382,156 382,156 258,942 (123,214) 67.76% 26.09% Expenditures: Tax Increment Financing 382,156 382,156 382,156 0.00% -41.67% Debt Service Principal 0.00% -41.67% Interest and Fiscal Agent Fees 0.00% -41.67% Debt Issuance Costs 0.00% -41.67% Total Expenditures 382,156 382,156 382,156 0.00% -41.67% Other Financing Uses: Issuance of Debt 0.00% -41.67% Reoffering Premium/Original Issue Discount 0.00% -41.67% Payment to Refund Loans Escrow Agent 0.00% -41.67% Transfers Out 0.00% -41.67% Total Other Financing Uses 0.00% -41.67% Total Expenditures and Other Financing Uses 382,156 382,156 382,156 0.00% -41.67% Excess of Revenues Over (Under) Expenditures and Other Financing Uses $ 258,942 258,942 Unassigned Fund Balance at Beginning of Year 107,526 Cancellation of Prior Year Encumbrances Change in Other Fund Balance Components During the Year Year-End Investment Market Value Adjustment Unassigned Ending Fund Balance, 11/30/21 366,468 Other Fund Balance Components: Restricted - Current Year Encumbrances Restricted - Prior Year Encumbrances Restricted - Trust Debt Service Total Fund Balance $ 366,468
58
CITY OF INDEPENDENCE, MISSOURI Budgetary Comparison Schedule
Marketplace Project 1 TIF
For the Period Ended November 30, 2021
Actual Variance Percent Percent Budgeted Amounts Amounts with Final Actual From Original Amended (Budget Basis) Budget 41.67% of Year Budget Revenues: Taxes $ 97,731 97,731 69,203 (28,528) 70.81% 29.14% Investment Income (Loss) 3 3 0.00% -41.67% Other Revenue 0.00% -41.67% Total Revenues 97,731 97,731 69,206 (28,525) 70.81% 29.14% Expenditures: Tax Increment Financing 3,949 3,949 3,949 0.00% -41.67% Debt Service Principal 93,782 93,782 93,782 0.00% -41.67% Interest and Fiscal Agent Fees 54,150 (54,150) 0.00% -41.67% Debt Issuance Costs 0.00% -41.67% Total Expenditures 97,731 97,731 54,150 43,581 55.41% 13.74% Other Financing Uses: Issuance of Debt 0.00% -41.67% Reoffering Premium/Original Issue Discount 0.00% -41.67% Payment to Refund Loans Escrow Agent 0.00% -41.67% Transfers Out 0.00% -41.67% Total Other Financing Uses 0.00% -41.67% Total Expenditures and Other Financing Uses 97,731 97,731 54,150 43,581 55.41% 13.74% Excess of Revenues Over (Under) Expenditures and Other Financing Uses $ 15,056 15,056 Unassigned Fund Balance at Beginning of Year 62,802 Cancellation of Prior Year Encumbrances Change in Other Fund Balance Components During the Year Unassigned Ending Fund Balance, 11/30/21 77,858 Other Fund Balance Components: Restricted - Current Year Encumbrances Restricted - Prior Year Encumbrances Restricted - Trust Debt Service Total Fund Balance $ 77,858
59
CITY OF INDEPENDENCE, MISSOURI Budgetary Comparison Schedule
Marketplace Project 2 TIF
For the Period Ended November 30, 2021
Actual Variance Percent Percent Budgeted Amounts Amounts with Final Actual From Original Amended (Budget Basis) Budget 41.67% of Year Budget Revenues: Taxes $ 35,447 35,447 93,293 57,846 263.19% 221.52% Investment Income (Loss) 2 2 0.00% -41.67% Other Revenue 0.00% -41.67% Total Revenues 35,447 35,447 93,295 57,848 263.20% 221.53% Expenditures: Tax Increment Financing 35,447 35,447 360 35,087 1.02% -40.65% Debt Service Principal 0.00% -41.67% Interest and Fiscal Agent Fees 38,200 (38,200) 0.00% -41.67% Debt Issuance Costs 0.00% -41.67% Total Expenditures 35,447 35,447 38,560 (3,113) 108.78% 67.11% Other Financing Uses: Issuance of Debt 0.00% -41.67% Reoffering Premium/Original Issue Discount 0.00% -41.67% Payment to Refund Loans Escrow Agent 0.00% -41.67% Transfers Out 0.00% -41.67% Total Other Financing Uses 0.00% -41.67% Total Expenditures and Other Financing Uses 35,447 35,447 38,560 (3,113) 108.78% 67.11% Excess of Revenues Over (Under) Expenditures and Other Financing Uses $ 54,735 54,735 Unassigned Fund Balance at Beginning of Year 34,445 Cancellation of Prior Year Encumbrances Change in Other Fund Balance Components During the Year Unassigned Ending Fund Balance, 11/30/21 89,180 Other Fund Balance Components: Restricted - Current Year Encumbrances Restricted - Prior Year Encumbrances Restricted - Trust Debt Service Total Fund Balance $ 89,180
60
Actual Variance Percent Percent Budgeted Amounts Amounts with Final Actual From Original Amended (Budget Basis) Budget 41.67% of Year Budget Revenues: Taxes $ 0.00% -41.67% Investment Income (Loss) 0.00% -41.67% Other Revenue 0.00% -41.67% Total Revenues 0.00% -41.67% Expenditures: Tax Increment Financing 0.00% -41.67% Debt Service Principal 0.00% -41.67% Interest and Fiscal Agent Fees 0.00% -41.67% Debt Issuance Costs 0.00% -41.67% Total Expenditures 0.00% -41.67% Other Financing Uses: Issuance of Debt 0.00% -41.67% Reoffering Premium/Original Issue Discount 0.00% -41.67% Payment to Refund Loans Escrow Agent 0.00% -41.67% Transfers Out 0.00% -41.67% Total Other Financing Uses 0.00% -41.67% Total Expenditures and Other Financing Uses 0.00% -41.67% Excess of Revenues Over (Under) Expenditures and Other Financing Uses $ Unassigned Fund Balance at Beginning of Year Cancellation of Prior Year Encumbrances Change in Other Fund Balance Components During the Year Unassigned Ending Fund Balance, 11/30/21 Other Fund Balance Components: Restricted - Current Year Encumbrances Restricted - Prior Year Encumbrances Restricted - Trust Debt Service Total Fund Balance $
Budgetary Comparison Schedule TIF Application Fees For the Period Ended November 30, 2021 61
CITY OF INDEPENDENCE, MISSOURI
CITY OF INDEPENDENCE, MISSOURI Budgetary Comparison Schedule
TIF Supplemental Appropriation Fund
For the Period Ended November 30, 2021
Actual Variance Percent Percent Budgeted Amounts Amounts with Final Actual From Original Amended (Budget Basis) Budget 41.67% of Year Budget Revenues: Taxes $ Property tax RSO - Cargo Largo 3,454 3,454 0.00% -41.67% Drumm Farm 54,223 54,223 0.00% -41.67% Sales tax RSO - Cargo Largo 19,536 19,536 0.00% -41.67% Drumm Farm 8,977 8,977 0.00% -41.67% Investment Income (Loss) 2 2 0.00% -41.67% Other Revenue 0.00% -41.67% Total Revenues 86,192 86,192 0.00% -41.67% Expenditures: Tax Increment Financing 0.00% -41.67% Debt Service Principal 0.00% -41.67% Interest and Fiscal Agent Fees 0.00% -41.67% Debt Issuance Costs 0.00% -41.67% Total Expenditures 0.00% -41.67% Other Financing Uses: Issuance of Debt 0.00% -41.67% Reoffering Premium/Original Issue Discount 0.00% -41.67% Payment to Refund Loans Escrow Agent 0.00% -41.67% Transfers Out 0.00% -41.67% Total Other Financing Uses 0.00% -41.67% Total Expenditures and Other Financing Uses 0.00% -41.67% Excess of Revenues Over (Under) Expenditures and Other Financing Uses $ 86,192 86,192 Unassigned Fund Balance at Beginning of Year Cancellation of Prior Year Encumbrances Change in Other Fund Balance Components During the Year Unassigned Ending Fund Balance, 11/30/21 86,192 Other Fund Balance Components: Restricted - Current Year Encumbrances Restricted - Prior Year Encumbrances Restricted - Trust Debt Service Total Fund Balance $ 86,192
62
