7 minute read
Analysis of Property Valuation and Tax Rate


Property taxes provide one of the largest sources of revenue for the City and determining the tax rate is a significant component of the annual budget process. Therefore, discussion of the General Fund cannot be separated from discussion of the tax rate and associated revenue.
PROPERTY VALUATION
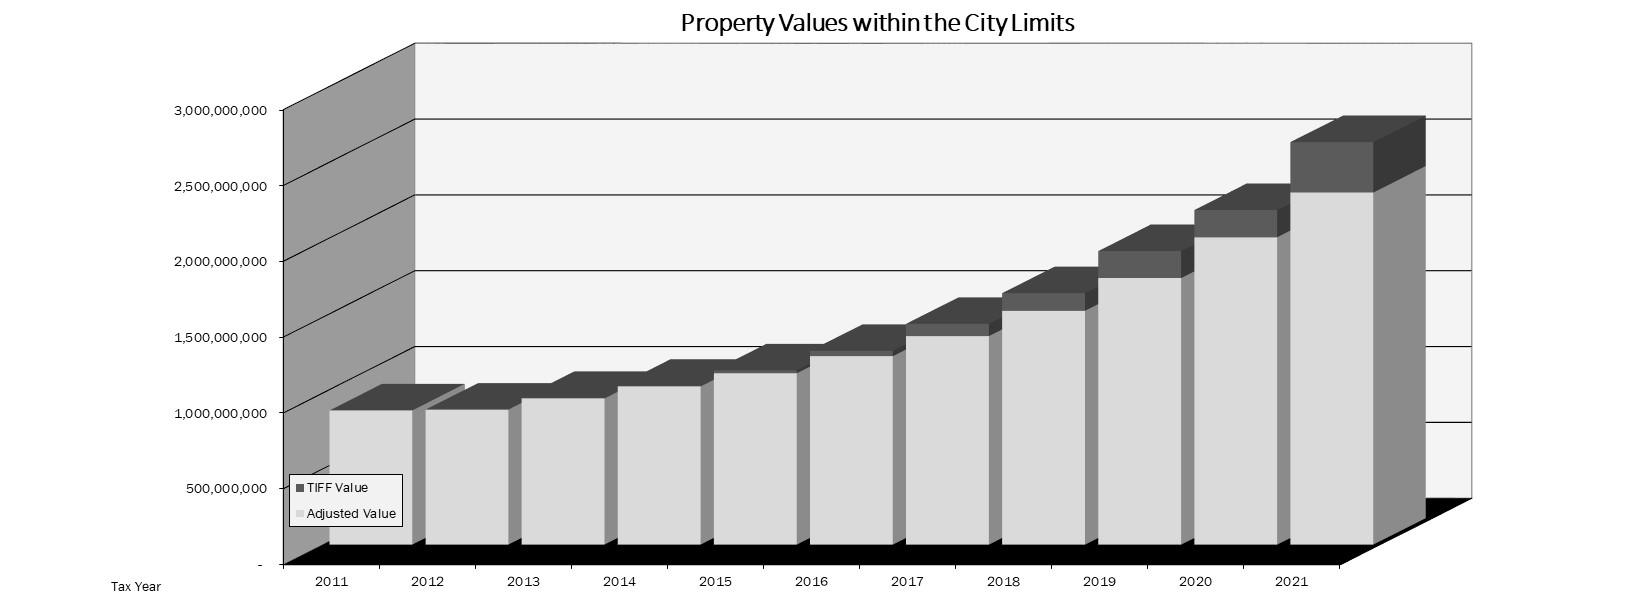
The Kaufman County Appraisal District (KCAD) establishes and certifies the value of each property within the City of Forney and provides this information to both the city and the County Tax Assessor’s Office. The total certified value for Fiscal Year 2022 (Tax Year 2021) is $2,654,551,468. This is an increase of $447,768,539 or 20.2%.
However, the Kaufman Country Appraisal District does not adjust the certified taxable value for the Tax Increment Reinvestment Zone (TIRZ). In order to provide an accurate revenue estimate, the City subtracts 85% of the value of the properties included in the TIRZ. Total TIRZ value for Fiscal Year 2022 is $391,498,933 and 85% of that equals $332,774,093. Therefore, property tax revenue estimates are based on a value of $2,321,777,375. This is an increase of $295,201,035 or 14.56% from the previous year’s adjusted taxable value.
TAX RATE The total tax rate is made up of two portions: Maintenance & Operations (M&O) and Debt Service.
ANALYSIS OF PROPERTY VALUATIONS & TAX RATE
Tax Year Assessed Valuation Total Tax RateM&O Tax Rate Debt Service Tax Rate
Total Taxes Assessed 2011 885,199,481 0.743098 0.323198 0.419900 6,577,900 2012 890,258,563 0.749020 0.316925 0.432095 6,668,215 2013 967,431,252 0.749020 0.316925 0.432095 7,246,254 2014 1,047,122,752 0.723486 0.333638 0.389848 7,575,787 2015 1,149,202,404 0.698483 0.350398 0.348085 8,026,984 2016 1,277,357,216 0.651111 0.338445 0.312666 8,317,017 2017 1,455,653,995 0.621111 0.358330 0.262781 9,041,227 2018 1,658,547,850 0.621111 0.393237 0.227874 10,301,423 2019 1,935,983,668 0.580000 0.386125 0.193875 10,197,205 2020 2,206,782,929 0.538710 0.378201 0.160509 10,808,187
2021 2,654,551,468 0.501069 0.356015 0.145054 11,633,710
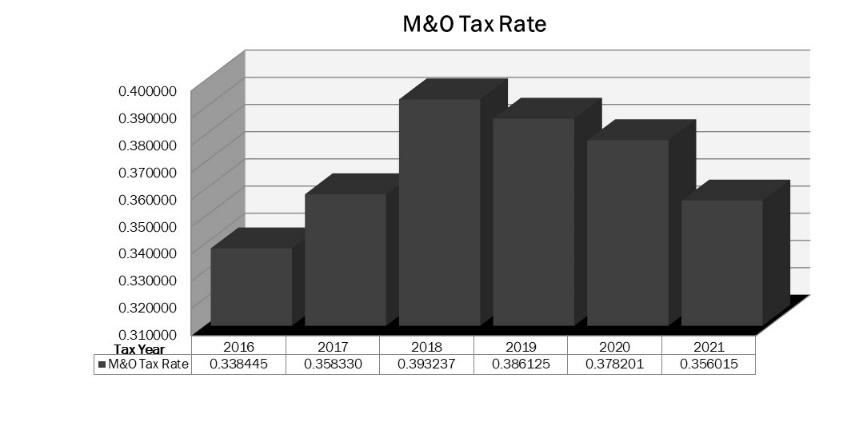
MAINTENANCE & OPERATIONS RATE The Maintenance & Operations (M&O) portion of the tax rate provides funding for all general fund operations. This portion of the tax rate is flexible and can be adjusted to a higher or lower rate based on the needs of the community. The M&O rate also generates reserve funds for future capital expenses and allows the City to maintain a three month operating reserve. The proposed Fiscal Year 2022 Maintenance & Operations rate will decrease $0.02219 (-5.8%) to $0.356015. This rate will result in $8,265,876 in General Fund revenue; an increase of $677,989 (8.9%) from the previous year’s General Fund revenue. Ninety-Eight (98%) percent of the revenue increase, or $666,071 results from the new property value added to the tax roll in 2021.
DEBT SERVICE TAX RATE
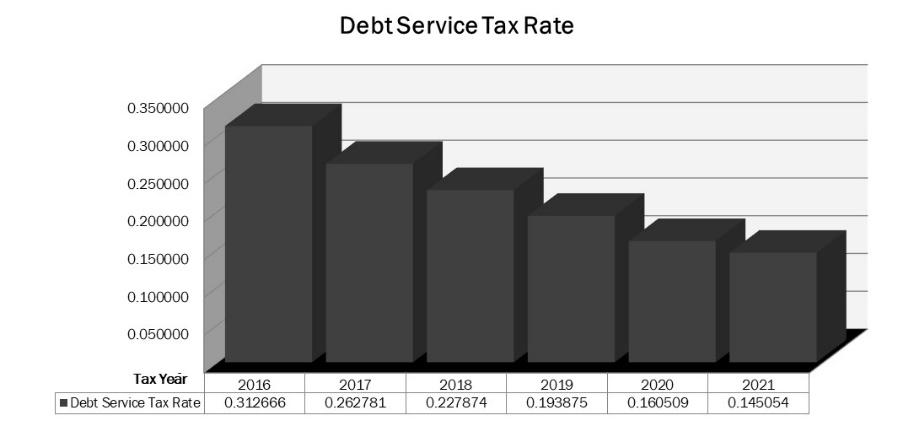
The Debt Service (DS) portion of the tax rate covers the City’s bond payments and other outstanding debt. This portion of the tax rate is not flexible, and is set by a calculation based on the required fiscal year payments of the City’s debt. Fiscal Year 2022’s debt service rate is $0.145054. This is a decrease of $0.01545 (‐9.6%) from the Fiscal Year 2021 rate, resulting in $3,367,835 in revenue to be used for debt payments. The Debt Service tax rate is calculated by subtracting any revenue paid from other sources from the annual required debt payment and then dividing that result by the adjusted taxable value and multiplying by 100.
(Total annual debt payment) – (Non-tax revenue) ÷ (Adjusted Taxable Value) x 100 = Debt Service Tax Rate ((6,054,217 – 2,686,383) ÷ 2,321,777,375) x 100 = $0.145054
General Debt Service Prinicipal Interest Annual Payment Paid from Other Tax Rate Series 2008 General Obligation - TXDOT Pass Through - 149,312.50 149,312.50 149,312.50 -
Series 2011 General Obligation Refunding - 38,887.50 38,887.50 0.001675 Series 2012 General Obligation Refunding 195,000.00 4,680.00 199,680.00 0.008600
Series 2012 Certificates of Obligation 50,000.00 15,700.00 65,700.00
0.002830 Series 2014 Certificates of Obligation 235,000.00 118,412.50 353,412.50 353,412.50 Series 2014 General Obligation Refunding (2005A) 220,000.00 18,900.00 238,900.00 0.010290
Series 2015 General Obligation Refunding (2007) - 329,475.00 329,475.00 - 0.014191
Series 2016 General Obligation Refunding (2007) 1,590,000.00 50,050.00 1,640,050.00
0.070638
Series 2016 Certificates of Obligation (Redbud) 105,000.00 54,281.26 159,281.26 - 0.006860
Series 2017 Subordinate Lien Pass Through Refunding 1,830,000.00 262,200.00 2,092,200.00 1,860,257.50 0.009990
Series 2017 Tax Notes (Fire Equipment) 300,000.00 23,400.00 323,400.00 323,400.00 Series 2020 General Obligation Refunding 395,000.00 68,918.25 463,918.25 0.019981
4,920,000.00 1,134,217.01 6,054,217.01 2,686,382.50 0.145054
PASS THROUGH TOLL AGREEMENT
In addition to revenue from the debt service portion of the tax rate, the city receives an annual payment from the Texas Department of Transportation (TxDOT) as part of a Pass Through Tolling agreement. With this agreement, the City sold the 2008 General Obligation Bonds to fund the expansion of three state owned roadways within the city limits, and oversaw the construction. Upon completion of the projects, responsibility for the roadways was returned to the state and TxDOT began to reimburse the City annually. Repayment is structured with a minimum annual payment, with an additional accelerated portion (amount above the guaranteed minimum annual payment) based on traffic counts. The minimum annual payment is $2,009,570. The City Council has deemed any amount above the minimum payment be held as committed fund balance and, if possible, used for early redemption in order to reduce future interest payments. The city has redeemed an additional $17,037,448 resulting in $8,575,962 in interest savings. Combined with general obligation refunding and increasing property values, this early redemption process has also helped to decrease the debt service tax rate by $0.25 since Fiscal Year 2014. To date, the 2014 Certificates of Obligation have not impacted the debt service tax rate. The proceeds from these certificates were used to fund construction of Fire Station #2 and the new Animal Shelter. The payments have been made from fund balance in the Debt Service fund. Payments for the 2017 Tax Notes are also being made from fund balance. This fund balance is the result of interest collected in the fund, as well as delinquent and penalty taxes that have accumulated over prior years and is restricted to use on debt payments.
TOTAL TAX RATE
The total tax rate for Fiscal Year 2022 is proposed at $0.501069. Tax revenue estimates are calculated at a 100% collection rate and are expected to result in a total of $11,633,710. This is an increase of $825,515 (7.64%) from Fiscal Year 2021 and is the result of an increase in assessed valuation and new taxable value. New taxable value added to the tax roll contributed 113% of the revenue increase.
The total tax rate has decreased each year since Fiscal Year 2014 (Tax Year 2013). The total five-year reduction is $0.12.
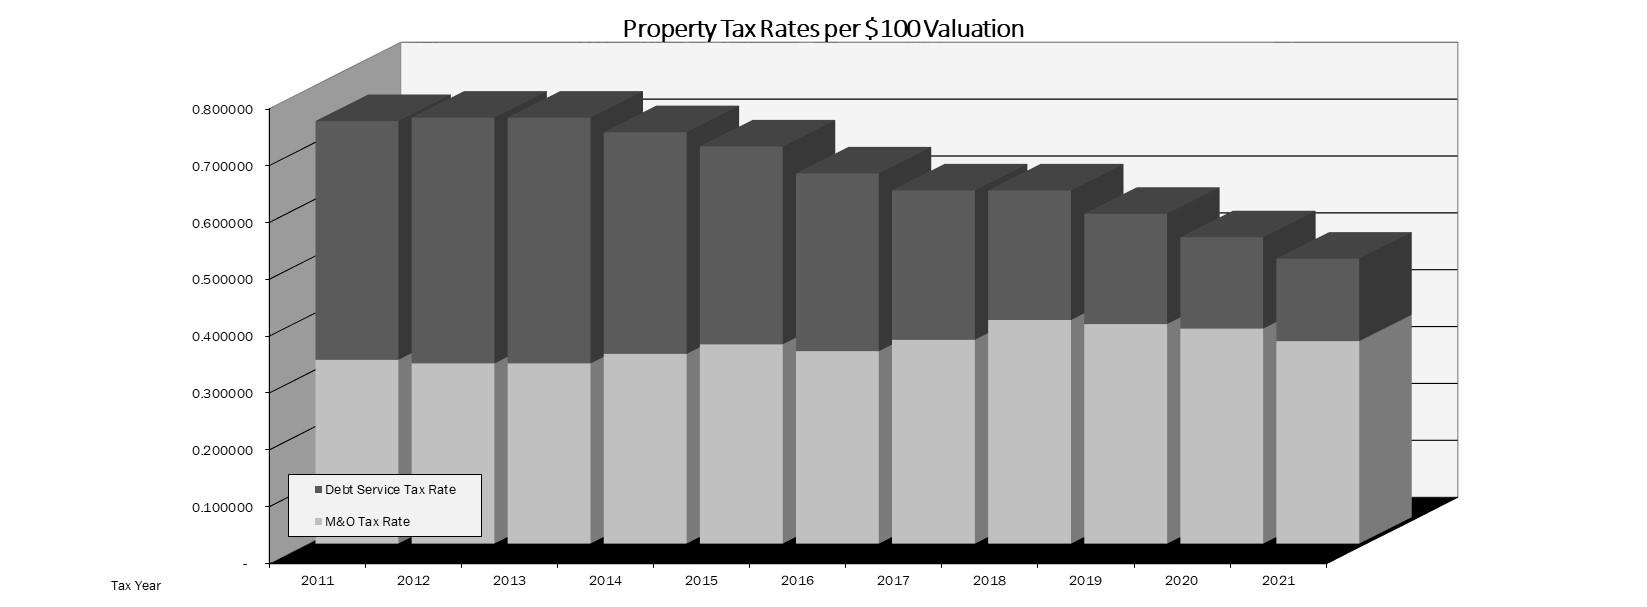
PROPERTY VALUATIONS & TAX RATE SUMMARY • Property values have increased 82% in the past 5 years, due to significant new development o The Fiscal Year 2022 property value increase is 20.29% - of that increase 55% is the result of new value added • Total Tax Rate has decreased $0.12 in the past 5 years o Maintenance & Operations tax rate has decreased $0.002 While the M&O tax rate is no longer increasing, the increase in property values still provides funding for enhanced existing services, new services, and cash funded capital improvement without increasing taxpayer burden • Debt Service tax rate has decreased $0.12
Estimated Ad Valorem Tax Revenue
Fiscal Year 2019 2020 2021 2022 FY 2020 TO FY 2021 CHANGE Tax Year 2018 2019 2020 2021 $ Change % Change
Estimated Tax Roll 1,658,547,850 1,935,983,668 2,206,782,929 2,654,551,468 447,768,539 20.29%
TIF Property Value Value Used for Revenue Calculation Proposed Tax rate per $100 Valuation 116,878,339 177,844,682 180,206,589 332,774,093 152,567,504 84.66%
1,541,669,511 1,758,138,986 2,026,576,340 2,321,777,375 295,201,035 14.57%
0.621111 0.580000 0.538710 0.501069 (0.03764) -6.99%
Revenue from Taxes Estimated Collection Rate
9,575,479 10,197,206 10,917,360 11,633,707 716,346 7.02% 99% 99% 99% 100% 100%
Estimated Current Year Funds Available 9,479,724 10,095,234 10,808,187 11,633,707 825,520 7.64%
Fiscal Year Distribution of Current Tax Collections
2019 2020 2021 2022
FY 2020 TO FY 2021 CHANGE
Tax Year
Maintenance & Operations Rate 2018 2019 2020 2021 $ Change % Change
0.393237 0.380567 0.378201 0.356015 (0.022186) -5.87%
M&O Yield 6,001,791 6,623,988 7,587,887 8,265,876 677,989 8.94%
Debt Service Rate
0.227874 0.199433 0.160509 0.145054 (0.01545) -9.63% Debt Service Yield 3,477,930 3,471,245 3,220,300 3,367,835 147,535 4.58%
Total Rate 0.621111 0.580000 0.538710 0.501069 (0.037641) -6.99% Total Yield 9,479,721 10,095,234 10,808,187 11,633,711 825,524 7.64%
Fiscal Year 2022 Proposed Budget 53


