

T ABLE OF CONTENTS

City of Eden Prairie, MN
EXECUTIVE SUMMARY
The City of Eden Prairie, Minnesota (City) Fire Department (Department) retained Citygate Associates, LLC (Citygate) to conduct an Analysis of Fire Services Standards of Cover / Staffing based on nationally recognized guidelines and best practices, federal and state mandates, and relevant local and regional operating procedures to determine if there are more effective, efficient, and improved deployment models for service delivery, consistent with state of Minnesota and national best practices. This analysis includes a review and recommendation for fire service coverage for the City, including staffing options and funding of those options to ensure a prompt, professional response to fire, medical, and rescue emergencies.
This report is presented in two volumes. The Technical Report ( Volume 1) includes: this Executive Summary, which contains a summary of Citygate’s analysis and all findings and recommendations; an introduction to the study and background information about the City and Department; a Standards of Cover study supported by maps and response statistics; and an administrative support staffing capacity review A Map Atlas of deployment coverage measures is provided in Volume 2 Overall, Citygate makes 33 findings and 10 recommendations in this report
POLICY CHOICES FRAMEWORK
There are no mandatory federal or state regulations directing the level of fire service staffing, response times, or outcomes related to fire services The level of service provided, and any resultant cost, is a local policy choice. If services are provided at all, local, state, and federal regulations must be followed for the safety of the public and for the personnel providing the services.
Thus, the level of fire protection services provided is a local policy decision. Communities have the level of fire services they can afford and choose to purchase, which may not always be the level desired.
THREE CHALLENGES
For a community to achieve desired outcomes for fire and EMS events, adequate staffing, apparatus types, and response times are required Citygate’s review of the Department identified three key challenges some with serious deficiencies that overlap and prevent adherence to best practices and even regulatory compliance related to basic fire service operations.
Challenge #1: Adequacy of Firefighting Response
The current deployment model of six personnel on duty daily upon two apparatus in a revolving station staffing model is insufficient to safely and effectively mitigate a moderate, single-family
City of Eden Prairie, MN
dwelling fire or other moderate incident type, with no remaining on-duty personnel or very limited callback personnel for a major or simultaneous incident. The present staffing of only one or two stations is providing sluggish response times for positive outcomes in a suburban city that also has commercial building fire and technical rescue risks.
Challenge #2: Reliability of Established Staffing
The Department’s part-time firefighters, also known as Duty Crew firefighters, have a strong legacy of providing after-hours staffing coverage to the City. In the aggregate, the part-time firefighters provided 37,022 station staffing hours which corresponds to nearly 1 3 full-time firefighters working a traditional 24/48 schedule. Nearly 70.4 percent of the total annual staffing demand for the 24/7/365 two-apparatus deployment was provided by the part -time Duty Crews demonstrating a high level of commitment to the Department. However, the staffing model is beginning to show its limits, particularly in hours at the beginning and end of the workweek when personnel are not available to meet the demand. Even with full-time staff assisting, for 2022, there were 79 instances where staffing was reduced. For 2023, there were 127.
For these staffing shortages, the cascading effect to the Department is that full -time staff are preempted from their scheduled activities to fill the gap, or the level of staffing is reduced. For the former, the effects in the Prevention Division include deficits in annual inspection goals including the dwelling unit inspection program. For the latter, the Department’s ability to effectively engage a routine fire event is further compromised.
Challenge #3: Adequate Prevention Staffing
Secondary to a vibrant business economy, the Prevention Division has a substantial fire inspection responsibility of over 900 occupancies annually. In addition, the City’s goal to inspect all rental dwelling units on a five-year frequency adds nearly 900 additional inspections annually. Further, the group also spends about 25 percent of its time staffing fire apparatus during their normal working hours.
The Prevention Division is also space limited, with no room at their Station 1 offices to add additional staffing in the current format. There are, however, some ongoing inspection database enhancements that should increase productivity of the unit.
Department Strengths
Citygate found the Department to be a best practices organization with functional division of labor, policies and processes needing only minor adjustments. The Department’s existing fleet and , to a slightly lesser extent, facilities, are in the condition to allow for immediate adjustments to response capability. This is an enviable position in the fire service, as station and apparatus build times now routinely exceed 36 months. The third element for increasing capability is personnel , and the Department should be proud of its strong culture shown by the spirit of duty and cooperation within
City of Eden Prairie, MN Fire Department Analysis of Fire Services Standards of Cover / Staffing
both the full- time and part-time ranks. Citygate is impressed by these individuals and the work accomplished to date and believes there is strong DNA in the Department upon which to assure future successes.
CURRENT DEPLOYMENT MEASURES
The Department serves an urban/suburban population with a mixed residential and non -residential land-use pattern typical of other Twin Cities area cities of similar size and demographics.
Simply summarized, fire service deployment is about the speed and weight of response. Speed refers to initial response (first-due) resources, typically engines, ladder trucks, and ambulances, strategically deployed across a jurisdiction for response to routine moderate emergencies within a specified time interval to achieve positive outcomes. Weight refers to multiple-unit responses for more serious emergencies, such as building fires, multiple-patient medical emergencies, vehicle collisions with extrication required, or technical rescue incidents where enough firefighters must be assembled within a time interval to safely control the emergency and prevent it from escalating into a more serious event. Serious medical emergencies and building fires have the most severe time constraints.
As shown in following table, total response time performance in the City is significantly slower than best practice recommendations . For the most recent reporting year, this resulted in a first-unit call- to-arrival performance that was 4:18 minutes slower than Citygate’s 7:30-minute recommended best practice to facilitate desired outcomes in suburban communities. The City utilizes its own public safety answering point (PSAP) for both Police and Fire so it can create positive fire unit response times with effective training of dispatch personnel and an increase to on-duty station staffing.
Typical desired outcomes in suburban-density communities include preventing permanent impairment from medical emergencies where possible and confining building fires to the room or area of origin. To achieve this these desired outcomes:
The initial (first-due) unit should arrive within 7:30 to 8:30 minutes, before brain death becomes permanent and an incipient building fire expands beyond the room of origin.
Table 1 Response Time Summary by Year
City of Eden Prairie, MN Fire Department Analysis of Fire Services Standards of Cover / Staffing
The full, multiple-unit Effective Response Force (ERF) should arrive within 11:30 to 12:30 minutes, with enough personnel to safely perform all the critical tasks necessary to mitigate the emergency.
Given only two staffed fire apparatus, Citygate is concerned with the Department’s ability to provide equitable “speed of response” to large sections of the City as well as sufficient “weight of response” capacity for more serious emergencies and concurrent incident responses to achieve commonly expected outcomes in urban/suburban communities like Eden Prairie, which has more than 64,000 residents plus employment and visitors.
Citygate understands that the cadre of part-time personnel provides great value to the City and Department, but it does not meet the City’s current risk exposure needs . A combination of more full-time staff coupled with existing part-time personnel will be needed for the foreseeable future to ensure an adequate first unit “speed of response” and ERF “weight of response.”
The Department is in an advantageous position, with adequate stations and apparatus to adequately protect the City. The missing element is adequate staffing to bring the speed and weight of the response to appropriate levels for a high functioning suburban city. Three of the four current fire station locations can cover much of the City with in adequate response travel times if they are staffed. Best practice is to provide an equitable level of service to all areas of a jurisdiction with similar risk and population density. The northeast portion of the City is not yet densely populated enough, and does not have a high enough incident demand, to make a fifth fire station a priority. But the expected development in the Golden Triangle area , secondary to the light rail extension, will increase population density and Fire Department response demands.
If desired outcomes include limiting building fire damage to only part of the inside of an affected building and/or minimizing permanent impairment resulting from a medical emergency, the urban/suburban population density areas of the City will need both first-due unit and multiple-unit ERF coverage from four fire stations and a blended full-time and p art-time firefighter force to deliver Citygate’s recommended urban/suburban area response performance goal.
ADMINISTRATIVE SUPPORT STAFFING CAPACITY SUMMARY
Citygate’s review and evaluation of the Department’s administrative support organization finds that the management organization and most headquarters programs are generally adequate ly staffed and in conformance with Minnesota requirements and national best practices to provide a properly trained, equipped, and supported response force. The main exceptions are:
The Prevention Division, who are not on pace to maintain the expected interval for business and rental dwelling unit inspections.
The amount of time that full-time staff is augmenting apparatus staffing when parttime staff are not available, an increasing trend.
City of Eden Prairie, MN
Ensuring a prompt response with safe, competent service delivery requires management, planning, and compliance records . Compliance regulations for fire services operation have steadily increased over the last several decades , mandating practices for the proper hiring, training, and supervision of operational personnel.
FINDINGS AND RECOMMENDATIONS
Following are Citygate’s findings and recommendations as contained throughout this report.
Service Capacity
Findings
Finding #1: The Department’s on-duty total immediate response staffing is not appropriately scaled to protect against the hazards likely to impact the City.
Finding #2: There are space limitations at Station 1 that limit both support staff and crew staffing expansion.
Deployment
Findings
Finding #3: The City and Department have not yet established response performance goals consistent with best practice recommendations as published by the Commission on Fire Accreditation International and the National Fire Protection Association. Doing so will guide future fire crew staffing, apparat us types, and deployment methods.
Finding #4: The Department’s current deployment model provides for two, three -person crews at Station 1 daily to provide immediate response coverage for a 3 5.2 square mile service area. Additional staffing and unit capacity is provided by mutual aid from the adjacent departments or via callback of off -duty, part-time personnel as needed and available.
Finding #5: The Department has a standard response plan that considers risk and establishes an appropriate initial response for each incident type; each type of call for service receives the combination of engines, trucks, specialty units, and command officers customarily needed to effectively control that type of incident based on Department experience.
City of Eden Prairie, MN
Finding #6: The amount of call-back personnel that can be expected for any event is unpredictable with regards to amount and timeliness of the response.
Finding #7: Flying Cloud Airport has a robust volume of activity. For the 12-month period ending December 31, 2023, the airport had 146,890 aircraft operations . However, this traffic level is below that of the FAA minimum requirements for on airport specialty response.
Finding #8: The Department’s current fire station locations, if staffed, can be expected to deliver 5:00- minute first-due travel time coverage to 69.4 percent of the City’s public road miles, which is adequate for the planning of fire station locations.
Finding #9: The Department’s current fire station locations can be expected to deliver 8:00minute, multiple-unit travel time coverage to 75.3 percent of the service area’s public road miles, which is good coverage for more serious emergencies requiring multiple units from multiple stations assuming all units are available for immediate response.
Finding #10: Annual service demand peaked in 2022, dropping slightly in 2023.
Finding #11: The rate of simultaneous incidents has grown since the COVID -19 pandemic, even with a small decrease in 2023.
Finding #12: Call processing performance by the Eden Prairie Public Safety Dispatch Center is slower than any nationally recommended best practice goal and requires study and improvement.
Finding #13: Turnout times for personnel at all stations is beyond the 120 -second standard at all times of the day.
Finding #14: Urban travel times at 4:00 minutes are not possible from even four stations considering the road network across the geography. However, a 5:00 -minute travel time is appropriate for the risks in the City, if dispatch and turnout time conform to best practices.
Finding #15: Total response times from 9-1-1 answer to first-unit arrival are 4:18 minutes longer than best practice recommendations for positive outcomes in a suburban city. This is due to three reasons: (1) slow dispatch processing and (2) slow turnout times and (3) most importantly, long travel times due to partial rotating station staffing.
Finding #16: The City is not capable of fielding its self-defined effective multiple-unit response force to building fires To even assemble the required number of total personnel, the City is also dependent on mutual aid arriving quickly. The only solution is to staff more stations 24/7/365.
Finding #17: The Department’s training program is successfully maintaining the readiness component of its part- time firefighters.
Finding #18: Part-time firefighters are highly engaged in the Department’s mission and contribute a high percentage of the annual staffing deployment, offsetting nearly 1 3 full-time positions.
Finding #19: The Department is failing to maintain minimum staffing levels at an increasing rate and, at times, already is unable to produce six personnel, especially before and after the workday.
Finding #20: The tenure-based shift selection results in some crews having less time together, and overall is less experienced and prepared than those comprised of all senior members.
Finding #21: The Department’s Duty Officer program is well -supported by both full-time and part-time tenured members of the Department
Finding #22: The informal nature of the Duty Officer program makes it a transient position for subordinates that limits the opportunity for observation and engaging emerging issues in an already dynamic environment of mixed junior member crews.
Finding #23: The amount of call-back resources is robust in roster count but, in practice, not enough can be assured to build an ERF.
Finding #24: The burden on part-time firefighters is at its limit Recommendations
Recommendation #1: Adopt Deployment Policies: The City Council should adopt complete performance measures to aid deployment planning and to monitor performance. The measures of time should be designed to deliver outcomes that will prevent death or more serious injury for EMS patients upon arrival when possible and keep small but serious fires from becoming more serious. Citygate recommends the following measures .
1.1 Distribution of Fire Stations: To treat pre-hospital medical emergencies and control small fires, the first -due unit should arrive within 8:30 minutes, 90 percent of the time, from receipt of the 9-1-1 call dispatch center from four staffed fire stations. This equates to a 1:30minute call processing / dispatch time, a 2:00- minute crew turnout time, and a 5:00-minute travel time.
1.2 Multiple-Unit Effective Response Force for Serious Emergencies: To confine building fires near the room or rooms of origin, keep
City of Eden Prairie, MN
vegetation fires under one acre in size, and treat multiple medical patients at a single incident, a multiple-unit ERF of at least 12 personnel, plus mutual aid, and at least one Chief Officer, should arrive within 1 1:30 minutes from the time of 9-1-1 call receipt, 90 percent of the time, within the suburban population density areas of the City. This equates to a 1:30minute dispatch time, 2:00-minute crew turnout time, and an 8:00minute travel time.
1.3 Hazardous Materials Response: To protect the City from the hazards associated with uncontrolled release of hazardous and toxic materials, the fundamental mission of the Department’s response is to isolate the hazard, deny entry into the hazard zone, and minimize impacts on the community. This can be achieved with a first-due total response time of 8:30 minutes or less in the suburban population density areas of the City to provide initial hazard evaluation and/or mitigation actions. After the initial evaluation is completed, a determination can be made whether to request additional resources to mitigate the hazard.
1.4 Technical Rescue: To respond to technical rescue emergencies as efficiently and effectively as possible with enough trained personnel to facilitate a successful rescue, a first-due total response time of 8:30 minutes or less is required in the suburban population density a reas of the City to evaluate the situation and initiate rescue actions. Additional resources should assemble as needed , within a total response time of 12:30 minutes within the suburban population density areas of the City, to safely complete rescue/extrication and delivery of the victim to the appropriate emergency medical care facility.
Recommendation #2: Add career and part-time staffing at four stations to provide three-person shift staffing per unit, 24 hours per day, seven days per week
Recommendation #3: As soon as funds permit, develop crew space for a Duty Officer and fourth Firefighter at Station 1.
Recommendation #4: Expand the ARFF training level of key managers to monitor and anticipate airport needs with regards to response and procedures.
Recommendation #5: Develop call-processing performance standards and conduct training with the Eden Prairie Police Department 9 -1-1 Dispatchers.
Recommendation #6: Develop turnout time standards by policy and track individual response by Officer.
Recommendation #7: Adopt a 5:00-minute travel time standard to 90 percent of responses to aid in future staffing and deployment decisions and drive equity of response capability throughout Eden Prairie neighborhoods.
Administrative Support Staffing Capacity
Findings
Finding #25: Prevention is not meeting its frequency goals for existing occupancies, including rental dwelling units.
Finding #26: When the 25 percent time for staffing apparatus is deducted from the four Prevention Inspectors, the actual strength of staff focused on inspection duties is equivalent to only three FTEs.
Finding #27: The Prevention staff are at their limit and are working more hours (and managing more assignments) than they should be.
Finding #28: Inspectors staffing apparatus often resulted in missed inspection appointments or interrupted inspections due to emergency responses by the engine crew.
Finding #29: Many Building Inspectors intend to retire within the next few years; however, there is no succession plan in place for this highly technical position.
Finding #30: There is not available space for staff expansion at Station 1 without some modest remodel.
Finding #31: The Department’s training program is well organized and in lock step with the needs of the Operations Division.
Finding #32: The Department’s annual training plans includes appropriate training for the broad portfolio of services it provides the community and complies with national standards with regards to live burn and Federally required annual hazardous material response training
Finding #33: While the Department has a robust training plan, it does not have a formal succession plan for operations personnel.
Recommendations
Recommendation #8: The City should consider funding additional Fire Inspectors, or eliminate their Operations staffing responsibilities, to meet the demands of the current inspection workload, as detailed in the Inspection Workload tables provided as Appendix B.
City of Eden Prairie, MN Fire Department Analysis of Fire Services Standards of Cover / Staffing
Recommendation #9: The Department should consider expansion of office space by reconfiguration or expansion at Station 1 or moving some Training or Prevention staff to Station 4 to support recommended staffing additions.
Recommendation #10: Develop and implement a succession plan for the whole Department, including Building Inspectors, to ensure continuity of services upon retirement of the current incumbents.
COMPREHENSIVE STAFFING RECOMMENDATION AND PHASING
Based on Citygate’s comprehensive review, the Department’s current dynamic staffing model of two, three-person crews from rotating fire stations needs to be expanded to provide (1) a more equitable speed of response to all areas of the City and (2) an improved weight of response for more serious or concurrent incidents. To achieve this, Citygate recommends the City continue utilizing a modest number of full-time personnel at a minimum of four stations to provide a 24/7/365 guaranteed minimum daily response staffing level to deliver equitable access to all neighborhoods, all the time for positive outcomes when they call for help The three-to-four-station staffing plan is augmented by the existing high-value but strained part-time firefighter/EMT /EMR program, with these personnel scheduled to work or occasionally called back for major emergencies.
Citygate recommends the City consider funding additional on -duty career personnel across a phasing period of a two to four fiscal years to eventually reach a master plan result of a minimum of six to eight full-time personnel, plus a chief officer, on duty daily for supervision and incident command as summarized in the following table. The recommended staffing delivers a minimum, and when coupled with two part-time personnel at each station, can deliver safe firefighting response for speed of attack and can enter burning structures under the two-in/two-out federal and state safety standard, 1 plus provide for incident command and a pump operator.
1 Source: Metropolitan Council 2050 Preliminary Local Forecasts.
Table 2
Minimum Daily Response Staffing Model
Part-time personnel can be used for vacation and sick leave backfill as well as additional staffing at each station on high-activity days, such as busy community special events or bad weather days.
The Department also needs to address the workload demands on fire prevention if more response personnel are not added These additions can be built in phases over a few fiscal years as summarized in the previous table, ideally assisted by federal firefighter staffing grants . Once the Council provides policy direction, staff can provide the detailed expenses per fiscal year. Citygate recommends a four-year plan to recruit, train, and on -board the new and additional personnel that will be needed to achieve the recommended staffing model.
Phasing Plan
Gathering community input, designing and approving a funding plan for increased career staffing, and recruiting and hiring all take time. Given the cost and administrative burden on the City to grow and gradually obtain the full funding needed, a phasing plan is needed. The Department believes the following steps are achievable and meet Citygate’s findings and overall recommendations. Citygate offers that these steps are not to be completed on a one -step per year basis, but in logical progress across a few fiscal years. With only the two staffed crews across rotating stations, the City does not yet have the speed and weight of staffing for the risks to be protected today.
The following are career personnel changes/additions.
Step 1: Recruit additional Duty Crew firefighters within Eden Prairie and the surrounding region in 2024 and prepare a recruitment process for full- time staff to begin in 2025.
Step 2: Add three Fire Captains and three Lieutenants to stabilize staffing at two fire stations. Decrease use of Fire Inspectors, the Electronic & Communications Captain, and the Training C aptain for primary emergency response apparatus.
City of Eden Prairie, MN Fire Department Analysis of Fire Services Standards of Cover / Staffing
Reassign certain administrative functions to the fire Administrative Assistant for prevention support. Apply for SAFER Grant for additional full-time firefighters.
Step 3: Add three Battalion Chiefs, one per platoon, for 24/7/365 immediate response command and safety oversight. Begin to build effective succession planning.
Step 4: Add six Emergency Vehicle Operators (EVOs) , increasing two apparatus to two career personnel each day. Cease use of Fire Inspectors, the Electronic & Communications, and the Training Captain for primary emergency response apparatus. Begin to staff the third station with modified staffing.
Step 5: Add three Lieutenants and three EVOs to staff Station 3 with a minimum of two career personnel per day.
Step 6: Add three Lieutenants to staff Station 4 with a minimum of one career person per day. Begin to staff the fourth station with modified staffing.
Step 7: Add three EVOs to staff Station 4 with a minimum of two career personnel per day.
Step 8: Add firefighters to each station if Duty Crew firefighter recruitment and retention is ineffective to place a third crew member 24/7/365.
After Step 7, the career force will be 2 4 firefighters and three Battalion Chiefs. These personnel will staff four engines with a minimum of two career personnel plus the Battalion Chief across three shifts. The part-time staff will work scheduled assignments to provide the third and, ideally at times, a fourth firefighter on each engine 24/7/365.
NEXT STEPS
Citygate offers the following suggested sequential next steps.
Near-Term
Review and absorb the content, findings, and recommendations of this report.
Consider adopting revised response performance measures as recommended.
Ask staff to return with the detailed costs and phasing to implement the study’s recommendations as desired by the C ity Council.
Identify funding sources to begin phasing/implementation Steps 1 and 2
City of Eden Prairie, MN
Department Analysis of Fire Services Standards of Cover / Staffing
Longer-Term
Consider applying for f ederal firefighter staffing (SAFER) grants
Identify funding for the repairs or modifications needed to provide 24/7 staffing from all four fire stations.
Monitor response performance against adopted goals .
Maintain the part-time firefighter force if the needed personnel, meeting training and health standards, can be raised from the community.
SECTION 1—INTRODUCTION AND BACKGROUND
The City of Eden Prairie, Minnesota (City) Fire Department (Department) retained Citygate Associates, LLC (Citygate) to conduct an Analysis of Fire Services Standards of Cover / Staffing based on nationally recognized guidelines and best practices, federal and state mandates, and relevant local and regional operating procedures. This study will determine if there are more effective, efficient, and improved deployment models for service delivery, consistent with state of Minnesota and national best practices . Th is analysis includes a review and recommendation for fire service coverage for the City, including staffing options and funding of those options to ensure a prompt, professional response to fire, medical, and rescue emergencies.
Citygate’s Work Plan reflects Citygate’s Project Team members’ experience in fire administration and deployment. Citygate utilizes various National Fire Protection Association (NFPA) and Insurance Services Office (ISO) publications as best practice guidelines, along with the selfassessment criteria of the Commission on Fire Accreditation International (CFAI)
1.1 REPORT ORGANIZATION
This report is organized into the following sections.
Executive Summary A summary of current services and significant including all findings and recommendations. challenges,
Section 1
Section 2
Section 3
Section 4
Introduction and Background: An introduction to the study and background information about the City and Department.
Standards of Cover Assessment: An overview of the SOC process and detailed analysis of the Department’s existing deployment model, risks to be protected, emergency outcome expectations, staffing needed at different emergencies (critical tasks), geographical distribution and concentration effectiveness of fire crew locations, reliability and historical response measures effectiveness, and a concluding overall deployment evaluation.
Administrative Support Staffing Capacity Review: A review and evaluation of the Department’s administrative support staffing organization and workload capacity.
Comprehensive Recommendation and Phasing: Citygate’s phasing plan is based on extensive review and analysis and can be executed on a per-fiscal-year basis.
Appendix A
Appendix B
1.1.1 Goals of the Report
Community Risk Assessment: A comprehensive assessment of the values at risk to be protected within the community and evaluation of the fire and non-fire hazards likely to impact the service area as they relate to services provided by the Department.
Inspection Workload Tables: Tables displaying the workload distribution for Inspectors.
This report cites findings and makes recommendations, as appropriate, related to each finding. Findings and recommendations throughout this report are sequentially numbered.
This document provides technical information about how fire services are provided and legally regulated and how the Department is currently deployed and operat ing. This information is presented in the form of recommendations and policy choices for the City and Department to consider.
The result is a solid technical foundation upon which to understand the advantages and disadvantages of the choices City leadership faces regarding the best way to provide services and, more specifically, at what level of desired outcome and expense.
1.1.2 Limitations of the Report
There are no federal or state regulations mandating the level of fire service staffing, response performance, or outcomes. Through the public policy process, each community is expected to understand local fire and non-fire risks and its ability to pay for fire services, and then choose its level of services accordingly. If fire services are provided at all, federal and state regulations specify how to safely provide them, both for the public and the personnel providing services.
While this report and technical explanation can provide a framework for the discussion of Department services, neither this report nor the Citygate team can make the final decisions or cost out every possible alternative in detail. Once final policy choice s receive City Council direction, City staff can conduct any final cost and fiscal analyses as typically completed in the City’s normal operating and capital budget preparation cycle.
1.2 PROJECT APPROACH AND SCOPE OF WORK
1.2.1
Project Approach and Research Methods
Citygate utilized multiple sources to gather, understand, and model information about the City and Department. Citygate requested a large amount of relevant background data and information to better understand current costs, service levels, history of serv ice level decisions, and other prior studies.
In virtual meetings, Citygate performed focused interviews of the Department’s project team members and other project stakeholders. Citygate reviewed demographic information about the City and the potential for future growth and development. Citygate also obtained map and response data from which to model current and projected fire service deployment, with the goal to identify the location(s) of stations and crew quantities required to best serve the City as it currently exists and to facilitate future deployment planning.
Once Citygate gained an understanding of the Department’s service area and its fire and non -fire risks, Citygate developed a model of fire services that was tested against the prior response data to ensure an appropriate fit. Citygate also evaluated future City growth and service demand and evaluated potential alternative emergency service delivery models. Subsequen tly, Citygate developed an approach to address both current and longer -range needs. The result is a framework for enhancing Department services while meeting reasonable community expectations and fiscal realities.
1.2.2 Project Scope of Work
Citygate’s approach to this assessment involved:
Reviewing data and information provided by the Department and City and conducting stakeholder listening sessions with project stakeholders.
Using StatsFD™, an incident response time analysis program, to review the statistics of prior incident performance and plot the results on graphs and geographic mapping exhibits.
Using geographic mapping to model driving response time for fire stations.
Identifying and evaluating future City population and related development growth.
Recommending appropriate, risk-specific response performance goals.
Utilizing the CFAI self-assessment criteria and NFPA 1201 – Standard for Providing Emergency Services to the Public as well as other NFPA standards as the basis for evaluating the Department’s administrative support organization’s workload capacity.
1.3 SERVICE AREA OVERVIEW
The City of Eden Prairie is a suburb in the Minneapolis -St. Paul metropolitan area located 20 miles southwest of downtown Minneapolis. The City was established in 1858 and experienced rapid growth in the 1950s when Flying Cloud Airport was converted to civilian use and the construction and subsequent traffic upon Highway 494. With a land mass of 35.2 square miles, i t is bordered on the east by the Cities of Bloomington and Edina; on the north by Minnetonka; and on the west
City of Eden Prairie, MN Fire Department Analysis of Fire Services Standards of Cover / Staffing
by Chanhassen. Its southern portion of the City includes the Flying Cloud Airport and the Minnesota Valley Wildlife Refuge bordered by the Minnesota River.
The City is substantially developed and has a commercial and industrial core, including the Golden Triangle area, a regional employment center that is surrounded by residential uses of various densities. At the time of this writing, the Southwest Light Rai l Transit line is under construction that will include four stations in Eden Prairie that are anticipated to stimulate redevelopment and increase density. The City also boasts a large portfolio of parks, open space, and bodies of water.
The City provides a full range of suburban municipal services including administration, community development, fire, parks and recreation, police, and public works Eden Prairie operates under a Council-Manager form of government, with the Mayor and four council members elected at large to staggered four-year terms. The City operates under a biennial budget which is $57.52 million for fiscal year 2024 and $59.52 million for fiscal year 2025.
1.3.1
Future Growth and Development
The region’s Metropolitan Council projects the City to have 29,504 households with a population of 73,643 by the year 2040. This represents a 14.1 percent increase in population. 2
1.4 FIRE DEPARTMENT OVERVIEW
Operating under authority of the City Council and the Eden Prairie City Code, the Fire Department provides fire suppression, Basic Life Support (BLS) pre -hospital emergency medical, vehicle extrication, low-angle rope rescue, surface water and ice rescue, Aircraft Rescue Firefighting (ARFF), initial hazardous materials response, and robust fire prevention services.
1.4.1 Organization
The Department provides services with a staff of 11 full -time and 99 part-time personnel organized as shown in the following figure. One of the 11 full-time personnel is a non-sworn office assistant. The Department staffs two apparatus on a revolving sched ule that is unique to Eden Prairie in the Twin Cities region:
Monday–Friday 8:00 a.m. to 5:00 p.m. at Station 1 , with two units utilizing fulltime and part- time staffing
Any holiday at two stations utilizing part-time staffing
Monday and Wednesday 5:00 p.m. to 8:00 a.m. , Stations 1 and 3 utilizing part- time staffing
2 Source: Metropolitan Council 2050 Preliminary Local Forecasts.
Tuesday and Thursday 5:00 p.m. to 8:00 a.m. , Stations 2 and 4 utilizing part-time staffing
Weekends: Friday 5:00 p.m. to Monday 8:00 a.m.
➢ Weekend 1 : Fire Stations 1 and 3 utilizing part- time personnel
➢ Weekend 2: Fire Stations 2 and 4 utilizing part- time personnel Figure 1 Organization Chart – Eden Prairie Fire Department
1.4.2 Facilities, Response Resources
and Staffing
,
The Department provides services from a rotating set of stations with a constant deployment of two apparatus and a Duty Officer utilizing a combination of full-time and part-time personnel as summarized in the following table
Station 1 is in the central City, adjacent to City Hall, and serves as the Department’s Administrative Headquarters, training classroom, prevention, and Emergency Operations Center (EOC) Some space needs at Station 1 are limited. While the station has large areas for training and other functions, there are only crew quarters for three personnel while the remaining stations have room for four personnel. In addition, prevention does not have room for additional staff. The apparatus area includes four drive- through bays. Identified needs include upgrade of the existin g restrooms.
Station 2 is in the east portion of the City and is the busiest response district. It has crew quarters for four personnel. The apparatus area includes three bays, only one of which is drive- through. Identified needs include upgrade of the existing kitchens, bathrooms , and water heaters.
Station 3 is in the northwest corner of the City. The apparatus area includes three bays, none of which is drive-through. The Department’s boat assets are stored at this station. Identified needs include upgrade of the existing kitchens, bathrooms , and water heaters.
City of Eden Prairie, MN Fire Department Analysis of Fire Services Standards of Cover / Staffing
Station 4 is located near the west border of the City and is the least busy response district. It has crew quarters for four personnel. The apparatus area includes three drive- through bays and serves as the Department’s backup EOC and training room. While it is the newest station, identified needs include upgrade of the existing water heaters.
The apparatus fleet is maintained to a high state of cleanliness and readiness , with the appropriate tools and equipment in place on each unit to allow responding personnel to operate within the expected incident types for the City. The Department is awaiting the delivery of four engines, one ladder, and two Type 3 brush engines, keeping pace with replacement needs.
1.4.3 Service Capacity
Service capacity refers to the Department’s available response force; the size, type, and condition of its response fleet and any specialized equipment; core and specialized performance capabilities and competencies; resource distribution and concentration; availability of automatic or mutual aid; and any other agency-specific factors influencing its ability to meet current and prospective future service demand relative to the risks to be protected.
The Department’s current, daily service capacity for fire and non -fire risk consists of a combination of seven full-time and part-time (Duty Crew) personnel on duty staffing two apparatus and a Duty Officer position providing after - hours incident command support from home. In general, the Department staffs one engine and one aerial ladder truck daily. The two apparatus are staffed at Station 1 during weekday hours and alternate per a schedule at either Stations 1 and 3 or Stations 2 and 4 weeknights and weekends. Apparatus selection is further dependent upon call type with both an engine and an aerial ladder available at Stations 1 and 4. The Department also has five engines, one quint (pumper/ladder), one aerial ladder, three brush engines; one rehab/air unit; one fire boat; and one inflatable rescue boat that can be cross -staffed with on-duty or callback personnel as needed. A Duty Officer serves as the incident commander and is, at minimum, a tenured officer responding from home after hours.
All response personnel are trained to Emergency Medical Responder or Emergency Medical Technician (EMT) level with advanced variances, capable of providing Basic Life Support (BLS) pre-hospital emergency medical care. Ground ambulance service is provided by Hennepin Healthcare Emergency Medical Service, which provides ALS transport to 14 municipalities within Hennepin County.
Response personnel are also trained to the U.S. Department of Transportation Hazardous Material First Responder Operational (FRO) level to provide initial hazardous material incident assessment, hazard isolation, and support the state-sponsored Hopkins Fire Department Chemical Assessment Team. The Department maintains water and ice rescue capability utilizing two boats, side -scan sonar, and cold-water entry suits, and cooperates with the nearby Hennepin County Water Patrol. The Department’s Aircraft Rescue Fire Fighting (ARFF) training certification level for Flying
City of Eden Prairie, MN Fire Department Analysis of Fire Services Standards of Cover / Staffing
Cloud airport response is informal and at the familiarization level as they participate with the airport in joint training on a biannual basis.
All response personnel are further trained to the Confined Space Awareness and Low -Angle Rope Rescue Operations levels, with technical assistance available from the Edina Fire Department and Minnesota Task Force 1 by request as needed.
The Department has mutual aid agreements with Edina, Minnetonka, Chanhassen, Hopkins, and Bloomington for First Alarm multiple unit needs, and is a participating agency in the Minnesota Intrastate Mutual Aid Plan.
Finding #1: The Department’s on-duty total immediate response staffing is not appropriately scaled to protect against the hazards likely to impact the City.
Finding #2: There are space limitations at Station 1 that limit both support staff and crew staffing expansion.
City of Eden Prairie, MN
SECTION 2—STANDARDS OF COVER ASSESSMENT
This section provides a detailed report of the Department’s current ability to deploy and mitigate emergency hazards within its service area. The response analysis uses prior response statistics and geographic mapping to help the Department and the community visualize the capabilities and limitations of the current response system.
2.1 STANDARDS OF COVERAGE PROCESS OVERVIEW
The core methodology used by Citygate in the scope of its deployment analysis work is Standards of Cover, fifth and sixth editions, which is a systems -based approach to fire department deployment published by the CFAI. This approach uses local risk and demographics to determine the level of protection best fitting a community’s needs.
The SOC method evaluates deployment as part of a fire agency’s self -assessment process. This approach uses risk and community expectations on outcomes to help elected officials make informed decisions on fire and emergency medical services deployment levels. Citygate has adopted this multiple-part systems approach as a comprehensive tool to evaluate fire station locations. Depending on the needs of the study, the depth of the components may vary.
Such a systems approach to deployment, rather than a one -size-fits-all prescriptive formula, allows for local determination. In this comprehensive approach, each agency can match local needs (risks and expectations) with the costs of various levels of serv ice. In an informed public policy debate, a governing board “purchases” the fire and emergency medical service levels the community needs and can afford.
While working with multiple components to conduct a deployment analysis is admittedly more work, it yields a much better result than using only a singular component. For instance, if only travel time is considered and frequency of multiple calls is not, th e analysis could miss overworked companies. If a risk assessment for deployment is not considered and deployment is based only on travel time, a community could under-deploy to incidents.
The following table describes the eight elements of the SOC process.
City of Eden Prairie, MN
Table 4 Standards of Coverage Process Elements
SOC Element Description
1 Existing Deployment
2 Community Outcome Expectations
3 Community Risk Assessment
4 Critical Task Analysis
5 Distribution Analysis
6 Concentration Analysis
7 Reliability and Historical Response Effectiveness Analysis
8 Overall Evaluation
Source: CFAI, Standards of Cover, Fifth Edition
Describing the current deployment model and response performance goals the agency has in place today.
Reviewing the expectations of the community for responses to emergencies.
Identifying and quantifying the assets at risk to fire and nonfire hazards likely to impact the community. (For this report, see Appendix A—Community Risk Assessment.)
Reviewing the tasks that must be performed and the personnel required to deliver the stated outcome expectation.
Reviewing the spacing of first -due response resources (typically engines) to control routine emergencies.
Reviewing the spacing of fire stations so that more complex emergencies can receive sufficient resources and personnel in a timely manner (First Alarm Assignment or ERF).
Using prior response statistics to determine the percent of compliance the existing system delivers.
Proposing Standard of Coverage statements by risk type, as necessary.
Simply summarized, fire service deployment is about the speed and weight of the response. Speed refers to initial response (first-due), all-risk intervention resources (engines, ladder trucks, and ambulances) strategically deployed across a jurisdiction for response to emergencies within a specified time interval to control routine-to- moderate emergencies to achieve desired outcomes and prevent the incident from escalating to greater size or severity. Weight refers to multiple-unit responses for more serious emergencies, such as building fires, multiple -patient medical emergencies, vehicle collisions with extrication required, or technical rescue incidents where enough firefighters must be assembled within a reasonable time interval to safely control the emergency and prevent it from escalating into a more serious event.
The following table illustrates this deployment paradigm.
Element
Speed of Response
Table 5 Fire Service Deployment Paradigm
Description
Travel time of initial response of allrisk intervention units strategically located across a jurisdiction.
Weight of Response
Number of firefighters in a multipleunit response for serious emergencies.
Purpose
Controlling routine to moderate emergencies without the incident escalating in size or complexity.
Assembling enough firefighters within a reasonable time frame to safely control a more complex emergency without escalation.
Thus, smaller fires and less complex emergencies require a single -unit or two-unit response (fully staffed engine or specialty resource) within a relatively short response time. Larger or more complex incidents require more units and personnel to control. In either case, if crews arrive too late or the total number of personnel is too few for the emergency, the y are drawn into an escalating and more dangerous situation. The science of fire crew deployment is to spread crews out across a community or jurisdiction for quick response to keep emergencies small with positive outcomes without spreading resources so far apart that they cannot assemble quickly enough to effectively control more serious emergencies.
2.2 CURRENT DEPLOYMENT
SOC ELEMENT 1 OF 8 EXISTING DEPLOYMENT
POLICIES
Nationally recognized standards and best practices suggest using several incremental measurements to define response time. Ideally, the clock starts when the Eden Prairie Public Safety Dispatch Center receives the emergency call. In Eden Prairie, the response time clock starts with the initial time stamp in the Dispatch Center’s computer- aided dispatch (CAD) record. Response time increments include 9-1-1 call processing / dispatch, crew response unit boarding (commonly referred to as crew turnout), and actual driving (travel) time. Response performance best practices include specific time goals for each of these three increments which , when combined, equal total response time, or call-to- arrival time, which is a fire agency’s true customer service metric.
Goals should also address response performance to other risks within the City, such as hazardous materials and technical rescue, as recommended by the CFAI. The Department and City Council have not adopted formal response time standards.
The Department does have a service-level history that can be documented in response times, number of response units, and incident staffing, which are analyzed in this study.
City of Eden Prairie, MN
Fire Department Analysis of Fire Services Standards of Cover / Staffing
Currently, NFPA Standard 1710 a recommended deployment standard for career fire departments in urban/suburban areas recommends initial (first-due) intervention unit arrival within a 4:00-minute travel time and arrival of all resources comprising a multiple-unit First Alarm within an 8:00- minute travel time, all at 90 percent or better reliability. 3
If the travel time measures recommended by the NFPA and Citygate are added to dispatch processing and crew turnout times recommended by Citygate and best practices, then a realistic 90 percent first-unit total response time goal for urban/suburban response zones is 7:30 minutes from the 9-1-1 dispatch center receiving the call. This includes 1:30 minutes for call processing/dispatch, 2:00 minutes for crew turnout, and 4:00 minutes for travel.
Finding #3: The City and Department have not yet established response performance goals consistent with best practice recommendations as published by the Commission on Fire Accreditation International and the National Fire Protection Association. Doing so will guide future fire crew staffing, apparatus types, and deployment methods.
2.2.1 Current Deployment Model
The Department’s current deployment model consists of two, three-person crews at Station 1 on weekdays and two dispersed three-person crews on nights and weekends at either Stations 1 and 3 or 2 and 4. In addition, a Duty Officer positions is staffed by both full-time and part- time officers, including the Fire Chief, for incident support. This includes response from home after business hours. Additional response staffing, as needed, is provided by off -duty, part-time personnel as available when notified
Department policy requires part- time personnel to work a minimum of 108 hours per quarter. Parttime firefighters of all ranks are paid an hourly rate, and part-time Duty Crew Captains and Lieutenants are also paid a monthly stipend. In addition, the Duty Officer (excluding the Chief Officers due to being salaried employees) and on-call Fire Prevention Inspectors receive afterhours “on-call pay” and get a two-hour call-back minimum overtime payment when needed to respond.
3 Source: NFPA 1710 – Standard for the Organization and Deployment of Fire Suppression Operations, Emergency Medical Operations, and Special Operations to the Public by Career Fire Departments (20 20 Edition).
City of Eden Prairie, MN
Finding #4: The Department’s current deployment model provides for two, three-person crews at Station 1 daily to provide immediate response coverage for a 35.2-square mile service area. Additional staffing and unit capacity is provided by mutual aid from the adjacent departments or via callback of off-duty, part-time personnel as needed and available
Response Plan
The Department is an all-risk fire agency providing the community it protects with services that include fire suppression, pre-hospital BLS emergency medical, vehicle extrication, water rescue, aircraft rescue firefighting (ARFF) and initial hazardous material response. Given these risks, the Department utilizes a tiered response plan calling for different types and numbers of resources depending on incident/risk type. Other than the seven on-duty personnel, the number of off-duty, part-time personnel responding to any given call for service is unpredictable and variable depending on availability across a 24/7/365 need.
Table 6 Response Plan by Incident Type
Finding #5: The Department has a standard response plan that considers risk and establishes an appropriate initial response for each incident type; each type of call for service receives the combination of engines, trucks, specialty units, and command officers custom arily needed to effectively control that type of incident based on Department experience.
Finding #6: The amount of call-back personnel that can be expected for any event is unpredictable with regards to amount and timeliness of the response.
2.3 OUTCOME EXPECTATIONS
SOC ELEMENT 2 OF 8
COMMUNITY OUTCOME EXPECTATIONS
The SOC process begins by reviewing existing emergency services outcome expectations. This includes determining for what purpose the response system exists and whether the governing body has adopted any response performance measures. If it has, the time measures used must be understood and sound data must be available to evaluate performance.
Current national best practice is to measure percent completion of a goal (e.g., 90 percent of responses) instead of an average measure. Mathematically, this is called a fractile measure. 4 Measuring the average only identifies the central or middle point of response time performance for all calls for service in the data set. Using an average makes it impossible to know how many incidents had response times that were far above or just above the average.
For example, the following figure shows response times for a fictitious fire department. This small agency receives 20 calls for service each month, and each response time has been plotted on the following graph from shortest response time to longest respo nse time. The graph shows the average response time is 8.7 minutes. However, the average response time fails to properly account for four calls for service with response times far exceeding a threshold in which positive outcomes could be expected. In fact, it is evident in that 20 percent of responses are far too slow and that this jurisdiction has a potential life-threatening service delivery problem. Average response time as a measurement tool for fire services is simply not sufficient. This is a signific ant issue in larger cities if hundreds or thousands of calls are answered far beyond the average point.
4 A fractile is that point below which a stated fraction of the values lie. The fraction is often given in percent; the term percentile may then be used.
City of Eden Prairie, MN
By using the fractile measurement with 90 percent of responses in mind, this small example jurisdiction has a response time of 18:00 minutes, 90 percent of the time. This fractile measurement is far more accurate at reflecting the service delivery situatio n of this small fictitious agency.
Figure 2 Example of Fractile versus Average Response Time Measurements

More importantly, within the SOC process, positive outcomes are the goal. From that, crew size and response time can be calculated to allow appropriate fire station spacing (distribution and concentration).
Emergency medical incidents include situations with the most severe time constraints. The human brain can only survive 4:00 to 6:00 minutes without oxygen. Cardiac arrest and other events can cause oxygen deprivation to the brain. While cardiac arrests make up a small percentage, drowning, choking, trauma constrictions, or other similar events have the same effect. In a building fire, a small incipient fire can grow to involve the entire room in a 3:00- to 5:00-minute time frame
If fire service response is to achieve positive outcomes in severe emergency medical situations and incipient fire situations, all responding crews must arrive, assess the situation, and deploy effective measures before brain death occurs or the fire sprea ds beyond the room of origin.
City of Eden Prairie, MN
Thus, from the time the 9-1-1 call is received by the dispatch center , an effective deployment system is beginning to manage the problem within a 7:00 to 8:00-minute total response time. This is right at the point that brain death is becoming irreversible, and the fire has grown to the point of leaving the room of origin and becoming very serious. Thus, the City needs a first-due response goal that is within a range to give hope for a positive outcome. It is important to note that the fire or medical emergency continues to deteriorate from the time of inception, not from the time the fire engine starts to drive the response route. Ideally, the emergency is noticed immediately, and the 9-1-1 system is activated promptly. In the best of circumstances, this step of awareness calling 9-1-1 and giving the dispatcher accurate information takes 1:00 minute. Crew notification and travel time take additional minutes. Upon arrival, the crew must approach the injured party or emergency, assess the situation, and appropr iately deploy its skills and tools. Even in easy -toaccess situations, this step can take 2:00 minutes or more. This time frame may be increased considerably due to long driveways, apartment buildings with limited access, multiple -story apartments or office complexes, or shopping centers
Unfortunately, there are times when the emergency has become too severe, even before the 9 -1-1 notification or fire department response, for the responding crew to reverse; however, when an appropriate response time policy is combined with a well-designed deployment system, then only anomalies like bad weather, poor traffic conditions, or multiple emergencies slow down the response system. Consequently, a properly designed system will give the public hope of a positive outcome for their tax dollar expenditure.
For this report, total response time is the sum of 9-1- 1 call processing / dispatch, crew turnout, and travel time, which is consistent with CFAI and NFPA best practice recommendations.
2.4 COMMUNITY RISK ASSESSMENT
The third element of the SOC process is a community risk assessment. Within the context of an SOC study, the objectives of a community risk assessment are to:
Identify the values at risk to be protected within the community or service area.
SOC ELEMENT 3 OF 8 COMMUNITY RISK ASSESSMENT
Identify the specific hazards with the potential to adversely impact the community or service area.
Quantify the overall risk associated with each hazard.
Establish a foundation for current/future deployment decisions and riskreduction/hazard mitigation planning and evaluation.
City of Eden Prairie, MN
A hazard is broadly defined as a situation or condition that can cause or contribute to harm. Examples include fire, medical emergency, vehicle collision, earthquake, flood, etc. Risk is broadly defined as the probability of hazard occurrence in combination with the likely severity of resultant impacts to people, property, and the community.
2.4.1 Risk Assessment Methodology
The methodology employed by Citygate to assess community risks as an integral element of an SOC study incorporates the following elements:
Identification of geographic planning sub-zones (risk planning zones) appropriate to the community or jurisdiction.
Identification and quantification, to the extent data is available, of the values at risk to various hazards within the community or service area.
Identification of the fire and non-fire hazards to be evaluated.
Determination of the probability of occurrence for each identified hazard.
Determination of probable impact severity of a hazard occurrence by risk planning zone.
Determination of overall risk by hazard and risk planning zone.
2.4.2 Values at Risk to Be Protected
Broadly defined, values at risk are those tangibles of significant importance or value to the community or jurisdiction that are potentially at risk of harm or damage from a hazard occurrence. Values at risk typically include people, critical facilities/infrastructure, buildings, and ke y economic, cultural, historic, and natural resources.
People
Residents, employees, visitors, and travelers through a community or jurisdiction are vulnerable to harm from a hazard occurrence. Particularly vulnerable are specific at -risk populations, including those unable to care for themselves or self -evacuate in the event of an emergency. Key demographic data for the City includes:
Nearly 27 percent of the population is under 10 years or over 65 years of age.
Of the population over 24 years of age, more than 97 percent has completed high school or equivalency.
City of Eden Prairie, MN
Of the population over 24 years of age, more than 75 percent has an undergraduate, graduate, or professional degree.
Of the population 15 years of age or older, nearly 97 percent is in the workforce; of those, 3.3 percent are unemployed.
Median household income is slightly more than $165,000.
The population below the federal poverty level is slightly more than 5 percent.
Only 3.6 percent of the population does not have health insurance coverage
Critical Facilities
The U.S. Department of Homeland Security defines critical infrastructure and key resources (CIKR) as those physical assets essential to the public health and safety, economic vitality, and resilience of a community, such as lifeline utilities infrastructure, telecommunications infrastructure, essential government services facilities, public safety facilities, schools, hospitals, airports, etc. For this assessment, the Department identified 94 critical facilities. A hazard occurrence with significant impact severity affecting one or more of these facilities would likely adversely impact critical public or community services.
Buildings
The City has mor e than 26,000 residential housing units and nearly 2,800 businesses including manufacturing, research, technology, office, professional services, retail sales, restaurants/bars, motels, churches, schools, storage, government facilities, healthcare facilities, and other business types as described in Appendix A
2.4.3 Hazard Identification
Citygate utilized prior risk studies where available, fire and non -fire hazards as identified by the CFAI, and agency/jurisdiction-specific data and information to identify the hazards to be evaluated for this study.
Following an evaluation of the hazards identified in the 2024 Hennepin County All-Jurisdiction Hazard Mitigation Plan and the fire and non-fire hazards as identified by the CFAI as they relate to services provided by the Department
City of Eden Prairie, MN
Citygate evaluated the following seven hazards for this risk assessment:
Building Fire
Vegetation/Wildland Fire
Medical Emergency
Hazardous Material Release/Spill
Technical Rescue
Marine Incident
Aviation Incident

Because building fires and medical emergencies have the most severe time constraints if positive outcomes are to be achieved, the following is a brief overview of building fire and medical emergency risk. Appendix A contains the full risk assessment for all seven hazards.
Building Fire Risk
One of the primary hazards in any community is building fire. Building fire risk factors include building density, size, age, occupancy, and construction materials and methods, as well as the number of stories, the required fire flow, the proximity to othe r buildings, built-in fire protection/alarm systems, an available fire suppression water supply, building fire service capacity, fire suppression resource deployment (distribution/concentration), staffing, and response time.
The following figure illustrates the building fire progression timeline and shows that flashover, which is the point at which the entire room erupts into fire after all the combustible objects in that room reach their ignition temperature, can occur as early as 3:00 to 5:00 minutes from the initial ignition. Human survival in a room after flashover is extremely improbable.
City of Eden Prairie, MN
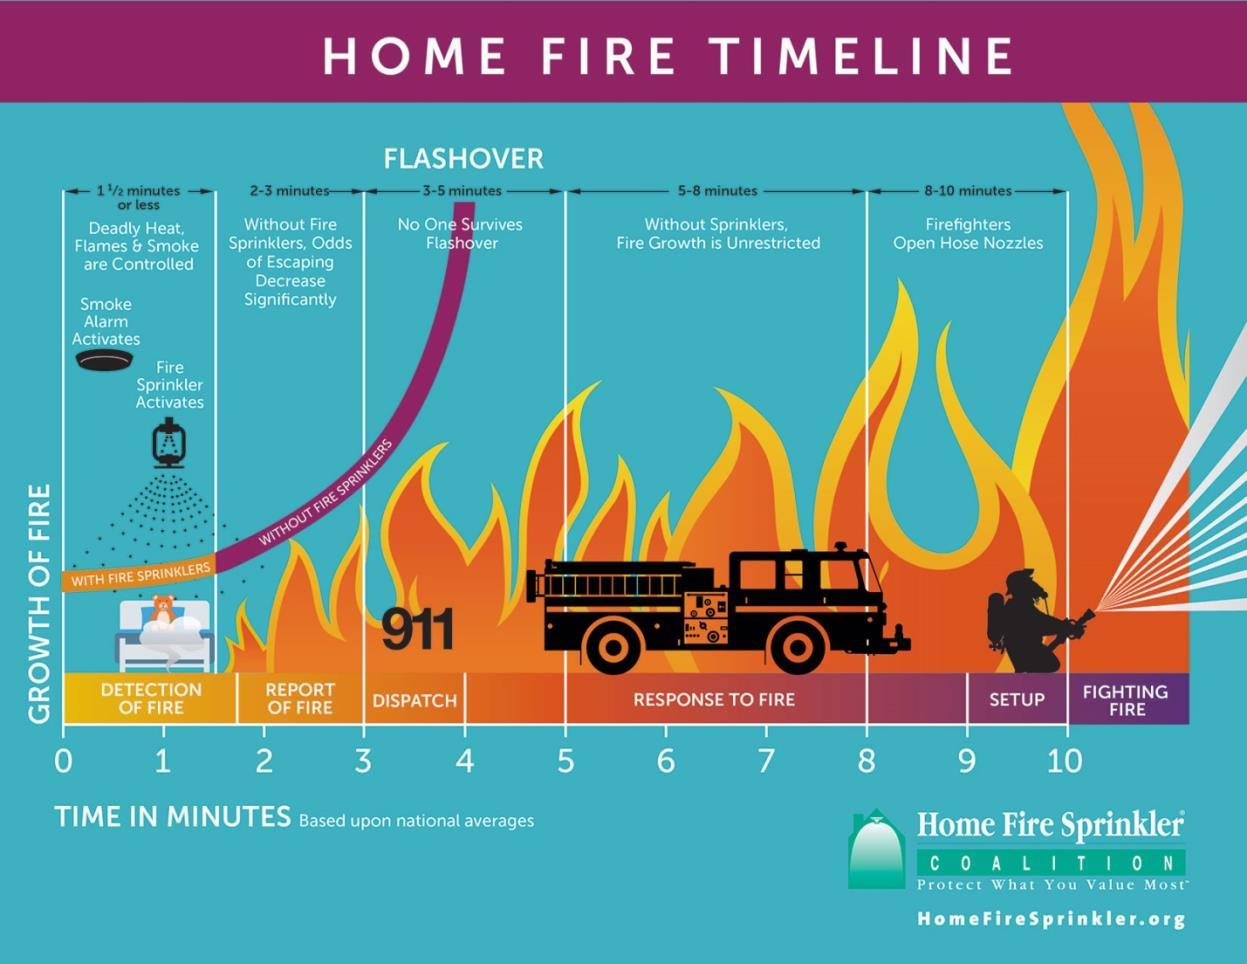
Source: http://www.firesprinklerassoc.org
Medical Emergency Risk
Fire agency service demand in most jurisdictions is predominantly for medical emergencies. The following figure illustrates the reduced survivability of a cardiac arrest victim as time to defibrillation increases.
Figure 3 Building Fire Progression Timeline
City of Eden Prairie, MN

The Department currently provides B LS pre-hospital emergency medical services, with operational personnel trained to the EM R or EMT- B level. The historical EMS first responder program in most of Minnesota originates with police departments. This occurred as volunteer fire departments could not always achieve volunteer response from home or work quickly enough. Therefore, a police officer on a patrol beat was usually closer and more readily available to respond to EMS incidents. Ambulance service areas are managed by the State, and typically one private provider serves an area. For Eden Prairie, ground ambulance service is provided by Hennepin Healthcare Emergency Medical Service, which provides ALS transport to 14 municipa lities within Hennepin County. While many cities and fire districts in the State would like to directly provide ambulance care, they cannot do so without changes to State legislation or competing in ambulance operating area contract rebids against entrenched providers.
2.4.4 Risk Assessment Summary
The City’s overall risk for six hazards related to emergency services provided by the Department range from Low to High, as summarized in the following table. See Appendix A for the full risk assessment.
Figure 4
Rate versus Time of Defibrillation
Table 7 Overall Risk by Hazard
Finding #7: Flying Cloud Airport has a robust volume of activity. For the 12month period ending December 31, 2023, the airport had 146,890 aircraft operations. However, this traffic level is below that of the FAA minimum requirements for on airport specialty response.
2.5 CRITICAL TASK TIME MEASURES—WHAT MUST BE DONE OVER WHAT TIME FRAME TO ACHIEVE THE STATED OUTCOME EXPECTATION?
SOC ELEMENT 4 OF 8 CRITICAL TASK T IME STUDY
SOC studies use critical task information to determine the number of firefighters needed within a time frame to achieve desired obj ectives on fire and emergency medical incidents. Table 8 and Table 9 illustrate critical tasks typical of building fire and medical emergency incidents, including the minimum number of personnel required to complete each task. These tables are composites from Citygate clients in urban/suburban departments like Eden Prairie, with units staffed with three or four personnel per engine or ladder truck.
It is important to understand the following relative to these tables:
It can take a considerable amount of time after a task is ordered by command to complete the task and achieve the desired outcome.
Task completion time is usually a function of the number of personnel that are simultaneously available. The fewer firefighters available, the longer some tasks will take to complete. Conversely, with more firefighters available, some tasks are completed concurrently.
City of Eden Prairie, MN
Some tasks must be conducted by a minimum of two firefighters to comply with safety regulations. For example, two firefighters are required to search a smokefilled room for a victim.
2.5.1 Critical Firefighting Tasks
The following table illustrates the critical tasks required to control a typical single -family dwelling fire with five response units four engines, one ladder truck, two utility units, one Chief Officer, and one inspector from the City and (as needed) mutual aid partners for a total Effective Response Force (ERF) of 19 personnel. These tasks are taken from typical fire departments’ operational procedures, which are consistent with the customary findings of other agencies using the SOC process. Though under revision, at this writing no conditions exist to override the Occupational Safety and Health Administration (OSHA) two -in/two-out safety policy, which requires that firefighters enter atmospheres such as building fires that are immediately dangerous to life and health in teams of two while two more firefighters are outside and immediately ready to rescue them should trouble arise.
Scenario: Simulated approximately 2,000 square-foot, two-story, single-family residential fire with unknown rescue situation. Responding companies receive dispatch information typical for a witnessed fire. Upon arrival, they find approximately 50 percent of the second floor involved in fire.
8 First Alarm Residential Fire Critical Tasks – 19 Personnel
Grouped together, the duties form an ERF, or First Alarm Assignment. These distinct tasks must be performed to effectively achieve the desired outcome; arriving on scene does not stop the emergency from escalating. While firefighters accomplish these tasks , the incident progression clock keeps running.
Many studies have shown that a small fire can spread to engulf an entire room in 3:00 to 5:00 minutes after free burning has started. Once the room is completely superheated and involved in fire (known as flashover), the fire will spread quickly both vertically and horizontally throughout the structure. For this reason, it is imperative that fire suppression and search/rescue operations commence before the flashover point occurs if the outcome goal is to keep the fire damage in or
City of Eden Prairie, MN
near the room of origin and to rescue persons unable to self - evacuate. In addition, flashover presents a life-threatening situation to both firefighters and any occupants of the building. Fire fatalities typically include persons under 10 and over 65 years of age and unable to self -evacuate, and nearly 27 percent of the City’s population falls within those age groups.
2.5.2 Critical Medical Emergency Tasks
The Department responds to approximately 2,000 EMS incidents annually, including vehicle accidents, strokes, heart attacks, difficulty breathing, falls, childbirths, and other medical emergencies.
For comparison, the following table summarizes the critical tasks required for a cardiac arrest patient.
2.5.3 Critical Task Analysis and Effective Response Force Size
What does a deployment study derive from a critical task analysis? The time required to complete the critical tasks necessary to stop the escalation of an emergency (as shown in Table 8 and Table 9) must be compared to outcomes. As stated, after approximately 3:00 to 5:00 minutes of free burning a room, fire will escalate to the point of flashover. At this point, the entire room is engulfed in fire, the entire building becomes threatened, and human survival near or in the room of fire
Table 9 Cardiac Arrest Critical Tasks – One Engine + Ambulance (5 Personnel)
City of Eden Prairie, MN
Fire Department Analysis of Fire Services Standards of Cover / Staffing
origin becomes impossible. Additionally, brain death begins to occur within 4:00 to 6:00 minutes of the heart stopping. Thus, the ERF must arrive in time to prevent these emergency events from becoming worse.
The Department’s daily on-duty staffing is insufficient to deliver a recommended ERF of 19 firefighters to a building fire, 5 which the statistical analysis of this report will discuss in detail. Mitigating an emergency event is a team effort once the units have arrived. This refers to the weight of response analogy: if too few personnel arrive too slowly, the emergency will escalate instead of improving. The outcome times, of course, will be longer and yield less -desirable results if the arriving force is later or smaller.
The number of personnel and the arrival timeframe can be critical in a serious fire. Fires in older or multiple-story buildings could require the initial firefighters to rescue trapped or immobile occupants. If the ERF is too small, rescue and firefighting operations cannot be conducted simultaneously. Thus, achieving good performance requires adequate staffing (and training).
Fires and complex medical incidents require additional units to arrive in time to complete an effective intervention. Time is one factor that comes from proper station placement and the staffing model used. Wh en fire stations are spaced too far apart and one unit must cover another unit’s area or multiple units are needed, the units may be too far away, and the emergency will escalate and result in a less-than- desirable outcome. When only one, or a subset of fire stations are staffed, response times are frequently inadequate to meet the speed or weight metrics outlined previously.
Previous critical task studies conducted by Citygate and NFPA Standard 1710 identify that all units need to arrive at a building fire with a minimum of 16–17 firefighters within 11:30 minutes (from the time of 9-1-1 call) to simultaneously and effectively perform the tasks of rescue, fire suppression, and ventilation.
If fewer firefighters arrive, all tasks may not be completed. Most likely, the search team would be delayed, as would ventilation. The attack lines would only consist of two firefighters, which does not allow for rapid movement of the hose line above the first floor in a multiple -story building. Because rescue is conducted with at least two two-person teams, when rescue is essential, other tasks are not completed in a simultaneous, timely manner. Therefore, effective deployment is about the speed (travel time) and the weight (number of firefighters) of the response.
5 Source: NFPA 1710 – Standard for the Organization and Deployment of Fire Suppression Operations, Emergency Medical Operations, and Special Operations to the Public by Career Fire Departments (20 20 Edition).
City of Eden Prairie, MN Fire Department Analysis of Fire Services Standards of Cover / Staffing
While the desired 19 initial response personnel (utilizing part- time recall and mutual aid) may manage a moderate-risk, confined residential fire, even a full ERF of 19 personnel will be seriously slowed if the fire is above the first floor in a low -rise apartment building or commercial/industrial building. This is where the capability to add additional personnel and resources to the standard response becomes critical.
The fact that it takes the Department 20:00 to 24:00 minutes to (most of the time) deliver an ERF of not even 13–14 personnel to a moderate-risk building fire reflects a real-world difficulty as it relates to confining serious building fires to or near the room of origin and prevent ing the spread of fire to adjoining buildings. This is a typical desired outcome in urban/suburban areas and requires more firefighters, more quickly than the typical rural outcome of keeping the fire contained to the building, not room, of origin.
2.6 DISTRIBUTION AND CONCENTRATION STUDIES—HOW THE LOCATION OF FIRST -DUE AND FIRST ALARM RESOURCES AFFECTS EMERGENCY INCIDENT OUTCOMES
SOC ELEMENT 5 OF 8 DISTRIBUTION STUDY
SOC ELEMENT 6 OF 8 CONCENTRATION STUDY
The City is currently served by four fire stations , with Station 1, nearest the center of the City, staffed most hours of the day with a three-person Duty Crew and a threeperson career Crew simultaneously working staff positions. After business hours , all staffing shifts to part-time on
weekdays and on weekends, and two apparatus at either Stations 1 and 3 or Stations 2 and 4. More serious incidents rely on either mutual aid response or response from the return of part-time firefighters from their homes or work as available.
It is appropriate to understand, using geographic mapping tools, what the existing stations do and do not cover within travel time goals; if there are any coverage gaps needing one or more stations; and what, if anything, to do about them.
In brief, there are two geographic perspectives to fire station deployment:
Distribution – the spacing of first-due fire units to control routine emergencies before they escalate and require additional resources.
Concentration – the spacing of fire stations sufficiently close to each other so that more complex emergency incidents can quickly receive sufficient resources from multiple fire stations. As indicated, this is known as the Effective Response Force (ERF) or, more commonly, the First Alarm Assignment the collection of a sufficient number of firefighters on scene, delivered within the concentration time goal to stop the escalation of the problem.
City of Eden Prairie, MN
To analyze first-due fire unit travel time coverage, Citygate used a geographic mapping tool that measures theoretical travel time over a street network. For this calculation, Citygate used the base map and street travel speeds calibrated to actual fire ap paratus travel times from previous responses to simulate real-world travel time coverage. Using these tools, Citygate ran several deployment tests and measured their impact on various parts of the City. A 4:00 -minute first-due and 8:00minute ERF travel time were used, consistent with best practice response performance goals for positive outcomes in urban areas.
2.6.1 Deployment Baselines
Map #1 – General Geography, Station Locations, and Response Resource Types
Map #1 shows the Department’s service area boundary and fire station locations. This is a reference map for other maps that follow. Station symbols denote the type of fire apparatus available at each station.
Map #2 – Risk Assessment: Planning Zones
Map #2 shows the four risk planning zones used for this study, as recommended by the CFAI, which are the same as each station’s initial (first-due) response area.
Map #2a – Risk Assessment: Population Density
Map #2a shows the resident population density across the service area. People drive EMS incident demand, so the highest population density areas are typically the highest EMS demand locations. The highest density areas are in proximity to Stations 1 and 2, which are in the central and southeastern sections of the City.
Map #3 – Distribution: 4:00-Minute First-Due Travel Time Coverage
Map #3 shows the 46.8 percent of the service area’s total public road miles that a fire engine should be expected to reach within 4:00 minutes of travel time assuming the respective engine is in station and encounters no traffic congestion. As can be seen, there are very large areas throughout the City beyond 4:00 minutes of travel time from an existing station, making it less probable that desired outcomes can be achieved in those areas.
The purpose of response time modeling is to determine response time coverage across a jurisdiction’s geography and station locations. This geo -mapping design is then validated against dispatch time data to reflect actual response times. Ideally, there shou ld be some overlap between station areas so that a second-due unit can have a chance of an acceptable response time when it responds to a call in a different station’s first-due response area.
City of Eden Prairie, MN
Map #3a – Distribution: 5:00-Minute First-Due Travel Time Coverage (with Automatic Mutual Aid)
Map #3a shows a 22.5 percent increase in 4:00- minute travel time coverage with an additional minute of travel time, most notably along street segments in the outlying sections of the City and the Golden Triangle area.
Map #4 – Insurance Services Office (ISO) 1.5 -Mile Coverage Areas
Map #4 displays the former ISO recommendation that urban stations cover a 1.5 - mile distance response area. Depending on a jurisdiction’s road network, the 1.5 -mile measure usually equates to a 3:30- to 4:00-minute travel time. However, a 1.5 -mile measure is a reasonable indicator of station spacing and overlap. The 1.5 -mile ISO coverage is somew hat like the 4:00- minute firstdue coverage in Map #3.
Map #5 – Concentration: Minimum ERF 8:00-Minute Travel Time Coverage
Map #5 shows the 75.3 percent of the service area’s public street segments where the Department’s current response plan should deliver an initial minimum ERF of the City-staffed two engines, one ladder truck, and a Duty Officer within 8:00 minutes of travel time without traffic congestion. As can be seen, this is very good ERF coverage to facilitate desired outcomes for more serious incidents requiring multiple units.
Map #6 – 8:00-Minute Ladder Truck Travel Time Coverage
Map #6 shows, in green, 8:00-minute travel time coverage for a ladder truck from Stations 1 and 4. As can be seen, coverage includes most of the built -up areas of the City, indicating that these specialized resources are appropriately located to serve the largest, most built -up sections of the service area within the desired 8:00-minute travel time goal.
Map #7 – 8:00-Minute Duty Officer Travel Time Coverage
Map #7 shows the 8:00-minute travel time coverage for a Duty Officer responding from Station 1, indicating most built-up sections of the service area within the desired 8:00 -minute travel time goal.
Map #8 – All Incident Locations
Map #8 shows the locations for all types of responses Citywide. It is apparent from this view that across four years, most streets request a variety of Fire Department response services.
Map #9 – Emergency Medical Services and Rescue Incident Locations
Map #9 shows the emergency medical and rescue incident locations over the four-year study period. With approximately 63.1 percent of all calls for service being EMS -related, this map illustrates the need for pre-hospital emergency medical services.
Map #10 – All Fire Locations
Map #10 shows the location of all fires within the service area over the four-year period. All fires include any type of fire call, from vehicle to dumpster to building. While there are obviously fewer fires than medical or rescue calls, this map illustrates that fires occur throughout the entire service area.
Map #11 – Building Fire Locations
Map #11 displays the location of all 155 building fire incidents over the four-year study.
Map #12 – Emergency Medical Services and Rescue Incident Location Densities
Map #12 shows, by mathematical density, where clusters of 7,902 EMS and rescue incident activity occurred over the four data years. The darker density color plots the highest concentration of EMS/rescue incidents which predictably coincides with the higher population densities in the City. This type of map makes the location of frequent workload more meaningful than simply mapping the locations of all EMS/rescue incidents, as was shown in Map #9.
This perspective is important because the deployment system needs an overlap of units to ensure the delivery of multiple units when needed for more serious incidents or to handle simultaneous calls for service.
Map #13 – All Fire Location Densities
Map #13 is like Map #12 but shows the hot spots of activity for all types of fires. The density of these incidents is greater in the higher building and population density areas of the City.
Map #14 – Structure Fire Location Densities
Map #14 is like Map #11 but shows the hot spot locations for the 155 structure fires during the four-year study period.
2.6.2 Travel Time Road Mile Coverage Measures
In addition to the visual displays of travel time coverage the maps provide, GIS software also calculates the miles of public streets covered at 4:00 and 8:00 minutes, as shown in the following table.
As the previous table shows, only 46.8 percent of the service area’s public road network can be reached from the current fire station locations within 4:00 minutes of travel time, which makes achieving desired outcomes more difficult. However, in only one more minute of travel, at 5:00 minutes, the coverage increases to 69.4 percent, which is acceptable given the curvilinear street layout over the rolling topography of the C ity.
The 75.3 percent 8:00-minute multiple-unit travel time coverage would be very good and should facilitate achieving desired outcomes for more serious incidents requiring a full ERF response if sufficient on-duty staffing is available at each station.
2.6.3 Mapping Coverage Findings
Finding #8: The Department’s current fire station locations , if staffed, can be expected to deliver 5:00-minute first-due travel time coverage to 69.4 percent of the City’s public road miles, which is adequate for the planning of fire station locations.
Finding #9: The Department’s current fire station locations can be expected to deliver 8:00-minute, multiple-unit travel time coverage to 75.3 percent of the service area’s public road miles, which is good coverage for more serious emergencies requiring multiple units from multiple stations assuming all units are available for immediate response.
2.7 STATISTICAL ANALYSIS
SOC ELEMENT 7 OF 8 RELIABILITY AND HISTORICAL RESPONSE EFFECTIVENESS STUDIES
The maps described in Section 2.6 and presented in Volume 2 show the ideal situation for response times and response effectiveness given perfect conditions with no competing calls, units out of place, or simultaneous calls for service. Examination of the actual response time data provides a picture of actual response performance with simultaneous calls, rush hour traffic congestion, units out of position, and delayed travel time for events such as periods of severe weather. The following subsections provide summary statistical information regarding the Department and its se rvices.
The Department provided both NFIRS 5 incident data and records management system (RMS) apparatus response data for the period 01/01/2020 – 12/31/2023. These two datasets were merged, providing 12,531 incidents and 18,417 apparatus response records.
2.7.1 Demand for Service
The Department responded to 3,268 incidents in 2023. During this period, Eden Prairie had a daily demand of 8.95 incidents, of which 1.59 percent were fire incidents, 65.79 percent were to EMS incidents, and 32.62 percent were to “Other” incident types. During this same period there were 4,661 apparatus responses. This means there was an average of 1.43 apparatus responses per incident.
The following figure shows annual service demand for the four most recent reporting years.

Figure 5 Annual Service Demand by Year
City of Eden Prairie, MN
Finding #10: Annual service demand peaked in 2022, dropping slightly in 2023.
The following figure illustrates annual service demand by general incident type over the four-year period studied. While the number of EMS incidents continues to grow, the number of Fire incident types has held relatively steady. EMS incidents peaked in 2022 while fire incidents peaked in 2022.

The following graph illustrates the number of incidents by station for the four years of the analysis. Station 2 had the highest activity while Station 4 had the lowest.
Figure 6 Annual Service Demand by Incident Type
Figure 7 Service Demand by Hour of Day and Year

The following graph illustrates the breakdown of incidents by hour of the day by year. There was a large increase in incident volume during early evening hours in 2022.
8 Number of Incidents by Hour by Year

Figure
City of Eden Prairie, MN
The following table ranks service demand by incident type for those with more than 20 occurrences in the last data year.
The following table ranks service demand by property use type for those with more than 25 occurrences over the four-year period studied by Citygate Note the high rankings of residential dwellings, nursing homes and board and care facilities.
City of Eden Prairie, MN
Table 12 Service Demand by Property Use
2.7.2 Simultaneous Incident Activity
Simultaneous incidents occur when one or more incidents are underway when a new incident begins. During 2023, 17.63 percent of the City’s incidents occurred while one or more other incidents were underway.
The following table summarizes simultaneous incident activity for 2023.
Table 13 Simultaneous Incident Activity (2023)
The following figure illustrates the number of simultaneous incidents by year.
Figure 9 Simultaneous Incident Activity by Year

Finding #11: The rate of simultaneous incidents has grown since the COVID-19 pandemic, even with a small decrease in 2023.
The following graph illustrates the number of single- station simultaneous incidents by station area by year. Station 2 has the greatest number of single-station area simultaneous incidents.
Figure 10
Number of Single-Station Simultaneous Incidents by Station by Year

2.7.5 Operational Performance
The following tables report the performance for the first apparatus to arrive on the scene for NFIRS-coded fire and EMS emergency incidents only. These measures are the number of minutes and seconds necessary for 90 percent completion of the following components
Call processing / dispatch
Crew turnout
Travel
Dispatch to arrival
Call to arrival
In the measures to follow, only Fire and EMS incidents are used. This ensures an analysis of the most acute emergencies. Most component analyses include a year - to-year comparison, followed by a representation of 90 percent compliance by hour of day, and a graph showing performance by fractile time segment.
2.7.6 Call Processing / Dispatch
Call processing measures the time from the first incident timestamp until apparatus are notified of the request for assistance. Call processing performance depends on what is being measured. If the first incident timestamp takes place at the time the PSAP receives a 9-1-1 call, then call processing
City of Eden Prairie, MN
includes PSAP time as well as dispatch handling time. Otherwise, the performance represents only a portion of the entire processing operation.
In addition, not all requests for assistance are received via 9-1-1. Generally, there will be a mix of channels for receiving requests for assistance. Each channel will have a timestamp at a different point in the processing operation. This is not as much of a factor if many requests are received via 9-1-1 PSAP.
Call processing times degraded slightly in 2022 and 2023 In general, t imes are much longer than the desired 90-second goal for this phase of response.
Table 14 Call Processing / Dispatch Performance by Year
The following figure shows consistent hourly compliance of approximately 50 to 65 percent.

Year
The following figure illustrates fractile call processing / dispatch time performance. The peak segment for call processing occurs at 75 seconds. However, there are many emergency incidents where call processing takes much longer than 75 seconds.
Figure 11 Call Processing / Dispatch Compliance (2023)

Finding #12: Call processing performance by the Eden Prairie Public Safety Dispatch Center is slower than any nationally recommended best practice goal and requires study and improvement.
2.7.7 Turnout Time
Turnout time measures the time from apparatus notification until apparatus starts traveling to the scene. A 2:00-minute goal is used for measurement. The following table illustrates that turnout time is not meeting a 2:00-minute goal.
Table 15 Turnout Time by Station by Year
The following table shows a breakdown by time of day for all responses in 2023. AM1 is from midnight to 05:59am, AM2 from 06:00–11:59am, PM1 from 12:00pm–05:59pm and finally PM2 is from 06:00pm–11:59pm.
Figure 12 Call Processing / Dispatch Fractile Analysis (2023)
City of Eden Prairie, MN
Table 16 Turnout Time by Station by Time Block (2023)
Turnout times exceed the 2:00- minute goal for most hours except for the small group of calls at Station 1 in the afternoon and Station 4 in the late evening. The following figure illustrates turnout time compliance with the 2:00-minute turnout time goal. There is a significant decrease in performance during early morning hours.
Figure 13 Turnout Compliance by Hour (2023)

The following graph illustrates fractile turnout time performance. Most incident responses accomplish turnout within 2:00 minutes.
Figure 14 Turnout Time Compliance by 15-Second Increment (2023)

Finding #13: Turnout times for personnel at all stations is beyond the 120second standard at all times of the day.
2.7.7 Travel Time
Travel time measures time to travel to the scene of the emergency. In most urban and suburban jurisdictions, a 4:00-minute travel time 90 percent of the time would be considered highly desirable. The following table shows that no station achieved that standard
Table 17 Travel Time by Station by Year
The best overall travel time performance is in Station 1 , with 2,076 incidents and 3:36 minutes deficient, while with nearly twice the call volume (3,815), Station 2 comes in at 8:17 minutes.
The following figure illustrates the percentage of calls for 2023 that met the 4:00 minute travel time standard for each hour of the day.
of Eden Prairie, MN
15 Travel Time Compliance by Hour (2023)

Travel time compliance is consistently below 40 percent, with decreases below 20 percent. The following graph illustrates fractile travel time performance. 300 seconds (or 5:00 minutes) is the peak segment for travel time performance. There is, however, a significant number or incidents after the 300-second mark.
16 Travel Time Fractile by 30-Second Increment (2023)
Fractile for Incidents Travel - Last Year
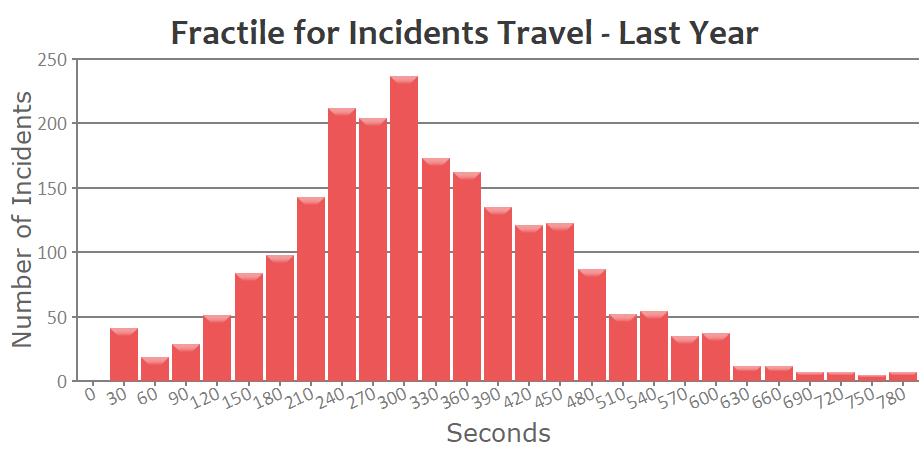
Figure
Figure
City of Eden Prairie, MN
This indicates while many incidents can be reached within the first 5:00 minutes, there are still a very significant number of incidents that require much longer response times.
Finding #14: Urban travel times at 4:00 minutes are not possible from even four stations considering the road network across the geography. However, a 5:00- minute travel time is appropriate for the risks in the City, if dispatch and turnout time conform to best practices.
2.7.7 Call to Arrival
Call to arrival measures the time interval from receipt of the 9-1-1 call until the first response apparatus arrives at the emergency incident and is a fire agency’s true customer service measure. Best-practice-based goals are 1:30 minutes for call processing, 2:00 minutes for crew turnout, and 4:00 minutes for travel for a total call- to-arrival time of 7:30 minutes.
18 Call-to-Arrival Performance by Year
As the table shows, call-to- arrival performance has been consistent ly deficient over the four-year period studied by Citygate, and was 4:18 minutes slower than a 7:30-minute best practice goal for urban/suburban areas in 2023
The following figure illustrates a roughly flat call -to-arrival compliance, with slightly poorer performance in the early morning hours.
Table

The following figure illustrates fractile call- to-arrival performance. 8:00 minutes is the peak segment. The right-shifted graph indicates a high number of incidents with longer call -to- arrival times.

Figure 17 Call-to-Arrival Compliance (2023)
Figure 18 Call-to-Arrival Fractile Analysis (2023)
City of Eden Prairie, MN
Fire Department Analysis of Fire Services Standards of Cover / Staffing
Finding #15: Total response times from 9-1-1 answer to first-unit arrival are 4:18 minutes longer than best practice recommendations for positive outcomes in a suburban city. This is due to three reasons: (1) slow dispatch processing and (2) slow turnout times and (3) most importantly, long travel times due to partial rotating station staffing.
2.7.8 Effective Response Force (ERF) Concentration Measurements
The Department’s desired ERF goal for building fires is four engines, one ladder truck, two utility units, one chief officer and one fire inspector totaling 19 personnel. Across the four data years, there were 124 Building Fire incidents but only 13 of such incidents where five engines and/or ladders arrived at the scene. A best practice for a suburban house fire would be all needed units arriving within 11:30 minutes from 9-1-1 answer. In 2023 alone, the Department’s 90 percent callto-arrival time for five units ranged from a low of 14:41 minutes (one time) to a high of 25:05 minutes (three times).
In the City, the 8:00- minute travel time for the last- to- arrive unit is too aggressive given the limited and rotating station staffing at present. An 8:00- minute ERF travel time would be sufficient for the physical placement of fire the C ity’s stations if all stations were staffed
Finding #16: The City is not capable of fielding its self-defined effective multipleunit response force to building fires To even assemble the required number of total personnel, the City is also dependent on mutual aid arriving quickly. The only solution is to staff more stations 24/7/365.
2.8 PAID-ON-CALL FIREFIGHTER PROGRAM DEPLOYMENT EVALUATION
2.8.1
Deployment Staffing
As is typical in Minnesota over decades, the City’s fire services were staffed by paid -on- call firefighters More recently, the City has used a more formal “Duty Crew” or “part- time firefighter” program At the time of this study’s commencement, there were a total of 94 part-time firefighters. For deployment, part- time firefighters must cover on-duty assignments, respond to emergencies from home (or elsewhere), and complete mandatory annual training. The Department’s deployment model is two, three-person apparatus that rotate among the City’s four fire stations, and an on-call Duty Officer.
Citygate received data related to four categories of how part-time firefighter hours were spent :
1. Training
2. Staffing Apparatus
City of Eden Prairie, MN
3. Staffing the Duty Officer position
4. Emergency Callback Training
Part-time, also known as Duty Crew, personnel are required to attend seven to eight training sessions each quarter, for an annual minimum requirement of 93 hours. Details regarding the Department’s Training Division are included in Section 3.4 of this report. The following figure illustrates the training and instruction hours logged by Duty Crew personnel for 2023.
Figure 19 Duty Crew Training Attendance
2023 Duty Crew Training and Instructor Hours
In total, part-time personnel participated in nearly 1 2,000 hours of training activity for 2023, demonstrating a strong culture of preparation and professionalism.
Finding #17: The Department’s training program is successfully maintaining the readiness component of its part-time firefighters.
Duty Crew Apparatus Staffing
To maintain the current, in-station crew staffing requires six personnel, 24/7/365. The City utilizes career firefighters working 40 hours per week that have other duties such as prevention and training to staff one of the apparatus on weekdays. Then all other hours fall to the part-time force.
For part- time personnel, there is a minimum requirement of 108 in-station duty hours per quarter, resulting in a minimum of 432 hours per year. Shifts are selected by personnel by a tenure-based system. The following figure depicts the amount of time each part- time member committed to staffing apparatus in 2023. It is also very complex to manage this system given the various partialday staffing slots made available.
Figure 20 Duty Crew Staffing Contributions for 2023
2023 Duty Crew Staffing Hours
Per person, the hours per year range from 736 to 114 hours. As a group, the part-time firefighters worked 37,022 hours which corresponds to nearly 13 full-time firefighters working a traditional 24/48 schedule. 70.4 percent of the total annual staffing demand for the two-apparatus deployment was provided by the part-time Duty Crews, demonstrating a high level of commitment to the Department.
However, there are times when part- time staff are not available due to other obligations. To acknowledge these demands, the Department has spent a great deal of time developing an array of shifts within both the workweek and weekend to accommodate part-time personnel with shift durations ranging from three hours to eight hours . Even with these adjustments, there were consistent instances in 2022 and 2023 in which the Department had to reduce staffing because of lack of personnel. When faced with this staffing decision, the Department employed two distinct strategies based on the certification level of available personnel.
A “Super Crew”: five personnel at a single station riding a single apparatus
City of Eden Prairie, MN
A two-person crew at a station and a three-person crew at the other
In 2022, there were 79 instances when the Department reduced staffing because of lack of personnel. In 2023, that figure increased to 127 instances. The most common timeframe for these staffing shortages was immediately before and after the normal 8:00 to 5:00 workday, suggesting an emerging conflict with work and family commitments within the part- time firefighter cadre.
Finding #18: Part-time firefighters are highly engaged in the Department’s mission and contribute a high percentage of the annual staffing deployment, offsetting nearly 13 full-time positions.
Finding #19: The Department is failing to maintain minimum staffing levels at an increasing rate and, at times, already is unable to produce six personnel, especially before and after the workday.
Finding #20: The tenure-based shift selection results in some crews having less time together, and overall is less experienced and prepared than those comprised of all senior members.
Duty Officer Staffing
The Department’s Duty Officer position is staffed during weekdays by full -time members of the Department. After-hours and weekends are a shared responsibility of both full-time and part- time personnel who possess the training and experience levels to engage complex issues and incident command responsibilities. This responsibility does not require a station presence and members routinely respond from home.
Part-time contributions to Duty Officer staffing for 2023 are depicted in the following figure.
Figure 21 Duty Crew Duty Officer Staffing Contributions for 2023
For 2023, 11 part-time members staffed the Duty Officer position for a total of 3,103 hours, which corresponds to 35.4 percent of the total year.
Finding #21: The Department’s Duty Officer program is well-supported by both full-time and part-time tenured members of the Department
Finding #22: The informal nature of the Duty Officer program makes it a transient position for subordinates that limits the opportunity for observation and engaging emerging issues in an already dynamic environment of mixed junior member crews.
Call Back of Part- Time Personnel
For significant events that have higher levels of response, the Department institutes an “All -Call” from the dispatch office to bolster available units and personnel. The following graphic illustrates the total number of call-back engagements for all part-time firefighters for 2023.
2023 Duty Crew Callback Frequency
For 2023, the Department initiated an “All -Call” to part-time firefighters resulting in 397 individual responses. However, there is no guarantee on the amount that can respond to an event and within a timeframe that musters an ERF to engage search and rescue at a structure fire. Of the 94 part-time firefighters, 15 work full- time in other public safety agencies , and most others work jobs that limit their availability, to respond to a call- back related to a large-scale regional event.
Finding #23: The amount of call-back resources is robust in roster count but, in practice, not enough can be assured to build an ERF.
Finding #24: The burden on part-time firefighters is at its limit.
SOC ELEMENT 8 OF 8 DEPLOYMENT EVALUATION
The Department serves an urban/suburban population with a mixed residential and non-residential land-use pattern typical of other Twin Cities area cities of similar size and demographics.
The current revolving deployment model of six personnel on duty upon two apparatus with a duty officer 24/7/365 is insufficient to control even one moderate house fire and leaves no on-duty or callback staffing for a simultaneous incident. The current two-unit rotating crew plus emergency
Figure 22 Duty Crew Callback Contributions for 2023
City of Eden Prairie, MN Fire Department Analysis of Fire Services Standards of Cover / Staffing
callback system is only providing sluggish response times for positive outcomes in a suburban city that has, besides residential, commercial building fire and technical rescue risks.
Given only two staffed fire apparatus, Citygate is concerned with the Department’s ability to provide equitable “speed of response” to large sections of the City as well as sufficient “weight of response” capacity for more serious emergencies and concurrent incident responses to achieve commonly expected outcomes in urban/suburban communities like Eden Prairie, which has more than 64,000 residents plus employment and visitors.
Citygate understands that the cadre of part-time personnel provides great value to the City and Department, but it does not meet the City’s current risk exposure needs . A combination of more full-time staff coupled with existing part-time personnel will be needed for the foreseeable future to ensure an adequate first unit “speed of response” and ERF “weight of response.”
Total response time performance is significantly slower than best practice recommendations, resulting in first-unit call- to-arrival performance 4:18 minutes slower than Citygate’s 7:30-minute recommended best practice to facilitate desired outcomes in suburban communities. The City ’s Dispatch center can improve processing time and the station crews must lower turnout time.
Three of the four current fire station locations can cover much of the City with in adequate response travel times if they are staffed. Best practice is to provide an equitable level of service to all areas of a jurisdiction with similar risk and population density. The northeast portion of the City is not yet densely populated enough, or has a high enough incident demand, to make a fifth fire station a priority. But the expected development in the Golden Triangle area, secondary to the light rail extension, will increase population density and Fire Department response demands.
If desired outcomes include limiting building fire damage to only part of the inside of an affected building and/or minimizing permanent impairment resulting from a medical emergency, the urban/suburban population density areas of the City will need both first-due unit and multiple-unit ERF coverage from four fire stations and a blended full-time and p art-time firefighter force to deliver Citygate’s recommended urban/suburban area response performance goal.
2.9.1
Deployment Recommendations
Based on the technical analysis and findings contained in this section, Citygate makes the following deployment recommendations.
City of Eden Prairie, MN
Recommendation #1: Adopt Deployment Policies : The City Council should adopt complete performance measures to aid deployment planning and to monitor performance. The measures of time should be designed to deliver outcomes that will prevent death or more serious injury for EMS patients upon arrival when possible and keep small but serious fires from becoming more serious. Citygate recommends the following measures
1.1 Distribution of Fire Stations: To treat pre-hospital medical emergencies and control small fires, the first -due unit should arrive within 8:30 minutes, 90 percent of the time, from receipt of the 9-1-1 call dispatch center from four staffed fire stations. This equates to a 1:30 -minute call processing / dispatch time, a 2:00- minute crew turnout time, and a 5:00-minute travel time.
1.2 Multiple-Unit Effective Response Force for Serious Emergencies: To confine building fires near the room or rooms of origin, keep vegetation fires under one acre in size, and treat multiple medical patients at a single incident, a multiple-unit ERF of at least 12 personnel, plus mutual aid, and at least one Chief Officer, should arrive within 11 :30 minutes from the time of 9 -1-1 call receipt, 90 percent of the time, within the suburban population density areas of the City. This equates to a 1:30-minute dispatch time, 2:00-minute crew turnout time, and an 8:00- minute travel time.
1.3
1.4
City of Eden Prairie, MN
Hazardous Materials Response: To protect the City from the hazards associated with uncontrolled release of hazardous and toxic materials , the fundamental mission of the Department’s response is to isolate the hazard, deny entry into the hazard zone, and minimize impacts on the community. This can be achieved with a first -due total response time of 8 :30 minutes or less in the suburban population density areas of the City to provide initial hazard evaluation and/or mitigation actions After the initial evaluation is completed, a determination can be made whether to request additional resources to mitigate the hazard.
Technical Rescue: To respond to technical rescue emergencies as efficiently and effectively as possible with enough trained personnel to facilitate a successful rescue, a first-due total response time of 8 :30 minutes or less is required in the suburban population density areas of the City to evaluate the situation and initiate rescue actions. Additional resources should assemble as needed, within a total response time of 1 2:30 minutes within the suburban population density areas of the City, to safely complete rescue/extrication and delivery of the victim to the appropriate emergency medical care facility.
Recommendation #2: Add career and part-time staffing at four stations to provide three-person shift staffing per unit, 24 hours per day, seven days per week
Recommendation #3: As soon as funds permit, develop crew space for a Duty Officer and fourth Firefighter at Station 1.
Recommendation #4: Expand the ARFF training level of key managers to monitor and anticipate airport needs with regards to response and procedures.
City of Eden Prairie, MN Fire Department Analysis of Fire Services Standards of Cover / Staffing
Recommendation #5: Develop call-processing performance standards and conduct training with the Eden Prairie Police Department 9-1-1 Dispatchers.
Recommendation #6: Develop turnout time standards individual response by Officer. by policy and track
Recommendation #7: Adopt a 5:00-minute travel time standard to 90 percent of responses to aid in future staffing and deployment decisions and drive equity of response capability throughout Eden Prairie neighborhoods.
City of Eden Prairie, MN
SECTION 3—ADMINISTRATIVE SUPPORT STAFFING CAPACITY REVIEW
As an element of this SOC Assessment, the City requested a high - level evaluation of the Department’s administrative support organization and workload capacity.
NFPA 1201 states, in part: “ …the [department] shall have a leader and organizational structure that facilitates efficient and effective management of its resources to carry out its mandate as required [in its mission statement].” 6 Best practices call for a management organization and headquarters programs with adequate staffing to provide a properly trained, equipped, and supported response force to ensure prompt response and safe, competent service delivery. Compliance regulations for fire services operation are increasing ; thus, the proper hiring, training, and supervision of operational personnel require a significant leadership and general management commitment.
3.1 ADMINISTRATIVE ORGANIZATION OVERVIEW
The City’s Adopted 2021 Budget authorizes 20 support positions for the Department, organized as shown in the following figure.
City of Eden Prairie, MN

As the figure shows, the Department’s administrative staff consists of the Fire Chief, three Assistant Chiefs, an Administrative Assistant, two Captains, and four Lieutenant /Inspectors for a total of 11 40-hour staffed positions, collocated at Station 1. In addition, the Building Inspections Division is part of the Fire Department. Located in City Hall, it is comprised of one Building Official, two Plan Reviewers, two Permit Technicians and four Building Inspectors , for a total of nine.
This staff is responsible for the overall administration and management of all Department programs and services, as well as administrative support for the Department’s approximately 94 part-time (Duty Crew) operational response personnel.
Citygate’s review of the Department’s administrative support organization’s workload capacity found that the Fire Chief has developed effective divisions of labor that would normally provide adequate staff to meet its mission with one important exception: the use of headquarters personnel
Figure 23 Eden Prairie Fire Department Administrative Organization
City of Eden Prairie, MN
to provide regular operations response in conjunction with their primary duties during weekday hours as detailed in the following sections.
3.2 FIRE PREVENTION
The City’s Municipal Code includes adoption of the state Fire Code and select appendices with amendments approved by the City Council, including establishment of a Fire Prevention Bureau to implement, administer, and enforce the provisions of that code. 7 The Fire Chief is the Fire Code Official with powers to appoint a Deput y Fire Code Official and others, as necessary. The Prevention Division is led by an Assistant Chief that manages the four Inspectors who are crosstrained across the plan review and inspection processes. Prevention is located within Fire Station 1, which is adjacent to City Hall and the Building Division. The current office space does not allow for any additional staffing.
The Prevention Division has the following key responsibilities:
Enforcement of the adopted Fire Code
Response to concerns and complaints regarding fire hazards and violations.
Review of all new development projects and building permits for conformance with applicable fire and life safety codes, ordinances, and regulations
Plan review and inspection of fire protection and detection systems for conformance with applicable codes, ordinances, and regulations, and for appropriate design, installation, and operation
Certificate of Occupancy inspections for changes to building use
Inspection of new building construction for conformance with applicable fire and life safety codes, ordinances, and regulations
Inspection of existing building occupancies for conformance with applicable fire and life safety codes, ordinances, and regulations
Rental property inspections of all units quinquennially
Assist the State with inspections for licensed daycare, foster, and group homes
Public fire and life safety education coordination
Extinguisher training
7 Eden Prairie Municipal Code Section 905
City of Eden Prairie, MN
Fire Department Analysis of Fire Services Standards of Cover / Staffing
Fire/arson cause determination and coordination with Eden Prairie Police investigations
KNOX lockbox program
Special event planning and enforcement
Fireworks permitting and inspection
Underground and aboveground tank inspection including airport Fixed Base Operators (FBOs)
False alarm billing
Burn permits for prairie restoration and buckthorn removal
Pre-incident plans
The four Inspectors are cross trained in the various duties to help ensure availability of services. The inspection databases are transitioning to online platforms that should increase efficiency but, for now, the inspectors spend a great deal of office time scheduling inspections and inputting field notes. In addition to their prevention duties, Inspectors assist with staffing an apparatus at Station 1 during weekdays that serves as a backup for the primary unit staffed by a Duty Crew. The Department estimates that approximately 25 percent of the Inspectors’ time is spent responding to calls on apparatus.
The City requires that all single-family rental properties are licensed, which requires application and inspection. Beyond the usual inspection of commercial properties , the Prevention Division is tasked with performing, these fee-based inspections include a frequency goal to inspect each rental unit every five years. Enforcement powers include orders to vacate for substandard conditions. 8 The process for inspection requires scheduling and the presence of an adult at the unit, and noshows and cancellations effect the completion rate by an estimated ten percent Fire safety education is provided by administrative or response personnel as available and requested. For children, this includes a two-day public safety camp in June, visits to the public elementary schools, and annual open house events in October. Prevention also facilitates a juvenile fire setters program.
The Department is using mobile inspections software that allows inspectors to access data and input inspection findings from the field. There are ongoing database consolidations that should also increase efficiency when completed . Shifting the pre- incident plan responsibility to the Operations Division is an ongoing project. The Prevention Division is also evaluating a
8 Eden Prairie Municipal Code Section 5.72
City of Eden Prairie, MN Fire Department Analysis of Fire Services Standards of Cover / Staffing
comprehensive review of its inspection plan from a risk and life safety perspective that will likely adjust the frequency of inspections for some lower risk occupancies.
Citygate’s review of the Prevention team’s workload identified the following productivity measures for 2023 in the following table
Table 19 Workload Analysis of Existing Building Inspections
Given the significant inspection burden illustrated in the previous table and the incident response duties required of the Prevention staff, the unit does not have adequate staff to meet the current inspection goals.
3.3 BUILDING INSPECTIONS AND PERMITS
Unique to the City of Eden Prairie is the presence of the Building Inspections and Permits Division organized with the Fire Department 9 The City’s Municipal Code includes adoption of the state Building Code with specific exceptions approved by the City Council, including establishment of the City of Eden Prairie Inspections Department as the enforcement agency. The Building Code Official is designated by the City and required to possess State certification. 10 The Building Official manages eight FTEs who provide permitting and inspection services for all building trades, from plan review to certificate of occupancy. They utilize a paperless plan review and inspection process. Five of the positions are for field Inspectors who are cross -trained and work a flex schedule to ensure early morning and late evening inspections for contractors. Inspection requests are generally fulfilled within 48 hours
The major challenge for the group is the pending retirements of several of the Inspectors and the need to develop their replacements before their institutional knowledge is lost.
3.4 TRAINING
The Assistant Chief of Training has the responsibility to ensure all Department personnel meet mandated training requirements and is assisted by a Training Captain. Classroom space is located on the lower level of Fire Station 1, an alternate space at Station 4, plus the training grounds of the Edina Southwest Public Safety Training Facility, are located at 7525 Braemar B oulevard in Edina.
By Department policy, both full- time and part-time (Duty Crew) personnel are required to complete 93hours of training per year and follow the Minnesota Boar d of Firefighter Training and Education (MBFTE) requirements for subject matter. The Departmental training schedule provides for a minimum of 144 hours of opportunity annually , with quarterly minimum attendance thresholds. New personnel are selected after an entry physical, background check, and psychological exams, and trained in one of two options:
1. Fast Track-Certified structural firefighters prior to employment are oriented to Department-specific procedures in a ride-along program at Stations 1 and 4.
City of Eden Prairie, MN
2. Certification Academy – Structural Firefighter and Emergency Medical Responder (EMR) delivered in August of each year.
The recently appointed training staff has already conducted a needs assessment and annual training plan. The plan includes:
Annual live fire training utilizing MBFTE requirements based on National Fire Protection Association (NFPA) 1403 standards
Airport operations
Low angle rope rescue
Surface water rescue, including boat operations
Hazardous Materials First Responder Operations (FRO)
Active Threat Rescue Task Force (RTF)
Accident Review Board (ARB) with Operations for accidents and significant nearmiss events
Return to work light duty assignment program for injured employees
Confidential licensed counselor referral program
The Department currently delivers very well attended continuing education training curriculum on Thursday in the daytime and evenings. A training attendance policy is in draft. For 2023, personnel exhibited an extraordinary commitment to training , as approximately 90 percent of Duty Crew personnel exceeded their 93-hour annual requirement.
Figure 24 Training Attendance

EMS continuing education is provided in person and electronically via Learning Management System (LMS) by Hennepin Healthcare Emergency Medical Service Healthcare, including information on local medical directives. Most Operations personnel (84) are certified as Emergency Medical Technicians (EMTs) who, along with Emergency Medical Responder (EMR) trained personnel, are required to have 20 hours of annual EMS training.
3.5 ADMINISTRATIVE ORGANIZATION REVIEW SUMMARY
From this assessment of the Department’s administrative support organization, Citygate makes the following findings and recommendations.
3.5.1
Findings
Finding #25: Prevention is not meeting its frequency goals for existing occupancies, including rental dwelling units.
Finding #26: When the 25 percent time for staffing apparatus is deducted from the four Prevention Inspectors , the actual strength of staff focused on inspection duties is equivalent to only three FTEs
City of Eden Prairie, MN
Finding #27: The Prevention staff are at their limit and are working more hours (and managing more assignments) than they should be.
Finding #28: Inspectors staffing apparatus often resulted in missed inspection appointments or interrupted inspections due to emergency responses by the engine crew.
Finding #29: Many Building Inspectors intend to retire within the next few years; however, there is no succession plan in place for this highly technical position.
Finding #30: There is not available space for staff expansion at Station 1 without some modest remodel.
Finding #31: The Department’s training program is well organized and in lock step with the needs of the Operations Division.
Finding #32: The Department’s annual training plans includes appropriate training for the broad portfolio of services it provides the community and complies with national standards with regards to live burn and Federally required annual hazardous material response training
Finding #33: While the Department has a robust training plan, it does not have a formal succession plan for operations personnel.
3.5.2 Recommendations
Recommendation #8: The City should consider funding additional Fire Inspectors, or eliminate their Operations staffing responsibilities, to meet the demands of the current inspection workload, as detailed in the Inspection Workload tables provided as Appendix B
Recommendation #9: The Department should consider expansion of office space by reconfiguration or expansion at Station 1 or moving some Training or Prevention staff to Station 4 to support recommended staffing additions.
Recommendation #10: Develop and implement a succession plan for the whole Department, including Building Inspectors, to ensure continuity of services upon retirement of the current incumbents.
SECTION 4—COMPREHENSIVE RECOMMENDATION AND PHASING
Based on Citygate’s comprehensive review, the Department’s current dynamic staffing model of two, three-person crews from rotating fire stations needs to be expanded to provide (1) a more equitable speed of response to all areas of the City and (2) an improved weight of response for more serious or concurrent incidents. To achieve this, Citygate recommends the City continue utilizing a modest number of full-time personnel at a minimum of four stations to provide a 24/7/365 guaranteed minimum daily response staffing level to deliver equitable access to all neighborhoods, all the time for positive outcomes when they call for help. The three-to-four-station staffing plan is augmented by the existing high-value but strained part-time firefighter/EMT /EMR program, with these personnel scheduled to work or occasionally called back for major emergencies.
Citygate recommends the City consider funding additional on-duty career personnel across a phasing period of a two to four fiscal years to eventually reach a master plan result of a minimum of six to eight full-time personnel, plus a chief officer, on duty daily for supervision and incident command as summarized in the following table. The recommended staffing delivers a minimum, and when coupled with two part-time personnel at each station, can deliver safe firefighting response for speed of attack and can enter burning structures under the two-in/two-out federal and state safety standard, 11 plus provide for incident command and a pump operator
Part-time personnel can be used for vacation and sick leave backfill as well as additional staffing at each station on high-activity days, such as busy community special events or bad weather days.
The Department also needs to address the workload demands on fire prevention if more response personnel are not added These additions can be built in phases over a few fiscal years as summarized in the previous table, ideally assisted by federal firefighter staffing grants Once the
Table 20
Recommended Minimum Daily Response Staffing Model
City of Eden Prairie, MN
Council provides policy direction, staff can provide the detailed expenses per fiscal year. Citygate recommends a four-year plan to recruit, train, and on -board the new and additional personnel that will be needed to achieve the recommended staffing model.
4.1 PHASING PLAN
Gathering community input, designing and approving a funding plan for increased career staffing, and recruiting and hiring all take time. Given the cost and administrative burden on the City to grow and gradually obtain the full funding needed, a phasing plan is needed The Department believes the following steps are achievable and meet Citygate’s findings and overall recommendations Citygate offers that these steps are not to be completed on a one-step per year basis, but in logical progress across a few fiscal years. With only the two staffed crews across rotating stations, the City does not yet have the speed and weight of staffing for the risks to be protected today
The following are career personnel changes/additions .
Step 1: Recruit additional Duty Crew firefighters within Eden Prairie and the surrounding region in 2024 and prepare a recruitment process for full- time staff to begin in 2025.
Step 2: Add three Fire Captains and three Lieutenants to stabilize staffing at two fire stations. Decrease use of Fire Inspectors, the Electronic & Communications Captain, and the Training C aptain for primary emergency response apparatus. Reassign certain administrative functions to the fire Administrative Assistant for prevention support. Apply for SAFER Grant for additional full-time firefighters.
Step 3: Add three Battalion Chiefs, one per platoon, for 24/7/365 immediate response command and safety oversight. Begin to build effective succession planning.
Step 4: Add six Emergency Vehicle Operators (EVOs) , increasing two apparatus to two career personnel each day. Cease use of Fire Inspectors, the Electronic & Communications, and the Training Captain for primary emergency response apparatus. Begin to staff the third station with modified staffing.
Step 5: Add three Lieutenants and three EVOs to staff Station 3 with a minimum of two career personnel per day.
Step 6: Add three Lieutenants to staff Station 4 with a minimum of one career person per day. Begin to staff the fourth station with modified staffing.
City of Eden Prairie, MN
Department Analysis of Fire Services Standards of Cover / Staffing
Step 7: Add three EVOs to staff Station 4 with a minimum of two career personnel per day.
Step 8: Add firefighters to each station if Duty Crew firefighter recruitment and retention is ineffective to place a third crew member 24/7/365
After Step 7, the career force will be 24 firefighters and three Battalion Chiefs These personnel will staff four engines with a minimum of two career personnel plus the Battalion Chief across three shifts. The part-time staff will work scheduled assignments to provide the third and , ideally at times, a fourth firefighter on each engine 24/7/365
APPENDIX A
COMMUNITY RISK ASSESSMENT
APPENDIX A—COMMUNITY RISK ASSESSMENT
A.1 COMMUNITY RISK ASSESSMENT
The third element of the Standards of Coverage (SOC) process is a community risk assessment.
Within the context of an SOC study, the objectives of a community risk assessment are to:
SOC ELEMENT 3 OF 8 COMMUNITY RISK ASSESSMENT
Identify the values at risk to be protected within the community or city.
Identify the specific hazards with the potential to adversely impact the community or city.
Quantify the overall risk associated with each hazard.
Establish a foundation for current/future deployment decisions and riskreduction/hazard-mitigation planning and evaluation.
A hazard is broadly defined as a situation or condition that can cause or contribute to harm. Examples include fire, medical emergency, vehicle collision, earthquake, flood, etc. Risk is broadly defined as the probability of hazard occurrence in combination with the likely severity of resultant impacts to people, property, and the community as a whole.
A.1.1 Risk Assessment Methodology
Citygate utilizes a three-axis model incorporating probability of occurrence, impact extent, and consequence severity parameters to assess community risks relative to specific hazard services provided by the fire agency. The process starts with identifying geographic planning sub -zones (risk planning zones) appropriate to the jurisdiction or city. Citygate then identifies and quantifies, to the extent data is available, the specific values at risk. We then assign a risk score from 1 (lowest risk) to 6 (highest risk) to each hazard parameter using historical agency data or subjective analysis of local factors. The total risk score for each hazard is then calculated using a modification of Heron’s Formula for calculating the area of a triangle, and a descriptive risk rating is then assigned based on the total risk score. This methodology conforms as appli cable to this community/jurisdiction with the principles of NFPA 1300 1 and the Commission on Fire Accreditation International (CFAI).
1 NFPA 1300 – Standard on Community Risk Assessment and Community Risk Reduction Plan Development (2020 Edition)
City of Eden Prairie, MN
For this assessment, Citygate used the following data sources to understand the hazards and values to be protected in the City of Eden Prairie (City), Minnesota:
Esri and U. S. Census Bureau population and demographic data
City Geographical Information Systems (GIS) data
City General Plan and Zoning information
City and Hennepin County Hazard Mitigation Plans
Department and other City data and information
A.1.2 Risk Assessment Summary
Citygate’s evaluation of the values at risk and hazards likely to impact the City yields the following:
1. The Department serves a very diverse suburban/urban population with densities ranging from less than 750 to more than 6,000 people per square mile over a varied urban land use pattern.
2. The City’s population is projected to grow approximately 14 percent by the year 2040 according to the Metropolitan Council.
3. The City has a large inventory of residential and non-residential buildings to protect.
4. The City has significant economic and other resource values to be protected, as identified in this assessment.
5. The Department has multiple mass emergency notification options available to effectively communicate emergency information to the public in a timely manner.
6. The City’s risk for seven hazards related to emergency services provided by the Department range from Low to High as summarized in the following table.
A.1.3 Community Description
Eden Prairie is a suburb in the Minneapolis -St. Paul metropolitan area located 18 miles southwest of downtown Minneapolis. The City was established in 1858 and experienced rapid growth in the 1950s, when Flying Cloud Airport was converted to civilian use and the construction and subsequent traffic upon Highway 494 made the City more accessible. It is bordered on the east by the cities of Bloomington and Edina; on the north by Minnetonka; and on the west by Chanhassen. The southern portion of the City includ es the Flying Cloud Airport and the Minnesota Valley Wildlife Refuge bordered by the Minnesota River.
The City is substantially developed and has a commercial and industrial core including the Golden Triangle area a regional employment center that is surrounded by residential uses of various densities. At the time of this writing, the Southwest Light Rail Transit line is under construction and will include four stations in the City that are anticipated to stimulate redevelopment and increase density. The City also boasts a large portfolio of parks, open spaces, and bodies of water. The City provides a full range of suburban municipal services including administration, community development, fire, parks and recreation, police, and public works. The City operates under a Council-Manager form of government, with the Mayor and four council members elected at large to staggered four-year terms. The City operates under a biennial budget which is $57.52 million for fiscal year 2024 and $59.52 million for fiscal year 2025
A.1.4 Risk Planning Zones
The Commission on Fire Accreditation International (CFAI) recommends jurisdictions establish geographic planning zones to better understand risk at a sub -jurisdictional level. For example, portions of a jurisdiction may contain predominantly moderate risk building occupancies, such as detached single-family residences, while other areas contain high- or maximum-risk occupancies,
City of Eden Prairie, MN
such as commercial and industrial buildings with a high hazard fire load. If risk were to be evaluated on a jurisdiction-wide basis, the predominant moderate risk could outweigh the high or maximum risk and may not be a significant factor in an overall ass essment of risk. If, however, high- or maximum-risk occupancies are a larger percentage of the risk in a smaller planning zone, then they become a more significant risk factor. Another consideration in establishing planning zones is that the jurisdiction’s record management system must also track the specific zone for each incident to appropriately evaluate service demand and response performance relative to each specific zone. For this assessment, Citygate utilized four planning zones corresponding with the four station first-due response areas as shown on the following map.

Figure 1 Risk Planning Zones
City of Eden Prairie, MN
A.1.5 Values at Risk to Be Protected
Values at risk, broadly defined, are tangibles of significant importance or value to the community or jurisdiction potentially at risk of harm or damage from a hazard occurrence. Values at risk typically include people, critical facilities/infrastructure, buildings, and key economic, cultural, historic, or natural resources.
People
Residents, employees, visitors, and travelers in a community or jurisdiction are vulnerable to harm from a hazard occurrence. Particularly vulnerable are specific at -risk populations, including those unable to care for themselves or self -evacuate in the event of an emergency. At-risk populations typically include children under the age of 10, the elderly, people housed in institutional settings, and households below the federal poverty level. The following table summarizes key demographic data for the City.
City of Eden Prairie, MN
Table 2 Key Demographic Data – Eden Prairie
Source: Esri and U.S. Census Bureau
Of note from the previous table is the following:
Nearly 27 percent of the population is under 10 years or over 65 years of age.
The City population is predominantly White (68 percent), followed by Asian (15 percent), Black / African American (8 percent), Hispanic / Latino (7 percent), and two or more races (2 percent).
Of the population over 24 years of age, more than 9 7 percent has completed high school or equivalency
Of the population over 24 years of age, more than 75 percent has an undergraduate, graduate, or professional degree
Of the population 15 years of age or older, nearly 97 percent is in the workforce; of those, 3.3 percent are unemployed.
Median household income is slightly more than $165,000.
The population below the federal poverty level is slightly more than 5 percent.
Only 3.6 percent of the population does not have health insurance coverage.
Projected Growth
The region’s Metropolitan Council projects the City to have 29,504 households with a population of 73,643 by the year 2040. This represents a 14.1 percent increase in population. 2
Buildings
The City has more than 26,000 residential housing units and nearly 2,800 businesses including manufacturing, research, technology, office, professional services, retail sales, restaurants/bars, motels, churches, schools, storage, government facilities, healthcare facilities, and other occupancy types 3
Building Occupancy Risk Categories
The CFAI identifies the following four risk categories that relate to building occupancy:
2 Source: Metropolitan Council 2024.
3 Source: Esri Community Analyst – Community Profile (2024)
City of Eden Prairie, MN
Department Analysis of Fire Services Standards of Cover / Staffing
Low Risk – includes detached garages, storage sheds, outbuildings, and similar building occupancies that pose a relatively low risk of harm to humans or the community if damaged or destroyed by fire.
Moderate Risk – includes detached single-family or two-family dwellings; mobile homes; commercial and industrial buildings smaller than 10,000 square feet without a high hazard fire load; aircraft; railroad facilities; and similar building occupancies where loss of lif e or property damage is limited to the single building.
High Risk – includes apartment/condominium buildings; commercial and industrial buildings larger than 10,000 square feet without a high hazard fire load; low -occupant load buildings with high fuel loading or hazardous materials; and similar occupancies with potenti al for substantial loss of life or unusual property damage or financial impact.
Maximum Risk – includes buildings or facilities with unusually high risk requiring an Effective Response Force (ERF) involving a significant augmentation of resources and personnel and where a fire would pose the potential for a catastrophic event involving large loss of life or significant economic impact to the community.
Evaluation of The City’s building inventory identified 410 high/maximum-risk building uses as they relate to the CFAI building fire risk categories, as summarized in the following table
1 Source: Eden Prairie Fire Prevention Division
2 Source: CFAI Standards of Cover (Fifth Edition)
Critical Infrastructure
The U.S. Department of Homeland Security defines critical infrastructure and key resources as those physical assets essential to the public health and safety, economic vitality, and resilience of a community, such as lifeline utilities infrastructure, tele communications infrastructure, essential government services facilities, public safety facilities, schools, hospitals, airports, etc. The Department has identified 94 critical facilities and infrastructure, as shown in the following table.
Table 4
Occupancy Inventory by Risk Category
City of Eden Prairie, MN
A hazard occurrence with significant consequence severity affecting one or more of these facilities would likely adversely impact critical public or community services.
Source: Eden Prairie Fire Department
Economic Resources
The City has 2,787 businesses employing nearly 61,000 people. Key economic industries include corporate headquarters, retail, supply chain , and technology 4 Key employers include:
Optum CH Robinson World Wide
Starkey Labs
Eden Prairie School District
Tenant Company
Lifetouch
Emerson Process Management
4 Source: City of Eden Prairie Annual Comprehensive Financial Report for FY 2022.
City of Eden Prairie, MN Fire Department Analysis of Fire Services Standards of Cover / Staffing
Eden Prairie Center.
MTS Systems Corp
Abbott Laboratories
Danfoss
Natural Resources
Key natural resources within the City include: 5
170 miles of multi-use trails
1,300 acres of open space
2,250 acres of parks, including
The Prairie du Chien-Jordan aquifer.
Special/Unique Resources
The following facilities are special or unique resources to be protected:
Flying Cloud Airport
Light Rail
Hennepin Technical College
True Friends - Camp Edenwood
Smith- Douglas-More House
A.1.6 Hazard Identification
Citygate utilizes prior risk studies where available, fire and non -fire hazards as identified by the CFAI, and agency/jurisdiction-specific data and information to identify the hazards to be evaluated for this study. The 2024 Hennepin County All-Jurisdiction Hazard Mitigation Plan identifies the three following broad categories with 19 hazards likely to impact the City:
Geological
1. Landslide
5 Source: City of Eden Prairie Local Water Management Plan 2020.
City of Eden Prairie, MN
2. Sink Hole
3. Soil Frost
4. Volcanic Ash
Meteorological
1. Climate Change
2. Tornado
3. Winds, Extreme Straight-Line
4. Hail
5. Lightning
6. Rainfall, Extreme
7. Heat Extreme
8. Drought
9. Dust Storm
10. Cold, Extreme
11. Winter Storm, Blizzard/Extreme Snowfall
12. Winds, Non-Convective High
13. Ice Storm
Hydrologic
1. Flooding, River
2. Flooding, Urban
The Department also manages the emergency management system for the City, including mitigation, preparedness, response, and recovery. The Department’s other d ivisions support these responsibilities through their assigned duties of inspection, enforcement, training, planning, fire suppression, emergency medical services, technical rescue, and hazardous materials response
The CFAI groups hazards into fire and non -fire categories, as shown in the following figure Identification, qualification, and quantification of the various fire and non -fire hazards are important factors in evaluating how resources are or can be deployed to mitigate those risks.
City of Eden Prairie, MN

Source: CFAI Standards of Cover (Fifth Edition)
Subsequent to review and evaluation of the hazards identified in the 2024 Hennepin County AllJurisdiction Hazard Mitigation Plan, and the fire and non -fire hazards as identified by the CFAI as they relate to services provided by the Department, Citygate evaluated the following seven hazards for this risk assessment: 1. Building fire 2. Vegetation/wildland fire
Medical emergency
Hazardous material release/spill
Marine incident
Aviation incident
Figure 2 Commission on Fire Accreditation International Hazard Categories
A.1.7 Service Capacity
Service capacity refers to the Department’s available response force; the size, type, and condition of its response fleet and any specialized equipment; core and specialized performance capabilities and competencies; resource distribution and concentration; availability of automatic or mutual aid; and any other agency-specific factors influencing its ability to meet current and prospective future service demand relative to the risks to be protected.
The Department’s current, daily service capacity for fire and non -fire risk consists of a combination of seven full-time and part-time (Duty Crew) personnel on duty staffing two apparatus and a Duty Officer position providing after - hours incident command support from home. In general, the Department staffs one engine and one aerial ladder truck daily. The two apparatus are staffed at Station 1 during weekday hours and alternate per a schedule at either Stations 1 and 3 or Stations 2 and 4 weeknights and weekends. Apparatus selection is further dependent upon call type with both an engine and an aerial ladder available at Stations 1 and 4. The Department also has five engines, one quint (pumper/ladder), one aerial ladder, three brush engines; one rehab/air unit; one fire boat; and one inflatable rescue boat that can be cross -staffed with on-duty or callback personnel as needed. A Duty Officer serves as the incident commander and is, at minimum, a tenured officer responding from home after hours.
All response personnel are trained to Emergency Medical Responder or Emergency Medical Technician (EMT) level with advanced variances, capable of providing Basic Life Support (BLS) pre-hospital emergency medical care. Ground ambulance service is provided b y Hennepin Healthcare Emergency Medical Service, which provides ALS transport to 14 municipalities within Hennepin County.
Response personnel are also trained to the U.S. Department of Transportation Hazardous Material First Responder Operational (FRO) level to provide initial hazardous material incident assessment, hazard isolation, and support the state-sponsored Hopkins Fire Department Chemical Assessment Team. The Department maintains water and ice rescue capability utilizing two boats, side -scan sonar, and cold-water entry suits, and cooperates with the nearby Hennepin County Water Patrol. The Department’s Aircraft Rescue Fire Fighting (ARFF) training certification level for Flying Cloud airport response is informal and at the familiarization level as they participate with the airport in joint training on a biannual basis.
All response personnel are further trained to the Confined Space Awareness and Low -Angle Rope Rescue Operations levels, with technical assistance available from the Edina Fire Department and Minnesota Task Force 1 by request as needed.
The Department has mutual aid agreements with Edina, Minnetonka, Chanhassen, Hopkins, and Bloomington for response in Eden Prairie First Alarm multiple unit needs, and is a participating agency in the Minnesota Intrastate Mutual Aid Plan.
A.1.8 Probability of Occurrence
Probability of occurrence refers to the probability of a future hazard occurrenc e over a specific time. Because the CFAI agency accreditation process requires annual review of an agency’s risk assessment and baseline performance measures, Citygate recommends using the 12 months following the completion of an SOC study as an appropriate period for the probability of occurrence evaluation. The following table describes the six probability of occurrence categories and related characteristics used for this analysis.
Table 4
Probability of Occurrence Categories
• Hazard could occur infrequently.
• No recorded or anecdotal evidence of occurrence.
• Little opportunity, reason, or means for hazard
• Hazard might occur occasionally.
• Infrequent, random recorded or anecdotal evidence of occurrence.
• Some opportunity, reason, or
• Regular recorded or strong anecdotal evidence
• Considerable opportunity, reason, or means for hazard to occur.
• Hazard does occur frequently.
• High level of recorded or anecdotal evidence of regular occurrence.
• Strong opportunity, reason, or means for hazard to occur.
Citygate’s SOC assessments use recent multiple-year hazard response data to determine the probability of hazard occurrence for the ensuing 12- month period.
A.1.9 Impact Extent
Impact extent refers to the probable geographic area and/or number of persons likely to be impacted by a specific hazard occurrence. The following table describes the five impact extent categories and general characteristics used for this analysis.
A.1.10 Consequence Severity
Consequence severity refers to the probable magnitude or reasonably expected loss of a hazard occurrence on people, buildings, lifeline services, the environment, and the community as a whole. The following table describes the five consequence severity categories and general characteristics used for this analysis.
Category
Insignificant
Minor
Moderate
Major
Extreme
City of Eden Prairie, MN
Table 6 Consequence Severity Categories
• No injuries or fatalities
General
Characteristics
• None to few persons displaced for short duration
• Little or no personal support required
• None to inconsequential damage
• None to minimal community disruption
• No measurable environmental impacts
• None to minimal financial loss
• No wildland Fire Hazard Severity Zones
• Few injuries; no fatalities; minor medical treatment only
• Some displacement of persons for less than 24 hours
• Some personal support required
• Some minor damage
• Minor community disruption of short duration
• Small environmental impacts with no lasting effects
• Minor financial loss
• No wildland Fire Hazard Severity Zones 2
• Medical treatment may be required with some hospitalizations and/or fatalities
• Localized displaced of persons for less than 24 hours
• Personal support satisfied with local resources
• Localized damage
• Normal community functioning with some inconvenience
• No measurable environmental impacts with no long-term effects, or small impacts with long-term effect
• Moderate financial loss
• Less than 25% of area in Moderate or High wildland FHSZ 3
• Many injuries, hospitalizations, and fatalities expected
• Large number of persons displaced for more than 24 hours
• External resources required for personal support
• Significant damage
• Significant community disruption; some services not available
• Some impact to environment with long-term effects
• Major financial loss with some financial assistance required
• More than 25% of area in Moderate or High wildland FHSZ; less than 25% in Very High wildland FHSZ 4
• Extensive casualties and/or fatalities impacting local medical care system
• General displacement for extended duration
• Extensive support required
• Extensive damage
• Significant impact to environment and/or permanent damage
• Catastrophic financial loss; unable to function without significant fiscal support
• More than 50% of area in High wildland FHSZ; more than 25% of area in Very High wildland FHSZ
City of Eden Prairie, MN
A.1.11 Overall Risk
Overall risk considers probability of occurrence, likely impact extent, and typically expected consequence severity as follows
Total Risk Score
A total risk score is computed using the following modification of Heron’s Formula for calculating the area of a triangle
Risk Category
A descriptive risk category is then assigned from the total risk score according to the following table.
Table 7 Overall Risk Categories
A.1.12 Building Fire Risk
One of the primary hazards in any community is building fire. Building fire risk factors include building size, age, construction type, density, occupancy, and height above ground level; required fire flow; proximity to other buildings; built-in fire protection/alarm systems; available fire suppression water supply; building fire service capacity; and fire suppression resource deployment (distribution/concentration), staffing, and response time. Citygate used available data from the Department and the U.S. Census Bureau to assist in determining the City’s building fire risk.
The following figure illustrates the building fire progression timeline and shows that flashover, which is the point at which the entire room erupts into fire after all the combustible objects in that room reach their ignition temperature, can occur as early as three to five minutes from the initial ignition. Human survival in a room after flashover is extremely improbable.
City of Eden Prairie, MN Fire Department Analysis of Fire Services Standards of Cover /

Source: http://www.firesprinklerassoc.org
Population Density
Population density within the City ranges from less than 750 to more than 6,000 people per square mile. 6 Although risk analysis across a wide spectrum of other Citygate clients shows no direct correlation between population density and building fire occurrence, it is reasonable to conclude that building fire risk relative to potential impact on human life is greater as population density increases, particularly in areas with high density, multiple-story buildings.
Water Supply
A reliable public water system providing adequate volume, pressure, and flow duration in close proximity to all buildings is a critical factor in mitigating the potential consequence severity of a
6 Source: Map #2a of Map Atlas
Figure 3 Building Fire Progression Timeline
City of Eden Prairie, MN
community’s building fire risk. The City relies on groundwater for municipal water, with the Eden Prairie Public Works Department currently operating 16 wells drawing from the Prairie du ChienJordan aquifer. According to Department staff, available fire f low volume and pressure are adequate throughout the City with the exception of a few small areas which lack fire hydrants due to housing tracts being built on private water supplies. These areas are well known to the Department and there are contingency pl ans in place. There are three distinct areas within the City that have large-lot, single-family dwellings utilizing private wells that do not have hydrant coverage:
Along Bryant Lake in the Northeast
➢ Beach Road
➢ Willow Creek Drive
Southwest
➢ Dell Road
➢ Pioneer Trail
Southeast
➢ Riverview Road
Building Fire Service Demand
For the four-year period from January 1, 2020, through December 31, 2023, the City experienced 155 building fire incidents comprising 1.24 percent of total service demand over the same period, as summarized in the following table.
8 Building Fire Service Demand
As the table shows, annual building fire service demand was steady over the four -year study period. Overall, building fire service demand is low at 1.24 percent of total service demand.
Table
Building Fire Risk Analysis
The following table summarizes Citygate’s analysis of the City’s building fire risk by planning zone
9
Fire Risk Analysis
A.1.13 Vegetation/Wildland Fire Risk
Some areas within and adjacent to the City are susceptible to a vegetation/wildland fire. Vegetation/wildland fire risk factors include vegetative fuel types and configuration, weather, topography, prior fires, water supply, mitigation measures, and vegetation/wildland fire service capacity.
Vegetative Fuels
Vegetative fuel factors influencing fire intensity and spread include fuel type (vegetation species), height, arrangement, density, and moisture. In addition to decorative landscape species, vegetative fuels within the City consist of a mix of annual grasses and weeds , invasive species, and mixed deciduous and conifer tree species. Once ignited, vegetation fires can burn intensely and contribute to rapid fire spread with the right fuel, weather, and topographic conditions.
Weather
Weather elements, including temperature, relative humidity, wind, and lightning , also affect vegetation/wildland fire potential and behavior. High temperatures and low relative humidity dry out vegetative fuels, creating a situation where fuels will more readily ignite and burn more intensely. Wind is the most significant weather factor influencing vegetation/wildland fire behavior, with higher wind speeds increas ing fire spread and intensity. Fuel and weather conditions most conducive to vegetation /wildfir es generally occur from late June through October; however, above-normal temperatures and drought can increase that period on either end.
Topography
Vegetation/wildland fires tend to burn more intensely and spread faster when burning uphill and up-riverbank, except for a wind-driven downhill fire. The parts of the City with hilly terrain contribute more to vegetation/wildland fire behavior and spread.
Water Supply
Another significant vegetation fire consequence severity factor is water supply immediately available for fire suppression. According to Department staff, available fire flow volume and pressure are adequate throughout the City with the exception of a few small areas which lack fire hydrants due to housing tracts being built on private water supplies. These areas are well known to the Department and there are contingency plans in place. However, no apparatus carries more than 1000 gallons of water.
Vegetation/Wildland Fire Hazard Mitigation
Hazard mitigation refers to specific actions or measures taken to prevent a hazard from occurring or to minimize the severity of impacts resulting from a hazard occurrence. While none of the hazards subject to this study can be entirely prevented, measures can be taken to minimize the impacts when those hazards do occur. The City and Department have completed or are continuing the following wildfire mitigation measures .
Creation of an Urban Forestry Management Plan for the City’s 44 parks and special use areas, which contain more than 2,400 acres of developed and natural public space. 1,000 acres of developed parkland and 1,400 acres of conservation areas which include preserved natural areas such as wetlands, woodlands, and prairies. These areas are maintained for their ecological value and recreational opportunities like hiking and wildlife observation.
The Parks and Natural Resources Department conducts prescribed burns annually.
The Department has broad powers in enforcement, including the open burning provisions in Subdivision 8 of the adopted fire code.
Published recreational fire guidelines for public reference.
Vegetation/Wildland Fire Service Demand
Over the four-year study period, the Department responded to 39 vegetation/wildfires comprising 0.31 percent of total service demand over the same period, as summarized in the following table.
Table 10 Vegetation/Wildland Fire Service Demand
The table shows annual vegetation/wildland fire service demand consistent over the four-year study with very low overall demand.
Vegetation/Wildland Fire Risk Analysis
The following table summarizes Citygate’s analysis of the City’s vegetation/wildland fire risk by planning zone
Table 11 Vegetation/Wildland Fire Risk Analysis
Vegetation/Wildland Fire
A.1.14 Medical Emergency Risk
Medical emergency risk in most communities is predominantly a function of population density, demographics, violence, health insurance coverage, and vehicle traffic.
Medical emergency risk can also be categorized as either a medical emergency resulting from a traumatic injury or a health-related condition or event. Cardiac arrest is one serious medical emergency among many where there is an interruption or blockage of oxygen to the brain.
The following figure illustrates the reduced survivability of a cardiac arrest victim as time to defibrillation increases. While early defibrillation is one factor in cardiac arrest survivability, other
City of Eden Prairie, MN
factors can influence survivability as well, such as early CPR and pre -hospital advanced life support interventions.
Population Density
Population density in the City ranges from less than 750 to more than 6,000 people per square mile, as shown in Map #2a ( Volume 2 Map Atlas). Risk analysis across a wide spectrum of other Citygate clients shows a direct correlation between population density and the occurrence of medical emergencies, particularly in high urban population density zones.
Demographics
Medical emergency risk tends to be higher among older, poorer, less educated, and uninsured populations. As shown in Table 2, 14.9 percent of the City population is 65 and older; 2.5 percent of the population over 24 years of age has less than a high school education or equivalent; slightly
Figure 4 Survival Rate versus Time to Defibrillation
more than 5 percent of the population is at or below poverty level; and 3 .6 percent of the population does not have health insurance coverage. 7
Vehicle Traffic
Medical emergency risk tends to be higher in areas of a community with high daily vehicle traffic volume, particularly areas with high traffic volume traveling at high speeds. the City’s transportation network includes Highways 212 and 494 carrying an aggregate annual average daily traffic volume of more than 190,000 vehicles. 8
Medical Emergency Service Demand
Medical emergency service demand over the four-year study period includes more than 7,900 calls for service comprising over 63 percent of total service demand over the same period, as summarized in the following table.
As the table shows, medical emergency service demand varies significantly by planning zone but has fluctuated overall by less than two percent over the four-year study period.
Medical Emergency Risk Analysis
The following table summarizes Citygate’s analysis of The City’s medical emergency risk by planning zone.
7 Source:
Table 12 Medical Emergency Service Demand
A.1.15 Hazardous Material Risk
Hazardous material risk factors include fixed facilities that store, use, or produce hazardous chemicals or waste; underground pipelines conveying hazardous materials; aviation, railroad, maritime, and vehicle transportation of hazardous commodities into or through a jurisdiction; vulnerable populations; emergency evacuation planning and related training; and specializ ed hazardous material service capacity .
The City relies on groundwater for municipal water, currently operating 16 wells drawing from the Prairie du Chien-Jordan aquifer.
Fixed Hazardous Materials Facilities
The Prevention Division has identified 157 sites requiring a city hazardous materials storage and use permit. In addition, CenterPoint Energy high-pressure natural gas distribution pipelines are located throughout the City and pipelines are vulnerable to the effects of frost heave. 9 The nowclosed Flying Cloud Sanitary Landfill located south of the airport is a privately-owned landfill on the Minnesota Permanent List of Priorities. It is currently being managed as part of the Minnesota Pollution Control Agency (MPCA) closed landfill program and has a groundwater remediation system and also operates a landfill gas extraction syste m 10
Transportation -Related Hazardous Materials
The City also has transportation-related hazardous material risk because of its road transportation network, includ ing Highways 212 and 494 carrying an aggregate annual average daily truck traffic
9 Source: 2024 Hennepin County All-Jurisdiction Hazard Mitigation Plan Hazard Inventory.
10 Source: City of Eden Prairie Local Water Management Plan 2020.
City of Eden Prairie, MN Fire Department Analysis of Fire Services Standards of Cover / Staffing
volume of more than 190,000 vehicles, some of which are transporting hazardous materials, as summarized in the following table. 11
1 Average Annual Daily Trips Source: Minnesota Department of Transportation Traffic Mapping Application for 2023
The City also has transportation-related hazardous material risk due to train movements into and through the City daily, some of which are transporting hazardous commodities. This includes a new transloading facility located at 6340 Industrial Drive near the City’s northeast corner.
Population Density
Because hazardous material emergencies have the potential to adversely impact human health, it is logical that the higher the population density, the greater the potential population exposed to a hazardous material release or spill. As shown in Map #2a (Volume 2 Map Atlas), the City population density ranges from less than 750 to more than 6,000 people per square mile.
Vulnerable Populations
Persons vulnerable to a hazardous material release/spill include individuals or groups unable to self-evacuate, generally including children under the age of 10, the elderly, and persons confined to an institution or other setting where they are unable to leave voluntarily. As shown in Table 2, nearly 27 percent of the population is under age 10 or is 65 years and older.
Emergency Evacuation Planning, Training, Implementation, and Effectiveness
Another significant hazardous material consequence severity factor is a jurisdiction’s shelter -inplace / emergency evacuation planning and training. In the event of a hazardous material release or spill, time can be a critical factor in notifying potentially affected persons, particularly at -risk populations, to either shelter- in-place or evacuate to a safe location. Essential to this process is an effective emergency plan that incorporates one or more mass emergency notification capabilities, as well as pre-established evacuation procedures. It is also essential to conduct regular, periodic exercises involving these two emergency plan elements to evaluate readiness and to identify and
11 Source: Minnesota Department of Transportation Traffic Mapping Application.
City of Eden Prairie, MN
remediate any planning or training gaps to ensure ongoing emergency incident readiness and effectiveness.
The City has a free subscription and reverse 9 -1-1 -based mass emergency notification system (Smart911) that is used to provide emergency alerts, notifications, and other emergency information to email accounts, cell phones, smartphones, tablets, and landline telephones All City landlines are automatically included in the system and residents can create an account with an address for geotargeted alerts. Federal Communications Commission Wireless Emergency Alerts and social media (Facebook, Twitter) are also used to provide emergency notifications and information to the public.
Hazardous Material Service Demand
The City experienced 451 hazardous material incidents over the four-year study period, comprising 3.6 percent of total service demand over the same period, as summarized i n the following table.
Table 15 Hazardous Material Service Demand
As the table shows, hazardous material service demand was generally consistent over the fouryear study period.
Hazardous Material Risk Analysis
The following table summarizes Citygate’s analysis of the City’s hazardous materials risk by planning zone.
A.1.16 Technical Rescue Risk
Technical rescue risk factors include active construction projects; structural collapse potential; confined spaces, such as tanks and underground vaults; bodies of water , including rivers and streams; industrial machinery use; transportation volume; and earthquake, flood, and landslide potential.
Construction Activity
There is ongoing residential, commercial, industrial, and infrastructure construction activity within the City including the extension of commuter light rail.
Structural Failure12
Winter storms can produce heavy snowfall accumulations that can cause roofs to collapse. Melt collapse and frost heave can displace foundation elements and also cause structural failure in buildings. Eroding soil from heavy rain may undermine structural integrity resulting in collapse and Hennepin County is within a high-frequency corridor for extreme thunderstorms, winds and derechos that are also capable of damaging structures and entrapping occupants.
Confined Spaces
There are multiple confined spaces within the City, including tanks, vaults, and open trenches.
Transportation Volume
Another technical rescue risk factor is transportation -related incidents requiring technical rescue. This risk factor is primarily a function of vehicle, railway, maritime, and aviation traffic. Vehicle
12 Source: 2024 Hennepin County All-Jurisdiction Hazard Mitigation Plan
traffic volume is the greatest of these factors within the City, with highways 212 and 494 carrying an aggregate annual average daily traffic volume of more than 190,000 vehicles. 13
Flood Risk14
Many areas of the region are susceptible to flooding during the thunderstorms of spring and summer months. However, some of the highest risk occurs when a rain event is coupled with either the presence of snow or ice preventing infiltration or melting and creating additional water volume.
Technical Rescue History 15
The river bluffs in the City have a high risk of natural landslides in the spring during ice thaw when slopes exceed angles of repose (30 to 45 degrees). This type of failure has occurred both recently and historically.
Technical Rescue Service Demand
The Department responded to 80 technical rescue incidents over the four-year study period, comprising 0.64 percent of total service demand for the same period, as summarized in the following table
Table 17 Technical Rescue Service Demand
As the table shows, overall technical rescue service demand in the City is very low and was relatively constant over the four-year study period.
City of Eden Prairie, MN
Technical Rescue Risk Analysis
The following table summarizes Citygate’s analysis of the City’s technical rescue risk by planning zone
A.1.17 Marine Incident Risk 16
Marine incident risk factors include waterway and near-shore recreational activities and watercraft used in or on waterways within the City.
Waterways
Major bodies of water and waterways within the City include 17 lakes comprising 2240 acres of which 14 are listed as shallow (15 feet or less) and three are deeper. The City’s geography includes five natural watersheds that are organized within three water shed districts: Riley-Purgatory-Bluff Creek; Nine Mile Creek; and the Lower Minnesota River Watershed. A 1997 functions and values assessment completed in the City cataloged 537 bodies of water, including lakes, wetlands, and stormwater basins.
Recreational Activity
The City’s waterways are popular for water recreation activities, including fishing, paddle boarding, and kayaking. Of the lakes within the City, nine include public access. In addition, The City operates beaches at Riley Lake and Round Lake. Boat ramps ar e located at Mitchell, Riley, Round, Staring, Red Rock, Bryant, and Smetana lakes.
16 Source: City of Eden Prairie Local Water Management Plan 2020.
Marine Incident Service Capacity 17
The Department maintains water and ice rescue capability utilizing two boats, side-scan sonar, and cold-water entry suits 18 City personnel are trained in basic surface water rescue and the Hennepin County Water Patrol with a higher level of training and equipment also responds to all water rescue calls from their headquarters near Lake Minnetonka.
Marine Incident Service Demand
Over the four-year study period, the Department responded to 17 marine incidents, comprising 0.14 percent of total service demand for the same period, as summarized in the following table.
As the table shows, overall City marine incident service demand is very low and comprises just 0.14 percent of the total call volume over the four-year study period.
The Department maintains water and ice rescue capability at Station 3 in the form of two boats, side-scan sonar, and cold-water entry suits and cooperates with the nearby Hennepin County Water Patrol.
Marine Incident Risk Analysis
The following table summarizes Citygate’s analysis of the City’s marine risk by planning zone.
17 Source: Eden Prairie Fire Department.
18 Source: Eden Prairie Fire Department 2023 Annual Report
Table 19 Marine Incident Service Demand
A.1.18 Aviation Incident Risk
Aviation Risk Factors 19
Aviation risk factors include commercial airline passenger and commercial air cargo activity or commercial airship and general aviation activity into, from, and over a community or jurisdiction.
Flying Cloud Airport (FCM) is primarily home for corporate jets and flight schools . It is a public airport owned and operated by the Minneapolis-S t. Paul Metropolitan Airports Commission (MAC). Located in the southern part of the City, it has three runways and is limited to aircraft of 60,000 pounds except for in emergency situations. It also serves an important role in the medical community, serving as a transportation center for patients and transplant deliveries.
For the 12-month period ending December 31, 2023, the airport had 146,890 aircraft operations for an average of over 400 per 24-hour period 4.4 percent of which were at night. The vast majority were piston aircraft (80.5 percent) followed by jet (7.7 percent) and turboprop (5.2 percent). Helicopter traffic was just 1.6 percent of the total traffic and 12 total military operations for the year.
Aviation Incident History
A single-engine plane with three passengers crashed with minor injuries and an ensuing fire in March of 2023 20
City of Eden Prairie, MN
Aviation Incident Service Capacity 21
The Department responds to alerts at the airport but does not have specialized apparatus or a specific training level for personnel Joint training with the Department and airport staff occurs at least biannually.
Aviation Risk Service Demand
Over the four-year study period, the Department responded to 13 aviation incidents, comprising 0.10 percent of total service demand for the same period, as summarized in the following table.
21 Aviation Incident Service Demand
Aviation Incident Risk Analysis
The following table summarizes Citygate’s analysis of the City’s aviation risk by planning zone.
Table 22 Aviation Incident Risk Analysis
Source: Eden Prairie Fire Department
Table
APPENDIX B
INSPECTION WORKLOAD TABLE
APPENDIX B—INSPECTION WORKLOAD
The following table assumes that of the four current inspectors, one is acting as the plan reviewer and assuming the development-related duties of the Division.