


City of Eden Prairie, Minnesota
Government Finance Officers Association of the United States and Canada (GFOA) presented a Distinguished Budget Presentation Award to the City of Eden Prairie, Minnesota, for its Biennial Budget for the fiscal year beginning Jan. 1, 2022. To receive this award, a governmental unit must publish a budget document that meets program criteria as a policy document, as a financial plan, as an operations guide and as a communications device. This award is valid for a period of two years only. We believe our current budget continues to conform to program requirements, and we are submitting it to GFOA to determine its eligibility for another award.
I am pleased to present the 2024-2025 City of Eden Prairie budget adopted by the Council on Dec. 5, 2023. This budget provides the resources to achieve the City's goals for Eden Prairie residents, which are part of the Eden Prairie Promise, embedded in the City's vision, mission and values, and define how City employees work together to meet resident expectations and deliver top results.
Our long-term goals include maintaining high-quality services with reasonable tax impacts, maintaining employee morale and engagement, and maintaining a strong financial position.
This budget document provides an understanding of the City budget and factors affecting finances, prepared using practices and techniques recommended by the Governmental Accounting Standards Board (GASB) and the Governmental Finance Officers Association (GFOA). The balanced budget represents a fiscally conservative approach to meeting the demands of residents, businesses and the City Council.
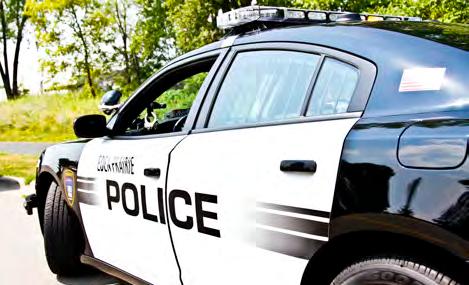
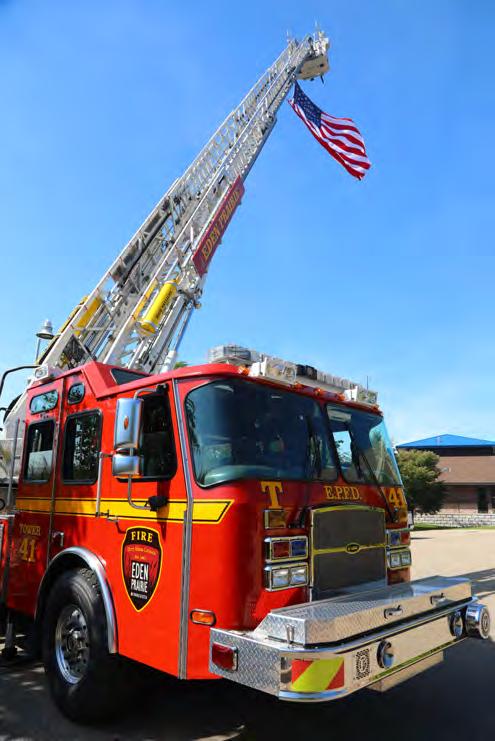
To maintain high-quality services and satisfied residents, the General Fund budget is increasing 5.7% in 2024 and 3.5% in 2025. While most of the 2024-2025 budget is incremental growth based on the programs and services of previous years, there are several new initiatives in the upcoming two years. These initiatives include implementation of a police cadet program with four new cadets in 2024 and one new cadet in 2025, evaluation of duty crew firefighter staffing, a Police Department remodel, purchase of new fire trucks, and investments in affordable housing and race equity.
The City prepares a 10-year Capital Improvement Plan every other year. Plans for capital spending for 2024 and 2025 are included in this document. Significant capital projects include upgrades to Dell Road, sewer lining replacements along Washington Avenue and Homeward Hills Road, stormwater dredging, creek restoration projects, and ongoing trail and pavement maintenance.
Debt service for the City remains stable. $2,401,316 is budgeted for tax-supported debt service payments in 2024 and $2,172,326 in 2025, which is less than the $2,553,000 budgeted in 2023. In 2024, the City anticipates issuing debt to finance fire engine replacements, a Police Department remodel and ice rink reflooring. Budget information is also provided for the Water, Wastewater, Stormwater and Liquor enterprise funds. These operations continue to be operationally and financially stable.
The City continues to make efforts to stabilize taxes through long-term strategic budgeting, systematic replacement of assets and establishing reserves that allow for budget flexibility. The City maintains its bond ratings of Aaa from Moody's and AAA from Standard and Poor's, which reflect a healthy economy, conservative fiscal management and manageable debt levels.
Eden Prairie continues to be a highly desirable place for residents and businesses. I would like to thank the City staff members who prepared the 2024-2025 Budget, as well as the City Council for their budget review and adoption efforts.
Respectfully submitted,
 Rick Getschow City Manager

The budget in brief provides a summary of the 2024-2025 budget highlighting the major governmental funds and factors affecting the budget. The budget is for the City’s fiscal years of Jan. 1, 2024–Dec. 31, 2024, and Jan. 1, 2025–Dec 31, 2025 The City created this summary to provide a clear understanding of the financial impact of services provided Additional details about the City’s budget, operations and policies can be found in the sections that follow Please contact the City of Eden Prairie with any questions at 952-949-8376
$44,822,092
$57,521,455
The tax levy is the amount raised by property taxes. For 2024, the tax levy is $44,822,092. This is a 5.6% increase over 2023 and includes $44,337,436 for operations, $400,000 for capital improvements, $2,401,316 for debt service and a fiscal disparity distribution of $2,316,660 Property taxes are the largest source of revenue, and the City strives to balance increases with demand for services. For 2025, the tax levy will increase an additional 4.5% to $46,820,972. These increases are primarily driven by personnel wages and benefits.
The General Fund is the chief operating fund of the City. It pays for a full range of municipal services including police, fire, street maintenance, park maintenance, recreation programs, administration, community development and building inspections. Expenditures for 2024 and 2025 are increasing 5.7% to $57,521,455 and 3.5% to $59,527,476. Additions to the budget are driven by wage and benefit increases along with funds for elections in 2024, City facility energy costs, workers compensation premiums and new public safety software.
The Water Fund accounts for the City’s water operations including water treatment, inspections, storage, meter reading, repair, installation and water distribution. Expenses for 2024 are increasing 22.6% to $13,095,691 due to increased capital outlay and depreciation expense. For 2025, the budget is decreasing 3.9% to $12,582,597 due to reduced capital outlay
Wastewater Fund
$10,037,774
Water Fund
$13,095,691
The Wastewater Fund accounts for the City’s sanitary sewer mains and lift stations. Expenses are increasing 30.3% to $10,037,774 for 2024 primarily due to additional capital outlay For 2025, the budget is decreasing 1.8% to $9,860,121 due to reduced capital outlay
Stormwater Fund
The Stormwater Fund accounts for maintenance of the City’s stormwater ponds and waterways. Expenses are decreasing 0.1% to $4,352,968 for 2024 and decreasing 0.7% to $4,323,769 for 2025 The budget is projected to hold steady for 2024 and 2025.
Liquor Fund
$4,352,968
$11,743,071
The Liquor Fund accounts for the City’s three municipal liquor stores. Expenses are increasing 0.7% to $11,743,071 for 2024. For 2025, the budget is increasing 3.0%. The liquor operation transfers $800,000 to $850,000 annually to the Capital Improvement and Maintenance Fund to pay for various parks and recreation, and public safety projects.
The Capital Project Fund pays for large capital outlays. Total expenditures are $12,321,350 for 2024 and $9,464,089 for 2025. The capital levy amount for 2024 and 2025 is the same as the 2023 levy of $400,000. The levy is used to maintain the City’s strong pay -as-you-go method for paying for projects.
The City of Eden Prairie issues debt to fund certain projects. Current examples include Fire Station 4 and park improvements including the Community Center aquatics facility expansion. Debt payments supported by the tax levy are projected to remain 4%-5% of the general fund budget. City policy maintains debt under 15% of the general fund budget. Total debt supported by the tax levy for 2024 is $2,401,316 and $2,172,326 for 2025
Revenue
Increase in property values — The City saw an increase in assessed valuation in 2024. The current estimated market value for taxes payable in 2024 is $14.3-billion, which is a 6.7% increase over 2023. For 2024, the median value home in Eden Prairie of $536,400 increased 4.5% in value. Commercial properties increased 3% and apartments are up 3.9%.
Property tax revenue — Property taxes are the single largest source of revenue. The City strives to balance increases in property taxes with the demand for services Property taxes support 77% of the General Fund budget providing a stable source of revenue for the General Fund
Charges for services — The second largest revenue source is increasing 7.4% in 2024 and 1.8% in 2025. Improved performance at the Community Center is anticipated as it continues to rebound from the impacts of the pandemic
Building permits and fees Collections vary each year based on development and permit activity The City budgets conservatively for this line item.
Intergovernmental Revenue — The City will receive a 33.3% increase in 2024 in grants and school liaison officer revenue Most of the increase is for wages and benefits, the cost of which will now be split between the school district and the City.
Personnel costs Wages and Benefits make up 68.3% of the general fund budget The City prepares the wages budget by looking at trends within the private sector labor market and our local government peer group. Based on the compensation trends, we are proposing a 3% base wage increase in 2024 and 2025. We must continue to provide similar increases as the private sector and our public sector peer cities to remain competitive.
Health Insurance
The City periodically conducts a Request for Proposal (RFP) process to procure health insurance State law requires the City to issue an RFP every five years In 2022, the City Council approved a three-year health insurance contract with HealthPartners for the years 2023, 2024 and 2025 with a rate cap of 9% in 2024 and 2025. Health insurance is budgeted to increase 9% in 2024 and 7.7% in 2025
Fire Relief Pension Firefighters in the City of Eden Prairie are members of the Eden Prairie Firefighter Relief Association The Association is the administrator of the single-employer defined benefit pension plan available to firefighters Minnesota Statute specifies minimum support rates required on an annual basis by the City The Association completes an actuarial study every two years which documents the required contribution from the City An updated study was completed for the 2023 budget The City receives Fire Relief Pension Aid from the State of approximately $550,000 which offsets the City’s required contribution.
Elections — In 2024, the City will conduct two primaries, one special and one general election City costs added to the budget include $317,470, of which $292,555 is for part-time staff to conduct the election.
Other Priorities
Approximately $65,000 in additional funding was provided to support a new police cadet program. The costs of the program will provide tuition and training for up to four cadets who will work for the City on a parttime basis Duty crew wages were increased to remain competitive with surrounding peers. Street costs for asphalt overlay, sealcoating and crack filling were reduced by approximately $467,000 due to these costs now being paid out of the Pavement Management Fund.


City Management Team
City Manager


Rick Getschow
Department Directors Administration
Community Development
Fire
Parks and Recreation
Police
Public Works
Alecia Rose
Julie Klima
Scott Gerber
Amy Markle
Matt Sackett
Robert Ellis
Mayor Ron Case Council Member Mark Freiberg Council Member PG Narayanan Council Member Kathy Nelson Council MemberTotal FTEs increased 1.4 for the 2024 budget, with a 0.2-FTE increase in Human Resources and 1.2-FTE increase in Recreation Services. The increases were made to support services in these areas. No changes are projected for the 2025 budget
The Eden Prairie Promise defines how City employees work together to meet resident expectations and deliver top results. It is the City’s promise to the community to fulfill the mission and vision of Eden Prairie.
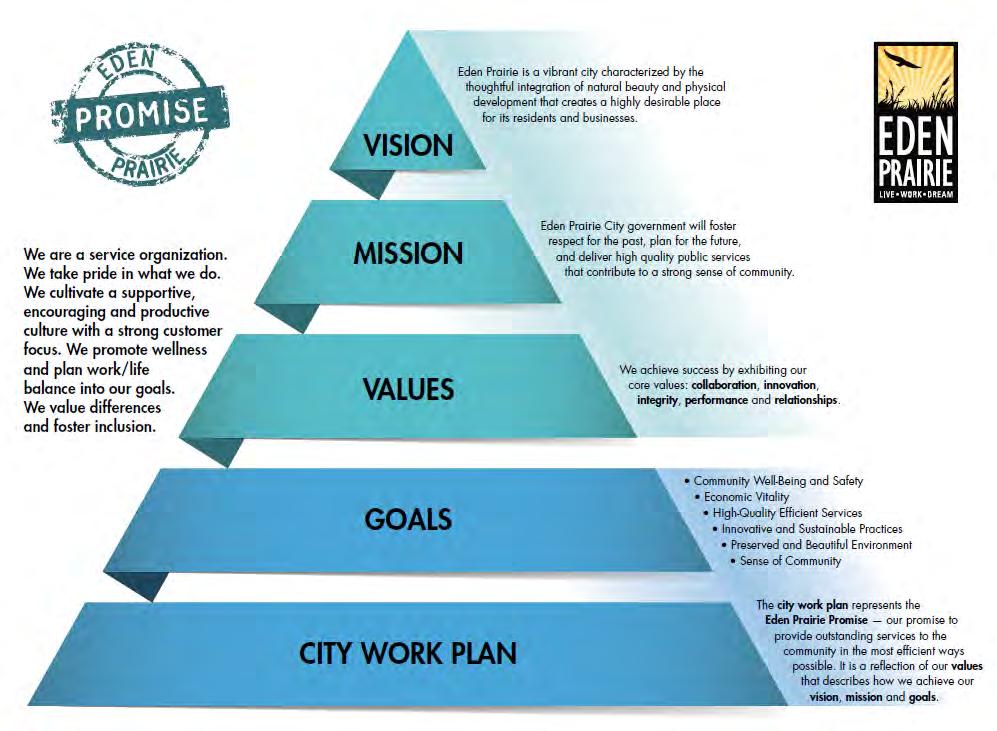
City leaders and employees are held accountable for executing the City’s vision and mission for the benefit of the community The performance measures dashboard tracks performance and progress toward the six goals that are part of the Eden Prairie Promise This dashboard is available to the public at edenprairie.org/EdenPrairiePromise Measures can also be found in the department summary sections of this document.
Annual work plans are created by department managers and directors each fall with input from staff. These work plans are shared with all City staff annually and form the City’s strategic goals More information on specific department goals and objectives may be found in the department summaries section of this book.

Weprovideuniqueanddiverseopportunitiesforthecommunitytolivewell. Weprotectandserve ourcommunitybydeliveringexceptionalandcommunity-engagingpublicsafetyservices.
Provide and deliver a safe supply of water
Maintain high ratings on the biennial resident survey regarding the overall feeling of safety, quality of emergency response time and quality of life
Expand recreation programming to meet diverse needs for all populations in the community
Add missing trail links identified in the City's pedestrian and bicycle plan
Expand and diversify the transportation system including light rail connecting employment, housing, open space and entertainment
Provide and maintain a safe transportation system
Increase footprint of cultural services unit within CERT Engage residents to partner with public safety staff to foster good communication, build trust and relationships
Provide fair housing education to City staff, property owners/landords and tenants to reduce and prevent evictions
WeenhancethequalityoflifeinEdenPrairiebysustainingadiverseand prosperouseconomicbasewhilesupportingbusinessgrowthanddevelopment.
Preserve and expand capital that is sustainable and affordable for residents
Maintain high bond ratings
Support and manage efforts to provide grants and public financing for business retention, expansion, rehabilitation and renovation
Maintain a comprehensive planning process to support a prosperous economic base for business growth and development
Maintain moderate debt burden
Assist in the development, growth and attraction of new businesses
Wedelivercost-effective,efficientandresponsiveservicestoresidentsandthepublic.
Recruit and retain high-quality employees
Increase utilization of e-scheduling and e-licensing for building inspections
Maintain and enhance a positive, engaging and passionate work culture
Upgrade technology infrastructure to improve functionality, reliability and security
Refine communication and service delivery platforms for those with limited English proficiency and digital access
Provide a high-quality and efficient transportation system
Weimplementinitiativesalignedwithourstrategytobe forward-thinking,progressiveandenvironmentallyconscious.
Achieve regionally sustainable levels of community water usage
Provide means for residents and businesses to further reduce, reuse and recycle solid waste
Encourage innovative land use and sustainable practices through new zoning on opportunity sites
Promote sustainability of resources by identifying HVAC replacement needs and investigating more efficient technologies
Weestablishobjectivesandstrategiesthatsupportupholdingthe naturalbeauty,physicaldevelopmentandhistoryofthecommunity
Maintain a comprehensive plan and ordinance document reflecting current criteria with flexibility to allow for future change
Convert turf areas to pollinator-friendly native plants
Protect urban forest from invasive species
Provide attractive places within the right of way and on City property that create a sense of place
Maintain high-quality ratings from residents on the overall appearance of Eden Prairie
Wepromoteasenseofcommunitybyprovidingrecreational amenities,programmingandeventsfortheentirecommunity. Wefocusoninclusiveandcollaborativecommunityengagementinitiatives.
Provide programming and events accessible to all, focusing on inclusive and collaborative initiatives
Create venues for awareness, understanding and celebration of many cultures residing within the community
Enhance and improve opportunities for resident engagement during development
Continue multi-departmental partnerships for Citywide events and other Citysponsored community engagement activities
Develop ongoing cultural competency training for public safety staff
Eden Prairie is consistently ranked among the best places to live in America by a variety of publications with such rankings. In 2010, MONEY Magazine named Eden Prairie the #1 Best Place to Live in America, and the City has now occupied the top three spots on the list Residents continue to rate the overall quality of life exceptionally high on the biennial Quality of Life Survey In 2022, 92% of residents rated the overall quality of life as excellent or good.
The City has been named a StarTribune Top Workplace each year since 2014 This ranking places the City among the best of the best in the state The City is a pioneer in the public sector, with a progressive, high-performing organization The motivation and drive demonstrated by employees creates a culture of pride, where they can grow and develop in their careers while enjoying life outside of work Since its inception in 2021, the City has also earned the Top Workplaces USA award which offers national recognition to regional Top Workplaces winners based solely on employee feedback.
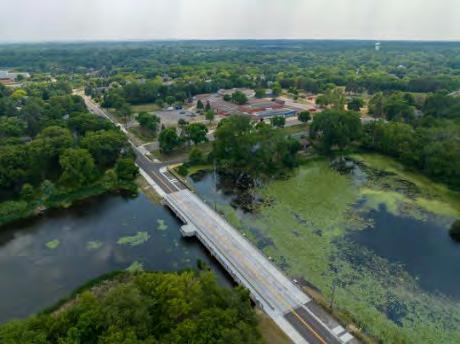
The City’s Duck Lake Road Improvement Project was recently named Project of the Year in the Structures category by the American Public Works Association (APWA) Minnesota chapter. The roadway from Duck Lake Trail to Mallard Court was fully reconstructed, and the project also included a new bridge and fishing pier, enhanced stormwater management features, a new paved trail, and concrete curb and gutter. The construction was largely completed in fall 2022 and there was a ceremonial ribbon-cutting event in June 2023. Innovative construction techniques, significant environmental improvements and the City’s collaboration with the Riley Purgatory Bluff Creek Watershed District contributed to the project’s recognition.
Sustainable Eden Prairie is an ongoing effort focusing on education and implementation of sustainable practices to protect the City’s environment and natural resources The City is leading by example and providing a foundation for residents and businesses to carry out sustainable practices in four areas — energy, landscape, waste and water A Climate Action Plan adopted by the City Council has a goal of achieving communitywide carbon neutrality by 2050.
The City has been recognized by Minnesota GreenStep Cities each year since 2017 for attaining the program’s highest level of achievement. Other recent sustainability awards include Conservation Minnesota’s Blazing Star Award, which acknowledges local governments that advance conservation, climate or the environment. Eden Prairie was recognized for improving fuel efficiency and helping protect the environment by deploying Minnesota's first fully electric patrol vehicle in 2021 in support of the City's Climate Action Plan. The City also received the 2022 Salt Symposium Chloride Reduction Leadership Award for its work on a water safety survey as part of the City’s Water Meter Replacement Project, an initiative to reduce the harmful effects of salt use in Eden Prairie.
In 2023, the City earned a 4-star mspWellness Champion designation for excellence in workplace wellness. The Minneapolis Regional Chamber and the Hennepin County and City of Minneapolis Health Departments created this designation to recognize and celebrate organizations that work to positively affect the health and well-being of their employees and communities. The City offers a robust wellness program designed to encourage healthy lifestyles. The program focuses on four wellness pillars: emotional, financial, nutritional and physical health. Eden Prairie's wellness program has received numerous awards since 2010

The City's Communications Division produces work each year that is recognized for excellence in communications by a state of Minnesota and a national government communications and marketing association. Eden Prairie was the only Minnesota city with a 1st-place award in the 2023 national competition — for the “Life in the Prairie” City newsletter. The newsletter has been a perennial award-winner in both competitions since its redesign, and in 2018 was named by the statewide competition as Best of Show, the top award in Minnesota granted to a single entry that best demonstrates effective government communications. “Life in the Prairie” is mailed quarterly to all Eden Prairie households and is consistently rated highly by residents in the biennial Quality of Life Survey.

The financial reporting and budgeting systems of the City are organized on a fund basis A fund is a fiscal and accounting entity with a self-balancing set of accounts. Funds are the control structures that ensure public funds are spent only for purposes and amounts authorized Funds are established to account for different types of activities and legal restrictions associated with a government function.

City of Eden Prairie


Governmental Funds


Governmental Funds account for the City’s day to day activities These include the General Fund, Debt Service Fund, and Capital Project Fund.
General Fund — City’s primary operating fund. Carries the basic activities of the City including Administration, Community Development, Parks and Recreation, Police, Fire and Public Works. Accounts for the proceeds of specific revenue sources that are restricted or committed to expenditures for specified purposes other than debt service and capital projects.
Debt Service Fund Accounts for all financial resources that are restricted, committed or assigned to expenditures for principal and interest. Debt Service funds with a related tax levy are budgeted.
Capital Project Funds Account for all financial resources that are restricted, committed or assigned to expenditures for capital outlay, other than those financed by proprietary funds.
Capital Improvement & Maintenance Fund — Accumulates resources from the tax levy and other sources to pay for capital projects Generally, projects budgeted in this fund do not have other funding sources.
Pavement Management Fund — Accumulates franchise fee revenue to pay for the City’s pavement management program.
Trails — Accumulates resources from the Capital Improvement & Maintenance Fund to provide funding for new trails and sidewalks.
Proprietary Funds account for the City’s businesslike activities These include Enterprise Funds and Internal Service Funds Enterprise Funds account for those government activities that are self-supporting; where the cost of providing a service is recovered primarily through user charges, similar to private business enterprises Internal Service Funds account for the financing of goods or services provided by one department to another on a cost-reimbursement basis.
Water Fund — Accounts for the operations of the City-owned water system.
Stormwater Fund — Accounts for the operations of the City’s stormwater system.
Wastewater Fund — Accounts for the operations of the City’s wastewater service.
Liquor Fund — Accounts for the operations of the City’s three retail liquor stores.
Information Technology — Accounts for the accumulation and allocation of costs associated with information technology operations.
Facilities — Accounts for the accumulation and allocation of costs associated with maintaining City-owned buildings.
Property/Workers’ Compensation Insurance — Accounts for the accumulation and allocation of costs associated with property and workers’ compensation insurance.
Fleet Services — Accounts for the accumulation and allocation of costs associated with fleet service operations.
Employee Benefits — Accounts for the accumulation and allocation of costs associated with health, dental and other employee benefits.
The City has other funds which are not formally budgeted including Special Revenue Funds, Debt Service Funds, Capital Project Funds, Permanent Funds, and Trust and Agency Funds.
This chart shows the relationship between functional units and funds For example, the Police Department may have some authorized appropriations in both the General Fund and Capital Project Fund.
The City is required to account for revenues and expenditures according to generally accepted accounting principles (GAAP). An annual budget is adopted consistent with GAAP for the general fund This is consistent with the accounting methods used for financial reporting.
Governmental Funds are maintained on a modified accrual basis with revenues recognized in the accounting period in which they become available and measurable. Expenditures are recognized in the accounting period in which the fund liability is incurred Encumbrance accounting is also employed in governmental funds Encumbrances (purchase orders, contracts) outstanding at year -end are reported as unassigned fund balances and do not constitute expenditures or liabilities because the amount will be appropriated and honored during the subsequent year All annual appropriations lapse at fiscal year -end
Proprietary Funds are maintained on the accrual basis Revenues are recognized in the accounting period in which they are earned, and expenses are recognized in the period in which the liability is incurred
The City of Eden Prairie has an important responsibility to its residents to manage its resources responsibly . Adopting financial policies is an important first step to ensure that resources are managed responsibly. The policies provide the framework for the overall fiscal management of the City and guide the decision-making processes The policies operate independently of changing circumstances and conditions
To protect the City Council’s policymaking ability by ensuring that important policy decisions are not constrained, impacted or controlled by financial problems or emergencies.
To enhance the City Council’s policymaking ability by providing accurate information on the full costs of current operations, new proposals and capital requests.
To provide sound principles to guide the decisions of the City Council and City staff which have financial impacts
To enhance the City Council’s policymaking ability by providing accurate and timely information on the City’s financial condition.
To provide, improve and maintain essential public facilities and prevent deterioration of the City’s infrastructure and equipment to assist in the long-term, cost-effective provision of City services.
To protect and enhance the City’s credit rating and prevent default on any municipal obligations
To ensure the legal use and protection of all City funds through a good system of financial and accounting controls.
A. The City will develop two-year budgets In the second year of the two-year budget process, the previously developed budget for the following year will be fine-tuned as necessary Each year the City will certify only the following year’s budget and levy to Hennepin County
B. The City will adopt a balanced budget with current revenues equal to or greater than current expenditures It is not the City’s policy to finance ongoing operations with one-time revenues One-time revenues will be used for one-time expenditures.
C. The City, through its capital and operating budgets, will provide for the adequate maintenance, replacement and improvement of the City’s physical assets to protect the City’s capital investment and to minimize future maintenance and replacement costs
D. The City will maintain a budgetary control system to ensure adherence to the budget and will prepare quarterly reports (excluding March 30) comparing actual revenues and expenditures to budgeted amounts.
E. The City will attempt at all times to maintain the Distinguished Budget Presentation Award of the Government Finance Officers Association.
F. The City will review and update as needed the budget policies at the beginning of each two-year budget cycle.
G. The City will provide long-term financial stability through sound short- and long-term financial planning.
H. The City will estimate its annual revenues and expenditures in a conservative manner to reduce exposure to unforeseen circumstances.
I. The City will review and update the schedule of fund balances in all operating funds of the City and determine adequacy of those balances, using specified guidelines and criteria in conjunction with budgets set annually.
J. The City will project revenues and expenditures for the next five years and will update this projection each budget process.
K. The City will not sell assets or use one-time revenue to balance the General Fund Budget.
A. The City will endeavor to maintain a diversified and stable revenue system to shelter it from annual fluctuations in any one revenue source.
B. The City will conservatively estimate and budget for its annual revenues by an objective analytical process Fees and charges will be reviewed to ensure that reasonable rates are set and at a minimum are adjusted for inflation.
C. The City, recognizing the potential cash flow problems associated with property tax collections, will budget 98% of the amount levied for tax revenue.
D. The City will establish all user charges and fees for General Fund program activities at a level related to the full cost of providing the services, or as adjusted for program goals Sensitivity to market rates will also be considered in setting fees
E. The City will set fees and user charges for the utility enterprise funds which includes water, wastewater and stormwater, at a level that fully supports the total costs including operations, capital and debt service payments Replacement (or bonding for replacement) of enterprise infrastructure will be paid for from accumulated (or annual) earnings of the system
A. The City will confine long-term borrowing to capital improvements, equipment or projects that have a life of more than five years and cannot be financed from current revenues
B. The City will endeavor to keep the total maturity length of general obligation bonds below 20 years and at least 50% of the principal shall be retired within 10 years In all cases, the maturity shall be shorter than the life of the related assets.
C. The total debt levy paid by general obligation taxes shall remain under 15% of the general fund budget
D. All debt will be issued with a fixed rate, no variable rate debt will be issued
E. Future debt issuance impacting the City’s tax levy will be planned through the Capital Improvement Plan process.
F. To minimize the need for debt, the City will maintain a strong pay-as-you-go program for capital purchases.
G. Net general obligation debt (as defined above) will not exceed the statutory limit of 3% of the estimated Full Market Value of taxable property in the City as required by Minnesota Statute, Section 473.53.
H. Where possible, the City will use revenue (including G.O.-backed revenue) or other self-supporting type bonds instead of general obligation bonds.
I. The City will not use long-term debt for current operations.
J. The City will maintain frequent and regular communications with all bond rating agencies about its financial condition and will follow a policy of full disclosure in every financial report and bond prospectus The City will comply with Securities Exchange Commission reporting requirements
K. Interfund borrowing for periods of more than one year shall only be undertaken for capital expenditures A reasonable payment schedule for repayment of the borrowed amounts will be established and interest will be charged
A. The City will establish and maintain the highest standard of accounting practices, in conformity with Generally Accepted Accounting Principles (GAAP) and with recommended best practices as promulgated by the Government Finance Officers Association (GFOA).
B. The City shall prepare Quarterly Financial Reports (except for the first quarter) and an Annual Comprehensive Financial Report for the purposes of providing finances to interested parties and the public at large.
C. The City will contract with an independent audit firm to perform an annual audit of the financial statement of the City.
D. The City will attempt at all times to maintain the Certificate of Excellence in Financial Reporting of the Government Finance Officers Association.
A. The City will develop a 10-year Capital Improvement Plan for all projects over $25,000 and will update the plan every two years.
B. The City will identify the estimated cost and potential funding sources for each project and determine the most effective financing method for the proposed project.
C. Liquor profits are a dedicated funding source of the Capital Improvement Plan.
By approval of this policy, the City Council authorizes the Finance Manager and/or City Manager to assign a fund balance that reflects the City’s intended use of those funds When both restricted and unrestricted resources are available for use, it is the City’s policy to first use restricted resources and then use unrestricted resources as they are needed. When unrestricted resources are available for use, it is the City’s policy to use resources in the following order: 1) committed 2) assigned 3) unassigned. These fund balance classifications apply only to Governmental Funds, not Enterprise or Internal Service Funds The unassigned fund balance will be in the following three categories:
The City's unassigned fund balance — working capital as of the end of the year should equal 50% of the next year’s budgeted tax revenue Any amount more than 50% will be used for budget stabilization. If the balance falls below 50%, a plan will be developed and implemented to replenish the funds. A balance equal to 50% of the next year’s budgeted tax revenue is needed to fund the following year’s operations until the tax settlement is received at the end of June.
In recognition that the amount for working capital only covers operating costs for the first six months of the year, the City wants to maintain additional resources on hand to provide for contingencies Therefore, at the end of each year, the City will maintain an amount for emergencies and maintenance of the Aaa bond rating of 10% of the next year's budget. The intent is not to use this balance except in extreme emergencies. If for any reason the balance falls below 10%, a plan would be developed and implemented to replenish the fund.
In recognition that the City’s budget is volatile, the City wants to maintain a balance to help manage the fluctuations in the budget Therefore, at the end of each year, the City will maintain an amount for budget balancing This amount will vary as positive financial results increase the amount, and negative financial results and one-time uses decrease the amount At all times, the City will implement a balanced budget Generally, the balance will be maintained at 5% to 7% of the next year's budget.
After the end of each calendar year as part of the annual financial reporting, the City Manager will update the City Council on the status of the budget balancing amount The update will include the current balances and the changes from the previous year The City Manager will inform the City Council of any one-time uses throughout the year that were not planned for during the budget process.
Some examples of when and how the balance would be used include the following:
• When the balance is greater than 5%, the City Manager may recommend that amounts be used for one-time purchases in the next year’s operating budget These will help to level expenditures from year to year.
• When workload demand increases significantly, the City Manager may recommend the use of the balance for short-term support For example, temporary staffing to assist with the light rail transit projects Many times there will be an increase in revenue due to this activity but the need for support and the timing of the revenue may differ.
• When other one-time operating needs become apparent after the budget is adopted, the City Manager may recommend the use of the balance.
• When financial results are negative, the balance would be used.
• If for any reason the balance falls below 5% and staff believes this will not self-correct, a plan would be developed and implemented to replenish the fund.
The City maintains internal service funds as a tool to purchase goods and services centrally and then charge the costs back to the departments that use the service This provides more accurate information of the cost to provide City Services The City maintains the following internal service funds:
• Information Technology
• Facilities
• Property/Workers’ Compensation
• Fleet Services
• Employee Benefits
Internal service funds will maintain unrestricted net assets of 15% to 20% of the annual budget Funds with a capital component, facilities, fleet and information technology will also maintain one year of the capital budget The selfinsured dental fund will maintain three months of average claims in reserve. This will provide for adequate cash flow for operations and provide flexibility to meet the City’s capital needs
The City of Eden Prairie maintains enterprise funds for the following activities:
• Water
• Wastewater
• Stormwater
• Liquor
Water, Wastewater, Stormwater
The City of Eden Prairie periodically works with a consultant on a utility rate study for financial planning purposes to ensure that revenue collected will provide for operating and capital costs for the systems The most recent update to the study was completed in 2017. The study included an analysis of the cost of service, capital improvement planning, utility rate design, revenue adequacy evaluation and proposed rate adjustments The study also provided a recommended policy for the amounts to maintain in unrestricted net assets The City’s policy agrees with this recommendation. The unrestricted net asset policy is as follows:
• An amount equal to 90 days of operating expense
• An amount equal to the following year’s debt service principal and interest
• A capital reserve of two years’ capital expense
The expectation is that these reserves will provide for the long-term funding needs of the utility operations.
Liquor
Generally, all liquor store profit from operations is transferred to the Capital Improvement and Maintenance Funds Exceptions may include maintaining profit for planned improvements
Other Policies
There are other policies related to the City’s budget and finances which are not included in this document These polices include:
• Post Issuance Compliance Policy for Tax Exempt and Tax Advantaged Obligations
• Business Subsidy
• Community Development Block Grant Funds (CDBG)
• Human Service Funding
• Tax Increment Financing
• Investments
• Capital Asset
• Credit Card
• Purchasing
The budget is the vehicle through which the City establishes the appropriations of the City and reflects the allocation of limited revenue among competing uses. The allocation is accomplished through a comprehensive budget process The City Council approves a budget resolution which authorizes spending based on estimates of the financial resources required to support these expenditures A public hearing takes place before legal adoption of the budget
Winter 2022 Complete Citywide workplans
February 2023 City Council planning session
March 2023 Budget kickoff meetings, prepare Internal Service Fund budgets
May 2023 — City Council workshop, review prior year audited financial results, review community survey results, staff budgets due
June 2023 Budget rework, Council workshop preparation
July 2023 — City Council budget workshop
September 2023 Preliminary tax levy and budget adopted
October 2023 — Budget engagement
November 2023 City Council workshop on Enterprise Funds
December 2023 — Public hearing, adoption of final tax levy and budget
May–August 2024 — 2025 tax projection updated, 2025 budget may be amended before tax levy certification
September 2024 Budget amendments presented to City Council, workshop on Capital Improvement Plan, amended budget and tax levy certified by Sept. 15
December 2024 — Public hearing on 2025 budget and Capital Improvement Plan, budget and tax levy adopted
The appropriated budget is prepared by each department and division The department directors and division managers may make transfers of appropriations within a division Transfers of appropriations between divisions require the approval of the City Manager Any changes in the total budget of each fund requires approval by a majority vote of the City Council.
The City plans for capital maintenance and improvements by preparing a 10-year Capital Improvement Plan (CIP) The CIP represents a framework for planning the preservation and expansion of capital including equipment, facilities and infrastructure It sets forth the estimated schedule, timing, and details of specific improvements by year, together with the estimated cost, the need for the improvement and sources of revenue to pay for the improvement The plan is updated every other year during the second year of the two-year operating budget preparation The plan authorizes the expenditures for the first two years of the 10-year planning period.
The City Council considers the following when preparing the CIP for each project and for the overall plan:
• Condition of the City’s infrastructure, including the projected need for repair or replacement
• Likely demand for the improvement
• Estimated cost of the improvement
• Available public resources
• Level of overlapping debt in the City
• Relative benefits and costs of alternative uses of the funds
• Operating cost of the proposed improvement
• Alternatives for providing services most efficiently through shared facilities with other cities or local government units
Each department documents and prioritizes their requested projects The cost estimates for each request include capital and operating budget costs that would result from the project.
Finance then analyzes the requested projects and compares the requests to funds available A CIP committee consisting of the department heads meets to make a final recommendation to the City Manager of the proposed CIP projects. The City Manager makes the final recommendation to the City Council on which projects to include and fund in the CIP.

The proposed 2024 budget presented to the City Council
5, 2023, is the same budget adopted by City Council Dec. 5, 2023. This budget complies with City financial policies
*The greater than 10% change in fund balance for the General Fund is a result of revenues and expenditures performing favorably in 2022 Revenues were $1.2-million over budget while expenditures were $1.3-million under budget.
**The greater than 10% change in fund balance for the Capital Project Funds is a result of planned spending and varying annual expenditures.

The City of Eden Prairie’s largest sources of General Fund revenue are property taxes, charges for services, and licenses and permits For 2022, Intergovernmental Revenue is larger than typical due to federal funds received for the COVID19 pandemic A review of all revenue sources is completed with the biennial budget. Revenues are projected based on information from City staff, Hennepin County, other external sources and analytical review. Charges for Services are reviewed annually to ensure reasonableness and may be adjusted for inflation.


Property tax revenue is the single largest source at 77% of the General Fund budget. The City strives to balance increases in property taxes with the demand for services Tax revenue is projected to increase 5.7% for 2024 and 5% for 2025.
Property tax revenues are collected by the County and passed through to the City Every property owner is subject to property tax by the County, the school district and the City in which the property is located, and other special authorities such as watershed districts. The estimated market value is a valuation set upon real estate and certain personal property by the City Assessor as a basis for levying property taxes This value is converted to tax capacity by a formula specified in state law The tax levy is the amount raised by general property taxes
While property taxes are difficult to compare across cities due to differences in tax base, growth, level and quality of services, Eden Prairie’s property tax rate compares favorably to other nearby cities
Please see the 2023 City Tax chart below based on a median-valued home of $536,400
Source: Applicable county tax rate schedules
Charges for Services, 11% of the General Fund budget, includes membership dues, daily fees and program fees for parks and recreation programs The City collects fees for recreation programs based on a policy approved by the City Council in 2008. For 2024 and 2025, these revenues are projected to increase 7.4% and 1.8%. The increase is a result of anticipated improvement in City parks and recreation program revenues recovering from the pandemic
Fee schedules are reviewed annually by the Parks and Recreation Department and adjusted accordingly Cost recovery for the various recreation programs depends on the type of service offered Basic services are those that every taxpayer is entitled to receive Cost recovery within the basic services range from 0% to 75% Enhanced services are special events or activities to which the community is invited without a fee Minimum cost recovery for these types of programs ranges from 10% to 50% with the goal to obtain sponsorships for the entire cost of programs. Fee-assisted services are programs that have a high-cost recovery as well as programs with mandated fee levels These programs recover costs up to 85% to 100% Fee-supported services are programs provided at no cost to the taxpayers and in many cases show a profit.
License and permit fees are 7% of the General Fund budget For 2024, they are projected to increase 2.4% and remain relatively flat for 2025.
Per Minnesota Statutes 462.353, subd. 4(a), a city may charge fees that are sufficient to defray the costs incurred by the city in reviewing, investigating and administering an application for an amendment to an official control, or an application for a permit or other approval required under an official control Fees are required by law to be fair, reasonable and proportionate, and have a nexus to the actual cost of the service for which the fee is imposed. All
cities are required to adopt management and accounting procedures to ensure fees are maintained and used only for the purpose for which they are collected
Revenue from building permits and fees make up a large part of the license and permit revenue It is dependent on the number of housing starts, subdivision plats and commercial development applications Every two years, City staff review the fees charged and recommend adjustments based on inflation and the cost to provide the service. As shown in the graph below, revenue can vary significantly each year.
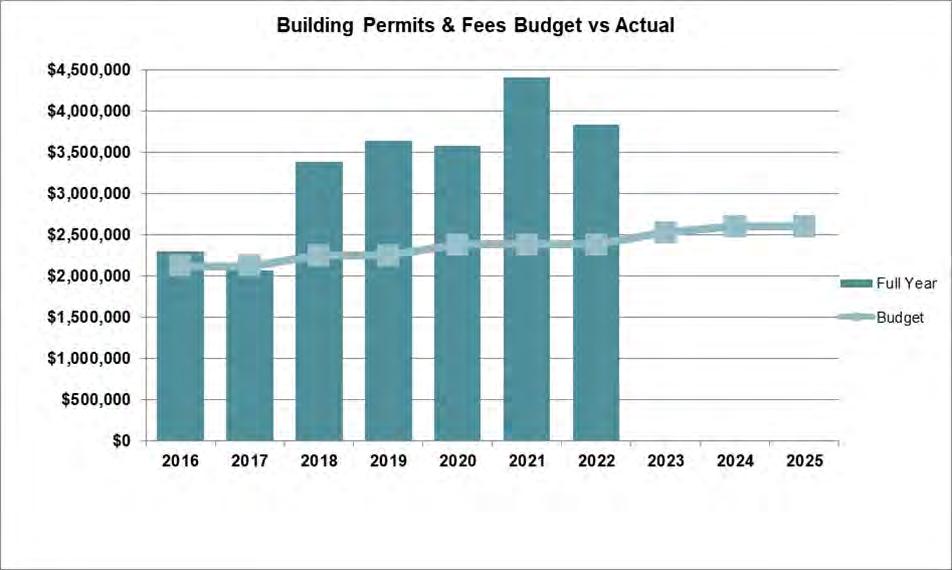
Businesses continue to invest in Eden Prairie. We expect the City will remain a favorable location to conduct business. Staff continue to discuss what a good base number is for development revenue to avoid being too aggressive and causing potential midyear operational challenges, while also recogniz ing that increased development activity will increase revenue and service demand.
Intergovernmental revenue sources include Federal and State grants, State aid and local grants This revenue is 3% of the General Fund budget For 2024 an increase of $466,875 is expected due to increased funding from Eden Prairie Schools for School Liaison Officer wages and benefits Beginning in 2023, the school district split the cost 50/50 with the City which is consistent with surrounding peer cities For the 2023-2024 school year, there are 4 FTE liaison officers This will increase to 4.5 FTE liaison officers for the 2024-2025 school year For 2025, revenue will increase 0.9%.
Internal Service Funds receive revenue through user chargeback of expenses The City’s Internal Service Funds include Employee Benefits, Facilities, Fleet Services, Information Technology and Property Insurance The expenses of these funds are charged to the General Fund and Enterprise Funds based on a cost-recovery allocation methodology. These allocation methods are reviewed and updated every two years with the City’s budget cycle Other revenue is primarliy fleet disposal proceeds. More information on the Internal Service Fund expenses can be found in the department summary section
The drinking water, wastewater and stormwater utility is the largest source of the Enterprise Funds revenue budget at 64%, followed by liquor sales at 36%. Other revenue is primarily investment earnings, assessments and contributions of utilities by developers Overall revenues are projected to increase 2.1% for 2024 and 3% for 2025.


The City periodically updates the 10-year utility rate study for water, wastewater and stormwater In 2017, AE2S was retained to update the study The study provides a long-term and comprehensive plan for funding operation and maintenance, and the capital needs of the three utilities. Financial costs of service are balanced with rate changes. Staff monitors financial results against expectations to ensure appropriate levels of funding for the operations A residential utility bill of 18,000 gallons a quarter is expected to increase 3% for 2024 and 2025.
Eden Prairie has the fourth largest municipal off-sale operation in Minnesota. Sales for the City’s three municipal liquor stores in 2024 are projected to increase 0.8% from the 2023 budget and increase 3.1% in 2025. City policy states that liquor profits are transferred to the Capital Improvement Program Operating income is projected to be $865,271 and $878,865 in 2024 and 2025 respectively.
The City utilizes a five-year budget model for its General Fund to assist in long-term strategic planning and to detect any future structural funding and property tax levy problems as early as possible. This section looks at these projections and the assumptions used to develop the projections.
Property Values — The City expects to see increased valuations going forward The Twin Cities Metropolitan Area is one of the fastest growing regions in the Midwest The region has low unemployment, a high-quality workforce, robust transportation system, excellent business culture and high quality of life We believe these trends, along with the investments we continue to see in our community, will maintain and increase property values
Tax Levy — The property tax levy is the City’s largest revenue source The General Fund tax levy is projected to increase 6% in 2026, 5% for 2027 and 2028 respectively, and 4% for 2029 and 2030 respectively. The even years will see a larger increase as the City needs to budget additional expenses to cover election activity. We project tax levy increases to moderate in coming years as the current higher inflation rates decrease. The total levy which includes the General Fund, debt and capital levy will fluctuate each year due to the issuance of debt in 2025, 2027 and 2032. This recognizes the need to maintain our services with incremental change as needed As each budget is fine-tuned, we have flexibility to adjust as needed.
Charges for Services — Recreation charges are increased annually to account for increases in the costs to provide service. For 2026 thru 2030, charges for services are projected to increase 3% annually. Since 2022 the City has been building back Community Center memberships. By 2026, the City anticipates revenues to be back on track to prepandemic times
License and Permit Fees — Building permit and fees are reviewed every two years by City staff Adjustments are made based on inflation and the cost to provide service Generally, the budget has increased approximately 4% every other year This has allowed builders to better plan for fee changes
Personnel Costs — Wages and benefits continue to be the largest driver of the operating budget For the budget model, we have planned for a 5% increase in wages for 2026 and 2027 and then 4% for 2028-2030 This recognizes base increase, step and performance pay, and employee turnover The increase is due to a compensation study done in 2023 that included adjustments to the performance and step ranges. Also, as baby boomers continue to retire, the City has been proactive in succession planning. Health insurance rates for 2026 are projected to increase 5% and then 10% for 2027-2030 The City periodically conducts a Request for Proposal (RFP) process to procure insurance. The City has finalized a contract with HealthPartners which ends in 2025 The rate for the first year of this new contract is lower than the previous year and the remaining two years on the contract are capped at a higher rate
Total Expenditures
Total General Fund expenditures are expected to increase between 3.7% to 4.5% annually to fund current City services. The City sees higher increases in the even years as additional expenses need to be budgeted to cover election activity
Debt — Debt levy payments remain stable thru 2025 In 2026 the 2020A bonds will be retired The decrease in the levy from the retirement of the 2020A bonds will be partially offset by the issuance of debt in 2025 for new fire engines and the Police Department remodel, and in 2027 and 2032 for additional fire engines.
Contingency Planning
The City employment base is populated with a healthy combination of retail, professional and light industrial businesses. The City does not rely solely on a single sector of employment and is able to better weather fluctuations in national and international economic changes In addition, we maintain reserves to provide temporary resources as needed. We also have flexibility in our budget.
Limited Developable Land — The City is almost fully developed. We have started to see more redevelopment, which continues to add value to the community Redevelopment trends may be volatile, and the City is able to respond to these changes with our contingency plans
Structural Balance — The General Fund long-term model reflects conservative estimates of revenue and expenditures, and shows a balanced budget for all years except 2024 and 2025. The City is still steadily rebuilding back to prepandemic amounts and will use ARPA money received in 2021 and 2022 to cover the shortfall Each budget cycle the model is adapted to include changes in inflation, community growth, program choices and levels of service The subsequent modeling provides a financial context for understanding funding requirements to maintain quality services The out-years will be tempered with possible levy limits, program choices and policy-influenced levels of service. The General Fund is part of a larger model to ensure the City has adequate resources to pay for services and to manage cyclical downturns
The projections for 2026 to 2030 are shown below.

A capital improvement is a major expenditure of City funds. For the Capital Improvement Plan (CIP), the City defines capital as the cost of a single project or piece of equipment over $25,000. Projects under $25,000 appear in the operating funds and on a limited basis in the CIP
Capital Improvement Fund
Projects paid for out of the CIP do not have another funding source. Funding for the CIP includes liquor profits, tax revenue, lease revenue, franchise fees, transfers-in, interest and other miscellaneous sources. One-time money received is typically transferred into the CIP The City uses the CIP and pay-as-you-go financing whenever possible.
Pay-as-you-go is a method of financing capital projects with current revenues — paying cash instead of borrowing against future revenues Pay -as-you-go works well where capital needs are steady and financial capability is adequate. This method saves interest costs since interest on long-term bonds can more or less equal the original capital costs, depending on interest rates and repayment schedules It also protects borrowing capacity for unforeseen major outlays that are beyond any current year’s capability, and it fosters favorable bond ratings when long-term financing is undertaken.
Projects paid from the CIP include maintenance of approximately 235 miles of City streets as well as new trails, sidewalks, park maintenance, fire and police equipment.
The City funds capital projects out of the Fleet Services, Information Technology and Facilities Internal Service Funds Fleet Services manages the acquisition and disposal of nearly 300 vehicles and pieces of equipment. Information Technology includes the maintenance of the City’s internal and external network infrastructure and replacement of various software. Facility projects include improvements, repairs and maintenance of the City’s 32 buildings
Projects under Utility Funds include maintenance to the City’s utility infrastructure These projects are part of the 10year CIP and the utility rate study to ensure adequate funding amounts are collected
Finance
Public Works
Facilities
Fleet
Information Technology
Finance/Utility Billing Software
$250,000
The City's current financial and utility billing applications provided through the LOGIS consortium are 20+ years old and in need of major updates that will require as much time and effort as converting to a new system altogether The City has contracted with BS&A for implementation of the new applications.
Operating Budget Impact — The City is expecting an annual savings of $250,000 after converting to BS&A.
Knox Box Key Secure System
$100,000
The current system is no longer available The new system will replace end-of -life equipment to ensure secure keys are available in fire apparatus and police squads.
Operating Budget Impact — A $700 annual cloud subscription is required with the new system.
Hose Container Suppression
$150,000
A portable hose container system to enhance response and increase capabilities in areas of the City without effective fire hydrant coverage and/or water supply.
Operating Budget Impact — No additional maintenance costs.
Flying Cloud Dog Park Expansion
$125,000
Construct additional parking at the Flying Cloud Drive Dog Park and add fencing.
Operating Budget Impact — Additional maintenance costs with the increased parking and fencing.
Miller Park Indoor Court Facility
$150,000
Design costs for indoor tennis, pickleball and basketball courts at Miller Park
Operating Budget Impact — Increased costs for staffing, heating and maintaining the facility Revenue from court reservation fees would help offset the increased operating costs.
Aerial Lift $115,000
Purchase for tree-trimming and removal in areas not accessible with a bucket truck or other equipment.
Operating Budget Impact — This is new equipment and would add maintenance costs to the operating budget
Conservation Area Erosion Control $350,000
Install a new retaining wall along the paved trail at the Richard T Anderson Conservation Area and fix other erosion issues throughout the site. The area is experiencing severe erosion and if left alone many trees are at risk of falling on trails
Operating Budget Impact — Minimal impacts after the new retaining wall is installed
Fire 1 HVAC System $275,000
Replace critical HVAC components at Fire Station 1 with a focus on energy-efficiency and sustainability to include a Johnson Controls energy management system tying into existing systems.
Operating Budget Impact — Reduction in heating and cooling costs
Fire 2 Roof Replacement $355,000
Replace the more than 35-year-old roof that has been a source of leaks and ongoing maintenance issues.
Operating Budget Impact — Reduced maintenance costs associated with the old roof
City Center West Cooling Tower Replacement $175,000
The equipment has exceeded its useful life and needs replacement before failure.
Operating Budget Impact — No significant additional maintenance costs
Public Safety Application Upgrades $120,000
Application upgrades to remain current including interfacing with mobile devices.
Operating Budget Impact — Increases will be added to the operating budget for new functionalities.
Water Meter Change-Out $400,000
Final year for installing new water meter system which provides continuous water use data through integrated technology for utility customers.
Operating Budget Impact — Reduced labor and fleet costs since the new system does not require employees to drive by each address to obtain water meter readings Additionally, water use data is obtained more easily by users and may lead to reduced water use Reduced water use equates to less infrastructure growth to meet future water demands.
Water Treatment Plant Compressed Air System Replacement $310,000
Replace the 35-year-old air compressors used for control system air supply. Repair parts are difficult to source and it is time to upgrade to a more efficient system.
Operating Budget Impact — Reduced electrical costs due to a more energy-efficient system.
Water Treatment Plant SCADA System Software Replacement $248,000
Replace the existing control system software used to provide SCADA for the Water Treatment Plant, wells and water storage systems. The project includes significant system integration work to make future troubleshooting and programming simpler and less time-consuming
Operating Budget Impact — Reduced maintenance costs to troubleshoot programming errors.
Water Treatment Plant Surveillance System Upgrade $265,000
Upgrade the existing video surveillance system including new servers, software and cameras The current system is outdated and requires additional maintenance This project is funded by both the water and wastewater funds.
Operating Budget Impact — Reduced maintenance costs to replace faulty equipment
Water Treatment Plant East Side Retaining Wall Reconstruction $160,000
Remove the existing retaining wall, widen the roadway and replace the retaining wall to allow for better flow of delivery vehicles and lime sludge removal trucks.
Operating Budget Impact — Minimal impact to the operating budget.
Water Treatment Plant West Side Retaining Wall Reconstruction $225,000
Remove the existing retaining wall, widen the roadway and replace the retaining wall to allow for better flow of City utility vehicles.
Operating Budget Impact — Minimal impact to the operating budget.
Washington Avenue Sewer Lining $291,750
Replace 1,880 feet of 15-inch sanitary sewer main on Washington Avenue with a structural liner to avoid system interruptions and possible sewer backups on private property.
Operating Budget Impact — Rehabilitation of the existing infrastructure may prevent future maintenance costs.
Homeward Hills Road Sewer Lining $940,000
Perform a lining replacement on 4,860 feet of 8-inch sanitary sewer main on Homeward Hills Road to proactively prevent failure and sewer backups.
Operating Budget Impact — Rehabilitation of the existing infrastructure may prevent future maintenance costs.
Washington Avenue Sewer Lining (Phase 2) $927,000
Replace 5,150 feet of 9-inch clay sanitary sewer main on Washington Avenue to prevent future failure and eliminate infiltration of ground water.
Operating Budget Impact — Rehabilitation of the existing infrastructure may prevent future maintenance costs.
Dell Road (Crestwood Terrace to CSAH 61) $1,200,000
Upgrade the existing rural unimproved roadway section to a two-lane urban collector street with curb and gutter, storm sewer, bituminous trail to Flying Cloud Drive, creek crossing and pedestrian underpass.
Operating Budget Impact — New pavement and stormwater facilities will reduce or eliminate the need for frequent gravel, erosion and grading repairs. The new roadway and utilities will be added to our standard preventative maintenance programs.
Prairie Center Drive/Franlo
Install a new traffic signal at the Prairie Center Drive/Franlo Road intersection. The project will also include geometric revisions and improvements to the intersection to accommodate signal operation and improved pedestrian accommodations.
Operating Budget Impact — The City will be responsible for the operation, maintenance and energy costs for the signal. Overall impacts are minimal.
Birch Island Dredging and Inlet Modification $500,000
The Birch Island Lake bypass system was installed in 2007 to restore a higher water level and brings additional water from Highway 62 to the lake. However, the system's inlet is located within the lake and is not readily accessible, making for maintenance and inspection difficult. Additionally, sediment has accumulated near the inlet impairing its function This project aims to bring the inlet closer to shore and dredge accumulated sediment.
Operating Budget Impact — The project will reduce long-term maintenance of the Birch Island Lake Bypass System
Smetana Outlet Modification $125,000
Two custom masonry outlet structures for the forebay to Lake Smetana are in disrepair. The forebay provides treatment of stormwater discharges before it reaches the lake The outlet structures need to be rebuilt or replaced. The culverts through the berm separating the forebay and lake may also need to be replaced.
Operating Budget Impact — Minimal impacts are expected.
Pond 14-34-A Dredging $175,000
Pond 14-34-A has been identified as a priority dredging pond. The pond receives runoff from a large highly developed area It has accumulated sediment limiting its efficiency at removing stormwater pollutants before discharging to Eden Lake, Neill Lake and Purgatory Creek.
Operating Budget Impact Minimal impacts are expected.

The City of Eden Prairie strategically uses debt to provide consistency in its high-quality municipal services, without subjecting residents and business to dramatic fluctuations in taxes. From 2024 to 2025 debt payments supported by the tax levy are projected to remain approximately 4% to 5% of the General Fund budget The City has a policy of maintaining a debt percentage of 5% to 15% of the general fund budget as this is considered a moderate debt burden
Moody’s Investors Service has assigned its highest rating, Aaa, to the City of Eden Prairie’s bonds for every debt issue since 2003 Standard and Poor’s Financial Services has also assigned its highest rating of AAA to the City of Eden Prairie’s bonds outstanding. These exceptional bond ratings ensure the City receives the most competitive interest rates The City’s bond ratings reflect Eden Prairie’s extensive and diversified tax base, low amount of rapidly amortized debt and capably managed operations
The City issues general obligation bonds to provide funds for the acquisition and construction of major capital facilities. General obligation bonds are direct obligations and pledge the full faith and credit of the City.
The City also issues assessment debt with governmental commitment to provide funds for the construction of streets and utilities. These bonds are repaid from amounts levied against the property owners who benefit from this construction. If a deficiency exists because of unpaid or delinquent assessments at the time a debt service payment is due, the City must provide resources to cover the deficiency until other resources are received. Assessment debt with governmental commitment has been issued for governmental activities.
The City also issues tax abatement bonds. These bonds and interest thereon are payable from abatements collected from certain property owners in the City. If abatement revenues are insufficient to meet principal and interest due, the City is required to levy ad valorem taxes without limit as to rate or amount on all taxable property in the City to make up the deficiency.
The City also issues general obligation utility revenue bonds to provide funds for the acquisition and construction of major capital facilities. General obligation bonds have been issued for business-type activities and are paid from charges collected from utility funds customers.
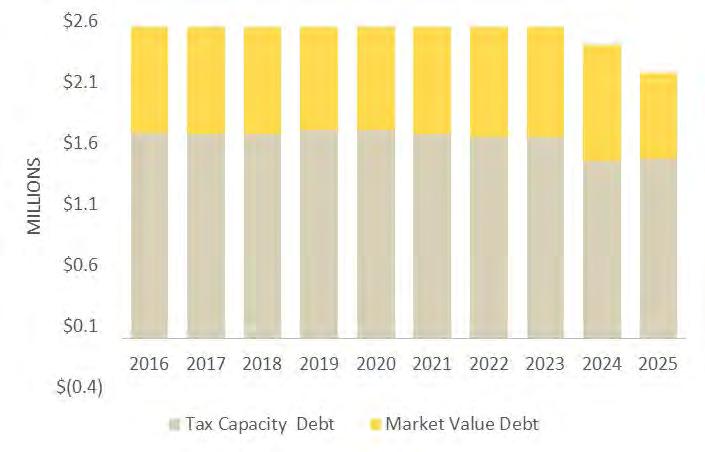
The City formally budgets and levies taxes for general obligation bonds which include amounts levied against tax capacity and amounts levied against market value Following is a summary of the total debt levy from 2016 to 2025 and a summary of the tax levy by bond issue for 2023 to 2025:
Debt Levies 2016-2025
2023 to 2025
Minnesota Statute limits the amount of debt the City may issue to 3% of the assessor’s market value of the City’s tax base The assessor’s 3% market value less net debt is referred to as the legal debt margin The following table shows the legal debt margin on Dec. 31, 2022.
Estimated Market Value ('21/'22)
As shown in the table, the City is significantly under the legal debt limit This puts the City in a secure position because debt can be issued if necessary
On Dec. 31, 2023, the City’s net tax supported debt outstanding was $2,455,000 of general obligation bonds and $11,185,000 of tax abatement bonds and total debt was $25,224,000. Projected changes in bonds payable during 2024 and 2025 are summarized below.
The City plans to issue debt for fire engines in 2025, 2027 and 2032, a Police Department remodel in 2025 and Rink 1 flooring in 2025 See schedule below for future issuance of debt
The timing of the purchase and bond issuance could change.
Below summarizes debt outstanding at the end of each year from 2024 to 2038. Within the next 10 years, 83% of the City’s debt will be paid.
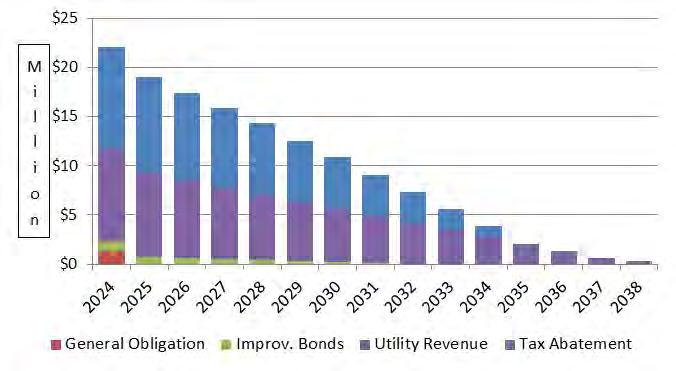
Annual debt service payments to maturity for all debt and future interest outstanding as of Jan. 1, 2024, are as follows (in thousands of dollars):


Administration includes the City Council, Office of the City Manager, Legal Counsel, Property and Workers’ Compensation Insurance and City Clerk, and the Communications, Finance, Human Resources, Facilities and Information Technology divisions Facilities, Information Technology and Property and Workers’ Compensation Insurance budgets are detailed in the Internal Service Fund section of this document All other Administration functions are included within the General Fund
The functions of the Administration divisions range from managing the City’s facilities and technology needs to external communication and the City budget. Records management, elections and boards and commissions are also part of the Administration Department Each division also supports the City’s core service departments.
The City of Eden Prairie operates under a statutory Plan B form of government with a council-manager system, with day-to-day administrative duties led by the City Manager The City Council delegates all administrative duties to the City Manager, who is accountable to the Council for the effective administration of City business.
State law requires each City to retain an attorney The City Manager — with consent of the Council — appoints the City Attorney . Since 1978, the City has retained the services of Gregerson, Rosow, Johnson & Nilan.
The City Clerk is responsible for administration of elections, official records management and city code maintenance
Communications manages the internal and external communications of the City including marketing and community engagement
Finance overseas all financial activity including capital improvement planning, budget coordination, debt management, investments and liquor operations More information about Eden Prairie Liquor is available in the liquor fund section of this document
Human Resources is responsible for labor relations, compensation and benefits, training, organizational development and support services


Personnel Services (wages and benefits) are increasing $412,873 or 15% for 2024. A large portion of the increase, $292,555, is due to the hiring of part-time staff for the 2024 election The 2025 personnel services budget reduction reflects the removal of the election staff
Supplies are increasing $2,790 in 2024 to better reflect actual expense trends A 2.9% decrease is projected for 2025.
Contractual Services are increasing 2.1% or $28,010 in 2024 due to election ballot printing and legal expenses The 2025 budget for this category is increasing 0.4%.
User Charges account for the Internal Service Fund expenditures. These charges represent Administration’s share of Facilities, Information Technology, and Property and Workers’ Compensation insurance Every two years user charge allocation methods are reviewed and adjusted to more accurately reflect service levels provided Due to this adjustment, the 2024 user charge is increasing $24,680 or 3.2% for 2024 and decreasing 9.4% for 2025. The driving factor for the decrease in 2025 is related to a new, less expensive ERP system in Finance
Mitigate risk and liability to the City through sitespecific training, safety committee meetings and annual training These strategies allow the City to maintain a workers’ compensation experience modification rating less than the industry average (1.0), which results in reduced insurance premiums.
Maintain high resident ratings of excellent or good on
Maintain highest available bond rating from Moody’s, and Standard and Poor’s
Preserve and expand capital that is sustainable and affordable by preparing a fiscally balanced budget and 10-year balanced Capital Improvement Plan
Goal High-Quality Efficient Services
Maintain or increase resident ratings of excellent or good on
of use of the City website at or above
Maintain or increase percentage of residents who consider website preferred City information source
Maintain or increase percentage of residents who consider “Life in the Prairie” newsletter preferred City information source
Maintain resident ratings of excellent or good on quality of overall employee customer service
Maintain the employee partnership survey job likability response and a positive, engaged and passionate work culture by providing diverse, enriched training and wellness opportunities
of the City Manager
The Community Development Department supports the long-term vitality of the City through land-use planning, development review, business, housing and community service support needs, and responsible property valuations It includes the Assessing, Economic Development, Housing and Community Services, and Planning divisions
Community Development Administration oversees the divisions, represents the department at City Council meetings, coordinates special projects, collaborates with other units of government and agencies, takes an active role in large development and redevelopment projects, and negotiates development and financial agreements
Assessing establishes annual property valuations, inspects every property once every five years per state law, provides staff support to the Board of Appeal and Equalization and represents the City in Minnesota Tax Court matters
Economic Development provides services promoting business growth, development and redevelopment, and advocates for transportation infrastructure improvements and helps developers navigate the development review process
Housing and Community Services is responsible for affordable housing initiatives, rehabilitation loan programs, human services coordination and agency contracts, and cultural assistance. Staff members support the Human Rights and Diversity Commission and the Property Managers Group.
Planning performs zoning code updates, development, sign permit and telecommunication reviews, and overall comprehensive planning for the City The Aspire Eden Prairie 2040 comprehensive plan was approved by the Metropolitan Council in August 2019 and adopted by the City Council in October 2019. Staff members support the Planning and Heritage Preservation commissions.


Personnel Services are budgeted to increase 3% in 2024 and 5% in 2025 due to base salary and step increases
Supplies are increasing 18.9% in 2024 and 3.4% in 2025. The increase is due to postage for property tax valuation notices as well as proposed community engagement groups.
Contractual Services are decreasing $45,352 or 15.5% for 2024 due to reduced need for special area studies and emerging issues A modest 1% increase is budgeted for 2025.
User Charges are decreasing $5,393 in 2024 due to allocation cost adjustments in the Facilities charges for Housing and Community Services. An increase of $19,322 or 5.8% is expected in 2025 primarily due to allocation cost adjustments in the IT charges for Assessing related to property data technology.
Overall, the Community Development budget is increasing 0.5% for 2024 and 4.7% for 2025 primarily for personnel services
Goal - Community Well-Being and Safety
Objectives
Maintain the City’s affordable housing score by preserving and developing affordable housing and implementing an inclusionary housing policy into City developments The Housing Opportunities Amount Score (ALHOA) assesses local efforts to maintain and support low- and moderate-income households The score ranges from 0 (lack of housing activity) to 100 (outstanding performance) *
Goal – Economic Vitality
Objectives
Support a prosperous economic base for business growth and development by implementing Aspire Eden Prairie 2040, the City’s comprehensive plan, ensuring code amendments and rezoning of properties are consistent with the 2040 plan
Maintain the percentage of Eden Prairie businesses satisfied with the City’s decision-making process on business survey
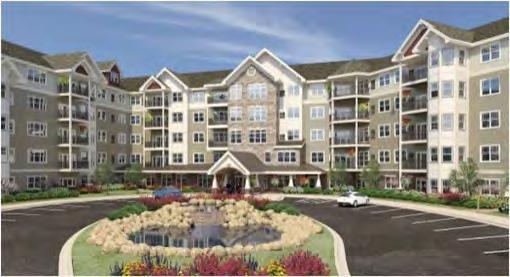
Facilitate development of affordable housing, particularly near LRT stations, with grant applications and tax incrementing financing
Maintain a strong employment base (total # of jobs) by continuing business meet-and-greets, coordinating annual contracts with Hennepin County for small business resource program, supporting business retention, expansion, rehabilitation and renovation
Goal – High-Quality Efficient Services
Objectives
Improve review procedures and efficiencies, including online payment of fees and permits
Meet state mandated ratio of property valuation versus property sale purchase between 90-105%
Goal – Innovative and Sustainable Practices
Objectives
Facilitate approval, implementation of industrial flextech zoning district, monitor appropriate timing for ecoinnovation zoning districts in accordance with the City’s comprehensive plan
*The Metropolitan Council discontinued the housing opportunities score in 2022. To maintain eligibility for grants, loans and participate in the Livable Communities Act programs, the City’s housing policy is subject to approval by the Metropolitan Council Housing efforts are measured in six areas: production of new affordable housing, rehabilitation and preservation of existing affordable housing, expenditures meet or exceed the Affordable & Life-Cycle Housing Opportunities amount, presence of programs supporting low-income households, shelters and supportive housing, and creation of a Housing Action Plan for future housing innovations.
The Parks and Recreation Department provides the community with comprehensive recreational amenities and programming This includes parks and trails planning and development, facilities maintenance, forestry, leisure services programming and special events.
A goal of the department is to enhance the quality of life in the City and promote a stronger sense of community among residents and businesses. The Parks and Recreation Department includes Administration, Parks and Natural Resources, Recreation Services and the Community Center.
Administration supervises the entire operation, leads park acquisitions, and provides department planning and budgeting.
Parks and Natural Resources provides forestry, wildlife and natural resources management, park and trail maintenance, and cemetery administration
Recreation Services coordinates the programming of all areas including youth and family programs, organized athletics, community art events, therapeutic recreation and Art Center, Senior Center and Outdoor Center classes.
The Community Center manages and operates a 239,000-square-feet facility including three ice arenas, three indoor pools, gyms, courts, fitness and cardio equipment Round Lake and Riley Lake beaches, and park facility rentals are also managed by the Community Center.
Administration 3%
Community Center 40%


Park Maintenance 34%

Recreation Services 23%
Personnel Services are projected to increase $403,797 or 5.5% in 2024 and $356,248 or 4.6% in 2025 due to base salary and step increases An additional 1.2 FTE was added in 2024 to better meet the needs of the recreation services area.
Supplies are increasing $45,670 or 8.7% in 2024 and projected to increase $12,660 or 2.2% for 2025. These increases are primarily driven by increased costs for turf fertilizer, splash pad chemicals and Art Center programming
Contractual Services are increasing $45,541 or 3% in 2024 and $47,059 or 3% in 2025. Increases are expected in community celebrations such as the summer concert series, theater programming and waste disposal in the parks.
User Charges are budgeted to increase $354,530 or 7.1% for 2024 and 3.4% for 2025. These increases are related to increased IT expenses with equipment and software added in aquatics, park maintenance and the Art Center. Additional increases are noted in facilities user charges for energy costs to heat and cool the park buildings, particularly the Community Center.
Capital under $25,000 is projected to increase $9,650 or 4.8% in 2024 and decrease 5.9% in 2025. This is the result of new volleyball net systems at the Community Center
Maintain the number of annual Community Center visits by including adaptive swim lessons and removing barriers to participation
Expand safety classes to include babysitter training, water safety, CPR and first aid
Add missing trail and sidewalk links identified in the City’s pedestrian and bicycle plan
Convert turf areas to pollinator friendly native
Protect urban forest from disease such as Dutch elm, oak wilt and emerald ash borer by removing infested trees
Maintain Community Center memberships by serving and attracting new populations with sensory-friendly and women-only swim events
Enhance Citywide events to provide a greater sense of welcome and belonging to all residents by installing welcome signs in multiple languages, providing a diverse selection of food options, sensory-friendly areas, and events for attendees with disabilities
Improve resident ratings of excellent or good on Eden Prairie’s sense of community
*Parks and Recreation facilities were closed during 2020 due to the coronavirus pandemic.
Recreation Services
The Police Department protects and serves the community through active and professional engagement The department is committed to providing customized service, exercising discretion and fairness in enforcement, building public trust and promoting the professional development of its force.
Crime Prevention, Field Training, SWAT, Traffic
Support Animal Control, Code Enforcement, Licensing, Records
Professional Staff includes 911 emergency dispatch services, records, licensing and community service officers Eden Prairie Police operates its own dispatch center allowing for enhanced, personalized customer service. The dispatch center answers approximately 45,000 calls for service annually The Animal Control Unit responds to nearly 1,300 calls for service annually dealing with domestic, wild and livestock animal concerns.
The Patrol Division includes eight units serving the needs of the community by protecting victims and apprehending criminals. The Crime Tech Unit includes a sergeant and eight officers specially trained to process evidence from crime scenes including fingerprints, shoe prints and DNA The Crisis Intervention Team (CIT) includes a sergeant and four officers specially trained in crisis intervention techniques. The Domestic Abuse Response Team (DART) includes one sergeant and five officers trained to help domestic abuse victims Both the CIT and DART teams work closely with the embedded social worker to provide needed services and referrals.
under $25,000 0%


Personnel Services 79%
Personnel Services are increasing $1,015,474 or 7% in 2024 and $894,503 or 5.7% in 2025. These additions are due to salary and step increases, the addition of a 0.5 FTE, and an increase in health insurance and workers’ compensation insurance premiums
Supplies are increasing $45,000 or 12.4% in 2024 and $9,100 or 2.2% in 2025. The increase in 2024 is a result of uniforms for a new cadet program as well as cost increases for ammunition.
Contractual Services are increasing $4,222 or 0.8% in 2024 and 0.3% for 2025.
User Charges are increasing $449,016 or 17% for 2024 and $120,970 or 3.9% for 2025. Increases are noted in fleet operations due to increased costs of auto parts The IT allocation is increasing due to replacements of body cameras and upgrades to squad cameras and public safety applications The facilities allocation is increasing due to budgeted capital expenditure needs at City Center, including building restoration and cooling tower maintenance.
Capital under $25,000 is not increasing for 2024 with a $5,000 or 6.2% increase in 2025 Typical items purchased include tasers, radar equipment and ballistic plates.
The Fire Department mission is to minimize risk, increase safety and improve the quality of life through education, code compliance and emergency response The department focuses on a continual cycle of planning, mitigation, response and recovery activities to ensure a high level of readiness for events impacting the community.
Established in 1967, the department operates four fire stations with a staff of 11 FTE fire employees and 9 FTE building inspections employees, 99 paid on-call firefighters and several Community Emergency Response Team volunteers. The department divisions include Building Inspections, Emergency Management/Prevention, Fire Suppression/Operations, Training/Health/Safety and Public Safety Communications.
Building Inspections is primarily responsible for code compliance This division ensures buildings are constructed safely in accordance with state and local building fire codes Activities include plan review, on-site inspections, occupancy approvals, permit issuance and fee collection.
Emergency Management/Prevention includes the coordination of the overall mitigation, preparedness, response and recovery for the City This includes management and support of the emergency operations plan, emergency operation center (EOC) and various training and exercises
Fire Suppression/Operations includes fire and life-safety business inspections, rental housing licensing and inspections, hazmat facility permitting and inspections, fire investigations, public education activities, responding to emergencies including medical emergencies, structure fires, hazardous material incidents, rope/trench/confined space rescue, vehicle extrication, structural collapse, ice/water and search/rescue incidents.
Public Safety Communications manages the overall strategy for Citywide radio infrastructure, subscriber units, and security cameras for facility security.
The Eden Prairie Fire Department offers a range of community outreach programs and public services each year Programs include Night to Unite, public safety open houses, station tours, pop-up splash pad events, business safety training and community training These programs give the public a chance to learn more about the department and its firefighters.
Building

Personnel Services are increasing $334,846 or 7.4% for 2024 due to increased duty crew wages to remain competitive with peer cities as well as increased workers’ compensation insurance premiums An increase of $197,903 or 4.1% is expected for 2025.
Supplies are decreasing $16,770 or 5.8% for 2024 to better reflect actual spending needs. An increase of 0.3% is included for 2025. The large supply purchase in 2022 was for new firefighter turnout gear.
Contractual Services are increasing $3,706 or 0.7% for 2024. An increase of $6,926 or 1.3% is projected for 2025.
User Charges are increasing $144,462 or 9.5% for 2024 and $57,929 or 3.5% for 2025. Much of the increase relates to the facilities user charge due to budgeted capital maintenance and repairs at the fire stations, including a new roof at Fire Station 2 and new HVAC equipment at Fire Station 1
for 2024 or 2025
Maintain high resident ratings of excellent or good on quality of emergency response time
Continue work to identify residents and seniors in need of community support
Maintain high resident ratings of excellent or good on quality of Fire Department services
Enhance the volunteer Community Emergency Response Team to integrate with the City’s diversity, equity and inclusion plan
Maintain the property value saved from fire index with continued quick response times, improved fire education efforts and increased fire suppression systems
Continue community partnerships to provide fire extinguisher training, hands-only CPR, first aid, home safety and home alone programs
The Public Works Department constructs and maintains the City’s public infrastructure It is comprised of Engineering, Sustainability, Fleet Services, Streets Maintenance and Utilities Fleet Services expenses are discussed in the Internal Service Fund section of this document and Utilities expenses are included in the Enterprise Fund section All other operations are addressed within the General Fund.

Engineering oversees the construction of major public infrastructure projects, private development road and utility installations, and is responsible for protecting many of the City’s natural resources.
The City’s Sustainable Eden Prairie initiative focuses on education and implementation of sustainable practices in energy, landscape, waste and water to protect the environment.
Streets maintains the City’s roadway network of over 230 miles including right of way maintenance, and repair of street signs and traffic control systems, as well as street lighting maintenance Activities include asphalt overlay, seal coats, street sweeping, snow/ice control and roadside mowing


Personnel Services are increasing $65,744 or 2.2% for 2024 and $143,547 or 4.6% for 2025. Increases are the result of expected wage adjustments.
Supplies are decreasing $130,250 or 24.6% for 2024 due to street maintenance asphalt costs covered by the pavement management capital project fund Supplies are projected to remain flat for 2025
Contractual Services are decreasing $187,660 or 9.7% for 2024 due to street maintenance costs of crack filling and seal coating covered by the pavement management capital project fund This category is projected to increase $21,761 or 1.3% for 2025.
User Charges are increasing $56,685 or 3.8% for 2024 and $52,571 or 3.4% for 2025 because of the fleet and facilities charges. The Fleet Services share of parts, labor and fuel, and the Facilities share of capital expenditures have increased the Streets Maintenance Division
Capital under $25,000 is decreasing $14,000 or 32.6% for 2024. For 2025, these expenditures are increasing $7,000 or 24.1%. Equipment and parts under $25,000 individually are included in this category.
Goals, Objectives and Measures
Goal – Community Well-Being and Safety
Objectives
Provide and maintain a safe transportation system by keeping roadways clear of snow/ice, performing annual bridge inspections, and completing roadway improvements in the CIP
Inspect, repair and maintain critical storm drainage infrastructure
Goal – High-Quality Efficient Services
Objectives
Provide a high-quality, efficient transportation system by implementing new roadway rehabilitation treatments and maintaining a pavement condition index rating of 70 or higher (very good or better)
Maintain resident ratings of excellent or good on overall quality of City streets
Improve resident ratings of excellent or good on quality of snow removal
Goal – Innovative and Sustainable Practices
Objectives
Continue residential energy conservation program promotion (programs include Saver’s switch, smart thermostat, home energy audits, efficient home construction)
Provide means for residents to reduce, reuse and recycle solid waste streams by promoting curbside organics collection, managing the City Yard Waste Site, and planning and hosting annual Drop-Off Day and recycling events
Streets
Engineering Streets

Internal Service Fund expenses are charged to City departments on a cost-reimbursement basis. This provides a predictable expense stream for those departments and avoids monthly expense fluctuations
Employee Benefits, Facilities, Information Technology and Property Insurance are Administration Department functions Fleet Services is part of the Public Works Department
Employee Benefits includes medical, dental, disability, payroll taxes, public employee retirement (PERA), severance pay and workers’ compensation insurance The City pays PERA benefits for all eligible employees
Facilities is responsible for building-related operations, remodeling, and preventive and long-term maintenance of City-owned facilities These buildings include the City Center, Community Center, Senior Center, Art Center, Outdoor Center, Water Treatment Plant, Maintenance Facility, four fire stations, three liquor stores, 12 park shelters and five historical buildings.
Information Technology provides strategic technology direction and manages IT governance processes Network wellness, application development, computer and phone systems, and technology analysis is coordinated and managed by the division
Property Insurance includes the cost to insure City-owned buildings and property including fleet vehicles, as well as property and casualty claims
Fleet Services provides and maintains a safe, reliable and efficient fleet of nearly 300 vehicles and equipment. Included in the fleet are police and fire vehicles, snowplows and dump trucks.


Personnel Services are increasing $637,855 or 6.3% for 2024 and $589,398 or 5.5% for 2025. More than 65% of the increase is related to employee health insurance premiums
Supplies are increasing $37,954 or 2.5% for 2024 and $27,457 or 1.7% for 2025.
Contractual Services are increasing 13.5% or $1,086,660 for 2024 and 3.2% or $291,549 for 2025. Workers’ compensation insurance premiums are budgeted to increase $848,703 or 98% for 2024 and $169,429 or 9% for 2025. The City’s experience modification rating increased to 1.0 in 2023 resulting in increased premiums When the rating is lower, our costs are less due to positive claims experience resulting in lower premiums. Our rating has ranged from .55 to 1.06 since 2014.
User Charges include property insurance premiums for the City Center building These costs are reimbursed by tenants who may lease space at City Center.
Capital under $25,000 is expected to increase to $45,460 or 13.1% for 2024 and increase 1.5% for 2025. The increase in 2024 is to bring the budget in line with actual costs of computer replacements for staff.
Deprecation is projected to decrease for 2024 as IT equipment reaches the end of its useful life Increases in 2025 are due to anticipated fleet vehicle purchases.
Goal – Community Well Being and Safety
Objectives
Improve safety of online transactions by ensuring staff use Payment Card Industry (PCI) standard applications, hardware and processes, update PCI policies and require annual training for all credit card users
Provide and maintain a safe vehicle fleet by performing annual Department of Transportation safety inspections and ensuring operators are trained in daily safety inspection procedures
Goal – High-Quality Efficient Services
Ensure City facilities are attractive and safe by performing annual building envelope restoration, roof inspections and electrical surveys
Maintain high resident ratings of excellent or good on overall appearance of Eden Prairie
Upgrade technology to improve functionality, storage and security by updating the Microsoft Enterprise Agreement, replacing workstations on a 5-year cycle and replacing network core

Utilities operates and maintains the water, wastewater and stormwater systems
Water is drawn from the Prairie Du Chien and Jordan aquifers through 15 raw water wells located in the City Raw water is pumped to the Water Treatment Plant for purification Water is distributed to customers through a vast network of water mains, valves and storage reservoirs The Utilities Division is responsible for water sampling and inspections, water wells, water storage, water meter installation, meter reading and repair, and water distribution system maintenance.
The Utilities Division is responsible for the safe collection and removal of sanitary waste Wastewater is collected through a system of mains and lift stations connected to the Metropolitan Council Environmental Services wastewater interceptors. Raw sewage is transported to the Blue Lake Wastewater Treatment Facility in Shakopee where it is treated and discharged into the Minnesota River Wastewater operators perform regular maintenance to prevent sewer backups including jetting mains to remove buildup and debris, lift station pump maintenance and collection system maintenance.
The Utilities Division manages projects to control flooding caused by stormwater runoff, and protects and improves the water quality of wetlands, creeks and lakes Eden Prairie is home to diverse water resources, including 17 lakes, 513 wetlands, 177 stormwater ponds and three creek systems The stormwater system is comprised of channels, ponds, lakes, streams, pipes, curb, gutter and catch basins.


Personnel Services are increasing $280,810 or 5.4% for 2024 and $246,404 or 4.5% for 2025. These increases are due to wage adjustments as well as employee benefit increases.
Supplies are increasing $103,232 or 8.1% for 2024 and increasing $35,837 or 2.6% for 2025. The increase is to better align the budget to actual expenses Inflation projections are included in repair and maintenance supplies
Contractual Services are increasing $761,849 or 9.1% for 2024 and decreasing $210,465 or 2.3% for 2025. Additional funding is included in 2024 for leak detection surveys, increased system maintenance and inflationary increases for lime removal
User Charges are increasing $71,381 or 7.3% for 2024 and $37,594 or 3.6% for 2025. Increased property insurance premiums at the Water Treatment Plant are noted in 2024 Capital under $25,000 is increasing $3,095,690 for 2024 to better align with actual capital maintenance and repair expenses These are routine annual maintenance expenses that are not capitalized and depreciated.
Provide and deliver a safe supply of water to customers by ensuring security of Water Treatment Plant, wells and storage sites, and ensuring processes meet state and federal water quality standards
Protect public health by providing safe collection and removal of wastewater, perform system maintenance and reduce sources of inflow and infiltration
Maintain a water loss percentage below 10% as recommended by the American Water Works Association through a strong water metering management program, reduction of unmetered water use and system leak detection
The City operates three municipal liquor stores located at Prairie Village Mall, Den Road and Prairie View Mall Eden Prairie has the fourth largest municipal off-sale operation in the State The Finance Division oversees Eden Prairie Liquor operations.
Municipal liquor stores have been in operation since the United States government repealed prohibition in 1933, giving individual states the responsibility and authority to regulate liquor sales. At that time, the Minnesota legislature gave cities the option of issuing liquor licenses to private businesses or providing municipal alcohol dispensing services.
Eden Prairie, along with more than 300 other cities, chose to operate municipal liquor stores. This choice not only allows for greater control over liquor being sold and consumed in the City, but also further diversifies City revenue sources.

Historically, the City's three Eden Prairie Liquor locations have generated between $700,000 and $1-million in profit annually. Profits from liquor operations are transferred to the City’s Capital Improvement Plan (CIP) fund. Some examples of CIP projects include improvements to playground equipment and parking lots at several City parks as well as trail maintenance throughout the community.
This budget cycle, the City is expecting a profit of $865,271 and $878,865 from liquor operations for 2024 and 2025.


Cost of Sales is increasing 0.2% for 2024 with a 3.1% or $281,674 increase projected for 2025.
Personnel Services are increasing 4.7% or $67,562 for 2024 and 4.8% or $72,127 for 2025. The increase includes adjustments to base salary as well as increases in employee health premiums and workers’ compensation
Supplies are decreasing for 2024 and increasing modestly in 2025 Contractual Services are decreasing $24,729 or 3.1% for 2024 and increasing $19,600 or 2.6% for 2024. The decrease in 2024 is due to a reduction in the advertising budget.
User Charges are increasing $13,197 or 7.6% for 2024 and $6,219 or 3.3% for 2025 due to inflationary increases in the information technology and facilities user charges.


For most of its existence, Eden Prairie was a sleepy, pastoral village on the far southwestern fringes of the Twin Cities area Between 1880 and 1960, Eden Prairie’s population barely changed During those 80 years, the population increase was only 1,300 people from 739 in 1880 to 2,000 in 1960 By 2000, the population swelled to almost 60,000, a 3,000% increase It changed from a predominantly agricultural rural area to a thriving, business-rich community that is a highly desirable place to live and work.
The City owes its name to Elizabeth Fries Ellet, an East Coast writer who visited the area and proclaimed it to be the garden spot of the territory. Native Americans were the first to live in the area. In 1851, a treaty opened land west of the Mississippi River to settlement, allowing pioneers to settle in what is now Eden Prairie.
The town board of Eden Prairie held its first meeting in a log schoolhouse May 11, 1858, the same day Minnesota became a state In 1929, the first graduating class left the Eden Prairie Consolidated School Today that building serves as the main office for Eden Prairie School District 272.
Eden Prairie’s farming community grew slowly over the years Flying Cloud Airport was the first sign of big development in 1946 The 1960s and 1970s were decades of growth for the City’s parks and recreation system In the mid-1970s, the community earned a higher profile with the addition of Interstate 494 and the Eden Prairie Center mall Today, Eden Prairie is home to more than 2,300 businesses, nearly 25,000 households and over 63,000 residents It is 36 square miles and 22,594 acres The Minnesota River forms the southern border, and the City is home to 17 lakes, 3 creeks, 100 miles of multiuse trails, 1,000 park acres and 1,400 acres of preserved open space.
Top-10


Source:
Top-10
MTS Systems
Element Fleet Management
Tennant Co
Emerson Process Management
Starkey Labs
United Natural Foods Inc
CH Robinson
EP Schools
Eden Prairie Mall
Source: Met Council, Minnesota Local Area Unemployment Statistics File and Minnesota Department of Employment and Economic Development


Accrual Basis of Accounting The method of accounting under which revenues are recorded when they are earned (whether or not cash is received at that time), and expenditures are recorded when goods and services are received (whether cash disbursements are made at that time or not).
ACFR Annual Comprehensive Financial Report
ADA — The Americans with Disabilities Act is a federal civil rights law prohibiting discrimination against people with disabilities.
Adopted Budget The financial plan of revenues and expenditures for a fiscal year as adopted by the City Council.
Appropriation An authorization made by the legislative body of a government which permits officials to incur obligations against and to make expenditures of governmental resources. Appropriations are usually made for fixed amounts and are typically granted for a one-year period.
Assessed Valuation A value established by the City Property Appraiser for all real or personal property for use as a basis for levying property taxes.
Assets Property owned by a government with monetary value.
Balanced Budget — In the General Fund when expenditures are exactly offset by an equal amount of revenue
Bond A written promise to pay (debt) a specified sum of money (called principal or face value) at a specified future date (called the maturity date(s) along with periodic interest paid at a specified percentage of the principal (interest rate). Bonds are typically used for long-term debt.
Budget The financial plan for the operation of a program or organization which includes an estimate of proposed expenditures for a given period and the proposed means of financing those expenditures.
Budget Calendar The schedule of key dates involved in the process of adopting and executing an adopted budget.
Budget Document The official written document prepared by the Finance Division which describes the adopted financial plan.
Budget Message A general discussion of the budget presented in writing as a part of the budget document The budget message explains principal budget issues against the background of financial experience in recent years.
Capital Assets Assets of significant value and having a useful life of several years Capital assets are also called fixed assets.
Capital Budget A plan of proposed capital expenditures and the means of financing them The capital budget is usually enacted as part of the complete annual budget which includes both operating and capital outlays.
Capital Improvement Plan (CIP) A plan for capital expenditures to be incurred each year over a fixed period of several future years setting forth each capital project, identifying the expected beginning and ending date for each project, the amount to be expended in each year and the method of financing those expenditures.
Capital Outlay Expenditures for the acquisition of capital assets.
Capital Project Fund — Capital projects funds are used to account for all financial resources that are restricted, committed or assigned to expenditures for capital outlay, other than those financed by proprietary funds.
CDBG — Community Development Block Grant
CIP — Capital improvement Plan
City Council The elected body of members making up the legislative arm of local government in Eden Prairie.
Contingency A budgetary reserve set aside for emergencies or unforeseen expenditures not otherwise budgeted for.
CSAH — County state aid highway
Debt Service Payment of interest and repayment of principal to holders of a government’s debt instruments.
Debt Service Fund Debt service funds are used to account for all financial resources that are restricted, committed or assigned to expenditures for principal and interest.
Deficit (1) The excess of an entity's liabilities over its assets (See Fund Balance); (2) the excess of expenditures or expenses over revenues during a single accounting period.
Depreciation (1) Expiration in the service life of capital assets attributable to wear and tear, deterioration, action of the physical elements, inadequacy or obsolescence; (2) that portion of the cost of a capital asset which is charged as an expense during a particular period.
Enterprise Funds — funds maintained on the accrual basis Revenues are recognized in the accounting period in which they are earned, and expenses are recognized in the period in which the liability is incurred.
ERP — Enterprise resource planning is a software system that helps run an entire business, including finance, human resources, supply chain, procurement and more.
Estimated Market Value Represents the selling price of a property if it were on the market Estimated market value is converted to tax capacity before property taxes are levied
Expenditures Where accounts are kept on the accrual or modified accrual basis of accounting, the cost of goods received or services rendered whether cash payments have been made or not.
FCD — Flying Cloud Drive
Fiscal Disparities — The program created by the Metropolitan Fiscal Disparities Act which shares growth in the commercial-industrial tax base in the seven-county metropolitan area Forty percent of the value of new commercialindustrial development since 1971 is pooled and redistributed among approximately 300 taxing districts to address uneven business development throughout the region.
Fiscal Year A 12-month period to which an annual operating budget applies The Eden Prairie fiscal year is from Jan. 1 to Dec 31
Franchise Fee The right or license granted to an individual or group to market a company’s goods or services in a particular territory.
FTE (Full-Time Equivalent) Represents one employee working full time.
Fund An independent fiscal and accounting entity with a self-balancing set of accounts recording cash and/or other resources together with all related liabilities, obligations, reserves and equities which are segregated for the purpose of carrying on specific activities or attaining certain objectives.
Fund Balance The excess of a fund’s assets over its liabilities A negative fund balance is sometimes called a deficit.
GASB (Governmental Accounting Standards Board) It is the highest source of accounting and financial reporting guidance for state and local governments.
General Fund The General Fund is the City’s primary operating fund. It accounts for the proceeds of specific revenue sources that are restricted or committed to expenditures for specified purposes other than debt service and capital projects. It carries the basis activities of the City including Administration, Community Development, Parks and Recreation, Police, Fire and Public Works
General Obligation Bonds When a government pledges its full faith and credit to the repayment of the bonds it issues, then those bonds are general obligation (GO) bonds. Sometimes the term is also used to refer to bonds which are to be repaid from taxes and other general revenues.
GFOA (Government Financial Officers Association) The professional association of state and local finance officers in the United States who are dedicated to the sound management of governmental financial resources The association sets standards to the GFOA’s Certificate of Achievement for Excellence in Financial Reporting.
Governmental Funds — Funds maintained on a modified accrual basis with revenues recognized in the accounting period in which they become available and measurable Expenditures are recognized in the accounting period in which the fund liability is incurred.
HVAC — Heating, ventilation and air conditioning
ICOR — A company manufacturing robots.
Internal Service Fund — Internal Service Funds are used to account for the financing of goods or services provided by one department or agency to other departments or agencies of the government on a cost-reimbursement basis
Levy To impose taxes, special assessments or service charges, or the amount of those taxes, special assessments or charges.
L OGIS — Local Government Information Systems Association is a consortium of 44 Minnesota local government units that supports its members’ technology needs.
LRT Light Rail Transit
Measures A quantitative or qualitative tool to analyze progress, reprioritize goals and ensure success.
Modified Accrual Basis The basis of accounting under which expenditures other than accrued interest on general long-term debt are recorded at the time liabilities are incurred, and revenues are recorded when received in cash except for material and/or available revenues, which should be accrued to reflect properly the taxes levied and revenue earned.
Net Assets — The difference between program revenues and expenses.
Objectives — A statement outlining division priorities that supports how the division will achieve the Citywide goal.
Operating Budget Financial plan for the fiscal year which authorizes proposed expenditures and the revenues to finance them
Pavement Management Program This is a street overlay and construction program that provides for the systematic maintenance and replacement of the streets.
PCD — Prairie Center Drive
PERA — Minnesota Public Employee Retirement Association
Personnel Services The costs related to employee services including wages and benefits.
Proposed Budget Budget as submitted by the City Manager to the City Council
Revenue The term designates an increase to a fund's assets which does not increase a liability (e.g., proceeds from a loan), does not represent a repayment of an expenditure already made, does not represent a cancellation of certain liabilities and does not represent an increase in contributed capital.
SCADA — Supervisory control and data acquisition These systems are used for controlling, monitoring and analyzing industrial devices and processes Systems consist of hardware and software enabling remote gathering of data.
Special Assessment A compulsory levy made against certain properties to defray a portion of, or all costs of a specific improvement or service deemed to primarily benefit those properties.
Tax Rate Rates at which estimated market values are converted into the property tax base The classification rates are assigned to properties depending on their type (residential, commercial, farm, etc.) In some cases, there are two tiers of rates with the rate increasing as the estimated market value increases.
Tax Levy Property taxes certified to the County Auditor.
UAS — Unmanned aircraft system
WLA — Wasteload allocation
WTP — Water Treatment Plant