nnua


Page 2
CITY OF BELTON, TEXAS ANNUAL BUDGET
FISCAL YEAR 2024
OCTOBER 1, 2023 – SEPTEMBER 30, 2024
PROPOSED ON JULY 11, 2023
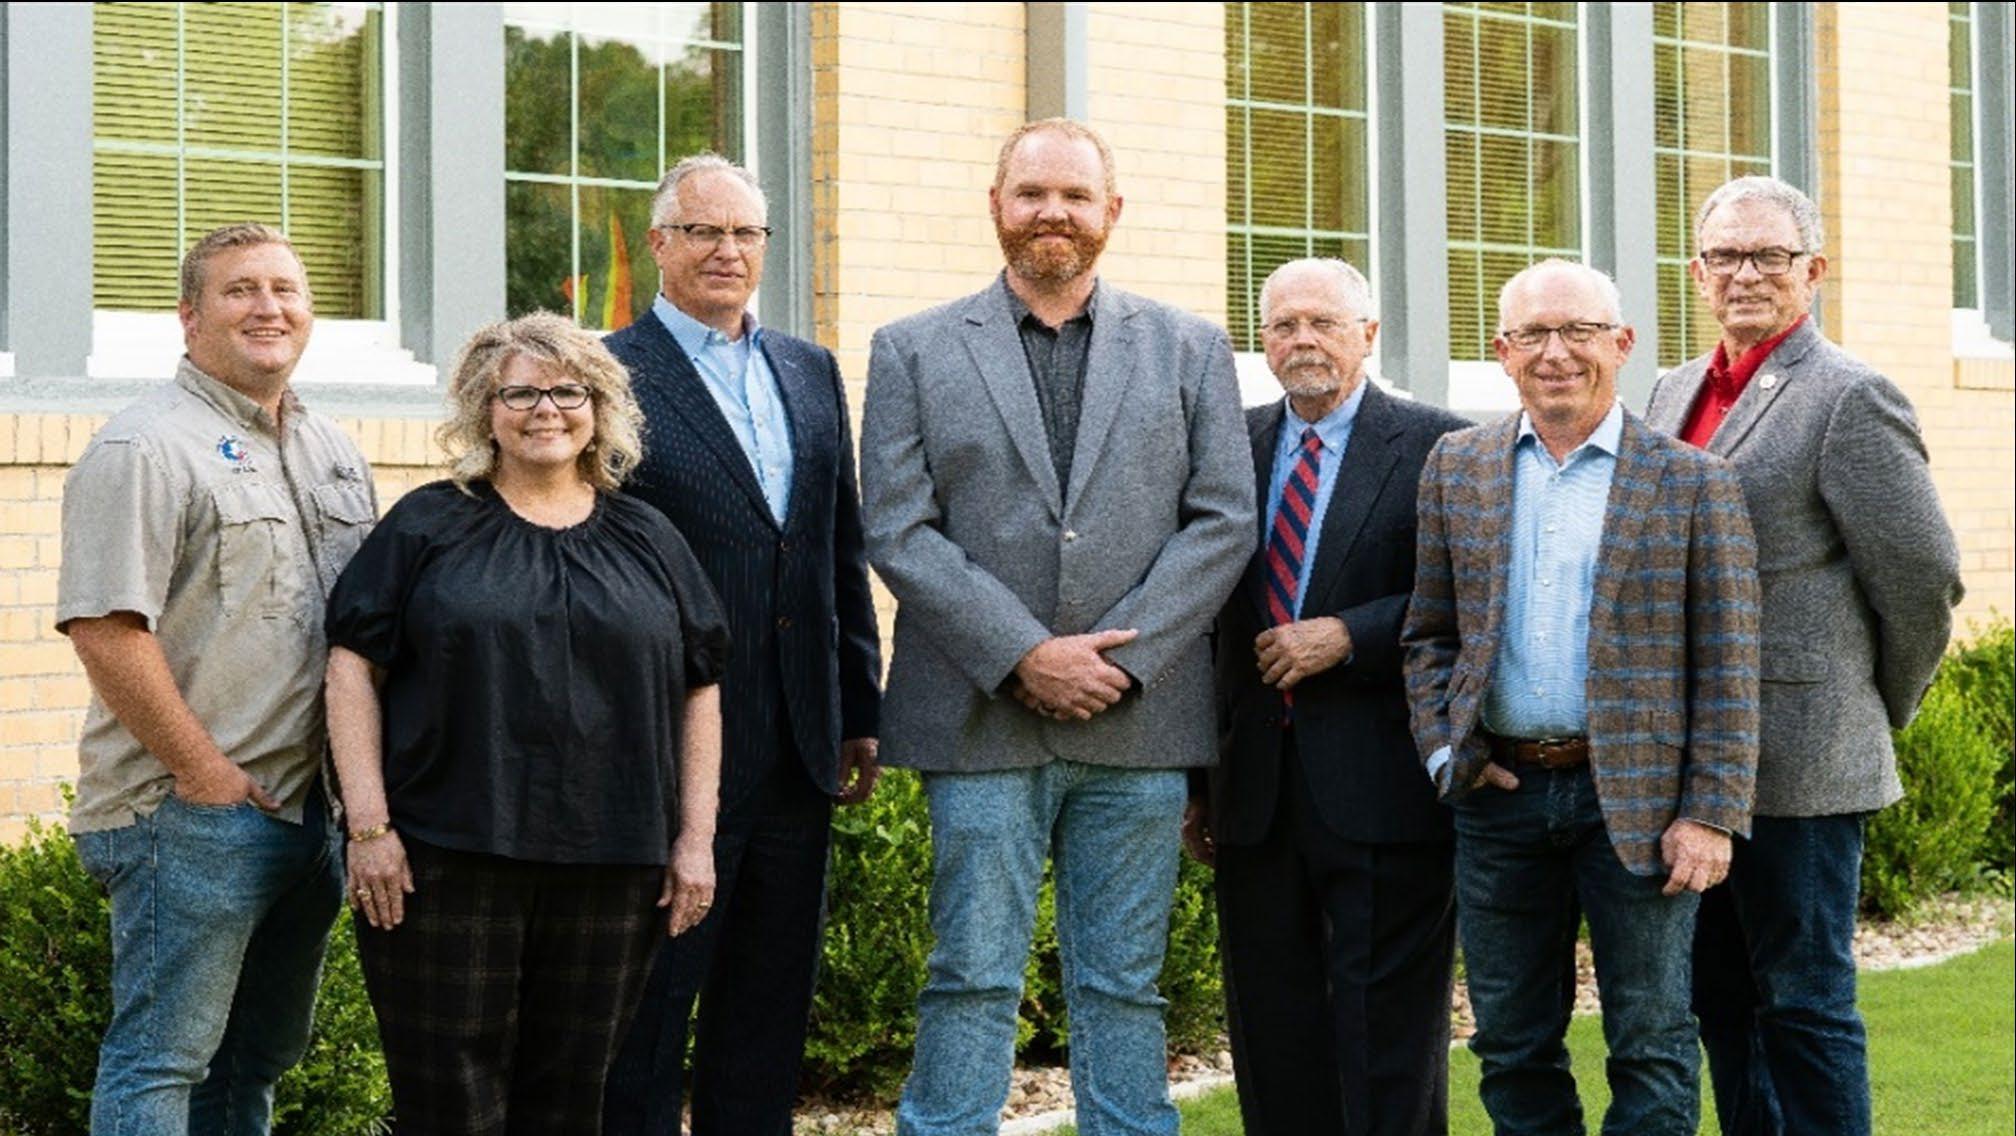
THE MAYOR AND CITY COUNCIL
David K. Leigh
John R. Holmes Sr.
Dave Covington
Craig Pearson
Mayor
Mayor Pro Tem
Councilmember
Councilmember
Daniel Bucher Councilmember
Wayne Carpenter Councilmember
Stephanie O’Banion Councilmember
Sam A. Listi City Manager
This budget will raise more total property taxes than last year’s budget by $910,330 or 8.49%, and of that amount $555,087 is tax revenue to be raised from new property added to the tax roll this year.
Page 3
CITY OF BELTON, TEXAS FY 2024 ANNUAL BUDGET

PREPARED BY
William Michael Rodgers, CPA
Director of Finance
Amanda Cox
Senior Accountant
Megan Odiorne, CGFO
Senior Accountant
Christina Sparks
Senior Accountant
CITY OFFICIALS
Sam A. Listi
John Messer
Amy Casey
Gene Ellis
Jonathon Fontenot
Michael Rodgers
Kim Kroll
Robert Van Til
Charlotte Walker
Chris Brown
Matt Bates
Cynthia Hernandez
Paul Romer
Judy Garrett
City Manager
City Attorney
City Clerk
Assistant City Manager/Police Chief
Fire Chief
Director of Finance
Director of Library
Director of Planning
Director of Human Resources
Director of Information Technology
Director of Public Works/Parks & Recreation
Executive Director of Economic Development
Director of Communications
Retail Development Coordinator Visit
us @ www.beltontexas.gov Page 4
The Government Finance Officers Association of the United States and Canada (GFOA) presented a Distinguished Budget Presentation Award to the City of Belton, Texas for its annual budget for the fiscal year beginning October 1, 2022. In order to receive this award, a governmental unit must publish a budget document that meets program criteria as a policy document, as a financial plan, as an operations guide and as a communications device.
This award is valid for a period of one year only. We believe our current budget continues to conform to program requirements, and we are submitting it to GFOA to determine its eligibility for another award.

Page 5
Table of Contents Introduction Annual Proposed Budget Cover Page …………………………………………………............... 0 3 City Officials ………………………………………………………………………………………… 0 4 Government Finance Officers Association Distinguished Budget Presentation Award .......... 0 5 Table of Contents …………………………………………………………………………………… 0 6 Introduction to the Budget Document …………………………………………………………… 0 10 Budget Message ………………………………………………………………………………………0 13 A Historical Perspective …………………………………………………………………………… 0 24 Elected and Appointed Officials …………………………………………………………………… 0 26 City Information ……………………………………………………………………………………… 0 32 Financial and Budget Policies ……………………………………………………………………… 0 34 Budget and Tax Calendar ………………………………………………………………………… 0 38 Budget Process ……………………………………………………………………………………… 0 40 Fund Structure ……………………………………………………………………………………… 0 42 Organization Chart ……………………………………………………………………………………0 44 Budgeted Personnel Summary …………………………………………………………………… 0 46 Budgeted Personnel History …………………………………………………………………………0 47 City-Wide Budget Summary …………………………..…………………………………………… 0 50 Consolidated Statement of Fund Balance …………………………………………………………0 52 Capital Expenditures ……………………………………………………………………………… 0 54 City-Wide Budget Summary History …………………………..……………………………………0 55 Comparative Schedule of City-Wide Resources and Expenditures ………………………….. 0 56 0 0 General Fund Overview 0 0 General Fund Cover Page / Organizational Structure ………………………………………… 0 57 Statement of Fund Balance ……………………………………………………………………… 0 58 Recap ………………………………………………………………………………………………… 0 59 Revenue Trend ……………………………………………………………………………………… 0 60 Distribution of Revenues …………………………………………………………………………… 0 61 Major Revenue Sources ……………………………………………………………………………… 0 62 Revenue Detail ……………………………………………………………………………………… 0 68 Expenditures by Department …………………………………………………………………………0 70 Department and Division Expenditure Summary ……………………………………………… 0 71 Expenditure Category Summary ……………………………………………………………………0 73 Line Item Expense Detail ………………………………………………………………………… 0 74 General Fund Long-Term Forecast …………………………………………………………………0 78 Page 6
Table of Contents 0 General Fund Expenditure Detail 0 General Fund 0 City Council ………………………………………………………………………………… 0 82 City Manager's Office ………………………………………………………………………… 0 84 Public Information …………………………………………………………………………… 0 86 Retail Development …………………………………………………………………………… 0 88 Finance ……………………………………………………………………………………… 0 90 Human Resources …………………………………………………………………………… 0 92 Municipal Court ……………………………………………………………………………… 0 94 Police - Administration ………………………………………………………………………… 0 96 Police - Patrol ………………………………………………………………………………… 0 98 Police - Special Operations …………………………………………………………………… 0 100 Police - Code Compliance ………………………………………………………………… 0 102 Fire - Suppression …………………………………………………………………………… 0 104 Streets ………………………………………………………………………………………… 0 106 Parks & Recreation - Facilities ……………………………………………………………… 0 108 Parks & Recreation - Community Center ………………………………………………… 0 110 Parks & Recreation - Recreation …………………………………………………………… 0 112 Planning ……………………………………………………………………………………… 0 114 Inspections …………………………………………………………………………………… 0 116 Library ………………………………………………………………………………………… 0 118 Other Costs …………………………………………………………………………………… 0 120 Solid Waste …………………………………………………………………………………… 0 122 Fleet Maintenance …………………………………………………………………………… 0 124 Engineering …………………………………………………………………………………… 0 126 0 0 Debt Service Fund 0 0 Debt Service Fund Debt Service Fund Cover Page ……………………………………………………………… 0 129 Overview ……………………………………………………………………………………… 0 130 Statement of Fund Balance …………………………………………………………………… 0 131 Revenue Detail ……………………………………………………………………………… 0 132 Expenditures …………………………………………………………………………………… 0 133 Amortization Summary (All Obligations) ………………………………………………… 0 134 Amortization Schedules ……………………………………………………………………… 0 135 0 0 Special Revenue Funds 0 0 Hotel/Motel Tax Fund 0 Hotel Motel Tax Fund Cover Page …..................………………………………………… 0 141 Statement of Fund Balance ………………………………………………………………… 0 142 Revenue Detail ……………………………………………………………………………… 0 143 Expenditures ………………………………………………………………………………… 0 144 Page 7
Table of Contents 0 TIRZ Fund 0 TIRZ Fund Cover Page ……………………………………………………........................ 0 145 Statement of Fund Balance ………………………………………………………………… 0 146 Revenue Trend ……………………………………………………………………………… 0 147 Revenue Detail ……………………………………………………………………………… 0 148 Expenditure Category Summary …………………………………………………………… 0 149 Expenditures …………………………………………………………………………………… 0 150 0 Enterprise Funds 0 0 Water & Sewer Fund 0 Water and Sewer Fund Cover Page ………………………………………………………… 0 151 Overview ……………………………………………………………………………………… 0 152 Statement of Fund Balance …………………………………………………………………… 0 153 Recap ………………………………………………………………………………………… 0 154 Revenue Trend ……………………………………………………………………………… 0 155 Distribution of Revenues …………………………………………………………………… 0 156 Revenue Detail ……………………………………………………………………………… 0 157 Division Summary …………………………………………………………………………… 0 158 Expense Category Summary ……………………………………………………………… 0 159 Line Item Detail ……………………………………………………………………………… 0 160 Utility Administration ………………………………………………………………………… 0 162 Utility Finance ………………………………………………………………………………… 0 164 Water ………………………………………………………………………………………… 0 166 Sewer - Collection …………………………………………………………………………… 0 170 Sewer - Lift Stations ………………………………………………………………………… 0 172 Other Costs …………………………………………………………………………………… 0 174 Amortization Summary (All Obligations) ………………………………………………… 0 176 Amortization Schedules …………………………………………………………………… 0 177 Long-Term Forecast ………………………………………………………………………… 0 182 0 Drainage Fund 0 Drainage Fund Cover Page ………………………………………………………………… 0 185 Statement of Fund Balance ………………………………………………………………… 0 186 Revenue Trend ………………………………………………………………………………… 0 187 Revenue Detail ……………………………………………………………………………… 0 188 Expense Category Summary ……………………………………………………………… 0 189 Expenses …………………………………………………………………………………… 0 190 Amortization Summary (All Obligations) ………………………………………………… 0 192 Amortization Schedules …………………………………………………………………… 0 193 Long-Term Forecast ………………………………………………………………………… 0 194 0 Internal Service Funds 0 0 Information Technology Fund 0 Information Technology Fund Cover Page …............................................................. 0 197 Overview / Statement of Fund Balance …..................................................................... 0 198 Revenue Detail ….......................................................................................................... 0 199 Expense Category Summary …..................................................................................... 0 200 Expenses …................................................................................................................... 0 202 0 Page 8
Table of Contents Building Maintenance Fund 0 Building Maintenance Fund Cover Page ….................................................................. 0 205 Overview / Statement of Fund Balance …..................................................................... 0 206 Revenue Detail ….......................................................................................................... 0 207 Expense Category Summary ….................................................................................... 0 208 Expenses …................................................................................................................... 0 210 0 Capital Improvements Program (CIP) 0 0 Overview …............................................................................................................................. 0 213 Projects Summaries - General Government Projects …......................................................... 0 216 Projects Summaries - Utility Projects ….................................................................................. 0 217 Projects Detail - General Government Projects ….................................................................. 0 218 Projects Detail - Utility Projects …........................................................................................... 0 238 0 Belton Economic Development Corporation 0 0 Belton Economic Development Corporation 0 BEDC Fund Cover Page …........................................................................................... 0 259 Statement of Fund Balance …....................................................................................... 0 260 Revenue Trend ….......................................................................................................... 0 261 Revenue Detail ….......................................................................................................... 0 262 Expenditure Category Summary …............................................................................... 0 263 Expenditures …............................................................................................................. 0 264 0 0 Appendix 0 0 City and Area Demographics ….............................................................................................. 0 267 Budget Glossary …................................................................................................................. 0 276 Acronyms …............................................................................................................................ 0 283 Page 9
Introduction to the Budget Document
The City of Belton Annual Budget provides citizens, staff, and other readers with detailed information about the City’s operations. The Annual Budget serves as a
Policy Document to describe financial and operating policies, goals, and priorities for the organization;
Financial Plan to provide revenue and expenditure information by fund, department, division, category, and account;
Operations Guide to describe the goals and objectives for the fiscal year; the workload measures to track the activities performed; the performance measures to track progress on the goals and objectives; and the general workforce trends; and as a
Communications Device to provide information on planning processes, budgetary trends, and integration of the operating and capital budgets
Budget Overview and Summary Information
Introduction
This section includes the City Manager’s Budget Message which addresses major policies and key issues that impacted the development of the Annual Budget. This section also contains information about the City, the City of Belton Strategic Plan, a budget calendar, fund structure, organization chart, and employee count history.
Policies
This section includes the City’s financial management policies.
Budget Summaries
Several consolidated schedules of all City funds are presented to give an overall perspective of the upcoming budget as well as historical, estimated and projected fund balances.
Operating Budgets
General Fund Overview
This section describes and analyzes the General Fund using a combination of narrative, tables, and graphs to highlight key aspects of the budget including revenues, expenditures, and fund balance A brief description is given of the sources, trends and assumptions made for major revenues. Expenditure information is detailed by division, category and account
General Fund
This section provides strategic, operational, performance, and budgetary information for each of the City’s divisions within the General Fund. Each division’s operating budget includes a description of the division; goals and action items with their relationship to the overall City goals; workload and performance measures; significant changes for the upcoming budget year; and a personnel summary. Expenditure budgets for each division are detailed by account.
Debt Service Fund
This section outlines the City’s tax-supported debt. Amortization schedules for all outstanding debt are provided.
Page 10
Operating Budgets for Other Funds
The operating budgets for the other funds of the City are presented in a manner similar to the General Fund. The overview page includes a description of the fund along with a fund balance history. Revenue and expenditure/expense budgets are detailed by account. Additional summaries are presented for the Water & Sewer Fund
Capital Improvements Program
This section presents the City’s plan for development for Fiscal Years 2024 - 2028. Components of this section include:
An overview of the Capital Improvements Program;
A narrative summary of projects;
A five-year plan detailing expected project expenditures, potential sources of funding, and possible future impacts on operating budgets resulting from additional O & M expenditures;
A summary of unobligated fund balances in capital projects funds.
Belton Economic Development Corporation

The operating budget for the Belton Economic Development Corporation is presented in a similar fashion to the General Fund. The overview page includes a description of the fund followed by a fund balance history. Goals, action items, and significant changes to the budget along with workload measures and performance measures are highlighted in the mission statement. Revenue and expenditure budgets are detailed by account.
Appendix
This section contains supporting information, such as a chart of accounts, a glossary, a listing of acronyms, and Ordinances relating to the adoption of this budget and the property tax rate
Page 11
Heritage Park Baseball Complex, Photographed by Wes Albanese
Page 12
City of Belton
Founded 1850
July 11, 2023
TO THE HONORABLE MAYOR, CITY COUNCIL, AND CITIZENS OF BELTON:
We are pleased to present the FY 2024 Proposed Annual Budget for the fiscal year that begins on October 1, 2023. This document represents the City’s financial plan and operations guide for the next fiscal year. It identifies issues confronting the community and provides a plan for serving our constituents. A discussion about the City’s vision and long-term strategic plan is also included. It takes a combined effort by City Council, management, and staff to allocate and deploy the City’s resources to meet the established goals while also maintaining sound financial policies. We will work diligently to administer this budget in a manner that provides exceptional service to the residents of Belton.
The budget revolves around several core principles that have been established by the City Council. These philosophies provide guidance for the development of the annual budget.
Core Budget Principles
Strategic Plan Implementation
Balanced Budget
CORE PRINCIPLE: STRATEGIC PLAN IMPLEMENTATION
The Strategic Plan is the City’s primary planning document. It outlines the City’s vision and goals for the long term. There are seven goal categories: governance, public safety, quality of life, economic development, connectivity, parks/natural beauty, and service
Adequate Tax Rate Grant Funding Equipment Replacement Community Investment Street Maintenance Parks and Recreation Capital Projects Page 13
delivery. The Strategic Plan focuses on the City of Belton’s vision of being the “Community of Choice in Central Texas, Providing an Exceptional Quality of Life.”
Each year, the Plan is reviewed, revised, and updated as needs and conditions dictate. The revised plan forms the framework upon which the budget is built. Performance of Strategic Plan initiatives is measured regularly during the year. Additionally, each department measures success and progress by tying both accomplishments for the prior year and goals for the upcoming year to the various Strategic Plan goals and tasks.
CORE PRINCIPLE: BALANCED BUDGET
The FY 2024 budget enhances the City’s operating levels to meet the demands that are created by a growing population. Several employees have been added, particularly in the area of public safety. Investment in infrastructure remains a priority. A balanced approach of focusing on improving levels of service, while remaining fiscally conservative, served as the basis for this budget. The issues impacting achievement of this goal include:
Serving citizens’ needs
Developing a sustainable annual budget
Adopting an adequate ad valorem tax rate
Responsibly managing utility rates and fees to fund important capital projects
Assessing staff workload, personnel, and compensation
Recognizing available funding limitations
Seeking supplemental funding through grants.
In addition to strategic long-range planning, the task of performing the day-to-day operations of municipal government continues. These operations include, among other things, maintaining city streets, repairing water and sewer lines, delivering vital police and fire services, maintaining park spaces, and providing library services. These operational duties must be performed within the constraints of limited resources. The City has adopted financial and budget policies that reinforce the principle that we must live within our means.
The FY 2024 Proposed Annual Budget is noteworthy as both revenues and expenditures increase significantly. A strong demand for housing, along with limited supply, has driven property values higher. Consumer spending continues to push sales tax revenue upwards. Yields on investments have grown at a remarkable pace compared to previous years. These growing revenues in FY 2024 provide the resources to fund several Strategic Plan priorities such as enhanced staffing to meet essential needs, sustained street maintenance, infrastructure rehabilitation, and employee compensation.
After maintaining a steady property tax rate of $0.6598 per $100 of taxable value from 2013 to 2020, the tax rate was reduced to $0.6300 for both 2021 and 2022. The tax rate was again lowered to $0.5850 for 2023. With an acute awareness of the burden that
Page 14
property taxes place upon constituents, the proposed annual budget reflects a tax rate of $0.5326 for FY 2024.
The City also seeks grant opportunities whenever possible to fund major capital projects. Grant funding allows the scope of projects to extend beyond that which may be achievable by the city alone. Efficiencies are gained when the work and cost can be shared among agencies. Examples include Texas Parks & Wildlife grants for Heritage Park and Standpipe Park and the Federal Community Project Fund grant to replace and relocate the East Central Avenue/Spring Street bridge.
The City implemented a capital equipment replacement plan in 2015 to provide for the replacement of vehicles and equipment based upon mileage, age, or maintenance costs. Money is set aside each year to ensure sufficient funding exists when the assets need to be replaced in the future. After refining the replacement plan in 2022, a three-year plan has been put into place to increase available funding.
CORE PRINCIPLE: COMMUNITY INVESTMENT
A strong, thriving community requires continual investment in its people, facilities, and infrastructure to deliver an exceptional quality of life. As an important goal in the Strategic Plan, the City of Belton implemented a street maintenance plan with the desire to sustainably fund it at a level of $500,000 per year by 2021. The plan should elevate the quality of streets and create long-term savings through the systematic use of preventive maintenance. The cost of maintenance and other corrective actions each year are analyzed and included in the annual budget. Building on a goal achieved in FY 2023, street maintenance funding in FY 2024 continues at $1,000,000, far exceeding the level envisioned in the earlier Strategic Plan. Certainly, our increasing street inventory will encourage us to maintain that level of funding in the years to come.
The City of Belton also implemented a five-year Capital Improvements Program (CIP). By identifying potential capital projects today, funds can be accumulated over time to meet future demand. The CIP includes an analysis of the timing of expenditures and the various sources of funding that may be available. The impact upon future operating budgets is also considered.
To become a “quality of life” city, a municipality must provide ample opportunities for residents and visitors to retreat from the rigors of daily life by enjoying the outdoors. The City of Belton addressed this by creating a Parks and Recreation Strategic Master Plan. This visionary document guides the development of parks and recreation amenities within the city. Priorities over a ten-year period are recognized. Feasibility studies are prepared that predict usage of these facilities. The result of this master plan will be a parks system that is harmonious with its surroundings and enjoyed by all. Construction was recently completed on the first phase of amenities for Heritage Park, including the interior roadway, dog park, fish camp, multipurpose field, and a restroom. Even more amenities are planned in the future. Standpipe Park will be developed in FY 2024 as well.
Page 15
FY 2024 BUDGET OVERVIEW
The FY 2024 Proposed Annual Budget includes total resources of $47,985,770 and expenditures of $45,791,900, including transfers and planned use of fund balance. For perspective, the adopted budget for FY 2023 contained resources of $44,017,180 and expenditures of $41,768,550. This message discusses the major issues, initiatives, and assumptions addressed in the budget.
GENERAL FUND
The General Fund is the chief operating fund of the government. It is used to account for all current financial resources not required by law or administrative action to be reported in other designated funds. The primary governmental functions occurring within this fund are public safety, parks, library, streets, and general administrative operations.
GENERAL FUND RESERVE LEVEL
The City has followed a policy of maintaining a reserve level of at least 30% of budgeted expenditures - plus the annual debt service for fund-supported borrowing - for the General Fund, Water & Sewer Fund, and the Drainage Fund. The minimum fund balance is 25%. This policy ensures that funds will be available in the event of emergencies, financial recessions, and other unforeseen circumstances. Below is a chart of the General Fund’s unassigned spendable balances for the past two years, an estimated balance for the fiscal year ending September 30, 2023, and the projected balance for the fiscal year ending September 30, 2024. Belton expects to remain in compliance for FY 2024 with an accumulated reserve level of 35% of budgeted expenditures.
Resources FY 2024 Expenditures FY 2024 General Fund $23,156,300 General Fund $23,156,300 Debt Service Fund 1,251,020 Debt Service Fund 1,205,260 Hotel/Motel Tax Fund 444,310 Hotel/Motel Tax Fund 344,350 TIRZ Fund 3,193,920 TIRZ Fund 3,020,950 Water & Sewer Fund 14,027,320 Water & Sewer Fund 13,910,620 Drainage Fund 759,460 Drainage 759,460 Information Technology 1,050,130 Information Technology 954,190 Building Maintenance 547,900 Building Maintenance 449,460 BEDC Fund 3,555,410 BEDC Fund 1,991,310 Total $47,985,770 Total $45,791,900
Page 16
GENERAL FUND REVENUES
Total revenues excluding accumulated reserves for the General Fund in FY 2024 are $22,987,820, an increase of $1,700,400 or 7.9% from the adopted budget for the prior year. Revenues are derived from several sources. Foremost among these sources are property and sales taxes.
Property Tax
Thirty-seven percent of General Fund revenues are derived from property taxes. The Bell County Appraisal District reports that the taxable value of property located within the City of Belton has increased by eighteen percent to $2,183,716,392.
Current property tax revenue of $8,419,680 is budgeted. The tax rate that will generate the amount reflected in the annual budget is $0.5326 per $100 of taxable valuation, a decrease of 5.24 cents from the prior year.
The tax rate is comprised of two components - the debt service portion that is dedicated to the payment of principal, interest, and fees on general obligation debt, and the maintenance and operation (M&O) portion which is utilized in the General Fund for general governmental purposes. The proposed rates for debt service and M&O are $0.0663 and $0.4663, respectively.
Sales Tax
Another large revenue source in the General Fund is the sales tax. The FY 2024 Proposed Annual Budget anticipates sales tax revenue to grow by five percent to $6,440,000. The gain can be attributed to the ongoing expansion of the area economy as more consumers find Belton a great place to shop.
Other Revenues
Refuse collection and contract fees increase by $390,610 due to a rising customer count. Interest income grows by $375,500 as yields have reached five percent. Transfers from other funds decrease by $498,620 after the sharp decline in available funding from the American Rescue Plan Act.
0.0% 10.0% 20.0% 30.0% 40.0% 50.0% $4,000,000 $5,000,000 $6,000,000 $7,000,000 $8,000,000 $9,000,000 2021 Actual2022 Actual2023 Estimate2024 Budget Reserves as a % of Expenditures Accumulated Reserves Page 17
General Fund Revenues
GENERAL FUND EXPENDITURES
General Fund expenditures in the FY 2024 Proposed Annual Budget total $23,156,300, increasing $1,829,580 over the FY 2023 amended budget. Encompassing fifty-nine percent of the budget, charges within the personnel category rise by $1,392,900 to add eleven employees and to recognize employees based upon their annual performance review. At twenty-four percent of General Fund expenditures, the increase in appropriations for services is primarily due to higher costs for refuse collection, contract mowing, regional dispatch and legal services. The maintenance category includes $1,000,000 for contracted street maintenance.
Transfers from the General Fund occur when additional funding for capital projects is needed, or when the City Council wants to designate funds to be used for a special purpose over a series of years. Of the $1,563,680 being transferred from the General Fund in FY 2024, $1,185,060 relates to future vehicle and equipment replacement.
General Fund Expenditures


Property Tax 37% Sales Tax 28% Franchise & Other Taxes 6% Permits & Licenses 2% Court Fines & Fees 1% Charges for Service 16% Miscellaneous 2% Transfers 7% Use of Accumulated Reserves 1%
Personnel 59% Supplies 3% Maintenance 7% Services 23% Other Expenses 1% Transfers 7%
Page 18
DEBT SERVICE FUND
This fund is used to accumulate a dedicated portion of property taxes for payment of the City’s general debt. Revenue from property tax collections is expected to be $1,219,740. Expenditure appropriations for FY 2024 total $1,205,260. Payments on tax-supported debt comprise three percent of all appropriations included in the FY 2024 Annual Budget.
WATER & SEWER FUND
The Water and Sewer Fund accounts for all activities related to the provision of water and sewer services to the residents of Belton, including administration, operations, maintenance, debt service, billing, and collection. An enterprise fund of the city, it is designed to be financed and operated like a private business. Accordingly, utility fees should be sufficient to cover annual operating and capital costs while providing income for future capital needs.
Total resources of the Water and Sewer Fund are expected to increase by nineteen percent in FY 2024 to $14,027,320. Consumption volume grows as the number of customers served continues to climb. While water rates are unchanged in FY 2024, sewer rates must increase to provide sufficient revenue for operating and capital needs over the next five years, including significant costs for an expanded wastewater treatment facility.
The FY 2024 Annual Budget anticipates Water and Sewer Fund expenses to jump by $1,773,340 to $13,910,620. Personnel costs rise by $289,000 to add three employees. Water procurement costs increase by $273,720. Capital costs increase by $377,500 to purchase vehicles and an excavator. Transfers to capital project funds rise by $890,810 to advance vital infrastructure projects.
DRAINAGE FUND
The mission of this fund is to maintain a stormwater management system that efficiently conveys storm water in a safe manner and prevents flooding. The Drainage Fund is considered a utility of the City. Accumulated revenues are used to fund drainage-related expenditures and associated public education.
Revenue Type FY 2023 Budget FY 2024 Budget Expense Division FY 2023 Budget FY 2024 Budget Water $5,543,620 $6,146,600 Admin $1,592,890 $1,677,820 Sewer 5,255,500 6,675,610 Finance 2,705,650 2,806,060 Fees 560,900 533,710 Water 3,517,550 4,464,200 Other 417,490 671,400 Sewer 4,321,190 4,962,540 Total $11,777,510 $14,027,320 Total $12,137,280 $13,910,620
Page 19
The revenue for the Drainage Fund is generated by the City’s drainage fee. The adopted drainage fee remains unchanged at $5.00 per month for single family dwellings. Still, drainage fee revenues in FY 2024 increase by eleven percent to $647,530 with a growing customer count and interest yields reaching five percent. Budgeted expenses for FY 2024 total $759,460, including appropriations for detention pond maintenance, a fee study, public education efforts, and debt payments.
HOTEL/MOTEL TAX FUND
The Hotel/Motel Tax Fund records the receipt and distribution of the hotel occupancy tax, which is levied at seven percent of the room rental rates. The City of Belton also receives a small portion of Bell County’s hotel occupancy tax. Authorized by state statute and approved by City Council, expenditures promote tourism and the hotel industry. For FY 2024, hotel occupancy tax revenue is projected to grow by 19% over the FY 2023 estimate to $444,310 as numerous special events draw visitors and interest income climbs. Expenditures in FY 2024 total $344,350.
TIRZ FUND
The TIRZ Fund is used to account for the accumulation of resources from ad valorem taxes collected on the incremental tax values in the Belton Tax Increment Reinvestment Zone No. 1, which was created in 2004. These revenues may only be expended on projects within the TIRZ zone that have been approved by both the TIRZ Board and the City Council. The City of Belton and Bell County participate in the TIRZ. In 2022, the boundary of the Zone was expanded by 1,168 acres to a total of 4,384 acres. The TIRZ will expire in 2042.
TIRZ Fund revenue continues to grow rapidly as captured property values within the Zone swell. Total revenues that are reflected in the FY 2024 Proposed Annual Budget increase by twelve percent from $2,828,190 to $3,193,920. At $3,020,950, expenditures grow to fund future capital projects.
$0 $50,000,000 $100,000,000 $150,000,000 $200,000,000 $250,000,000 $300,000,000 $350,000,000 $400,000,000 201320142015201620172018201920202021202220232024
Page 20
Captured Values within Belton TIRZ No. 1
INFORMATION TECHNOLOGY FUND
The Information Technology Fund is an internal service fund used to account for all costs of providing general information technology services to City divisions. These activities are financed through charges to the divisions for services rendered. FY 2024 revenues total $1,050,130 while expenditures equal $954,190 to replace several computers.
BUILDING MAINTENANCE FUND
The Building Maintenance Fund is another internal service fund used to account for all costs of providing building maintenance throughout the organization. Charges to other divisions total $547,900. Expenditures in FY 2024 total $449,460.
ECONOMIC DEVELOPMENT FUND
The Economic Development Fund was created in 1991, pursuant to the ½ percent economic development sales tax approved by voters in 1990. This additional sales tax can only be used for economic development purposes. Acting through the Belton Economic Development Corporation, Inc., a governmental nonprofit corporation, the purpose of this fund is to promote, assist, and enhance economic development activities within the City of Belton.
Revenues in the FY 2024 Annual Budget increase by fourteen percent to $3,555,410. The Corporation’s primary source of income, sales tax revenue is expected to increase by five percent over FY 2023. Higher interest yields push miscellaneous income upwards by $247,450. FY 2024 expenditures of $1,991,310 include $1,354,200 to cover the updated cost estimate for the IH-14 wastewater project.
CONCLUSION
Conservative management has placed the City of Belton in a sound financial position. The General Fund and the Water & Sewer Fund have sufficient reserves. A growing property tax base provides resources to cover the increasing demand for services, and sales tax revenue continues to rise. The appropriation for street maintenance totals $1,000,000, exceeding a goal envisioned earlier in the Strategic Plan. There will also be significant investments in infrastructure projects and in our most important asset, our municipal employees.
The FY 2024 Proposed Annual Budget, while continuing prior year commitments to improve services and facilities, reflects a balanced approach to the multi-faceted needs of a growing community. This budget continues to build on the City’s successes, moving steadily forward, seeking to meet the dual goal of preserving community character, while prudently planning for future growth.
Page 21
The leadership of the City Council, as well as its time and attention during the development of the FY 2024 budget, is greatly appreciated. Gratitude is also extended to Department Heads and staff members for their work and dedication to serving the community.
 Sam A. Listi Michael Rodgers, CPA City Manager Director of Finance
Page 22
Page 23
A HISTORICAL PERSPECTIVE
Lena Armstrong, the City Librarian for 54 years and the unofficial historian of Belton, wrote the following synopsis of Belton’s history. She penned a longer version of Belton history, which is included in the two-volume edition of "The Story of Bell County" published in 1988 by the Bell County Historical Commission. Lena retired from the City in December of 1998, and subsequently passed away in January of 1999. She is fondly remembered and sorely missed.

In August 1850, the new pioneer town of Belton (first named Nolandville that was changed to Belton in 1851) was laid out in blocks, streets, and lots with the courthouse public square the center. It was designated County seat for the newly organized Bell County. Incorporated in 1852, it was the only town in the County and was the last place of civilization seen by the pioneers heading West by horseback or wagon train.
Within a month after lots were sold, a post office was established and mail was arriving by horseback. But in 1852, a stagecoach route beginning in Tennessee and ending in Brownsville was stopping weekly in Belton to deliver mail, new arrivals and freight. By now, the first courthouse was in use, a log cabin placed high on blocks as safeguard from devastating floods, provided all too frequently by Nolan Creek running very near the public square. In 1853, a two-story log jail was built followed by a school, hotel, church, saloons, stores and other businesses. Most were log buildings or pole shacks, but with a new surge of people, more permanent buildings were built. Stores were erected using native stone and were two-story with the business on the first floor, family quarters on the second. A number of these stores have survived and are still in use. The A.D. Potts building, built in the late 1860's, not only is still in use but is still owned by the Potts family.
Just prior to the Civil War, Sam Houston stumped the State, urging people to not vote for secession. He made two speeches in downtown Belton, but his talks were not well received. He was booed so loudly on one occasion, he took out his two pistols, laid them on the goods box he was using for a podium, and dared anyone to interrupt him. They did not.
In 1858, the County commissioners built a new courthouse, spending $14,000 for a twostory limestone building replacing the first courthouse which had become completely inadequate for the population the County now served. Bell Countians so opposed the new edifice, they voted out of office every commissioner, replacing them with more conservative men. It was 26 years before a third (and last) courthouse was approved and built.
Page 24
Over a thousand Bell County and Belton men joined the Confederate Army and Belton women did their part by meeting daily at the courthouse to sew clothing for the soldiers. There was only one sewing machine in Belton, and it saw constant use. As the War progressed, the effects of the War were felt strongly. Supplies and inventories, as well as currency dwindled and many stores were forced to close. War's end, and defeat, saw all elected officials from the Governor to Mayors replaced with Union appointees. Federal troops patrolled the streets of Belton giving little protection to the citizens and their property. Outlaws roamed the area stealing, assaulting and killing to such an extent that Belton men decided to do something. In the dark of the night, bands of horsemen arrived at the County jail (still standing) where ten prisoners were jailed. The horsemen dismounted, moved into the jail and shot nine men to death. It is said that for decades after, outlaws rode wide around Belton. Sam Bass, on his way to rob a bank, refused to enter Belton, saying "Those Belton men are too tough for me".
The 1870's saw a boom with building, new businesses and new enterprises. A Belton group organized the Belton Telegraph Company that was chartered and extended to Round Rock where it joined Western Union. The telegraph provided daily quotes of the cotton market, necessary for an area where cotton was King. The 1870's also saw the formation of the now famous Belton Woman's Commonwealth, a loosely organized group that in retrospect seems more a battered wives' refuge than a utopian commune.
Belton met its first setback in 1881 when the City fathers, after meeting the demands of Santa Fe railroad representatives and putting up $75,000, found themselves duped out of a railroad in Belton. They sued, but the company built their own town that they named Temple. After many years, the Supreme Court finally ended the case in favor of Belton. Meanwhile, they contracted with the M.K. & T. and by 1882, the Katy's depot was built a block from the courthouse. In the interim, Belton went "modern" with a water system and mains throughout town, an electric and telephone companies, a fire department, lumber yard, flour mill, plus newspapers, and banks. There was also a new college: Baylor Female College, now the University of Mary Hardin-Baylor. Two beautiful parks, still maintained by the City of Belton, were acquired during these decades: the Confederate Park*, donated to the City by citizens honoring the ex-Confederate Veterans; and the Yettie Tobler Polk Park, commemorating Mrs. Polk and her four children who drowned in a devastating flood that inundated Belton in 1913.
Belton got into severe financial difficulties before the Great Depression, but managed to work its way out by the 1970's. World War II and the arrival of Fort Hood* to the County brought economic relief and a surge of growth. Two large lakes built during this time provide tourist attractions and IH-35 makes Belton attractive to industries and businesses.
Lena Armstrong
Page 25
*Editor’s note: In 2020, the name of Confederate Park was changed to Liberty Park. In 2023, Fort Hood was changed to Fort Cavazos.


Name Place Term Expiration David K. Leigh, Mayor Place 4 May 2024 John Holmes Sr., Mayor Pro Tem Place 1 May 2026 Dave Covington Place 2 May 2026 Craig Pearson Place 3 May 2024 Daniel Bucher Place 5 May 2025 Wayne Carpenter Place 6 May 2025 Stephanie O'Banion Place 7 May 2025
Terms
Elected Officials City Council Three-Year
Fiscal Year 2023 2024 City Council
Page 26
Daniel Bucher, Stephanie O’Banion, John Holmes Sr (Mayor Pro Tem), Dave Covington, Wayne Carpenter, David Leigh (Mayor), and Craig Pearson.
APPOINTED OFFICIALS
Bell County Health District Board
Three-Year Terms
Name Term Expiration
Charla Peters
Dan Kirkley (Alternate)
October 10, 2025
March 24, 2026
Bell County Tax Appraisal District
Two-Year Terms
Name Term Expiration
Joe Shepperd
December 31, 2023
Belton Economic Development Corporation
Three-Year Terms
Created by Resolution No. 030591-1
Name Term Expiration
Brandon Bozon, President
Marion Grayson
John R. Holmes, Sr.
Griff Lord
Stevie Spradley
November 30, 2025
November 30, 2025
November 30, 2024
November 30, 2023
November 30, 2023
Central Texas Housing Consotium Board
Two-Year Terms
Name Term Expiration
Marvin Bell
Linda Angel
Electrical Board
Two-Year Terms
Created by Ordinance No. 72881-2
January 24, 2024
January 25, 2025
Name Term Expiration
Robert Bass
Casey Simpson (Oncor Representative)
Jamie Sanderford
Bill Barge
Jeff Booker, Fire Marshal
October 23, 2023
October 23, 2023
October 23, 2024
October 23, 2024
Virtue of position
Page 27
Ethics Commission
One-Year Terms
Created by Ordinance No. 2005-47
Name Term Expiration
Dr. Jude Austin II
Bert Peeples
Mark Fitzwater
Brooke Morrow
Nicholas Rabroker
Mike Ratliff
Cathy Fox
May 22, 2024
May 22, 2024
May 22, 2024
May 22, 2024
May 22, 2024
May 22, 2024
May 22, 2024
Amy Casey, Secy Virtue of position
Historic Preservation Commission
Two-Year Terms
Created by Ordinance No. 2012-18
Name Term Expiration
T.C. Lipe
Ann West
Tammie Baggerly
Barrett Covington
Ann Carpenter
Tina Moore
September 8, 2024
September 8, 2024
September 8, 2024
September 8, 2023
September 8, 2023
Virtue of position
Building and Standards Commission
(Replacing Housing Board of Adjustments & Appeals)
Two-Year Terms
Created by Ordinance No. 2020-42
Name Term Expiration
Johner Martin
Ricardo DeLeon
Priscilla Linnemann
Samantha Crumbaugh
Cindy Black
November 10, 2024
November 10, 2024
November 10, 2024
November 10, 2024
November 10, 2024
Page 28
Library Board of Directors
Three-Year Terms
Created by Ordinance
February 28, 1933
Name Term Expiration
Melinda Lanham
Roxanne Sanders
Frances Fennessy
Sandra Velo
Ann Locklin
Chad Green
Janice Pustka
August 13, 2025
November 30, 2023
November 30, 2024
November 30, 2025
November 30, 2023
August 13, 2025
November 30, 2025
Municipal Judge & Associate Judge
Name Term Expiration
Steve Lee, Judge Indefinite
Ted Duffield, Associate Judge Indefinite
Parks Board
Two-Year Terms
Created by Ordinance No. 51083-3
Name Term Expiration
Ted Smith
Josh Pearson, Chair
Oscar Bersoza
Diane Ring
Jason Wolfe
June 20, 2025
June 20, 2024
June 20, 2024
June 20, 2025
June 20, 2025
Planning and Zoning Commission
Two-Year Terms
Created by Ordinance No. 52885-1
Name Term Expiration
Joshua Knowles
Quinton Locklin
Nicole Fischer
Luke Potts
David Jarratt
Alton McCallum
Dominica Garza
Justin Ruiz
Brett Baggerly, Chair
May 28, 2024
June 13, 2025
May 28, 2024
May 28, 2024
June 13, 2025
May 28, 2024
June 13, 2025
June 13, 2025
May 28, 2024
Page 29
Police and Fire Civil Service Commission
Three-Year Terms
Created by Ordinance No. 96-27
Name Term Expiration
Jimmy Rowton
Jerry Samu
Larry Thompson
September 24, 2025
September 24, 2024
September 24, 2023
Public Property Finance Corporation Board of Directors
Six-Year Terms
Created by Ordinance No. 51987-1
Name Term Expiration
Bill Holmes, President
Stephanie O’Banion
Daniel Bucher
August 12, 2023
August 12, 2023
August 12, 2023
Tax Increment Reinvestment Zone Board
Two-Year Terms
Created by Ordinance No. 2004-64
Name Term Expiration
Stephanie O'Banion, Chair
Craig Pearson
Barbara Bozon
David Blackburn
Russell Schneider
January 13, 2025
January 13, 2025
January 13, 2025
January 13, 2025
January 13, 2025
Sam Listi, City Manager, Ex Officio Virtue of position
David K. Leigh, Councilmember, Ex Officio Virtue of position
Amy Casey, City Clerk, Ex Officio Virtue of position
Texas Dormitory Finance Authority, Inc.
Two-Year Terms
Created by Ordinance No. 82289-1
Name Term Expiration
Bill Holmes
Blair Williams
Bry Ewan
Danny Dossman
Dr. Andy Crowson
April 26, 2024
April 26, 2024
April 26, 2024
April 26, 2024
April 26, 2024
Page 30
Youth Advisory Commisssion
One-Year Terms
Created by Ordinance No. 2007-20
Name Term Expiration
Christian Kunz, Chair
Chase Moore
Madison Combest
Oscar Constancio
Arianna Ryan
Nathan Ogden
Brendan Hall
Ashutosh Ghamande
Kira Woods
Zoning Board of Adjustments
Two-Year Terms
Created by City Council April 1971

September 1, 2023
September 1, 2023
September 1, 2023
September 1, 2023
September 1, 2023
September 1, 2023
September 1, 2023
September 1, 2023
September 1, 2023
Name Term Expiration
Mat Naegele
Amanda Hendrick
Robin Alaniz
Nelson Hutchinson
Garrett Smith
June 25, 2024
August 22, 2023
August 22, 2023
June 25, 2024
August 22, 2023
Page 31
CITY INFORMATION
THE CITY ORGANIZATION
The City of Belton is a home-rule city operating under a Council-Manager form of government. All powers of the city are vested in an elected Council, consisting of a mayor and six members. The Council enacts local legislation, determines City policies, and employs the City Manager. Citizens elect each Council member at large in nongeographic places for three-year terms.
The City Manager is the Chief Executive Officer and the head of the administrative branch of the city government. He is responsible to the Council for the proper administration of all affairs of the city.
The city government provides a broad range of goods and services to its citizens. The activities and personnel required to provide these goods and services are organized into broad managerial areas called Funds. Funds are separate fiscal and accounting entities with their own resources and budgets necessary to carry on specific activities and attain certain objectives.
Funds are further organized into functional groups called Departments. A Department is a group of related activities aimed at accomplishing a major City service or program (e.g. Police Department).
A Department may be further divided into smaller areas called Divisions. Divisions perform specific functions within the Department (e.g. Code Compliance is a division of the Police Department).
At the head of each Department is a Director who is an officer of the City. Directors have supervision and control of a Department and the Divisions within it but are subject to the supervision and control of the City Manager. A Director may supervise more than one Department.
CITY FUNDS
The City is organized into Funds. For fiscal (financial) purposes, a fund is a separate accounting entity with a self-balancing set of accounts in which cash and other financial resources, all related liabilities, residual equities, and the changes therein are segregated and recorded. The budgeted funds for the City include:
Page 32
Governmental Funds:
General Fund: Accounts for all financial resources except those required to be accounted for in another Fund.
Debt Service Fund: Accounts for the accumulation of resources for, and the payment of general long-term debt principal and interest.
Hotel/Motel Tax Fund: Accounts for activities related to the City's seven percent hotel occupancy tax. These funds can only be used for purposes designated by the State and further designated by the City Council.
Tax Increment Reinvestment Zone Fund: This fund is used to account for projects financed with tax revenues collected in the City’s tax increment and reinvestment zone, created pursuant to the state tax code statutes.
Enterprise Funds:
Water & Sewer Fund: Accounts for operations related to providing water and sewer service to the citizens of Belton.
Drainage Fund: Accounts for operations related to providing storm drainage service to the citizens of Belton.
Internal Service Funds:
Information Technology Fund: Accounts for operations related to providing general information technology services for other city divisions.
Building Maintenance Fund: Accounts for operations related to providing building maintenance for City facilities.
Component Unit (A Governmental Fund):
Belton Economic Development Corporation Fund: Accounts for activities related to the one-half percent economic development sales tax approved by voters in 1990.
The Annual Comprehensive Financial Report includes non-budgeted funds that are not included in this budget document.
Page 33
BASIS OF BUDGET & ACCOUNTING
The City’s Annual Comprehensive Financial Report (ACFR) shows the status of the City’s finances on the basis of generally accepted accounting principles (GAAP). Under GAAP, the City reports governmental funds on a modified accrual basis of accounting and enterprise funds on an accrual basis of accounting. In most cases this conforms to the way the City prepares its budget. Exceptions are as follows:
Liabilities for compensated absences that are expected to be liquidated with available financial resources are accrued as earned by employees (GAAP) as opposed to being expended when paid (budget basis).
Principal payments on long-term debt are applied to the outstanding liability on a GAAP basis, as opposed to being expended on a budget basis.
Capital outlays are recorded as assets on a GAAP basis and expended on a budget basis.
FINANCIAL AND BUDGET POLICIES
The General Fund balance shall be adequate to handle unexpected decreases in revenues plus extraordinary unbudgeted expenditures. The minimum fund balance should be at least 90 days of operating expenditures. The projected fund balance at the end of FY 2023 is 146 days.
Investments made by the City shall be in conformity with State law and the City of Belton investment policy that is adopted by the City Council. All investments shall stress safety, liquidity, public trust, and yield - in that order.
An independent audit will be conducted annually.
The City will produce annual financial statements in accordance with generally accepted accounting procedures (GAAP) as outlined by the Governmental Accounting Standards Board (GASB).
The City will produce an Annual Comprehensive Financial Report (ACFR), which meets the requirements for the Government Finance Officers Association's (GFOA) Certificate of Achievement for Excellence in Financial Reporting. The City of Belton has received thirty-six consecutive Certificates from FY 1986 through FY 2022. We believe the FY 2023 ACFR will also conform to the standards of the Certificate Program, and it will be submitted it to GFOA for award consideration.
Page 34
The budget should be balanced with current revenues plus available unreserved fund balances equal to or greater than current expenditures. All budgeted funds have balanced budgets for FY 2024.
The tax rate should be adequate to produce revenues required to pay for City services as approved by the City Council.
Sales tax revenue projections should be conservative due to the elastic nature of this economically sensitive revenue source. FY 2024 sales tax revenues were budgeted with a conservative projected increase from the FY 2023 level.
The General Fund should be compensated by other funds for general and administrative services provided, including management, finance, personnel, and the use of City streets and the City fleet. The transfers for FY 2024 are $1,744,410.
The City will not issue debt to finance current operations. No debt was issued in FY 2023 to finance current operations.
A contingency amount shall be included in the annual budget in an amount not to exceed 3% of total General Fund expenditures, to be used in case of unforeseen items of expenditures. The FY 2024 contingency amount is set at $100,000 or 0.4% of operating expenditures before the contingency amount.
The City will maintain physical assets at a level adequate to protect the City's capital investment and minimize future maintenance and replacement costs.
The City will produce an annual budget document that meets the criteria for GFOA's Distinguished Budget Presentation Award. The City has received the award for thirtyone consecutive years, for FY 1993 through FY 2023. We believe the FY 2024 budget will also conform to the standards of the Certificate Program, and it will be submitted it to GFOA for award consideration.
The City's water and sewer utilities shall operate on a self-supporting basis so that user charges for services shall fully cover the cost of providing those services. All water and sewer revenue in the FY 2024 budget is generated from user fees and interest thereon.
The City will not use property taxes or other General Fund revenues to subsidize the utility operations. The FY 2024 budget does not subsidize the Water and Sewer Fund or Drainage Fund from the General Fund.
Utility rates shall be reviewed annually to ensure that they will generate revenues adequate to cover operating expenditures, meet bond covenants, and allow for adequate capital replacement. A full utility rate study was completed in FY 2022 went into effect in FY 2023.
Page 35
The City's rate structures for water and sewer services will (to the greatest extent possible) be fair and equitable to all customers. The water base rate, or minimum bill, is now based upon meter size and includes 2,000 gallons of water flow. Two water volumetric rates have been established, with customers paying a fee for each 1,000 gallons above 2,000 gallons. The sewer base rate is the same regardless of meter size. The sewer volumetric rate charged for consumption over 2,000 gallons is the same rate for all customer classes. For services provided outside of the city limits, all rates are 1.25 times the prevailing rate within the City of Belton.

The City will maintain sufficient net revenues to meet the debt coverage required by existing revenue bond indentures. The projected coverage for FY 2023 exceeds current debt coverage requirements.
The utility system will maintain a bond rating of AA- (Standard & Poor’s). The most recent rating is at this level.

The utility system will operate in the most efficient manner possible to keep rates as low as possible while maintaining sufficient revenues for the timely maintenance and replacement of utility system capital assets.
The City will make timely investment in the expansion of capital assets to provide adequate levels of service in conformance with State and Federal regulations, and meeting the appropriate health, safety, and environmental standards.
The City will provide timely and accurate billing to customers, providing safeguards to ensure prompt payment and minimal financial losses from delinquent customers which have to be passed onto the remaining customers.
BBB+, BBB, BBBA+, A, AAA+, AA, AAAAA BB+, BB, BBCCC+, CCC, CCCCC C, RD, D Credit Quality Low to Risk Low to Hi g h
Page 36
S & P Global Ratings Guide
Page 37
CITY OF BELTON
Preliminary Budget & Tax Calendar
FY 2024
2023 Dates Event Requirement/Action
February 1 to February 28
preparation
March 1 Budget requests due
March 20 to April 7
April
April 25
May
May
May
June 13 Regular Council meeting
June 27
July 11
Council meeting
Council meeting
July 24 Certified tax roll
August
Departments prepare budget requests
Detailed line‐item requests are returned to Finance
Departments meet with City Manager and Finance to discuss budget requests
BEDC budget workshop
Workshop to discuss Strategic Plan and long‐term goals for the City
approves its FY 2024 budget
TIRZ approves its FY 2024 budget
General Fund and Debt Service Fund
Water and Sewer Fund and Drainage Fund
Discuss 2024 – 2028 Capital Improvements Program
Hotel/Motel Fund, TIRZ, Information Technology Fund, Building Maintenance Fund, and BEDC
Present the FY 2024 Proposed Annual Budget to City Council (Must be filed with Clerk at least 30 days before budget adoption)
Post proposed budget on City website
Present the Strategic Plan
BCAD delivers certified ad valorem tax values
Call for public hearing on budget
Propose an ad valorem tax rate for tax year 2023/fiscal year 2024
Call for public hearing on tax rate, if it exceeds no‐new‐tax rate
Post proposed tax rates on website
August 10 Newspaper notice Public notice of public hearing on budget (10 – 30 days before hearing)
August 14 Newspaper notice Publish in newspaper and on City website the notice of public hearing on tax rate (if exceeds no‐new‐revenue tax rate, must be at least 5 days before hearing)
August 22 Regular Council meeting
September 12 Regular Council meeting
Continuous website notice of PH on tax rate (at least 7 days before hearing)
Public hearing on budget (at least 15 days after filing with City Clerk)
Public hearing on Strategic Plan
Public hearing on tax rate
Ratify tax revenue increase in budget, if necessary
Adopt fee schedule
Adopt Strategic Plan
Adopt FY 2024 Annual Budget
Adopt ad valorem tax rate (no more than 60 days after receipt of certified tax roll)
*The budget and tax rate must be adopted no later than 78 days before the uniform election date (August 21, 2023) if the City plans to adopt a tax rate that exceeds the greater of the voter‐approval rate or the de minimis rate. If a rate lower than the voter‐approval rate is proposed on August 8, 2023, adoption of the budget and tax rate can occur in September.
Budget
Department
meetings
4 BEDC Board meeting
Regular Council meeting
2 BEDC Board meeting
BEDC
4 TIRZ Board meeting
23 Regular Council meeting
Regular
Regular
8 Regular Council meeting
Public hearing on Strategic Plan
Page 38
Budget Calendar - Flow Chart
The following chart summarizes the budget process and the various steps leading to the adoption of the Fiscal Year 2024 Budget.
Strategic Planning:
Review and update Capital Improvement Projects as needed
Revenue projections developed
Budget orientation
Budget Development:
Budget staff prepares and send budget materials to divisions
Divisions prepare draft operating budgets
Budget review sessions with City Manager
City Council budget work sessions
Finance staff compiles Proposed Annual Budget
Proposed Annual Budget filed with City Clerk and published
Finalize and Adopt:
Finance staff finalizes Annual Budget
Public hearing on Annual Budget
City Council adopts annual budget
Public hearing on proposed tax rate if necessary
City Council adopts a tax rate
Annual budget published
Amend budget if necessary (after fiscal year has begun)
JanFebMarAprMayJunJulAugSepOctNovDec
Page 39
THE BUDGET PROCESS
The City Charter establishes the fiscal year, which begins October 1 and ends September 30. Each February, Department Heads receive budget request packets from the Finance Department. These packets contain information about the Department, including historical expenditure amounts, current expenditure and budget amounts, and estimated expenditure amounts for the upcoming budget year.
While the Departments are preparing their budget requests, the Finance Department calculates personnel costs, debt service requirements, and revenue projections for the new year. This data combined with the Department requests form a preliminary or "first draft" budget.
After receiving the first-draft budget from Finance, the City Manager conducts a series of meetings with the individual Department Heads to discuss their budget requests. Held in March, these meetings help the City Manager formulate his priorities and work agenda.
A series of City Council budget workshops are held, usually in May and June. These workshops are open to the public and are posted per open meetings law. Information as to date and time can usually be found in the local media coverage. The workshops allow the City Council to receive input on the budget from the City Manager, the Departments, and Finance. It is through these workshops, as well as discussions with City staff, that the Council forms its priorities and work program for the proposed budget.
With guidance from the Council, the City Manager then formulates a proposed budget that is submitted to Council in July State law and the City Charter require that a public hearing on the proposed budget be held before the Council votes on its adoption. A notice of the public hearing is published in the local newspaper, and the hearing is held during a regular City Council meeting. This hearing provides an opportunity for citizens to express their ideas and opinions about the budget to their elected officials.
After the public hearing, the City Council votes on the adoption of the budget. If the budget is not accepted and formally approved by the City Council before September 28, the budget submitted by the City Manager is deemed to have been finally adopted by the Council until such time as the Council adopts a budget.
After adoption of the budget, the City Manager may approve transfers of any unencumbered budget amount or portion thereof between general classifications of expenditures within a Division or Department. At the request of the City Manager and within the last three months of the fiscal year, the Council may by resolution, transfer any unencumbered appropriation or portion thereof from one Division or Department to another. The City budget may be amended and appropriations altered in accordance therewith in cases of public necessity, after the conduction of a public hearing called for such purpose.
Page 40
Page 41
Fund Structure / Overview

Total Budgeted Expenditures -All Funds Governmental Funds General Fund Debt Service Fund Special Revenue Funds Hotel/Motel Tax Fund TIRZ Fund Proprietary Funds Enterprise Funds Water & Sewer Fund Drainage Fund Internal Service Funds Information Tech. Fund Building Maint. Fund Component Unit Belton Economic Dev. Corp. Fund $45,791,900 $27,726,860 $16,073,730 $1,991,310 $23,156,300 $1,205,260 $3,365,300 $14,670,080 $1,403,650 $1,991,310 $344,350 $3,020,950 $13,910,620 $759,460 $954,190 $449,460 Page 42
General Fund
Departmentto FundStructure
City Council City Council
Administration
City Manager
Public Information
Retail Development
Municipal Court
Finance
Human Resources
Finance
Human Resources
Water & Sewer Fund
Utility Administration
Utility Finance
Water
Police
Police Administration Patrol Special Operations Code Compliance
Fire Fire Suppression
Streets Streets
Parks Facilities
Drainage Fund
Information Technology Fund
Building
Maintenance Fund
SewerCollections
Sewer – Lift Stations
Drainage
Information Technology
Building Maintenance
Belton Economic Development Corp BEDC
Parks & Recreation
Community Center Recreation Planning Planning Inspections
Library Library
Solid Waste Solid Waste
Fleet Maintenance Fleet Maintenance
Fund
Legend
Department
Division- legal level of control in accordance with City Charter
Page 43
City of Belton Organizational Chart


Primary Funding Source
Mayor & City Council City Clerk City Manager City Attorney Municipal Court Judge Assistant City Manager Administration Finance Public Information Library Information Technology Police Public Information Information Technology Administration Patrol Special Operations Code Compliance Library City Manager's Office Retail Development Hotel Motel TIRZ Finance Municipal Court Utility Finance Debt Service General Fund Information Technology Fund Building Maintenance Fund Hotel Motel Tax Fund TIRZ Fund Water & Sewer Fund Debt Service Drainage Fund Page 44


Elected by Citizens Appointed by City Council Department Division City funds without related department Additional Designations Human Resources Planning Fire Public Works Parks & Recreation Facilities Community Center Recreation Human Resources Planning Inspections Fire Supression Streets Streets Maintenance SolidWaste Fleet Maintenance Building Maintenance Solid Waste Water & Sewer Drainage Utility Administration Water SewerCollection SewerLift Station Drainage Page 45
CITY OF BELTON PERSONNEL SUMMARY FISCAL YEAR 2023
DivisionFTE Salary & Wages Overtime Retirement FICA Group Ins. Worker's Comp TWC Totals City Council 0.00 10 $ -$ - $ - $ - $ 330$ - $ 340 $ City Manager 5.00585,230 - $ 55,870 $ 39,700 $ 42,750 $ 1,160 $ 520 $ 725,230 Public Information 1.0091,220 - $ 9,950 $ 6,980 $ 9,820 $ 200 $ 90 $ 118,260 Retail Development 1.0061,620 - $ 6,730 $ 4,720 $ 7,360 $ 140 $ 90 $ 80,660 Finance 4.00336,860 - $ 36,750 $ 25,770 $ 24,850 $ 750 $ 360 $ 425,340 Human Resources 2.00178,820 - $ 19,510 $ 13,680 $ 7,680 $ 400$ 180 $ 220,270 Municipal Court 2.00107,790 - $ 11,760 $ 8,250 $ 16,340 $ 280 $ 180 $ 144,600 Police Administration 4.00329,680 - $ 34,790 $ 24,400 $ 32,920 $ 3,990 $ 360 $ 426,140 Patrol 29.002,234,520 55,000 $ 249,520 $ 170,950 $ 211,530 $ 63,480 $ 2,610 $ 2,987,610 Special Operations 24.501,598,020 75,000 $ 182,190 $ 122,250 $ 140,730 $ 31,710 $ 2,250 $ 2,152,150 Code Compliance 2.0098,830 - $ 10,780 $ 7,570 $ 7,680 $ 3,860 $ 180 $ 128,900 Fire Suppression 32.002,520,340 80,000 $ 283,320 $ 192,810 $ 241,260 $ 76,930 $ 2,880 $ 3,397,540 Streets 7.00298,390 2,000 $ 32,760 $ 22,830 $ 62,030 $ 12,290 $ 630 $ 430,930 Parks- Facilities 12.00562,290 1,600 $ 59,160 $ 43,020 $ 83,510 $ 17,170 $ 1,170 $ 767,920 Parks- Comm. Ctr. 1.5063,660 - $ 6,950 $ 4,870 $ 13,660 $ 2,070 $ 180 $ 91,390 Parks- Recreation 2.00130,090 - $ 12,200 $ 9,960 $ 6,850 $ 610$ 270 $ 159,980 Planning 6.00369,030 - $ 40,260 $ 28,240 $ 41,890 $ 820 $ 540 $ 480,780 Inspections 3.00182,730 - $ 19,940 $ 13,980 $ 22,070 $ 1,380 $ 270 $ 240,370 Library 5.00242,760 - $ 26,480 $ 18,580 $ 15,670 $ 950 $ 450 $ 304,890 Solid Waste 1.0041,310 150 $ 4,530 $ 3,160 $ 7,360 $ 1,790 $ 90 $ 58,390 Fleet Maintenance 4.00212,480 1,500 $ 22,430 $ 15,720 $ 33,530 $ 5,000 $ 360 $ 291,020 GENERAL FUND 148.0010,245,680 $ 215,250 $ 1,125,880 $ 777,440 $ 1,029,490 $ 225,310 $ 13,660 $ 13,632,710 $ Utility Administration 9.00621,250 $ 1,200 $ 67,890 $ 47,530 $ 71,680 $ 4,290 $ 810 $ 814,650 $ Utility Finance 4.00201,590 $ - $ 21,990 $ 15,430 $ 42,950 $ 550 $ 360 $ 282,870 Water 13.00559,710 $ 20,000 $ 63,160 $ 44,350 $ 77,230 $ 21,160 $ 1,170 $ 786,780 Sewer 5.00203,780 $ 14,000 $ 23,700 $ 16,660 $ 35,940 $ 5,680 $ 450 $ 300,210 Sewer Lift Stations 1.0055,200 $ 1,100 $ 6,140 $ 4,230 $ 10,490 $ 1,360 $ 90 $ 78,610 WATER AND SEWER FUND 32.001,641,530 $ 36,300 $ 182,880 $ 128,200 $ 238,290 $ 33,040 $ 2,880 $ 2,263,120 $ DRAINAGE FUND 4.00142,920 $ 1,100 $ 15,710 $ 11,020 $ 29,420 $ 5,930 $ 360 $ 206,460 $ INFO TECHNOLOGY FUND 3.00242,620 $ - $ 26,470 $ 18,560 $ 21,240 $ 520 $ 270 $ 309,680 $ BUILDING MAINT. FUND 5.00219,630 $ 1,000 $ 23,410 $ 16,810 $ 42,400 $ 6,680 $ 510 $ 310,440 $ BEDC 2.75216,660 $ 200 $ 23,660 $ 16,580 $ 30,150 $ 470 $ 270 $ 287,990 $ GRAND TOTALS194.7512,709,040 $ 253,850 $ 1,398,010 $ 968,610 $ 1,390,990 $ 271,950 $ 17,950 $ 17,010,400 $
Page 46
Budgeted Personnel Positions
Note: Positions are shown as full-time equivalent (FTE)
Budgeted Personnel Positions

Fund FY 2020 FY 2021 FY 2022 FY 2023 FY 2024 General Fund 136.50 132.75 133.75 137.00 148.00 Water & Sewer Fund 28.00 28.00 29.00 29.00 32.00 Drainage Fund 4.00 4.00 4.00 4.00 4.00 Information Technology Fund - 2.00 2.00 3.00 3.00 Building Maintenance Fund - 5.00 5.00 5.00 5.00 BEDC Fund 2.25 2.25 2.25 2.75 2.75 Total 170.75 174.00 176.00 180.75 194.75
‐20.00 40.00 60.00 80.00 100.00 120.00 140.00 FY 2020 FY 2021 FY 2022 FY 2023 FY 2024 Fiscal Year
General Fund Water & Sewer Fund Drainage Fund Information Technology Fund Building Maintenance Fund BEDC Fund Page 47
Budgeted Personnel Positions by Division (Full-time Equivalents)
Fund Department DivisionFY 2020 FY 2021 FY2022 FY2023 FY2024 General Fund Administration City Manager's Office4.00 5.00 5.00 5.00 5.00 Public Relations 1.00 1.00 1.00 1.00 1.00 Retail Development 1.00 1.00 1.00 1.00 1.00 Finance Finance 4.00 4.00 4.00 4.00 4.00 Human Resources Human Resources 2.00 2.00 2.00 2.00 2.00 Municipal Court Municipal Court 1.00 1.00 1.00 2.00 2.00 Police Administration 3.00 3.00 4.00 4.00 4.00 Patrol 27.00 29.00 25.00 26.00 29.00 Special Operations 16.50 17.50 21.50 22.50 24.50 Code Compliance 2.00 2.00 2.00 2.00 2.00 Fire Suppression 28.00 28.00 28.00 28.00 32.00 Emergency Medical Services 1.00 - - -Information Technology Information Technology 2.00 - - -Streets Streets 7.00 7.00 7.00 7.00 7.00 Parks & Recreation Facilities 11.00 11.00 11.00 11.00 12.00 Community Center 1.50 1.50 1.50 1.50 1.50 Recreation 2.00 2.00 2.00 2.00 2.00 Planning Planning 4.50 4.75 4.75 5.00 6.00 Inspections 3.00 3.00 3.00 3.00 3.00 Library Library 5.00 5.00 5.00 5.00 5.00 Solid Waste Solid Waste 1.00 1.00 1.00 1.00 1.00 Maintenance Fleet Maintenance 4.00 4.00 4.00 4.00 4.00 Building Maintenance 5.00 - - -Total 136.50 132.75 133.75 137.00 148.00
Page 48
Notes:
Budgeted Personnel Positions by Division (Full-time Equivalents)
Fund Department DivisionFY 2020 FY 2021 FY2022 FY2023 FY2024
Water & Sewer Fund Water & Sewer Utility Administration6.00 6.00 7.00 8.00 9.00 Utility Finance 4.00 4.00 4.00 4.00 4.00 Water 12.00 12.00 12.00 11.00 13.00 Sewer-Collection 5.00 5.00 5.00 5.00 5.00 Sewer-Lift Stations 1.00 1.00 1.00 1.00 1.00 Total 28.00 28.00 29.00 29.00 32.00 Drainage Fund Drainage Drainage 4.00 4.00 4.00 4.00 4.00 Total 4.00 4.00 4.00 4.00 4.00 Information Technology Fund Information Technology Information Technology - 2.00 2.00 3.00 3.00 Total - 2.00 2.00 3.00 3.00 Building Maintenance Fund Building Maintenance Building Maintenance - 5.00 5.00 5.00 5.00 Total - 5.00 5.00 5.00 5.00 BEDC Fund BEDC BEDC 2.25 2.25 2.25 2.75 2.75 Total 2.25 2.25 2.25 2.75 2.75 Total City Positions (FTE) 170.75 174.00 176.00 180.75 194.75
Page 49
Seasonal employees are hired during the summer as recreation staff. There count is not reflected above.
City of Belton, Texas
Fiscal Year 2024 Proposed Annual Budget
All Funds Summary
Notes: Capital project funds are excluded from presentation because they are not part of the annual appropriations process. Appropriations for capital projects are made on a project basis and carry over until the project is completed.
GeneralDebt ServiceHotel/Motel TaxTIRZ ResourcesFundFundFundFund Property Taxes8,560,760 $ 1,219,740 $ - $ 3,175,120 $ Sales Tax6,440,000 - -Franchise & Other Taxes1,327,940 - 422,310Permit Fees514,770 - -Court Fines & Fees306,330 - -Charges for Service3,601,460 - -Miscellaneous Income492,150 31,280 22,000 18,800 Intergovernmental- - -Other Financing Sources168,480 - -Total Revenue before Transfers 21,411,890 1,251,020 444,310 3,193,920 Transfers from Other Funds1,744,410 - -Total Resources 23,156,300 1,251,020 444,310 3,193,920 Expenditures Personnel13,632,710 $ - $ - $ - $ Supplies721,180 - 100Maintenance1,499,090 - -Services5,411,900 - 142,800 40,000 Other Expenses282,740 - 146,500 150,000 Water Purchases- - -Sewage Treatment- - -Debt Service- 1,205,260 -Capital Outlay 45,000 - -Total Expenditures before Transfers 21,592,620 1,205,260 289,400 190,000 Transfers to Other Funds 1,563,680 - 54,950 2,830,950 Total Expenditures 23,156,300 1,205,260 344,350 3,020,950 Resources Over / (Under) Expenditures - $ 45,760 $ 99,960 $ 172,970 $
Special Revenue Funds Page 50
Component Unit Water & Sewer Drainage InformationBuilding BEDC Total Fund Fund Technology Maintenance Fund All Funds - $ - $ - $ - $ - $ 12,955,620 $ - - - - 3,250,170 9,690,170 - - - - - 1,750,250 - - - - - 514,770 - - - - - 306,330 13,355,920 635,300 1,047,680 543,260 27,600 19,211,220 406,150 12,230 2,450 4,640 277,640 1,267,340 - - - - -- 111,930 - - - 280,410 13,762,070 759,460 1,050,130 547,900 3,555,410 45,976,110 265,250 - - - - 2,009,660 14,027,320 759,460 1,050,130 547,900 3,555,410 47,985,770 2,263,120 $ 206,460 $ 309,680 $ 310,440 $ 287,990 $ 17,010,400 $ 169,290 39,130 29,800 43,860 5,170 1,008,530 206,550 73,000 443,940 75,000 87,180 2,384,760 786,020 66,690 99,370 11,490 206,770 6,765,040 25,000 - - - - 604,240 1,911,200 - - - - 1,911,200 939,420 - - - - 939,420 1,955,340 25,120 - - - 3,185,720 577,500 - 71,400 - 50,000 743,900 8,833,440 410,400 954,190 440,790 637,110 34,553,210 5,077,180 349,060 - 8,670 1,354,200 11,238,690 13,910,620 759,460 954,190 449,460 1,991,310 45,791,900 116,700 $ - $ 95,940 $ 98,440 $ 1,564,100 $ 2,193,870 $ Enterprise Funds Internal Service Funds Page 51
City of Belton, Texas
Consolidated Statement of Fund Balance
Budget Year 2024
1 Excludes use of prior years' fund balance
Reason for significant changes in fund balance, if any:
General Fund - The increase in FY 2023 is due to higher charges for service and greater interest yields.
Debt Service Fund - The significant increase in each year reflects the low level of reserves.
Hotel/Motel Tax Fund - The increase in both fiscal years reflects a planned build up of reserves for future expenditures.
TIRZ Fund - Changes reflect revenue growth and capital spending.
Water & Sewer Fund - There are no signficant changes in reserves.
Drainage Fund - The increase in FY 2023 is due to customer growth and greater interest yields.
Information Technology Fund - The increase in both fiscal years reflects a planned build up of reserves for future capital.
Building Maintenance Fund - The increase in both fiscal years reflects a planned build up of reserves for future capital.
BEDC Fund - Changes reflect revenue growth and relatively low level of spending.
GeneralDebt ServiceHotel/Motel TaxTIRZ FundFundFundFund Fund Balance at 9/30/20226,825,928 $ 11,541 $ 605,962 $ 1,001,077 $ Estimated Fund Balance Revenue22,263,195 1,213,094 383,518 2,751,609 Expenditures(20,742,620) (1,196,280) (173,160) (2,632,390) Subtotal1,520,575 16,814 210,358 119,219 Estimated at 9/30/20238,346,503 $ 28,355 $ 816,320 $ 1,120,296 $ % Change from Prior Year22.3%145.7%34.7%11.9% Projected Fund Balance Revenue 1 22,987,820 1,251,020 444,310 3,193,920 Expenditures(23,156,300) (1,205,260) (344,350) (3,020,950) Subtotal(168,480) 45,760 99,960 172,970 Projected at 9/30/20248,178,023 $ 74,115 $ 916,280 $ 1,293,266 $ % Change from Prior Year-2.0%161.4%12.2%15.4%
Page 52
Special Revenue Funds
Component Unit Water & SewerDrainageInformationBuildingBEDCTotal FundFundTechnologyMaintenanceFundAll Funds 6,407,688 $ 297,483 $ 123,676 $ 109,032 $ 6,958,149 $ 22,340,536 $ 12,893,730 622,847 1,106,800 500,290 4,671,900 46,406,983 (12,583,882) (556,077) (913,978) (431,178) (1,810,612) (41,040,177) 309,848 66,770 192,822 69,112 2,861,288 5,366,806 6,717,536 $ 364,253 $ 316,498 $ 178,144 $ 9,819,437 $ 27,707,342 $ 4.8%22.4%155.9%63.4%41.1%24.0% 14,027,320 647,530 1,050,130 547,900 3,555,410 47,705,360 (13,910,620) (759,460) (954,190) (449,460) (1,991,310) (45,791,900) 116,700 (111,930) 95,940 98,440 1,564,100 1,913,460 6,834,236 $ 252,323 $ 412,438 $ 276,584 $ 11,383,537 $ 29,620,802 $ 1.7%-30.7%30.3%55.3%15.9%6.9%
Page 53
Enterprise FundsInternal Service Funds
FY 2024 Capital Expenditures (All Funds)
General Fund Parks Facilities 8300Maintenance technician truck 45,000 Hotel/Motel Tax Fund 45,000 $ Information Technology Fund IT 8400Copiers - Finance, Harris & Public Works 23,400 8400Laptops and desktops/monitors 48,000 Information Technology Fund 71,400 $ Water & Sewer Fund Utility Administration 8300Director of public works truck 45,000 8300Asstant director of public works truck 42,500 8300GIS tech/project manager truck 35,000 Water 8200Mini excavator 85,000 8300Two meter reader trucks 70,000 8901Water meters 300,000 Water & Sewer Fund 577,500 $ Belton Economic Development Corporation Fund BEDC 8700Park infrastructure50,000 $ BEDC Fund 50,000 $
Page 54
City of Belton, Texas Budget Summary History (All Funds) 1
Fiscal Years 2021 - 2024
1 Presented are the budgets as originally adopted by City Council for each fiscal year. Capital project funds are excluded from presentation because they are not part of the annual appropriation process. Appropriations for capital projects are made on a project basis and carry over until the project is completed.
FY 2021FY 2022FY 2023FY 2024 BudgetBudgetBudgetBudget Resources General Fund15,629,702 $ 17,470,200 $ 21,287,420 $ 23,156,300 $ Debt Service Fund1,206,654 1,180,870 1,210,150 1,251,020 Hotel/Motel Tax Fund203,572 183,100 288,600 444,310 TIRZ Fund2,689,775 2,538,930 2,828,190 3,193,920 Water & Sewer Fund9,003,733 10,614,980 12,137,280 14,027,320 Drainage Fund548,061 580,400 582,100 759,460 Information Technology Fund890,183 901,240 1,103,840 1,050,130 Building Maintenance Fund443,767 458,230 494,590 547,900 Belton Economic Development Corporation Fund1,702,199 2,455,330 3,114,250 3,555,410 Total Resources32,317,646 36,383,280 43,046,420 47,985,770 Expenditures General Fund15,381,769 17,470,200 20,784,020 23,156,300 Debt Service Fund1,177,833 1,180,870 1,196,380 1,205,260 Hotel/Motel Tax Fund203,572 180,110 168,180 344,350 TIRZ Fund1,943,891 2,210,240 2,671,210 3,020,950 Water & Sewer Fund8,939,710 10,614,980 12,137,280 13,910,620 Drainage Fund531,260 573,180 582,100 759,460 Information Technology Fund890,183 846,190 966,060 954,190 Building Maintenance Fund441,116 419,610 422,020 449,460 Belton Economic Development Corporation Fund474,143 685,260 1,940,100 1,991,310 Total Expenditures29,983,477 34,180,640 40,867,350 45,791,900 Resources Over / (Under) Expenditures 2,334,169 $ 2,202,640 $ 2,179,070 $ 2,193,870 $
$29,000,000 $34,000,000 $39,000,000 $44,000,000 $49,000,000 FY 2021FY 2022FY 2023FY 2024 Total Resources Total Expenditures Page 55
City of Belton, Texas
Comparative Schedule of City-Wide Resources and Expenditures (All Funds) 1
Fiscal Years 2021 - 2024
1 Capital projects funds are excluded from presentation because they are not part of the annual appropriation process. Appropriations for capital projects are made on a project basis and carry over until the project is completed.
FY 2021FY 2022FY 2023FY 2023FY 2024 ActualActualBudgetEstimatedBudget Resources General Fund16,426,336 $ 18,746,985 $ 21,287,420 $ 22,263,195 $ 23,156,300 $ Debt Service Fund1,219,325 1,116,878 1,210,150 1,212,483 1,251,020 Hotel/Motel Tax Fund235,342 293,940 288,600 383,518 444,310 TIRZ Fund2,316,221 2,494,727 2,828,190 2,757,471 3,193,920 Water & Sewer Fund9,208,905 10,635,243 12,137,280 12,893,730 14,027,320 Drainage Fund531,566 561,415 582,100 622,847 759,460 Information Technology Fund818,707 901,311 1,103,840 1,106,800 1,050,130 Building Maintenance Fund443,548 458,854 494,590 500,290 547,900 BEDC Fund2,488,409 2,940,184 3,114,250 4,671,900 3,555,410 Total Resources33,688,359 38,149,537 43,046,420 46,412,234 47,985,770 Expenditures General Fund18,103,460 17,305,401 20,784,020 20,742,620 23,156,300 Debt Service Fund1,175,634 1,179,541 1,196,380 1,196,280 1,205,260 Hotel/Motel Tax Fund122,109 142,429 168,180 173,160 344,350 TIRZ Fund1,949,194 2,154,690 2,671,210 2,632,390 3,020,950 Water & Sewer Fund9,457,342 10,403,372 12,137,280 12,583,882 13,910,620 Drainage Fund484,169 534,951 582,100 556,077 759,460 Information Technology Fund854,074 766,278 966,060 913,978 954,190 Building Maintenance Fund 364,476 386,007 422,020 431,178 449,460 BEDC Fund 459,276 569,711 1,940,100 1,810,612 1,991,310 Total Expenditures 32,969,734 33,442,380 40,867,350 41,040,177 45,791,900 Resources Over / (Under) Expenditures 718,625 $ 4,707,157 $ 2,179,070 $ 5,372,057 $ 2,193,870 $
$32,000,000 $37,000,000 $42,000,000 $47,000,000 Actual FY 2021 Actual FY 2022 Budget FY 2023 Estimated FY 2023 Budget FY 2024 Total Resources Total Expenditures Page 56
Overview
The General Fund is the chief operatingfund of the government. It is used to accountfor all currentfinancial resources not required by law or administrative action to be accounted for in designated funds. The primary governmental functions occurring within this fund are police and fire protection, parks, library, streets, and generaladministrativeoperations.

Operations within the General Fund are largely funded from taxes. Property taxes comprise thirty-seven percent of revenues, while sales taxes generate twenty-eightpercent. Otherrevenues include franchise taxes, fines,fees, andchargesforservicessuchasgarbagecollection.
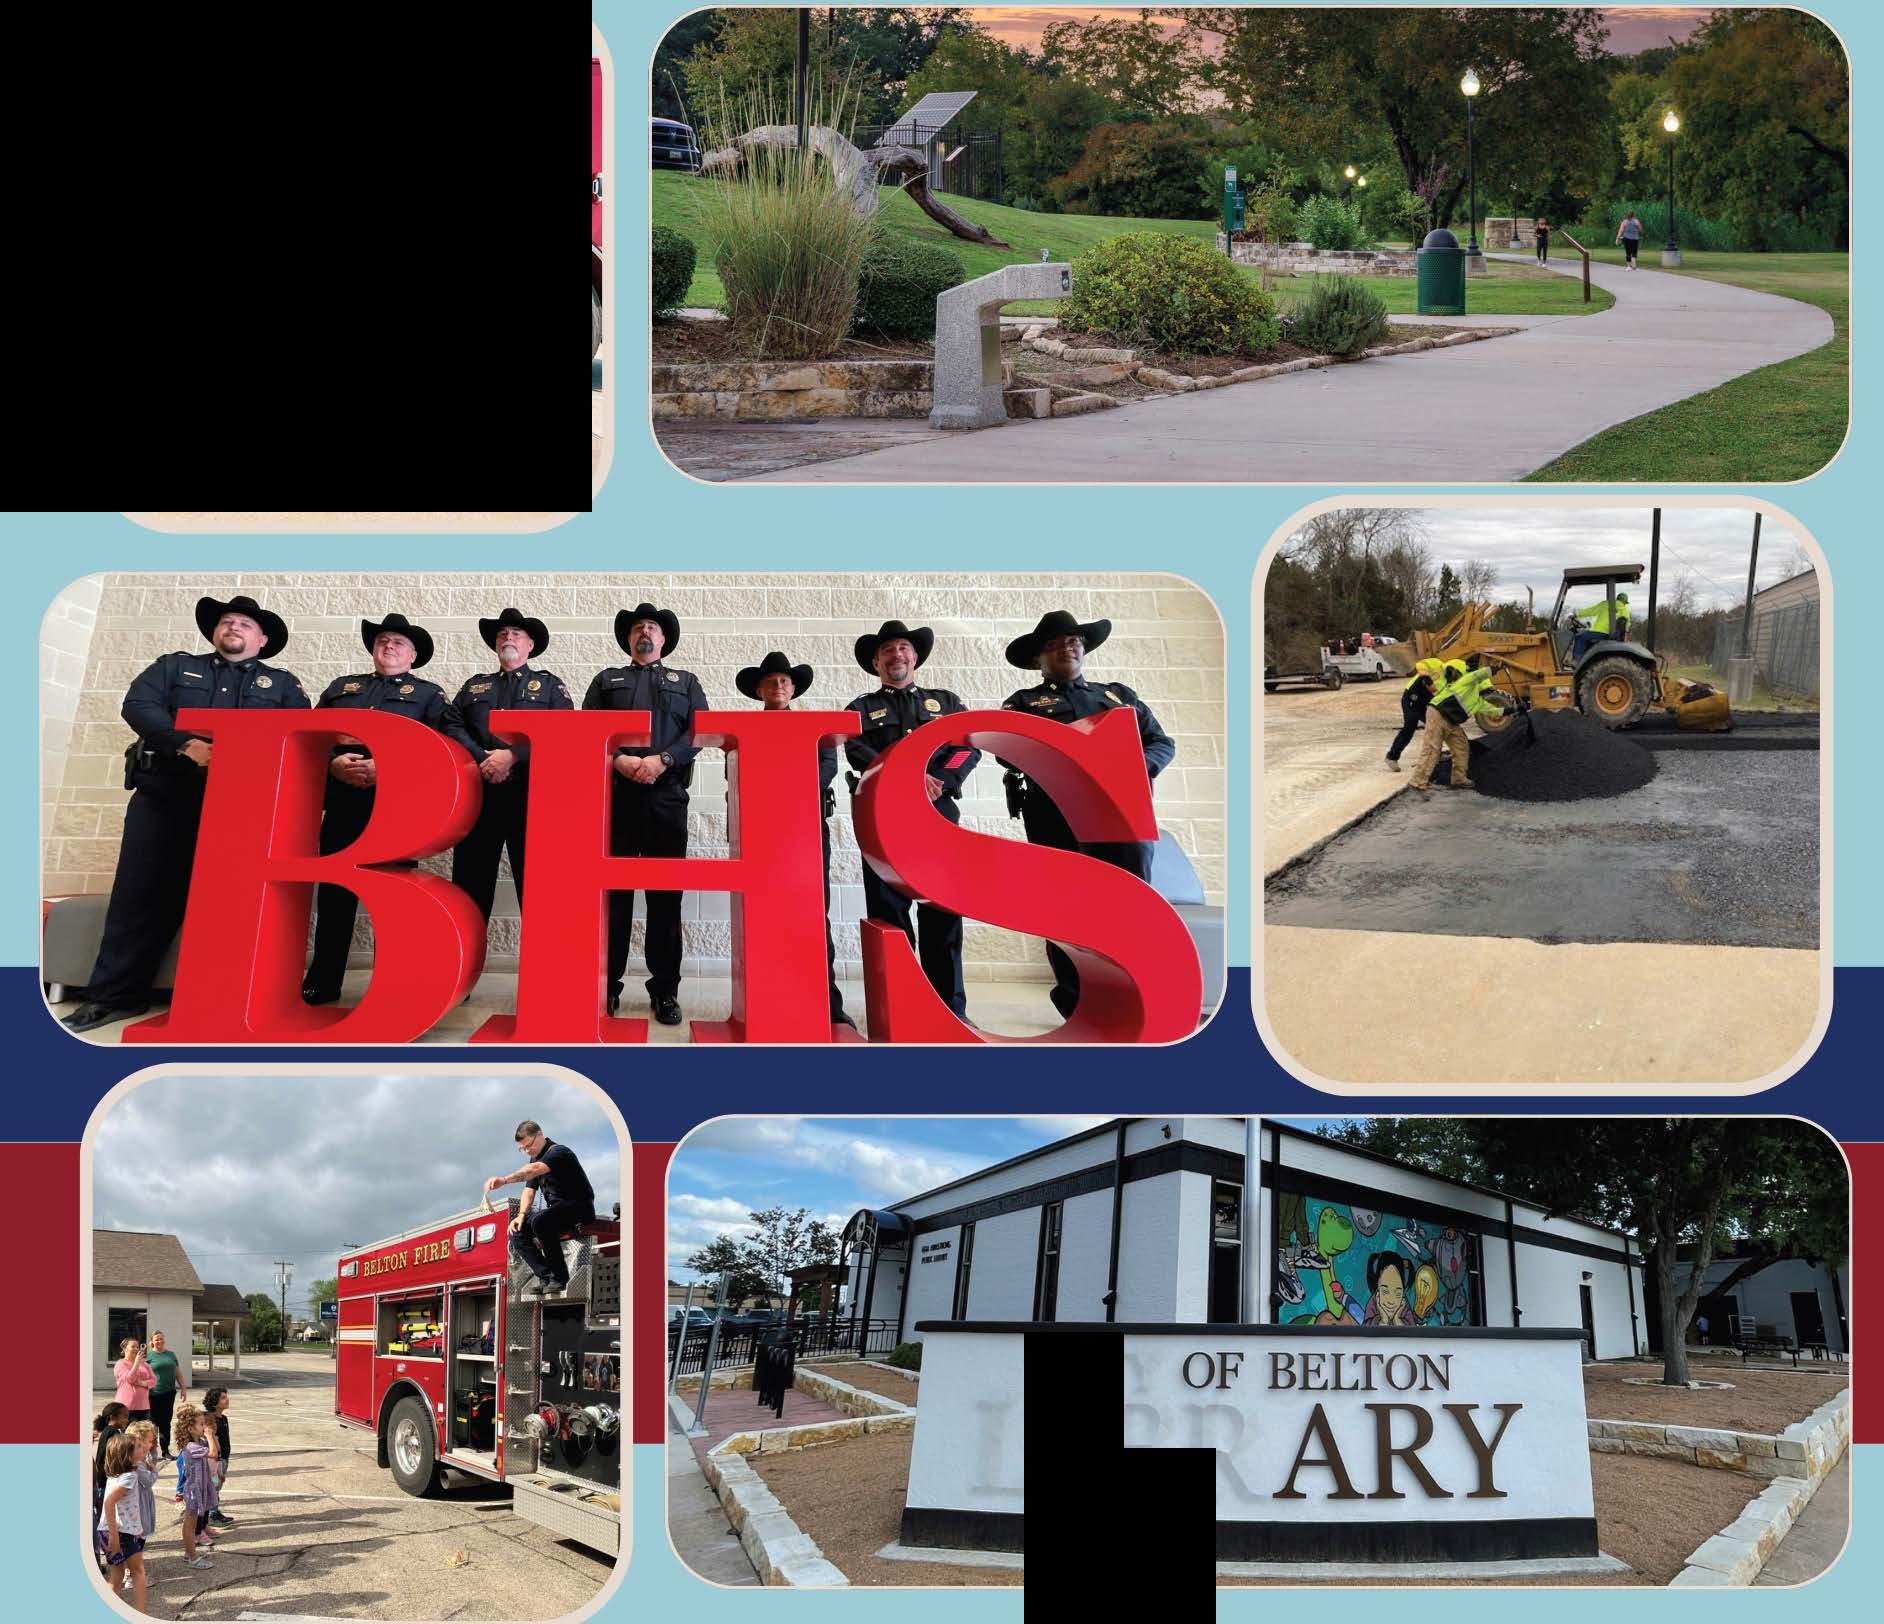
The organizationalstructure ofthisfundcanbe brokenintospecificdivisionsofthegovernmentthatarebased uponthefunctionthateachserves.Relateddivisionsmayformadepartmentwithconsolidatedmanagement.
�partments
CityCouncilDepartment
CityCouncil
AdministrationDepartment
CityManager'sOffice
PublicInformation
Retail Development
FinanceDepartment
Finance
HumanResourcesDepartment
Human Resources
MunicipalCourt
MunicipalCourt
PoliceDepartment
Administration
Patrol
SpecialOperations
CodeCompliance
FireDepartment

FireSuppression
ParksandRecreation
Facilities
CommunityCenter
Recreation StreetsDepartment Streets
PlanningDepartment
Planning Inspections
LibraryDepartment
Library
SolidWasteDepartment
SolidWaste
MaintenanceDepartment
Fleet
CITY
LIBR
General Fund Statement of Fund Balance
Notes:
1 Excludes Use of Prior Years' Fund Balance
2 An adjustment is made to unassigned fund balance, if necessary, during the conversion from a budget basis to an accrual basis (GAAP).
3 City policy requires a minimum fund balance of three months of budgeted expenditures.
Actual ActualBudgetEstimatedProjected Fiscal Year Ending September 30 2021 2022 2023 2023 2024 Budget Basis: Beginning Unassigned Fund Balance (GAAP)7,131,208 $ 5,454,084 $ 6,825,928 $ 6,825,928 $ 8,346,503 $ Revenues 1 16,426,336 18,746,985 21,287,420 22,263,195 22,987,820 Expenditures(18,103,460) (17,305,401) (20,784,020) (20,742,620) (23,156,300) Net Increase / (Decrease) in Fund Balance(1,677,124) 1,441,584 503,400 1,520,575 (168,480) Ending Unassigned Fund Balance (Budget) 5,454,084 $ 6,895,668 $ 7,329,328 $ 8,346,503 $ 8,178,023 $ Reconciliation to GAAP: Ending Unassigned Fund Balance (Budget) 5,454,084 $ 6,895,668 $ 7,329,328 $ 8,346,503 $ 8,178,023 $ Adjustment 2 (69,740) - -Unassigned Fund Balance (GAAP) 5,454,084 6,825,928 7,329,328 8,346,503 8,178,023 Assigned Fund Balance (GAAP) 872,000 872,000 872,000 872,000 872,000 Restricted Fund Balance (GAAP) - - - -Non-Spendable Fund Balance (GAAP) 4,899 6,407 6,407 6,407 6,407 Total Fund Balance (GAAP) 6,330,983 $ 7,704,335 $ 8,207,735 $ 9,224,910 $ 9,056,430 $ Minimum Unassigned Net Assets3 4,525,865 $ 4,326,350 $ 4,367,550 $ 4,367,550 $ 5,789,075 $ Unassigned Net Assets in Excess of Minimum 928,219 $ 2,499,578 $ 2,961,778 $ 3,978,953 $ 2,388,948 $
$‐$1,000,000 $2,000,000 $3,000,000 $4,000,000 $5,000,000 $6,000,000 $7,000,000 $8,000,000 $9,000,000 $10,000,000 2021 Actual2022 Actual2023 Budget2023 Estimated2024 Projected Fund Balance Fiscal Year Ending September 30 Fund Balance History Unassigned Fund Balance (GAAP) Assigned Fund Balance (GAAP) Restricted Fund Balance (GAAP) Non‐Spendable Fund Balance (GAAP) Page 58
General Fund Recap
FY 2021FY 2022FY 2023FY 2023FY 2024 ActualActualBudgetEstimatedBudget Revenues Property Taxes 6,395,900 $ 7,102,208 $ 7,977,140 $ 7,750,273 $ 8,560,760 $ Sales Tax 4,896,247 5,721,518 6,113,840 6,133,347 6,440,000 Franchise & Other Taxes 1,271,386 1,363,186 1,255,780 1,348,737 1,327,940 Permits & License Fees 347,416 566,144 474,840 463,623 514,770 Court Fines & Fees 269,873 287,737 276,290 331,142 306,330 Charges for Service 2,519,543 2,779,828 2,823,560 3,393,723 3,601,460 Miscellaneous Income 133,106 294,634 122,940 599,320 492,150 Other Financing Sources 592,865 631,730 2,243,030 2,243,030 1,744,410 Total Revenue 16,426,336 18,746,985 21,287,420 22,263,195 22,987,820 Expenditures City Council 59,759 168,342 248,030 227,443 319,250 Administration 610,838 732,650 1,112,810 1,105,661 1,220,890 Finance 385,668 406,791 615,520 592,400 647,840 Human Resources 222,233 270,258 348,020 310,920 371,070 Legal 222,449 218,052 230,730 216,638 263,740 Police 5,019,431 5,665,962 6,467,890 6,618,154 7,432,420 Fire 2,918,810 3,323,135 3,786,670 3,813,690 4,381,510 Streets 3,345,365 1,633,411 2,287,680 2,219,420 2,256,360 Parks & Recreation 1,740,953 1,388,522 1,910,710 1,753,777 2,006,160 Planning 480,715 558,959 933,930 943,287 1,077,530 Library 484,544 495,200 491,440 466,920 494,150 Other Costs 440,106 - - -Solid W aste 1,545,775 1,746,209 1,864,050 1,942,163 2,134,960 Maintenance 480,835 543,824 486,540 532,147 550,420 Engineering 145,979 154,086 - -Total Expenditures 18,103,460 17,305,401 20,784,020 20,742,620 23,156,300 Increase / (Decrease) in Fund Balance (40,958) $ 1,441,584 $ 503,400 $ 1,520,575 $ (168,480) $
Page 59
General Fund Revenue Trend
General Fund Revenue Trend
FY 2020FY 2021FY 2022FY 2023FY 2023FY 2024 ActualActualActual BudgetEstimatedBudget Revenues Property Taxes6,214,755 $ 6,395,900 $ 7,102,208 $ 7,977,140 $ 7,750,273 $ 8,560,760 $ Sales Tax 4,085,122 4,896,247 5,721,518 6,113,840 6,133,347 6,440,000 Franchise & Other Taxes 1,257,141 1,271,386 1,363,186 1,255,780 1,348,737 1,327,940 Permits & License Fees 234,209 347,416 566,144 474,840 463,623 514,770 Court Fines & Fees 281,753 269,873 287,737 276,290 331,142 306,330 Charges for Service 2,457,751 2,519,543 2,779,828 2,823,560 3,393,723 3,601,460 Miscellaneous Income 446,438 133,106 294,634 122,940 599,320 492,150 Other Financing Sources 1,524,780 592,865 631,730 2,243,030 2,243,030 1,744,410 Use of Accumulated Reserves - - - - - 168,480 Total Revenue 16,501,949 $ 16,426,336 $ 18,746,985 $ 21,287,420 $ 22,263,195 $ 23,156,300 $
$$5,000,000 $10,000,000 $15,000,000 $20,000,000 $25,000,000 2020 Actual2021 Actual2022 Actual2023 Budget2023 Estimate2024 Budget
Property Taxes Sales Tax Franchise & Other Taxes Permits & License Fees Court Fines & Fees Charges for Service Page 60
Distribution of General Fund Revenues


Property Taxes 8,560,760 $ 37.0% Sales Tax 6,440,000 27.8% Franchise & Other Taxes 1,327,940 5.7% Permits & License Fees 514,770 2.2% Court Fines & Fees 306,330 1.3% Charges for Service 3,601,460 15.6% Miscellaneous Income 492,150 2.1% Other Financing Sources 1,744,410 7.5% Use of Accumulated Reserves 168,480 0.7% Total 23,156,300 $ 100.0%
Property Taxes 37% Sales Tax 28% Franchise & Other Taxes 6% Permits & License Fees 2% Court Fines & Fees 1% Charges for Service 16% Miscellaneous Income 2% Other Financing Sources 7% Use of Accumulated Reserves 1%
Property Taxes Sales Tax Franchise & Other Taxes Permits & License Fees Court Fines & Fees Charges for Service Miscellaneous Income Other Financing Sources Use of Accumulated Reserves Page 61
Revenues
General Fund Revenues
The Tax Appraisal District of Bell County establishes the value of property for taxation purposes. Taxable values are set at 100% of the assessed market value after exemptions. Market value means the price at which property would sell between a willing buyer and a willing seller in the open market. The City sets a tax rate on the basis of cents per $100 of valuation. For FY 2024 (2023 Tax Year), the City proposes a total tax rate of $0.5326. The proposed City taxes levied for FY 2024 on property valued at $100,000 would be $532.60 ($100,000 ÷ 100 × $0.5326 = $532.60) as compared to $585.00 for FY 2023.
The tax rate is comprised of two components. The operations and maintenance (O & M) rate provides funds to operate and maintain the general government functions. The debt rate pays the debt obligations of the City as found in the General Debt Service Fund. A comparison of the tax rates for FY 2023 and FY 2024 is shown below.
The 2023 total assessed taxable value is $2,183,716,392 an increase of $351,213,180 from the 2022 adjusted taxable value of $1,832,503,212. The 2023 total tax levy is calculated by multiplying the taxable value by the tax rates.
The Belton Tax Increment Reinvestment Zone #1 (TIRZ) was established in 2004. A base tax value of the TIRZ was established based upon property values within the TIRZ boundaries at that time. Subsequent increases in property values are “captured” by TIRZ. Taxes collected on the captured value are retained by the Zone and dedicated to projects and improvements within it. The payment to the TIRZ represents the City’s taxes that are levied on the TIRZ values. The captured value within the TIRZ for FY 2024 is $378,080,395.
Property tax revenues are expected to grow steadily over the next three to five years. There is ample land for development within the City’s extra-territorial jurisdiction. Many new residential developments are underway. The average growth in taxable value over the last ten years has been approximately seven percent.
All taxable property in the City of Belton is subject to the assessment, levy and collection by the City of an annual ad valorem tax levied, within the limits prescribed by law, sufficient to provide for the payment of principal and interest on debt issued by the government. Article XII, Section 5, of the Texas Constitution is applicable to the City, and limits its maximum ad valorem tax rate to $2.50 per $100 of assessed valuation for all City purposes. The City operates under a Home-Rule Charter, which adopts the constitutional provisions. Administratively, the Attorney General of the State of Texas will only permit the allocation of $1.50 of the $2.50 maximum rate for all general obligation debt service, as calculated at the time of issuance. The City’s total tax rate of $0.5326 and debt rate of $0.0663 are well below the maximum rates allowed by law.
Property Taxes: FY 2023 Budget: $7,834,360 FY 2024 Budget: $8,419,680
FY 2023 (2022 Tax Year) FY 2024 (2023 Tax Year) $0.5080 O & M tax rate $0.4663 O & M tax rate 0.0770 Debt tax rate 0.0663 Debt tax rate $0.5850 Total tax rate $0.5326 Total tax rate
$10,182,670 Collected for O&M (General Fund) 1,447,810 Collected for debt service (Debt Service Fund) $11,630,480 Total amount of tax to be levied
$10,182,670 Collected for O&M $1,447,810 Collected for debt ( 1,762,990) Ad valorem to TIRZ ( 250,670) Ad valorem to TIRZ $ 8,419,680 Tax levy for General Fund $1,197,140 Tax levy for Debt Service Fund
Page 62
Budgeted Property Tax History
Fiscal Year Ending Operations O&M $ / $100Amount Debt Service $ / $100 AmountTotal Rate Budgeted Taxable Value Budgeted Total Levy 2015 0.54250 4,854,625 0.11730 1,049,673 0.65980 894,861,696 5,904,297 2016 0.53320 5,064,640 0.12660 1,202,519 0.65980 949,857,395 6,267,159 2017 0.53930 5,380,024 0.12050 1,202,101 0.65980 997,593,915 6,582,125 2018 0.55450 5,862,436 0.10530 1,113,281 0.65980 1,057,247,293 6,975,718 2019 0.56500 6,328,866 0.09480 1,061,905 0.65980 1,120,153,343 7,390,772 2020 0.57120 7,236,268 0.08860 1,122,432 0.65980 1,266,853,635 8,358,700 2021 0.52890 7,515,213 0.10110 1,431,908 0.63000 1,416,328,131 8,922,867 2022 0.54660 8,508,320 0.08340 1,298,200 0.63000 1,556,589,820 9,806,520 2023 0.50800 9,388,360 0.07700 1,423,040 0.58500 1,848,103,326 10,811,400 2024 Proposed 0.46630 10,182,670 0.06630 1,447,810 0.53260 2,183,716,392 11,630,480
$‐$0.10000 $0.20000 $0.30000 $0.40000 $0.50000 $0.60000 $0.70000 2015201620172018201920202021202220232024 Prop. Fiscal Year Ending Property Tax Rate History O&M Rate Debt Service Rate $‐$500,000,000 $1,000,000,000 $1,500,000,000 $2,000,000,000 $2,500,000,000 $0.40000 $0.45000 $0.50000 $0.55000 $0.60000 $0.65000 $0.70000 $0.75000 $0.80000 2015201620172018201920202021202220232024 Prop. Fiscal Year Ending Tax Rate vs. Taxable Value Tax Rate Budgeted Taxable Value Page 63
Sales Tax: FY 2023 Budget: $6,113,840
FY 2024 Budget: $6,440,000
The tax charged on all taxable sales within the city limits of Belton is 8.25%. That rate is comprised of four components: State, County, City, and the Belton Economic Development Corporation (BEDC). The State of Texas sales tax rate is 6.25%, while the County rate is 0.50%. The City of Belton general sales tax rate is 1.0%. In 1991, voters approved an additional 0.50% tax for the BEDC to fund economic development activities.
A major revenue source for the City, sales tax accounts for approximately 28% of General Fund revenues. This is due to the City’s prime location in fast-growing Central Texas, along Interstate Highway 35 and Interstate Highway 14. Belton is the county seat of Bell County and home to the University of Mary Hardin-Baylor
Sales tax revenues are projected using a multi-year trend analysis. Sales tax revenues have steadily increased from 2014 to 2020 with an average growth rate of five percent. Tax revenues expanded at the remarkable rate of twenty percent in FY 2021 and seventeen percent in FY 2022. This demonstrates the resiliency of the Belton economy and its strong mix of industry, retail, and essential services. The FY 2023 projections show a slower growth at 7%. The FY 2024 Annual Budget projects a conservative sales tax growth rate of five percent, which is closer to the long-term trend.
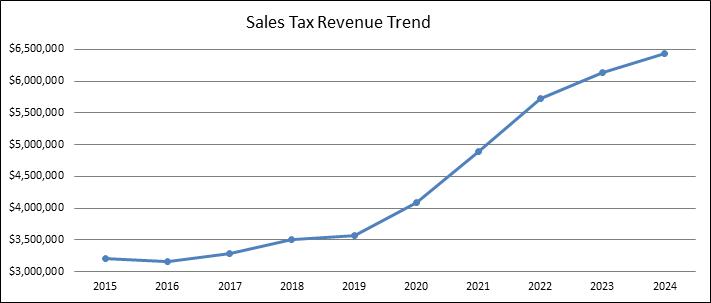
Fiscal Year Ending Sales Tax Revenue $ Change From Prior % Change From Prior 2015 3,205,411 136,097 4% 2016 3,155,659 (49,752) (2%) 2017 3,276,982 71,571 4% 2018 3,510,105 233,123 7% 2019 3,573,712 63,607 2% 2020 4,085,122 511,410 14% 2021 4,896,247 811,125 20% 2022 5,721,518 825,271 17% 2023 Estimated 6,133,347 411,829 7% 2024 Budget 6,440,000 306,653 5% Page 64
TheCityofBeltonmaintainsnon‐exclusivefranchiseagreementswithutilityproviders(electric,gas,phone andcable),whichusetheCity'sright‐of‐waystoprovidetheirservices.TheutilitiescompensatetheCityfor thisprivilegedusethroughfranchisetaxespassedontotheusers.Theirfeesaregenerallybasedupona percentageoftheirgrossreceiptsgeneratedbycustomerswithintheCitylimits.Mixedbeveragetax receiptsarealsorecordedinthiscategory.
Franchise & Local Taxes
Permitfeesarefeeschargedforplanreviewstoensurecompliancewithbuildingcodesandtheactual inspectiontoverifycompliance.Permitfeerevenueshaveremainedatanelevatedlevelsince2016dueto thestrongconstructionmarketinCentralTexas,especiallyforresidentialproperties.Revenuesdipped slightlyinFY2020duetothecoronaviruspandemic.FY2022revenuesincreasetwotimesoverpre‐pandemiclevels.OurFY2024budgetisconservativebasedonmultiyeartrendsandprojectedgrowthin Belton.
Permit & License Fees
$1,000,000 $1,100,000 $1,200,000 $1,300,000 $1,400,000 $1,500,000 2020 Actual2021 Actual2022 Actual2023 Budget2023 Estimate2024 Budget Fiscal Year Ending September 30
$200,000 $300,000 $400,000 $500,000 $600,000 2020 Actual2021 Actual2022 Actual2023 Budget2023 Estimate2024 Budget Fiscal Year Ending September 30
Franchise & Other Taxes: FY 2023 Budget: $1,255,780FY 2024Budget: $1,327,940
Permit & License Fees: FY 2023 Budget: $474,840FY 2024 Budget: $514,770
Page 65
Municipalcourtfinesandfeesareleviedprimarilyforviolationsoflocalordinancesandtrafficoffenses.The Statealsoleviesfeesonmunicipalfines,whicharecollectedbytheCityandremittedtotheState.TheCityis allowedtoretain10%ofStatefeesasanadministrativefeeforcollectingandprocessingthefees.
The main revenue in this category is the charge assessed for refuse collection fees. This charge is passed through to the franchisee as a General Fund expenditure. The City's contract with the refuse collector provides that the City retains 12% of billings as a collection fee. Other revenues that fall into this category include charges for recreation programs, sale of effluent water, and reimbursement for public safety services provided to the local school district.
Charges for Service
$0 $100,000 $200,000 $300,000 $400,000 2020 Actual2021 Actual2022 Actual2023 Budget2023 Estimated2024 Budget Fiscal Year Ending September 30 Court Fines & Fees $2,300,000 $2,800,000 $3,300,000 $3,800,000 2020 Actual2021 Actual2022 Actual2023 Budget2023 Estimated2024 Budget Fiscal Year Ending September 30
Court Fines & Fees: FY 2023 Budget: $276,290 FY 2024 Budget: $306,330
Chargesfor Service: FY 2023 Budget: $2,823,560 FY 2024 Budget: $3,601,460
Page 66
Miscellaneous Income: FY 2023 Budget: $122,940
FY 2024 Budget: $492,150
Miscellaneous income includes revenues that could not be classified elsewhere. The principal revenue in this categoryis the interest that the City earns on its investments. FY 2022 included sale of city property for land that was auctioned. Interest rates increased significantly in FY 2023. We anticipate this trend to slightly decline in FY 2024.
Miscellaneous Income
Other Financing Sources: FY 2023 Budget: $2,243,030FY 2024 Budget: $1,744,410
ThelargestrevenueinthiscategoryisthepayrollreimbursementtransfersfromWater/SewerFund, Drainage,Hotel/Motel,andTIRZ.TheotherlargetransferisfromARPAfundsforcompensationstudy implementationcosts.ThereisaalsoatransfertotheGeneralFundbytheWater&SewerFundasa franchisetransferof5%ofwaterandsewersales.TheWater&SewerFundalsoreimbursestheGeneral Fundforone‐thirdoftheFleetMaintenanceDivisionbudget.FY2020includesatransfertocloseoutthe CivilServiceFund.ThesefundsarenowrestrictedintheGeneralFundforthepurposeofPublicSafety.
Transfers and Other Financing Sources
$0 $500,000
2020 Actual2021 Actual2022 Actual2023 Budget2023 Estimate2024 Budget Fiscal Year
September
$1,000,000 $1,500,000 $2,000,000 $2,500,000
Ending
30
$0 $200,000 $400,000 $600,000 $800,000 2020 Actual2021 Actual2022 Actual2023 Budget2023 Estimate2024 Budget Fiscal Year Ending September 30
Page 67
General Fund (101-3) Revenues
Account FY 2021FY 2022FY 2023FY 2023FY 2024 Number Account Name ActualActualBudgetEstimatedBudget Property Taxes 1010Current Ad Valorem Taxes 7,420,944 $ 8,319,183 $ 9,388,360 $ 9,175,042 $ 10,182,670 $ 1030Delinquent Ad Valorem Taxes 81,249 56,136 63,550 29,305 55,560 1040Penalty & Interest 76,565 74,349 68,200 71,006 73,970 1050Payment in Lieu of Taxes 10,851 11,900 11,030 11,887 11,550 1060 Ad Valorem to TIRZ (1,193,709) (1,359,360) (1,554,000) (1,536,967) (1,762,990) Total 6,395,900 7,102,208 7,977,140 7,750,273 8,560,760 Franchise & Other Taxes 1210Sales Tax 4,896,247 5,721,518 6,113,840 6,133,347 6,440,000 1310Electric Franchise Tax 770,637 837,547 782,660 826,170 811,450 1320Telecom Line Access Fees34,520 32,139 18,930 24,389 25,430 1330Cable Franchise Tax 177,995 180,140 176,610 170,664 175,400 1340Gas Franchise Tax 95,829 92,920 101,370 132,141 112,530 1350Garbage Franchise Tax 130,963 147,610 129,190 116,579 132,100 1360 Ambulance Franchise Tax 434 292 260 160 300 1410 Alcoholic Beverage Tax 61,008 72,538 46,760 78,634 70,730 Total6,167,633 7,084,704 7,369,620 7,482,084 7,767,940 Permits & License Fees 3010Building Permits197,132 242,437 252,390 230,193 236,320 3020Electrical Permits41,337 102,795 72,690 60,185 81,490 3030Plumbing Permits63,268 127,666 83,490 73,973 100,820 3040Mechanical, Heat & A/C Permits18,491 34,821 29,450 49,572 42,200 3045Swimming Pool Permits2,500 3,190 2,400 2,600 2,760 3055Short Term Rental Permits- - - 500 500 3060Rezoning Fees 4,600 9,400 6,350 9,600 7,870 3070Subdivision Fees 6,033 15,754 11,070 12,900 11,560 3075Commercial Site Plan Review Fees - - - 2,300 2,300 3080Technology Fees 7,650 8,190 7,440 2,500 6,110 3130Beer and Wine Licenses 700 9,585 5304,200 9,590 3140Garage Sale Permits 1,855 1,840 1,780 1,600 1,770 3150Fire Marshal Inspection Fees 3,600 8,722 5,380 11,700 10,210 3155Haz-Mat Response Fee 250 94 120 100 150 3160Tow Permit Fee - 1,650 1,750 1,700 1,120 Total 347,416 566,144 474,840 463,623 514,770 Court Fines & Fees 4010Municipal Court Fines 187,749 204,723 195,080 231,219 217,970 4020Parking Fines 605 1,938 1,760 2,250 1,600 4030Court Administrative Fees 45,902 40,258 40,360 49,896 45,350 4033Local Municipal Jury Fee 162 219 180 210 200 4040Local Time Payment Fees 1,110 5841,690 800 830 4045Time Payment Reimbursement Fee 2,578 5,019 3,040 4,800 4,130 4050Local FTA Fees 1,191 1,100 1,130 1,720 1,340 4060Defensive Driving Fees 2,260 2,840 3,140 2,400 2,500 4070Warrant and Arrest Fees 26,952 30,555 28,500 36,427 31,310 4080Child Safety Fees 1,125 3521,030 1,300 930 4095Judicial Fee-City 239 149 380 120 170 Total 269,873 287,737 276,290 331,142 306,330
Page 68
Account FY 2021FY 2022FY 2023FY 2023FY 2024 Number Account Name ActualActualBudgetEstimatedBudget General Fund (101-3) Revenues Charges for Service 4110Library Services- 9,231 8,600 5,500 7,370 5010Refuse Collection Fees 1,463,457 1,596,3151,723,900 1,845,494 2,063,500 5020Refuse Contract Fees 156,496 186,832 206,180 226,792 257,190 5050Brush Collection Fees 210,589 222,181 226,310 235,850 249,850 5150 Ambulance Revenues 39,485 8,405 24,990 4,000 6,200 5160Fire Dept Cost Recovery Fees - - - 60,000 60,000 5210Rental Income 21,100 21,270 21,070 19,200 20,520 5300Park Permits 9,775 11,642 9,000 12,000 11,140 5301Harris Community Center Rental 56,547 92,187 54,850 69,004 72,580 5310Recreation Revenue 25,458 29,913 21,730 29,000 28,120 5313Harris Center Event Revenue 2,500 2,843 3,040 3,200 2,850 5400Code Enforcement Revenue 18,560 12,270 17,580 12,000 14,280 5800PPFC/TDFA Finance Fees 10,000 10,000 10,000 -6020Public Safety Reimbursements 302,270 334,710 279,200 553,280 553,280 6130Sale of Effluent Water 203,306 242,029 217,110 318,403 254,580 Total 2,519,543 2,779,828 2,823,560 3,393,723 3,601,460 Miscellaneous Income 6040Bell County Child Safety Fund 21,930 25,720 23,560 25,960 25,840 6060State LEOSE Funding 2,764 - 2,510 -6100Sale of City Property 5,259 46,969 - 8906170Insurance Proceeds 37,102 41,109 - 18,3606700Miscellaneous Income 29,621 74,950 47,850 44,000 49,520 6720 Cash Over / (Under) (19) (145) - -6730Copies 975 805 1,220 810 860 6780Credit Card Fees 10,068 7,925 6,960 3,300 7,100 7000Grant Receipts 14,172 34,302 32,340 26,000 24,830 9100Interest Income 11,234 62,999 8,500 480,000 384,000 Total 133,106 294,634 122,940 599,320 492,150 Other Financing Sources 8002Interfund Transfer - Reimbursement164,075 172,520 176,060 176,060 174,420 8114Transfer from Hotel/Motel Tax Fund - - 35,410 35,410 54,950 8123Transfer from TIRZ Fund 30,206 32,530 35,410 35,410 24,950 8125Transfer from Court Security 4,530 - - - 9,820 8161Transfer from ARPA Fund - - 900,000 900,000 262,880 8202Transfer from Water Sewer Fund 394,054 426,680 1,049,500 1,049,500 1,169,810 8707Transfer from Drainage Fund - - 46,650 46,650 47,580 9999Use of Accumulated Reserves - - - - 168,480 Total 592,865 631,730 2,243,030 2,243,030 1,912,890 General Fund 16,426,336 $ 18,746,985 $ 21,287,420 $ 22,263,195 $ 23,156,300 $ Page 69
General Fund Department Summary
FY 2024 Expenditures by Department
FY 2021FY 2022FY 2023FY 2023FY 2024 ActalActualBudgetEstimatedBudget General Fund 1 City Council59,759 $ 168,342 $ 248,030 $ 227,443 $ 319,250 $ Administration610,838 732,650 1,112,810 1,105,661 1,220,890 Finance385,668 406,791 615,520 592,400 647,840 Human Resources222,233 270,258 348,020 310,920 371,070 2 Municipal Court 222,449 218,052 230,730 216,638 263,740 Police 5,019,431 5,665,962 6,467,890 6,618,154 7,432,420 Fire 2,918,810 3,323,135 3,786,670 3,813,690 4,381,510 Streets 3,345,365 1,633,411 2,287,680 2,219,420 2,256,360 Parks & Recreation 1,740,953 1,388,522 1,910,710 1,753,777 2,006,160 Planning 480,715 558,959 933,930 943,287 1,077,530 Library 484,544 495,200 491,440 466,920 494,150 Other Costs 440,106 - - -Solid Waste 1,545,775 1,746,209 1,864,050 1,942,163 2,134,960 Maintenance 480,835 543,824 486,540 532,147 550,420 3 Engineering 145,979 154,086 - -General Fund 18,103,460 $ 17,305,401 $ 20,784,020 $ 20,742,620 $ 23,156,300 $ 53680 5343
City Council 1% Administration 5% Finance 3% Human Resources 2% Municipal Court 1% Police 32% Fire 19% Streets 10% Parks & Recreation 9% Planning 5% Library 2% Solid Waste 9% Maintenance 2%
City Council Administration Finance Human Resources Municipal Court Police Fire Streets Parks & Recreation Planning Library Solid Waste Maintenance Page 70
General Fund Expenditures by Department / Division
Department FY 2021FY 2022FY 2023FY 2023FY 2024 Division ActualActualBudgetEstimatedBudget City Council City Council 59,759 $ 168,342 $ 248,030 $ 227,443 $ 319,250 $ Total 59,759 168,342 248,030 227,443 319,250 Administration City Manager's Office 511,520 625,548 898,460 886,783 992,910 Public Information 60,932 62,538 130,850 130,150 133,340 3 Retail Development 38,386 44,564 83,500 88,728 94,640 Total 610,838 732,650 1,112,810 1,105,661 1,220,890 Finance Finance 385,668 406,791 615,520 592,400 647,840 Total 385,668 406,791 615,520 592,400 647,840 Human Resources 6 Human Resources 222,233 270,258 348,020 310,920 371,070 Total 222,233 270,258 348,020 310,920 371,070 Municipal Court 20 Municipal Court 222,449 218,052 230,730 216,638 263,740 Total 222,449 218,052 230,730 216,638 263,740 Police 13 Administration 668,509 368,469 547,170 597,498 677,200 14 Patrol 3,123,644 3,380,531 3,719,600 3,667,850 4,180,120 15 Special Operations 1,054,714 1,736,126 2,008,540 2,167,175 2,371,680 Code Compliance 172,564 180,836 192,580 185,631 203,420 Total 5,019,431 5,665,962 6,467,890 6,618,154 7,432,420 Fire 17 Suppression 2,918,810 3,323,135 3,786,670 3,813,690 4,381,510 Total 2,918,810 3,323,135 3,786,670 3,813,690 4,381,510 Streets 6 Streets 3,345,365 1,633,411 2,287,680 2,219,420 2,256,360 Total 3,345,365 1,633,411 2,287,680 2,219,420 2,256,360 Parks & Recreation 7 Facilities 1,337,319 1,070,000 1,346,680 1,248,720 1,538,030 8 Community Center 220,261 175,411 345,070 327,742 242,820 9 Recreation 183,373 143,111 218,960 177,315 225,310 Total 1,740,953 1,388,522 1,910,710 1,753,777 2,006,160 Planning 10 Planning 175,434 232,250 521,490 557,320 658,320 11 Inspections 305,281 326,709 412,440 385,967 419,210 Total 480,715 558,959 933,930 943,287 1,077,530 Library Library 484,544 495,200 491,440 466,920 494,150 Total 484,544 495,200 491,440 466,920 494,150 Other Costs 6 Other Costs 440,106 - - -Total 440,106 - - -Solid Waste 9 Solid W aste 1,545,775 1,746,209 1,864,050 1,942,163 2,134,960 Total 1,545,775 1,746,209 1,864,050 1,942,163 2,134,960
Page 71
Department FY 2021FY 2022FY 2023FY 2023FY 2024 Division ActualActualBudgetEstimatedBudget General Fund Expenditures by Department / Division Maintenance 7 Fleet Maintenance 480,835 543,824 486,540 532,147 550,420 Total 480,835 543,824 486,540 532,147 550,420 Engineering 19 Engineering 145,979 154,086 - -Total 145,979 154,086 - -General Fund 18,103,460 $ 17,305,401 $ 20,784,020 $ 20,742,620 $ 23,156,300 $ Page 72
General Fund Category Summary
FY 2024 Expenditures by Category
FY 2021FY 2022FY 2023FY 2023FY 2024 Description ActalActualBudgetEstimatedBudget Personnel 9,148,896 $ 10,333,212 $ 12,114,400 $ 12,116,255 $ 13,632,710 $ Supplies 482,749 615,948 633,310 636,168 721,180 Maintenance 1,041,929 483,731 1,400,140 1,444,228 1,499,090 Services 3,848,416 4,240,288 4,894,990 4,826,604 5,411,900 Other Expenses 440,106 154,736 209,620 212,000 282,740 Capital Outlay 23,027 57,105 145,000 140,805 45,000 Transfers 3,118,337 1,420,381 1,386,560 1,366,560 1,563,680 General Fund 18,103,460 $ 17,305,401 $ 20,784,020 $ 20,742,620 $ 23,156,300 $
Personnel 59% Supplies 3% Maintenance 7% Services 23% Other Expenses 1% Capital Outlay 0% Transfers 7%
Personnel Supplies Maintenance Services Other Expenses Capital Outlay Transfers Page 73
Account FY 2021FY 2022FY 2023FY 2023FY 2024 NumberAccount Name ActualActualBudgetEstimatedBudget Personnel 1010 Administrative Salaries 6,905,120 $ 7,795,030 $ 9,124,380 $ 9,146,537 $ 10,168,510 $ 1070Overtime Pay158,420 167,704 141,350 207,880 215,250 1210TMRS715,268 825,761 962,570 976,510 1,125,880 1220FICA 523,994 589,697 695,660 693,370 777,440 1230Employee Insurance696,190 809,462 1,001,670 868,760 1,029,490 1240Worker's Comp Insurance86,070 118,648 144,390 193,318 225,310 1250Unemployment Compensation 37,699 2,695 18,640 3,890 13,660 1260Deferred Compensation 26,135 24,215 25,740 25,990 27,170 1600Pay Plan Costs - - - - 50,000 Total 9,148,896 10,333,212 12,114,400 12,116,255 13,632,710 Supplies 2010Office Supplies 23,939 27,094 28,090 27,885 30,670 2030Chemical Supplies 19,411 17,201 19,900 21,200 25,320 2050Educational Supplies 11,586 18,345 16,350 15,120 16,400 2070Janitorial Supplies 11,299 15,162 16,500 16,850 20,700 2090Tools and Other Supplies 58,719 84,160 73,170 78,357 82,530 2100Recreational Programming 2,724 1,683 7,150 1,800 5,000 2120Promotional Materials and Prizes 1,753 1,485 3,800 1,800 3,300 2220Fuel 145,446 222,783 178,060 181,960 190,010 2310EMS Supplies 1,660 6,490 19,650 19,000 18,350 2400Clothing 78,250 70,262 87,900 90,070 111,840 2500Small Equipment 63,566 88,347 106,430 109,221 143,750 2600Postage 15,114 16,659 18,810 19,605 18,810 2700Print Materials 34,040 29,765 36,000 36,000 36,000 2720Materials in Electronic Format 10,283 10,045 15,500 11,000 12,500 2740 Other Materials (Audiovisual) 4,959 6,467 6,000 6,300 6,000 Total 482,749 615,948 633,310 636,168 721,180 Maintenance 3010Building 7,129 11,091 29,000 27,908 64,000 3110Fire Hydrant 1,322 449 1,300 650 1,600 3330Street 727,308 85,740 1,054,730 1,050,000 1,054,730 3340Sign 22,068 18,771 17,000 18,500 17,000 3360Sidewalk 25,127 3,546 20,000 16,600 20,000 3420Splash Pad 18,547 16,237 14,680 15,400 20,380 3430Park 52,641 59,314 53,600 52,000 78,500 3450Landscape 5,035 5,621 5,900 5,200 20,000 4020Machinery and Equipment 54,770 49,913 78,770 76,770 61,720 4030Vehicle 127,982 233,049 125,160 181,200 161,160 Total 1,041,929 483,731 1,400,140 1,444,228 1,499,090 General Fund Line Item Expense Detail Page 74
Account FY 2021FY 2022FY 2023FY 2023FY 2024 NumberAccount Name ActualActualBudgetEstimatedBudget General Fund Line Item Expense Detail Services 5000Public Notices7,222 9,320 8,910 11,650 9,850 5010Marketing9,692 10,600 14,950 12,265 18,200 5030Employment Opportunities5,444 856 14,600 3,000 24,910 5100Dues and Publications 32,055 39,799 41,320 42,620 41,120 5110License & Certification 3,824 5,354 6,280 5,640 8,120 5130Travel & Training 73,545 117,181 174,550 155,430 209,400 5140Travel & Training with Agreement 6,104 - - -5150Travel & Training LEOSE 2,393 - - -5170Employee Recognition/Wellness 4,122 5,685 14,100 14,000 43,320 5180Employee Relations 21,808 19,823 23,000 22,500 22,650 5190Employee Testing 14,811 15,790 6,420 7,5005210Equipment Lease 526 - - -5220Equipment Rental 3,736 3,907 3,900 4,500 3,900 5300Events 18,671 18,766 25,800 20,000 28,000 5310RUOK - 779 1,000 1,025 1,000 5340Building Maintenance Services 374,265 391,200409,200 409,200 449,920 5341Info Tech Services 640,539 694,310847,250 847,240 816,560 5400 Bell County Tax Appraisal Collection93,362 97,576 104,420 88,000 106,190 5410Bell County Jail 8,260 10,570 21,000 19,000 21,000 5420Bell County Communications 328,472 329,941 353,220 313,220 398,270 5440Bell County Animal Shelter 40,000 40,000 40,000 40,000 40,000 5500General Liability 149,184 156,255 166,120 171,384 199,890 5600 Audit 21,723 23,763 22,440 22,440 22,980 5610Legal 13,502 3,826 110,300 92,700 121,650 5620Engineering 27,049 54,891 50,000 40,000 45,000 5630Consulting 33,606 64,039 76,550 75,320 54,440 5690Other Professional Services 12,135 10,017 28,000 25,000 28,000 5700Special Services 13,936 44,300 58,800 94,450 65,800 5710Demolition and Cleanup 4,532 17,998 37,200 4,800 23,600 5731Payment Processing Fees 17,088 26,154 28,500 20,000 31,500 5740Contract Mowing 60,716 49,621 58,200 46,000 142,200 5750Election Expenses 5,115 - 9,500 - 9,500 5790Document Preparation 2,813 3,408 2,9002,000 2,980 5820Gas Service 14,574 19,023 15,550 19,440 22,380 5830Electric Service 367,219 395,656 388,810 387,180 409,570 5920Refuse Collection Contract 1,407,515 1,556,935 1,722,200 1,800,000 1,980,000 5940Tipping/Hauling Fees 8,858 2,945 10,000 9,100 10,000 Total 3,848,416 4,240,288 4,894,990 4,826,604 5,411,900 Other Expenses 7600Contributions 170,451 111,889 109,620 112,000 182,740 7700 Contingency 269,655 42,847 100,000 100,000 100,000 Total 440,106 154,736 209,620 212,000 282,740 Capital Outlay 8000 Land 3,632 57,105 - -8200Machinery and Equipment 13,600 - 145,000 140,8058300Vehicles - - - - 45,000 8400Computer Equipment 5,795 - - -Total 23,027 57,105 145,000 140,805 45,000 Page 75
Account FY 2021FY 2022FY 2023FY 2023FY 2024 NumberAccount Name ActualActualBudgetEstimatedBudget General Fund Line Item Expense Detail Transfers 9103Transfer to General Capital Projects2,061,500 650,000 90,000 80,000 85,000 9104Transfer to General Capital Equip397,714 - - -9115Transfer to Debt Service Fund - 30,000 - -9129Transfer to TDHCA Housing Rehab.- - - 30,000 92,250 9160Transfer to Grant Fund 613 7,291 40,000 -9170Transfer to FD Capital Replacement151,215 183,340 310,930 310,930 418,980 9175Transfer to PD Vehicle Replacement234,282 240,960 326,110 326,110 391,710 9176Transfer to Parks & PW Capital273,013 308,790 423,280 423,280 374,370 9202Transfer to Water and Sewer Fund - - 196,240 196,240 201,370 Total3,118,337 1,420,381 1,386,560 1,366,560 1,563,680 General Fund Expenditures18,103,460 $ 17,305,401 $ 20,784,020 $ 20,742,620 $ 23,156,300 $ Page 76
Page 77
General Fund Long-Term Forecast
FY 2024FY 2025FY 2026FY 2027FY 2028 Beginning Fund Balance $ 8,346,503 $ 8,420,203 $ 8,407,882 $ 8,257,276 $ 7,961,274 Ad Valorem Taxes8,560,840 9,074,490 9,618,960 10,196,097 10,807,863 Sales Tax6,440,000 6,697,600 6,965,504 7,244,124 7,533,889 Franchise & Other Taxes 1,327,940 1,354,499 1,381,589 1,409,221 1,437,405 Permits & License Fees 514,770 540,509 567,534 595,911 625,706 Court Fines and Fees 306,330 327,773 350,717 375,267 401,536 Charges for Services 3,601,460 3,961,606 4,357,767 4,793,543 5,272,898 Miscellaneous and Other Revenues2,236,560 2,303,657 2,372,767 2,443,949 2,517,268 Total Revenue22,987,900 24,260,134 25,614,837 27,058,113 28,596,565 Personnel13,507,300 14,317,738 15,176,802 16,087,410 17,052,655 Supplies 721,180 750,027 780,028 811,229 843,679 Maintenance1,499,090 1,559,054 1,621,416 1,686,272 1,753,723 Services 5,397,960 5,829,797 6,296,181 6,799,875 7,343,865 Other Expenses 242,240 254,352 267,070 280,423 294,444 Capital Outlay 45,000 - - -Transfers 1,501,430 1,561,487 1,623,947 1,688,905 1,756,461 Total Expenditures22,914,200 24,272,455 25,765,443 27,354,115 29,044,827 Revenue Over/(Under) Expenditures 73,700 (12,321) (150,606) (296,002) (448,262) Ending Fund Balance $ 8,420,203 $ 8,407,882 $ 8,257,276 $ 7,961,274 $ 7,513,012 Less: 3-Month Minimum Balance5,728,550 $ 6,068,114 $ 6,441,361 $ 6,838,529 $ 7,261,207 $ Forecasted Fund Balance in Excess of Minimum $ 2,691,653 $ 2,339,768 $ 1,815,915 $ 1,122,745 $ 251,805
$5,500,000 $6,000,000 $6,500,000 $7,000,000 $7,500,000 $8,000,000 $8,500,000 $9,000,000 FY 2024FY 2025FY 2026FY 2027FY 2028 Forecasted Ending Fund Balance Minimum Fund Balance Ending Fund Balance Page 78
General Fund Long-Term Forecast Assumptions
Revenue Forecast
Advaloremtaxesareconservativelyforecastwitha6%increaseinrevenues.Propertyvalues haveincreasedatanaveragerateof8%.TheCityhastriedtoreducetheimpacttopropertyowners bydecreasingthetaxrateby7%inFY2023andFY2024.AccordingtotheTexasA&Mresearch center,itisexpectedthathomevalueswilldecreasewiththeincreasedinterestratesforhomebuyers. TheCityisprojectingthefutureimpactwithallofthedatawehaveacquired.
Salestaxisvolatileandchangesdrasticallywithinflationandcompensation.TheStateofTexas Comptroller'sOfficepredictsadeclineintheconsumerconfidenceindexandsteadilyincreasing inflation.Inlightofthecomptroller'sanalysis,salestaxgrowthislimitedto4%peryearforthenext fiveyears.
Franchiseandothertaxesareprojectedusinga2%growthratebasedonthepastthree-year average.Telecomandcablefranchisefeeshavehadasteadydeclinesincelegislationwaspassed allowingcompaniestopayonlyonetaxfortwoservices.Theelectricfranchisetaxhasincreasedas electricratesareincreasingwithinflation.
Permitsandlicensefeesareprimarilycomprisedofbuildingpermits.Permittinghashaddrastic changesoverthepastfewyearsasexhibitedbythe63%increasein2022andthe18%decreasein 2023.Duetothevolatilityinthemarket,weareforecastingaslightincreaseof5%forpermitand licenserevenuesoverthenextfiveyears.
Courtfinesandfeesaretrendingwithconsistentincreases;therefore,weareforecastinga7% increase.Beltonislocatedalongtwointerstatehighways,IH-35andIH-14,whichbringtraffictothe area.Beltonisalsoagrowingcity.Populationdensitytypicallyresultsinagreaternumberof citations.
Chargesforservicesrevenuearederivedmainlyfromwasteservice,publicsafety reimbursements,andcommunitycenterrentals.ThepopulationgrowthinBeltonhasincreasedthe demandforwasteservices.Theadditionofaschoolresourceofficerhasincreasedpublicsafety reimbursements.Weprojectthesetrendstocontinue,forecastinga10%annualincrease.
Miscellaneousrevenueismostlydueininterestincome.TheFederalReservehasincreased interestratestocombatinflation,causingalargeincreasetointerestincome.InFY2023,interest incomejumped662%overthepreviousyear.TheCityisforecastinga2%increaseinmiscellaneous revenueinfutureyears.
Ad Valorem Taxes 6% 6% Sales Tax 4% 4% Franchise & Other Taxes 2% 4% Permits & License Fees 5% Services 8% Court Fines and Fees 7% Other Expenses 5% Charges for Services 10% Capital Outlay Per CIP Miscellaneous & Other Rev. 3% 4% Revenue Assumptions Personnel Supplies Transfers Expenditure Assumptions Maintenance
Page 79
General Fund Long-Term Forecast Assumptions
Expenditure Forecast
PersonnelcostsgrowconsiderablyinFY2024withtheadditionofelevenfull-time-equivalent positions:fiveinthePoliceDepartment,fourintheFireDepartment,oneinParksandRecreation,and oneinthePlanningDepartment.Forfutureyears,a6%increaseinpersonnelcostsshouldcover annualpayincreases,retirementplancontributions,andinsurancepremiums.
Expendituresforsuppliesmayincrease4%peryearduetoinflation.Thelargestincreases relatetosmallequipmentandfuel.AccordingtotheStateComptroller'sOffice,inflationmarkers continuetorise.
Maintenanceexpendituresareprojectedtoincreaseby4%.Thelargestincreasesin maintenancerelatetobuildingmaintenanceandparkmaintenance.Theseitemsarelargelyaffected byinflation,andtheinflationmarkersremainhighforthefutureforecast.
Expendituresforservicesareexpectedtoincreaseannuallyby8%.Someofthelargeitems arerefusecollectionscosts,BellCountyCommunications,andcontractmowing.Refusecollections costsarerisingduetopopulationgrowth.BellCountyCommunicationhasincreaseditscostfor dispatchservices.TheCityCouncilhaspromotedbeautificationeffortswithintheCityofBelton,and withthat,mowingcostswillincrease.
Otherexpensesaccountforcontigenciesandcontributionstolocalnon-profitservicessuchas HillCountryTransit,BeltonSeniorCenter,andtheBISDCrossingGuardProgram.TheCityforecasts a5%increasetoassisttheseorganizationsthatbenefittheCityofBeltonresidents.
TransfersintheGeneralFundareusedprimarilytosetasidefundingforfuturevehicleand equipmentreplacement.Thesefundsaredirectlyaffectedbyinflation,andweforecasttheincreaseto be4%peryear.
Future Budgets and Strategic Goals
During the strategic planning workshops, the need for an additional thirty-six positions was identified. Only eleven positions could be added in FY 2024. Therefore, the pent up demand for employees, especially in the area of public safety, will continue into future years. The 6% increase in annual personnel costs covers only existing employees; it does not include additional staffing.
Another strategic goal is to address aging City facilities. A facility study identified the age and condition of all city-owned buildings. The study also noted the available space within each for additional employees. It was determined that a centralized location for all city services would be desired. Bonds will likely be issued for this large expenditure. Debt service payments related to that issuance have not yet been included in the long-term forecast.
As shown in the long-range operating financial plan, fund balance will likely decline over time. It falls below the minimum amount allowed by policy in FY 2028 without adding the personnel or facility expenditures that are part of the Strategic Plan. The ability to fulfill those goals may be incumbent upon increasing tax revenue.
Page 80
Page 81
City Council
DIVISION MISSION AND DESCRIPTION
The Mayor and six councilmembers act as one body, representing the citizens of Belton, to formulate public policy and to ensure the orderly development of the City Citizens elect each Council member at large in non-geographic places for three-year terms The City Council appoints the City Manager, City Clerk, City Attorney, and Municipal Judge; adopts the annual budget, ad valorem tax rate, and various fees; and develops the Strategic Plan that identifies long-term challenges and opportunities for the City. The Council also appoints representation to standing boards and ad hoc committees as needed.
DIVISION GOALS AND ACTION ITEMS FOR FY 2024
Strategic Plan priorities addressed below: Governance, Public Safety, Quality of Life, Economic Development, Connectivity, Parks/Natural Beauty, Service Delivery
Goal: Plan proactively for the City’s future while retaining community character
Action Item: Conduct the annual update of the Strategic Plan
Goal: Balance revenues and expenditures while meeting community needs
Action Item: Adopt a balanced budget that implements the recent compensation study, CIP and equipment replacement funding
Goal: Reinforce customer service and citizen engagement
Action Item: Enhance the customer service code to emphasize service to citizens
SIGNIFICANT CHANGES IN THE FY 2024 BUDGET
Appropriations for public notices increase due to higher publication costs and more frequent notice requirements
Legal service expenditures decline due to an expected reduction in litigation costs
Contributions to other agencies increase due to higher operating costs of the organizations
FY 2022FY 2023FY 2023FY 2024 WORKLOAD MEASURES ACTUAL BUDGET ESTIMATE BUDGET Number of regular City Council meetings 23 23 23 23 Number of special City Council meetings 2 3 3 3 Number of Council work sessions 2 2 3 4 Page 82
General Fund - City Council (101-4-010)
Account FY 2021FY 2022FY 2023FY 2023FY 2024 Number Account Name ActualActualBudgetEstimatedBudget Personnel 1010Salaries and Wages 7 $ 7 $ 10 $ 7 $ 10 $ 1240 Workers' Comp. Insurance 5 93 20 246 330 Total 12 100 30 253 340 Supplies 2010 Office Supplies 305 611 530 700 1,130 2090Tools and Other Supplies 679 8,043 600 4502400Clothing 268 - 300 140 300 Total 1,252 8,654 1,430 1,290 1,430 Services 5000Public Notices 5,392 7,339 5,550 8,400 7,500 5100Dues and Publications 7,755 10,309 9,950 10,500 10,840 5130Travel and Training 3,056 5,490 19,350 20,000 18,150 5180Employee Relations 21,808 19,823 23,000 22,500 22,650 5300Events 840 2,285 3,000 1,000 4,000 5610Legal Services 8,527 - 59,500 49,500 57,000 5690Other Professional Services - 1,148 - -5700Special Services 6,002 1,3057,100 2,000 5,100 5750Election Expenses 5,115 - 9,500 - 9,500 Total 58,495 47,699 136,950 113,900 134,740 Other Expenses 7600Contributions - 111,889 109,620 112,000 182,740 Total - 111,889 109,620 112,000 182,740 City Council Expenditures59,759 $ 168,342 $ 248,030 $ 227,443 $ 319,250 $
Page 83
City Manager’s Office
DIVISION MISSION AND DESCRIPTION
It is the mission of the City Manager’s Office to execute City Council policies and directives effectively and to conduct city operations in a professional and efficient manner. The Mayor and City Council appoint the City Manager. The City Manager is responsible for the administration of all city affairs as directed by the City Charter.
DIVISION GOALS AND ACTION ITEMS FOR FY 2024
Strategic Plan priorities addressed below: Governance, Public Safety, Quality of Life, Economic Development, Connectivity, Parks/Natural Beauty, and Service Delivery
Goal: Facilitate achievement of near-term and long-term goals
Action Item: Guide staff in the directives identified by City Council during the annual Plan update and throughout the year
Goal: Monitor staffing and personnel costs to ensure fiscal well-being while maintaining exceptional service levels
Action Item: Review each departments’ operational needs and staffing levels commensurate with service demands
Goal: Present a fiscally sustainable annual budget for adoption
Action Item: Implement the compensation study, distribute ARPA funds, and finance equipment replacement at sufficient levels
SIGNIFICANT CHANGES IN THE FY 2024 BUDGET
Appropriations for wages, taxes, and retirement increase to account for growth in salaries
Pay plan costs reflect the amount that the City Manager could award to employees for exemplary performance
Electric service expenditures increase due to higher rates charged by utilities
FY 2022FY 2023FY 2023FY 2024 WORKLOAD MEASURES ACTUAL BUDGET ESTIMATE BUDGET Number of grant applications submitted 20 20 9 12 Number of official documents indexed 95 110 110 110 Number of open records requests processed 1,588 1,250 1,400 1,400
Monetary value of grants awarded $3,814,973$5,000,000$7,809,000$3,500,000 Strategic Plan goals achieved/underway 4/144/217/2210/20 Responses to records requests within ten days of receipt 100%100%100%100% PERSONNEL City Manager 1.00 1.00 1.00 1.00 City Clerk 1.00 1.00 1.00 1.00 Grants and Special Projects Coordinator 1.00 1.00 1.00 1.00 Assistant City Clerk 1.00 1.00 1.00 1.00 Executive Administrative Assistant 1.00 1.00 1.00 1.00 Total Employees (Full-Time Equivalents) 5.00 5.00 5.00 5.00 Page 84
PERFORMANCE MEASURES
Account FY 2021FY 2022FY 2023FY 2023FY 2024 Number Account Name ActualActualBudgetEstimatedBudget Personnel 1010Salaries and Wages 282,970 $ 296,822 $ 494,080 $ 490,000 $ 518,850 $ 1210TMRS 28,906 30,712 51,380 50,900 55,870 1220FICA 20,658 21,818 37,800 35,200 39,700 1230Employee Insurance20,329 21,947 37,420 39,600 42,750 1240Workers' Comp. Insurance406 595 950 1,068 1,160 1250Unemployment Compensation1,019 71 760 80 520 1260Deferred Compensation26,135 24,215 15,540 15,720 16,380 1600Pay Plan Costs- - - - 50,000 Total 380,423 396,180 637,930 632,568 725,230 Supplies 2010Office Supplies6,005 5,216 7,470 4,500 7,620 2090Tools and Other Supplies800 424 1,300 1,000 1,300 2400Clothing76 - 100 -2500Small Equipment1,041 - - -2600Postage267 618 280 430 280 Total8,189 6,258 9,150 5,930 9,200 Services 5100Dues and Publications4,563 5,096 5,730 5,500 5,400 5130Travel and Training8,635 10,470 17,780 13,000 17,620 5340Building Maintenance Services53,900 60,890 74,660 74,660 77,550 5341Info Tech Services37,400 28,610 36,070 36,070 35,970 5500General Liability 5,418 5,680 6,270 6,475 7,800 5700Special Services 250 1,610 1,200 1,700 2,000 5830Electric Service 9,110 10,802 9,670 10,880 12,140 Total 119,276 123,158 151,380 148,285 158,480 Other Expenses 7700Contingency - 42,847 100,000 100,000 100,000 Total - 42,847 100,000 100,000 100,000 Capital Outlay 8000Land 3,632 57,105 - -Total 3,632 57,105 - -City Manager's Office Expenditures511,520 $ 625,548 $ 898,460 $ 886,783 $ 992,910 $
Page 85
General Fund - City Manager's Office (101-4-021)
Public Information
DIVISION MISSION AND DESCRIPTION
It is the mission of the Public Information division to foster an environment of open and honest communication through the establishment of trust and credibility. The responsibilities of this division include communicating with media professionals and the public; generating press releases for newsworthy items; managing the City’s website, social media accounts, and digital displays in City buildings; and facilitating communication with community stakeholders.
DIVISION GOALS AND ACTION ITEMS FOR FY 2024
Strategic Plan priorities addressed below: Governance
Goal: Ensure transparency in local government through the exchange of information with media outlets
Action Item: Provide public information in a professional and timely manner
Goal: Provide useful information about local government services and programs through social media messaging
Action Item: Schedule at least three social media postings per week
Goal: Ensure the City website and digital building displays are current and accurate
Action Item: Perform a comprehensive review of information regularly
SIGNIFICANT CHANGES IN THE FY 2024 BUDGET
Appropriations for wages, taxes, and retirement increase to account for growth in salaries
Tools and other supplies expenditures decrease after the purchase of a camera in FY 2023
Information technology services reflect changes to the cost allocation schedule for FY 2024
FY 2022FY 2023FY 2023FY 2024 WORKLOAD MEASURES ACTUAL BUDGET ESTIMATE BUDGET Number of website page views 438,293 455,000 450,000 475,000 Number of press releases 53 80 65 70 Social media reach 1,204,946 1,200,000 2,500,000 2,800,000
Responses to media requests within three hours 93%95%97%95% Responses to website/email inquiries within twelve hours 90%95%97%95% Percent of monthly newsletter released in a timely manner 67%100%83%92% PERSONNEL Director of Communications 1.00 1.00 1.00 1.00 Total Employees (Full-Time Equivalents) 1.00 1.00 1.00 1.00 Page 86
PERFORMANCE MEASURES
General Fund - Public Information (101-4-022)
Account FY 2021FY 2022FY 2023FY 2023FY 2024 Number Account Name ActualActualBudgetEstimatedBudget Personnel 1010Salaries and Wages 39,625 $ 41,206 $ 86,450 $ 87,050 $ 91,220 $ 1210TMRS 4,056 4,330 9,100 9,180 9,950 1220 FICA 2,783 2,962 6,620 6,300 6,980 1230Employee Insurance6,697 4,702 10,950 9,500 9,820 1240Workers' Comp. Insurance55 99 170 115 200 1250Unemployment Compensation 182 4 140 20 90 Total 53,398 53,303 113,430 112,165 118,260 Supplies 2010Office Supplies 261 55 60 110 110 2090Tools and Other Supplies - - 2,200 2,200 200 2400Clothing 40 - 50 -Total 301 55 2,310 2,310 310 Services 5010Marketing 333 718 1,600 2,000 2,300 5100Dues and Publications 751 1,044 8601,000 1,110 5130Travel and Training 2,522 3,675 3,600 3,600 3,900 5341Info Tech Services 3,454 3,560 8,850 8,850 7,200 5500General Liability 173 183 200 225 260 Total 7,233 9,180 15,110 15,675 14,770 Public Information Expenditures60,932 $ 62,538 $ 130,850 $ 130,150 $ 133,340 $
Page 87
Retail Development
DIVISION MISSION AND DESCRIPTION
The mission of the Retail Development division is to promote the City of Belton as a premier place for retail and commercial development. The duties of this division include developing plans that strengthen the City’s business climate through marketing and promotional activities; working cooperatively with businesses, property owners, and prospective developers; and assisting with the development of infrastructure to attract retail development and tourism
DIVISION GOALS AND ACTION ITEMS FOR FY 2024
Strategic Plan priorities addressed below: Economic Development
Goal: Enhance retail development and tourism
Action Item: Collaborate with local businesses and the Chamber of Commerce to add, refine, or reinforce retail and tourism in Belton
Goal: Facilitate the addition of hospitality and retail space throughout the community
Action Item: Recruit retail, restaurants, hotels, and shopping centers for the City of Belton
Goal: Assist in project coordination among the City, BEDC, the Chamber of Commerce, and other government agencies
Action Item: Conduct business recruitment, retention, and expansion
SIGNIFICANT CHANGES IN THE FY 2024 BUDGET
Appropriations for wages, taxes, and retirement increase to account for growth in salaries
Travel and training expenditures grow to increase investor contact
Information technology services reflect changes to the cost allocation schedule for FY 2024
FY 2022FY 2023FY 2023FY 2024 WORKLOAD MEASURES ACTUAL BUDGET ESTIMATE BUDGET Number of business retention visits 135 150 150 160 Number of business development visits 60 50 50 50 Number of invitations extended for site visits 85 100 100 100 PERFORMANCE MEASURES Development commitments from businesses 5 10 14 10 Square feet developed from new or expanding businesses 90,000 150,000120,000 100,000 Property tours within one year 80 100100 100 PERSONNEL Retail Development Coordinator 1.00 1.00 1.00 1.00 Total Employees (Full-Time Equivalents) 1.00 1.00 1.00 1.00 Page 88
General Fund - Retail Development (101-4-023)
Account FY 2021FY 2022FY 2023FY 2023FY 2024 Number Account Name ActualActualBudgetEstimatedBudget Personnel 1010Salaries and Wages 23,766 $ 24,822 $ 52,150 $ 58,670 $ 61,620 $ 1210TMRS 2,432 2,608 5,490 6,190 6,730 1220FICA 1,746 1,870 3,990 4,450 4,720 1230Employee Insurance3,291 3,625 8,520 7,100 7,360 1240Workers' Comp. Insurance34 99 110 113 140 1250Unemployment Compensation128 4 140 20 90 Total 31,397 33,028 70,400 76,543 80,660 Supplies 2010Office Supplies459 525 230 320 500 Total459 525 230 320 500 Services 5010Marketing1,742 2,250 3,000 2,000 3,000 5100Dues and Publications300 125 630 500 630 5130Travel and Training947 4,984 3,500 3,500 4,500 5341Info Tech Services3,454 3,560 5,640 5,640 5,090 5500General Liability87 92 100 225 260 Total6,530 11,011 12,870 11,865 13,480 Retail Development Expenditures38,386 $ 44,564 $ 83,500 $ 88,728 $ 94,640 $
Page 89
Finance
DIVISION MISSION AND DESCRIPTION
The Finance division is responsible for providing fiscal control and guidance for all financial transactions of the City while complying with all applicable local, state, and federal regulations. Development of the City’s annual financial reports and annual budget are the primary responsibilities of this division. The division accounts for all assets of the City through the following functions: purchasing, accounts payable, accounts receivable, payroll, cash collections, grant management, and capital assets
DIVISION GOALS AND ACTION ITEMS FOR FY 2024
Strategic Plan priorities addressed below: Governance
Goal: Provide accurate and timely financial reporting and budgeting
Action Item: Receive GFOA excellence in financial reporting certificate and distinguished budget presentation awards
Goal: Develop enhanced and efficient processes for finance functions
Action Item: Reorganize responsibilities among Finance staff and increase training opportunities to allow for greater proficiency
Goal: Ensure financial stability, accountability, and transparency of all City funds
Action Item: Develop a long-term funding strategy to fulfill citywide staffing and facility needs
SIGNIFICANT CHANGES IN THE FY 2024 BUDGET
One Senior Accountant position has been reclassified into one Assistant Finance Director position
Building maintenance services and info tech services reflect changes to the cost allocation schedule for FY 2024
Tax appraisal charges climb with an increase to the rate charged for the service
FY 2022FY 2023FY 2023FY 2024 WORKLOAD MEASURES ACTUAL BUDGET ESTIMATE BUDGET Number of payrolls processed 26 26 26 26 Number of purchase orders issued 146 160 180 180 Number of accounts payable checks processed 3,737 3,800 3,901 3,950 PERFORMANCE MEASURES Monthly closeouts within 45 days of month end 100%100%100%100% Vendor payments processed within two weeks of receipt 90%100%98%100% Reconciliation of all cash transactions on a daily basis 99%100%100%100% PERSONNEL Director of Finance 1.00 1.00 1.00 1.00 Assistant Director of Finance - - - 1.00 Senior Accountant 2.00 2.00 2.00 1.00 Accounting Technician 1.00 1.00 1.00 1.00 Total Employees (Full-Time Equivalents) 4.00 4.00 4.00 4.00 Page 90
General Fund - Finance (101-4-031)
Account FY 2021FY 2022FY 2023FY 2023FY 2024 Number Account Name ActualActualBudgetEstimatedBudget Personnel 1010Salaries and Wages 154,148 $ 140,007 $ 305,030 $ 305,200 $ 336,860 $ 1210TMRS 15,775 14,711 32,090 32,250 36,750 1220 FICA 11,445 10,364 23,340 22,680 25,770 1230Employee Insurance10,708 11,457 28,100 24,000 24,850 1240Workers' Comp. Insurance223 397 590 637 750 1250Unemployment Compensation 1,024 22 540 120 360 Total 193,323 176,958 389,690 384,887 425,340 Supplies 2010Office Supplies 1,881 2,973 2,190 2,300 2,390 2090Tools and Other Supplies 320 647 750 5,023 750 2400Clothing 77 - - -2600Postage 4,693 4,535 4,650 3,500 3,060 Total 6,971 8,155 7,590 10,823 6,200 Services 5100Dues and Publications 4,029 4,249 4,270 4,380 4,380 5110License & Certification 150 40 120 1205130Travel and Training 3,990 5,357 11,000 6,000 8,900 5340Building Maintenance Services 34,646 30,670 37,600 37,600 39,060 5341Info Tech Services 15,517 15,920 26,020 26,020 21,740 5400Bell County Tax Appraisal/Collection93,362 97,576 104,420 88,000 106,190 5500General Liability 3,100 3,290 3,500 3,680 3,950 5600 Audit 21,723 23,763 22,440 22,440 22,980 5700Special Services 1,588 1,936 1,200 9005790Document Preparation 2,813 3,408 2,900 2,000 2,980 5820Gas Service 1,248 1,415 1,350 1,580 1,820 5830Electric Service 3,208 4,054 3,420 3,970 4,300 Total 185,374 191,678 218,240 196,690 216,300 Transfers 9115Transfer to Debt Service Fund - 30,000 - -Total - 30,000 - -Finance Expenditures385,668 $ 406,791 $ 615,520 $ 592,400 $ 647,840 $
Page 91
Human Resources
DIVISION MISSION AND DESCRIPTION
The Human Resources division provides effective human resource management by developing and implementing policies, programs, and services that result in recruiting and retaining the most effective, productive, and empowered employees. Responsibilities include payroll administration, compensation and benefits, employee relations, employment law, workers compensation, and civil service administration.
DIVISION GOALS AND ACTION ITEMS FOR FY 2024
Strategic Plan priorities addressed below: Governance, Service Delivery
Goal: Ensure the City of Belton remains competitive with salary and employee benefits
Action Item: Conduct internal hiring practices to ensure compensation remains competitive
Goal: Create efficiencies in recruiting, onboarding, and performance management
Action Item: Explore the capabilities of the current human resource information system to enhance various HR processes
Goal: Promote employee engagement to advance positive connection and relationships between the City and its employees
Action Item: Focus on employees through recognition, appreciation, continuing education, training, and team activities
SIGNIFICANT CHANGES IN THE FY 2024 BUDGET
Employee recruitment expenditures increase due to the reclassification of employee testing costs into this account
Employee recognition/wellness reflects a supplemental request to add employee development programs
Appropriations for consulting decrease to reflect historical expenditures
FY 2022FY 2023FY 2023FY 2024 WORKLOAD MEASURES ACTUAL BUDGET ESTIMATE BUDGET Number of payrolls processed 26 26 26 26 Number of employees hired or termed 32 32 32 45 Number of civil service tests administered 3 6 7 3 PERFORMANCE MEASURES Percentage of applications processed within three days 100%100%100%100% Percentage of benefit inquiry responses within three days 100%100%100%100% Percentage of employee inquiry responses within three days 100%100%100%100% PERSONNEL Director of Human Resources 1.00 1.00 1.00 1.00 Senior Human Resources Generalist 1.00 1.00 1.00 1.00 Total Employees (Full-Time Equivalents) 2.00 2.00 2.00 2.00 Page 92
General Fund - Human Resources (101-4-032)
Account FY 2021FY 2022FY 2023FY 2023FY 2024 Number Account Name ActualActualBudgetEstimatedBudget Personnel 1010Salaries and Wages 115,430 $ 136,611 $ 171,050 $ 170,900 $ 178,820 $ 1210TMRS 11,810 14,352 17,990 18,000 19,510 1220FICA 8,787 10,421 13,090 13,100 13,680 1230Employee Insurance6,376 6,986 8,830 7,100 7,680 1240Workers' Comp. Insurance172 198 330 230 400 1250Unemployment Compensation400 14 270 30 180 Total 142,975 168,582 211,560 209,360 220,270 Supplies 2010Office Supplies1,469 1,716 1,500 1,600 1,800 2090Tools and Other Supplies110 525 500 540 500 2600Postage142 49 140 100 140 Total1,721 2,290 2,140 2,240 2,440 Services 5030Employee Recruitment5,444 856 14,600 3,000 24,910 5100Dues and Publications1,273 1,364 1,380 1,200 1,430 5110License & Certification445 208 600 600 1,050 5130Travel and Training3,186 3,666 9,100 4,000 10,840 5170Employee Recognition / Wellness4,122 5,685 14,100 14,000 43,320 5190Employee Testing14,271 15,790 6,420 7,5005341Info Tech Services6,909 7,110 30,070 30,070 22,750 5500General Liability346 366 400 450 520 5610Legal Services 4,975 3,826 10,000 3,000 4,000 5630Consulting 33,531 59,219 44,850 34,000 37,740 5700Special Services 3,035 1,296 2,800 1,500 1,800 Total 77,537 99,386 134,320 99,320 148,360 Human Resources Expenditures222,233 $ 270,258 $ 348,020 $ 310,920 $ 371,070 $
Page 93
Municipal Court
DIVISION MISSION AND DESCRIPTION
The primary function of the Municipal Court division is to advise the City Council and management in all legal matters and to ensure compliance with all City codes. This division also processes violations of City ordinances resulting from citizen complaints, traffic citations, and misdemeanor arrests through the Municipal Court. The City Attorney and Municipal Judge are appointed by City Council on a contractual basis
DIVISION GOALS AND ACTION ITEMS FOR FY 2024
Strategic Plan priorities addressed below: Governance, Public Safety
Goal: Maintain effective and efficient court administration and operations
Action Item: Develop and implement a succession plan to ensure continuity of operations
Goal: Enhance service delivery to foster public trust and confidence in the judicial system
Action Item: Review and revise standing orders as needed to expedite the disposition of cases
Goal: Ensure the fair and impartial administration of City codes, statutes, and ordinances through the municipal court
Action Item: Promote municipal court certifications and provide regular staff training on court operations
SIGNIFICANT CHANGES IN THE FY 2024 BUDGET
Appropriations for wages, taxes, and retirement increase to account for growth in salaries
Information technology services reflect changes to the cost allocation schedule for FY 2024
Legal service expenditures reflect a supplemental request to execute a contract with an Associate Judge
Payment processing fees increase as more defendants pay fines and fees with credit cards
PERFORMANCE MEASURES
FY 2022FY 2023FY 2023FY 2024 WORKLOAD MEASURES ACTUAL BUDGET ESTIMATE BUDGET Number of court sessions held 46 55 51 55 Number of cases filed 5,515 5,600 5,600 5,600 Number of warrants issued 1,144 1,600 1,600 1,600
Citations input into court system within one day of receipt 100%100%100%100% Summons issued fourteen days before appearance date 100%100%100%100% Warrant process started within 20 days of failure to appear 100%100%100%100% PERSONNEL Court Administrator 1.00 1.00 1.00 1.00 Deputy Court Clerk - 1.00 1.00 1.00 Total Employees (Full-Time Equivalents) 1.00 2.00 2.00 2.00 Page 94
General Fund - Municipal Court (101-4-040)
Account FY 2021FY 2022FY 2023FY 2023FY 2024 Number Account Name ActualActualBudgetEstimatedBudget Personnel 1010Salaries and Wages 161,596 $ 150,271 $ 102,590 $ 95,000 $ 107,790 $ 1210TMRS 9,339 8,376 10,790 10,000 11,760 1220 FICA 6,781 5,973 7,850 7,000 8,250 1230Employee Insurance9,681 12,974 18,970 14,410 16,340 1240Workers' Comp. Insurance553 1,228 210 503 280 1250Unemployment Compensation 462 16 270 80 180 Total 188,412 178,838 140,680 126,993 144,600 Supplies 2010Office Supplies 2,320 2,922 2,600 2,700 3,100 2090Tools and Other Supplies 166 368 2,250 1,500 800 2600Postage 6,664 7,908 9,500 10,800 10,500 Total 9,150 11,198 14,350 15,000 14,400 Services 5100Dues and Publications 207 165 260 260 260 5130Travel and Training 1,100 1,456 7,200 4,000 9,200 5341Info Tech Services 17,271 17,780 19,620 19,620 23,500 5500General Liability 287 297 320 565 630 5610Legal Services - - 40,800 40,200 60,650 5731Payment Processing Fees 6,022 8,318 7,500 10,000 10,500 Total 24,887 28,016 75,700 74,645 104,740 Municipal Court Expenditures222,449 $ 218,052 $ 230,730 $ 216,638 $ 263,740 $
Page 95
Police - Administration
DIVISION MISSION AND DESCRIPTION
The Belton Police Department is dedicated to providing excellent service through partnerships that build trust, reduce crime, and create a safe environment that enhances the quality of life in the community. The Police-Administration division is primarily responsible for the vision, leadership, and management of all Police Department activities. The division implements training programs, supervises internal investigations, and coordinates law enforcement activities with other agencies.
DIVISION GOALS AND ACTION ITEMS FOR FY 2024
Strategic Plan priorities addressed below: Governance, Public Safety
Goal: Implement strategies to reduce crime
Action Item: Utilize data-driven approaches to crime prevention and traffic safety
Goal: Enhance community engagement to promote trust
Action Item: Increase proactive community outreach and public awareness initiatives
Goal: Maintain accreditation from the Texas Law Enforcement Best Practices Accreditation Program
Action Item: Implement all new standards added to the accreditation program
SIGNIFICANT CHANGES IN THE FY 2024 BUDGET
Salaries and wages reflect the reclassification of personnel costs from the Grant Fund into the General Fund
Appropriations for machinery and equipment maintenance decrease after repairing fencing during FY 2023
Building maintenance services reflect changes to the cost allocation schedule for FY 2024
FY 2022FY 2023FY 2023FY 2024 WORKLOAD MEASURES ACTUAL BUDGET ESTIMATE BUDGET Hours of in-service training held 6,014 5,800 5,800 6,100 Number of professional standards investigations 16 9 10 20 Number of community events attended 136 110 100 150 PERFORMANCE MEASURES Percent of authorized sworn positions filled 100%100%95%100% Percent of best practices met 100%100%100%100% Citizen complaint investigations completed within 30 days 82%100%99%90% PERSONNEL Police Chief 1.00 1.00 1.00 1.00 Office Manager 1.00 1.00 1.00 1.00 Custodian II 1.00 1.00 1.00 1.00 Regional Director of Law Enforcement-Peer Support 1.00 1.00 1.00 1.00 Total Employees (Full-Time Equivalents) 4.00 4.00 4.00 4.00 Page 96
General Fund - Police - Administration (101-4-051)
Account FY 2021FY 2022FY 2023FY 2023FY 2024 Number Account Name ActualActualBudgetEstimatedBudget Personnel 1010Salaries and Wages 155,438 $ 160,707 $ 246,700 $ 270,000 $ 318,890 $ 1210TMRS 16,396 17,963 25,950 29,800 34,790 1220FICA 11,261 12,058 18,880 20,000 24,400 1230Employee Insurance17,952 21,733 27,520 25,000 32,920 1240Workers' Comp. Insurance1,673 2,072 4,230 3,310 3,990 1250Unemployment Compensation649 - 410 60 360 1260Deferred Compensation - - 10,200 10,270 10,790 Total 203,369 214,533 333,890 358,440 426,140 Supplies 2010Office Supplies801 851 800 1,090 800 2050Educational Supplies994 2,057 2,100 1,600 2,100 2070Janitorial Supplies208 384 500 650 1,000 2090Tools and Other Supplies3,465 3,776 4,000 5,000 4,500 2220Fuel427 811 740 620 660 2400Clothing538 460 670 420 1,420 2500Small Equipment4,641 - - -2600Postage527 540 580 820 580 Total11,601 8,879 9,390 10,200 11,060 Maintenance 3010Building1,073 2,762 1,800 15,688 1,800 4020Machinery and Equipment13 60 24,250 24,000 250 Total 1,086 2,822 26,050 39,688 2,050 Services 5100Dues and Publications 2,751 2,916 3,290 2,950 3,720 5130Travel and Training 3,080 5,290 7,640 17,000 19,540 5190Employee Testing 120 - - -5210Equipment Lease 526 - - -5340Building Maintenance Services 49,916 36,060 44,210 44,210 78,880 5341Info Tech Services 22,164 40,110 27,120 27,120 29,090 5410Bell County Jail 8,260 10,570 21,000 19,000 21,000 5500General Liability 14,087 15,707 16,970 16,860 20,320 5820Gas Service 920 1,113 1,000 1,430 1,650 5830Electric Service 25,629 30,469 26,610 30,600 33,750 Total 127,453 142,235 147,840 159,170 207,950 Transfers 9103Transfer to General Capital Projects325,000 - 30,000 30,000 30,000 Total 325,000 - 30,000 30,000 30,000 Police-Administration Expenditures668,509 $ 368,469 $ 547,170 $ 597,498 $ 677,200 $
Page 97
Police - Patrol
DIVISION MISSION AND DESCRIPTION
The Police-Patrol division protects the community by means of proactive patrol, locating and arresting criminals, and responding to a variety of calls for service. The division responds to traffic accidents; issues citations for traffic offenses; conducts preliminary investigations of criminal incidents; and maintains crime scenes to collect and preserve evidence.
DIVISION GOALS AND ACTION ITEMS FOR FY 2024
Strategic Plan priorities addressed below: Public Safety
Goal: Reduce the number of traffic accidents and fatality crashes
Action Item: Partner with agencies to eliminate roadway hazards and to provide high-visibility enforcement
Goal: Reduce the number of offenses involving weapons and violent crimes
Action Item: Deploy the Direct Action Response Team to augment patrol shifts in areas prone to violent crimes
Goal: Enhance community outreach to residents unfamiliar with the Belton Police Department
Action Item: Identify the transient population within the City of Belton and connect them to area resources
SIGNIFICANT CHANGES IN THE FY 2024 BUDGET
Three Police Officer positions have been added to enhance public safety
Information technology services reflect changes to the cost allocation schedule for FY 2024
Bell County communications expenditures increase due to higher operational costs at the communication center
Transfers for vehicle replacement reflect an increase to the annual contribution for future equipment replacement
FY 2022FY 2023FY 2023FY 2024 WORKLOAD MEASURES ACTUAL BUDGET ESTIMATE BUDGET Number of calls for service 34,874 35,500 35,000 35,500 Number of alarm responses 1,120 1,150 1,075 1,170 Number of incident reports 3,082 2,850 2,800 3,200 PERFORMANCE MEASURES Number of traffic accidents 1,814 1,650 1,625 1,500 Number of arrests 1,287 1,800 1,780 1,500 Response time on priority calls 4.18 minutes 4.2 minutes4.5 minutes4.2 minutes PERSONNEL Deputy Chief 1.00 1.00 1.00 1.00 Captain 1.00 1.00 1.00 1.00 Lieutenant 2.00 2.00 2.00 2.00 Sergeant 4.00 4.00 4.00 4.00 Police Officer 17.00 17.00 18.00 21.00 Total Employees (Full-Time Equivalents) 25.00 25.00 26.00 29.00 Page 98
Account FY 2021FY 2022FY 2023FY 2023FY 2024 Number Account Name ActualActualBudgetEstimatedBudget Personnel 1010Salaries and Wages 1,654,957 $ 1,817,896 $ 1,930,240 $ 1,967,100 $ 2,234,520 $ 1070Overtime Pay 80,719 45,591 65,000 53,030 55,000 1210TMRS 178,208 197,567 209,870 208,000 249,520 1220 FICA 130,026 140,936 147,670 146,500 170,950 1230Employee Insurance163,834 168,762 168,820 168,000 211,530 1240Workers' Comp. Insurance25,305 30,003 38,280 54,670 63,480 1250Unemployment Compensation8,776 5453,380 6602,610 Total 2,241,825 2,401,300 2,563,260 2,597,960 2,987,610 Supplies 2010Office Supplies 894 1,903 9501,300 1,200 2050Educational Supplies 3,252 3,349 3,150 3,020 2,650 2090Tools and Other Supplies 11,850 23,942 22,650 20,900 21,550 2220Fuel 62,768 97,185 79,930 73,250 76,920 2400Clothing 29,848 15,689 23,000 18,000 25,190 2500Small Equipment 15,821 19,100 10,610 14,000 6,500 Total 124,433 161,168 140,290 130,470 134,010 Maintenance 4020Machinery and Equipment 1,801 1,411 2,800 9001,500 4030Vehicle - - - 7,700Total 1,801 1,411 2,800 8,600 1,500 Services 5100Dues and Publications 396 909 820 900 830 5130Travel and Training 11,871 9,966 13,550 11,000 15,010 5140Travel and Training with Agreement 2,196 - - -5150Travel and Training LEOSE 2,393 - - -5341Info Tech Services 181,180 247,150 336,920 336,920 298,220 5420Bell County Communications 328,472 329,941 353,220 313,220 398,270 5500General Liability 31,084 31,076 30,760 30,800 34,440 Total 557,592 619,042 735,270 692,840 746,770 Capital Outlay 8400Computer Equipment 5,795 - - -Total 5,795 - - -Transfers 9160Transfer to Grant Fund - - 40,000 -9175Transfer to PD Vehicle Replacement192,198 197,610 237,980 237,980 310,230 Total 192,198 197,610 277,980 237,980 310,230 Police-Patrol Expenditures3,123,644 $ 3,380,531 $ 3,719,600 $ 3,667,850 $ 4,180,120 $
Page 99
General Fund - Police - Patrol (101-4-052)
Police – Special Operations
DIVISION MISSION AND DESCRIPTION
The primary duties of the Police-Special Operations division include investigating all criminal activities that are reported to the Belton Police Department; answering non-emergency calls for service; coordinating training for all staff; creating a safe environment in Belton schools; and serving as custodian of police records and evidence.
DIVISION GOALS AND ACTION ITEMS FOR FY 2024
Strategic Plan priorities addressed below: Public Safety
Goal: Increase the clearance rate on follow-up criminal investigations
Action Item: Dedicate sufficient manhours to investigations by maintaining a full staff in the division
Goal: Expand community outreach to build trust and encourage crime prevention
Action Item: Participate in and host events throughout the community
Goal: Increase traffic safety within designated areas
Action Item: Use the Data-Driven Approach to Crime in Traffic Safety model to deploy the Direct Action Response Team
SIGNIFICANT CHANGES IN THE FY 2024 BUDGET
One Crime Scene Technician position is reclassified as a civilian which increases the Police Officer-Investigator count Two part-time (1 FTE) Community Support Services-Communications positions have been added to enhance customer service Information technology services reflect changes to the cost allocation schedule for FY 2024
MEASURES
FY 2022FY 2023FY 2023FY 2024 WORKLOAD MEASURES ACTUAL BUDGET ESTIMATE BUDGET Number of crimes investigated 774 650 700 950 Number of cases cleared 438 400 420 450 Number of pieces of evidence handled 5,155 4,850 5,000 5,300 PERFORMANCE
Percent of investigations completed within 90 days 52%80%80%80% Criminal case clearance rate 57%70%65%75% Number of cases cleared per investigator 108 80 80 120 PERSONNEL Captain 1.00 1.00 1.00 1.00 Lieutenant 1.00 1.00 1.00 1.00 Sergeant 1.00 1.00 1.00 1.00 Police Officer - Investigator 4.00 4.00 4.00 5.00 Police Officer - School Resource Officer 3.00 4.00 4.00 4.00 Police Officer - Warrant Officer 1.00 1.00 1.00 1.00 Crime Scene Technician 1.00 1.00 1.00 1.00 Community Support Services - Records 1.00 1.00 1.00 1.00 Community Support Services - Communications 6.00 6.00 6.00 7.00 Support Services Manager 1.00 1.00 1.00 1.00 Community Support Services - Volunteer Coordinator 0.50 0.50 0.50 0.50 Crime Victim Liaison 1.00 1.00 1.00 1.00 Total Employees (Full-Time Equivalents) 21.50 22.50 22.50 24.50 Page 100
General Fund - Police - Special Operations (101-4-053)
Account FY 2021FY 2022FY 2023FY 2023FY 2024 Number Account Name ActualActualBudgetEstimatedBudget Personnel 1010Salaries and Wages 706,189 $ 1,203,945 $ 1,360,030 $ 1,455,000 $ 1,598,020 $ 1070Overtime Pay 8,075 26,706 18,000 70,000 75,000 1210TMRS 77,855 129,400 144,940 161,000 182,190 1220FICA 56,968 91,918 104,050 113,600 122,250 1230Employee Insurance76,157 112,867 147,760 125,000 140,730 1240Workers' Comp. Insurance7,226 14,537 19,910 27,010 31,710 1250Unemployment Compensation4,225 308 2,840 800 2,250 Total 936,695 1,579,681 1,797,530 1,952,410 2,152,150 Supplies 2010Office Supplies1,308 2,183 1,300 2,000 2,000 2090Tools and Other Supplies2,050 4,685 3,660 5,000 6,000 2220Fuel4,315 7,294 5,630 6,000 6,230 2400Clothing2,995 2,477 7,540 7,200 7,050 2500Small Equipment995 3,126 510 -Total11,663 19,765 18,640 20,200 21,280 Maintenance 4020Machinery and Equipment400 - - -Total400 - - -Services 5100Dues and Publications3,495 4,442 4,990 5,920 590 5130Travel and Training4,357 13,237 8,020 9,500 11,520 5310RUOK- 779 1,000 1,025 1,000 5341Info Tech Services51,814 56,890 73,890 73,890 86,100 5500 General Liability 12,635 19,371 20,930 20,690 23,850 Total 72,301 94,719 108,830 111,025 123,060 Transfers 9160Transfer to Grant Fund - 7,291 - -9175Transfer to PD Vehicle Replacement33,655 34,670 83,540 83,540 75,190 Total 33,655 41,961 83,540 83,540 75,190 Police-Special Operations Expenditures1,054,714 $ 1,736,126 $ 2,008,540 $ 2,167,175 $ 2,371,680 $
Page 101
Police – Code Compliance
DIVISION MISSION AND DESCRIPTION
The mission of the Police-Code Compliance division is to ensure safe residential and commercial structures and to control the animal population of the city through enforcement and community education. Primary duties include initiating and investigating complaints on properties that are in violation of ordinances; removing unsafe structures through rehabilitation or condemnation; picking up stray or dead animals; responding to reports of animal bites; and assisting with the prosecution of criminal activity involving animals.
DIVISION GOALS AND ACTION ITEMS FOR FY 2024
Strategic Plan priorities addressed below: Public Safety
Goal: Proactively identify potential violations before they become issues
Action Item: Use compassionate enforcement to gain voluntary compliance
Goal: Control the stray animal population
Action Item: Provide quick response to complaints and promote pet adoptions through the Bell County Animal Shelter
Goal: Address code compliance concerns in specific geographic areas of the City
Action Item: Adopt a sector of the month program for both animal control and code enforcement
SIGNIFICANT CHANGES IN THE FY 2024 BUDGET
Appropriations for wages, taxes, and retirement increase to account for growth in salaries
Information technology services reflect changes to the cost allocation schedule for FY 2024
Transfers for vehicle replacement reflect an increase to the annual contribution for future equipment replacement
PERFORMANCE MEASURES
FY 2022FY 2023FY 2023FY 2024 WORKLOAD MEASURES ACTUAL BUDGET ESTIMATE BUDGET Number of code inspections performed 3,264 3,260 3,200 3,500 Number of code reinspections performed 5,626 5,300 5,300 6,000 Number of calls for animal control services 2,925 3,200 3,200 3,200
Average time for compliance with code 7 days7 days7 days7 days Percent of code enforcement citations heard in court 93%80%90%90% Percent of animal control call responses within same day 100%100%100%100% PERSONNEL Code Enforcement Officer 1.00 1.00 1.00 1.00 Animal Control Officer 1.00 1.00 1.00 1.00 Total Employees (Full-Time Equivalents) 2.00 2.00 2.00 2.00 Page 102
General Fund - Police - Code Compliance (101-4-054)
Account FY 2021FY 2022FY 2023FY 2023FY 2024 Number Account Name ActualActualBudgetEstimatedBudget Personnel 1010Salaries and Wages 81,630 $ 85,235 $ 91,970 $ 91,500 $ 98,830 $ 1210TMRS 8,353 8,956 9,680 9,600 10,780 1220 FICA 6,210 6,488 7,040 7,000 7,570 1230Employee Insurance6,903 7,544 8,830 7,350 7,680 1240Workers' Comp. Insurance1,562 2,396 2,630 3,275 3,860 1250Unemployment Compensation504 18 270 40 180 Total 105,162 110,637 120,420 118,765 128,900 Supplies 2010Office Supplies 302 273 250 210 250 2090Tools and Other Supplies 184 402 200 214 200 2220Fuel 3,076 4,498 3,920 3,050 3,200 2400Clothing 214 474 420 420 600 2600Postage 1,054 1,081 1,000 1,075 1,000 Total 4,830 6,728 5,790 4,969 5,250 Maintenance 4030Vehicle - - - 1,500Total - - - 1,500Services 5130Travel and Training 920 1,143 940 900 1,090 5341Info Tech Services 6,908 7,120 8,930 8,930 7,410 5440Bell County Animal Shelter 40,000 40,000 40,000 40,000 40,000 5500General Liability 1,536 1,292 1,410 827 980 5700Special Services 247 243 500 350 3,500 5710 Demolition and Cleanup 4,532 4,993 10,000 4,800 10,000 Total 54,143 54,791 61,780 55,807 62,980 Transfers 9175Transfer to PD Vehicle Replacement 8,429 8,680 4,590 4,590 6,290 Total 8,429 8,680 4,590 4,590 6,290 Police-Code Compliance Expenditures172,564 $ 180,836 $ 192,580 $ 185,631 $ 203,420 $
Page 103
Fire - Suppression
DIVISION MISSION AND DESCRIPTION
The mission of the Belton Fire Department’s dedicated professionals is to enhance the quality of life for our community by delivering expert levels of fire and emergency response, fire prevention, and public education as well as providing any other service we are equipped to deliver. Responsibilities include extinguishing all fires; conducting fire prevention activities; coordinating emergency management planning; investigating the cause of fires; and managing the emergency medical services contract
DIVISION GOALS AND ACTION ITEMS FOR FY 2024
Strategic Plan categories addressed below: Public Safety
Goal: Ensure expert levels of emergency services are provided to the community
Action Item: Modify initial response models and provide staff training that meet or exceeds national standards
Goal: Increase firefighter safety and health initiatives
Action Item: Perform annual physical assessments and implement occupational safety recommendations
Goal: Increase community outreach and business inspections to reduce the risk of loss of life and property
Action Item: Implement tactics identified in the Community Risk Assessment, Standards of Cover, and Strategic Plan
SIGNIFICANT CHANGES IN THE FY 2024 BUDGET
One Firefighter/Deputy Fire Marshal position and three Firefighter/EMT positions have been added to enhance public safety
Building maintenance expenditures increase to repair the Station 2 parking lot and replace lighting at Station 1
Transfers for vehicle replacement reflect an increase to the annual contribution for future equipment replacement
FY 2022FY 2023FY 2023FY 2024 WORKLOAD MEASURES ACTUAL BUDGET ESTIMATE BUDGET Number of calls for service 2,594 2,500 2,600 2,600 Number of fire inspections performed 310 600 600 1,200 Number of public relations / education events attended 242 250 250 350
MEASURES Average response time - 5.0 minute target 7.9 minutes7.5 minutes7.5 minutes6.5 minutes Percent of structural fires contained to confines of building 100%100%100%100% Percent of calls that were medical responses 58%65%65%65% PERSONNEL Fire Chief 1.00 1.00 1.00 1.00 Assistant Fire Chief 1.00 1.00 1.00 1.00 Captain 3.00 3.00 3.00 3.00 Lieutenant 3.00 3.00 3.00 3.00 Driver / Operator 6.00 6.00 6.00 6.00 Firefighter / Fire Marshal 1.00 1.00 1.00 1.00 Firefighter / Deputy Fire Marshal - - - 1.00 Firefighter / EMT 12.00 12.00 12.00 15.00 Office Manager 1.00 1.00 1.00 1.00 Total Employees (Full-Time Equivalents) 28.00 28.00 28.00 32.00 Page 104
PERFORMANCE
Account FY 2021FY 2022FY 2023FY 2023FY 2024 Number Account Name ActualActualBudgetEstimatedBudget Personnel 1010Salaries and Wages 1,696,437 $ 1,963,900 $ 2,257,180 $ 2,253,000 $ 2,520,340 $ 1070Overtime Pay 66,574 92,888 55,000 81,600 80,000 1210TMRS 181,600 216,153 243,200 245,420 283,320 1220FICA 131,853 153,215 172,680 173,300 192,810 1230Employee Insurance169,930 199,369 234,080 198,500 241,260 1240Workers' Comp. Insurance25,977 39,564 48,450 67,370 76,930 1250Unemployment Compensation7,296 593 3,920 950 2,880 Total 2,279,667 2,665,682 3,014,510 3,020,140 3,397,540 Supplies 2010Office Supplies2,766 2,723 4,600 4,000 3,090 2030Chemical Supplies1,250 3,976 4,320 3,600 4,720 2050Educational Supplies2,272 3,585 4,600 3,700 5,150 2070Janitorial Supplies277 817 500 600 900 2090Tools and Other Supplies6,480 7,328 4,600 5,300 7,900 2220Fuel20,765 32,347 26,310 33,700 34,360 2310EMS Supplies1,660 6,490 19,650 19,000 18,350 2400Clothing28,539 33,762 34,500 44,000 55,050 2500Small Equipment20,985 49,326 23,450 29,000 40,200 2600Postage129 217 500 250 450 Total85,123 140,571 123,030 143,150 170,170 Maintenance 3010Building1,989 4,123 3,200 2,420 54,700 3110Fire Hydrant 1,322 449 1,300 650 1,600 4020Machinery and Equipment 17,682 13,123 22,070 23,700 27,270 4030Vehicle 3,900 80,270 1,160 1,000 1,160 Total 24,893 97,965 27,730 27,770 84,730 Services 5010Marketing 543 2,237 2,500 2,300 2,650 5100Dues and Publications 2,188 3,149 2,920 3,100 4,190 5110License & Certification 2,602 3,685 3,530 3,650 3,530 5130Travel and Training 19,876 37,381 35,100 35,000 41,100 5140Travel and Training with Agreement 3,908 - - -5190Employee Testing 420 - - -5340Building Maintenance Services 55,843 63,090 77,350 77,350 80,350 5341Info Tech Services 70,768 67,670 89,320 89,320 88,830 5500General Liability 25,847 22,834 24,660 28,745 33,750 5690Other Professional Services 12,135 8,869 28,000 25,000 28,000 5820Gas Service 4,906 6,679 5,950 7,600 8,740 5830Electric Service 15,162 19,983 16,140 17,430 18,950 Total 214,198 235,577 285,470 289,495 310,090 Capital Outlay 8200Machinery and Equipment - - 25,000 22,205Total - - 25,000 22,205Transfers 9103Transfer to General Capital Projects20,000 - - -9104Transfer to General Capital Equip 143,714 - - -9170Transfer to FD Vehicle Replacement151,215 183,340 310,930 310,930 418,980 Total 314,929 183,340 310,930 310,930 418,980 Fire-Suppression Expenditures2,918,810 $ 3,323,135 $ 3,786,670 $ 3,813,690 $ 4,381,510 $
Page 105
General Fund - Fire - Suppression (101-4-061)
Streets
DIVISION MISSION AND DESCRIPTION
The mission of the Streets division is to provide a transportation system of streets, alleys, and sidewalks for safe and efficient vehicular and pedestrian traffic. Responsibilities of this division includes repairing streets and sidewalks; inspecting City bridges; installing traffic control signs and paving markers; installing street signs; and barricading during emergency weather conditions.
DIVISION GOALS AND ACTION ITEMS FOR FY 2024
Strategic Plan priorities addressed below: Governance, Quality of Life
Goal: Address infrastructure needs
Action Item: Plan for street extensions and reconstructions as part of growth planning process
Goal: Propose cost-effective alternatives to street maintenance whenever possible
Action Item: Utilize the asphalt recycler and hot box to repair utility cuts and potholes to reduce expenditures
Goal: Preserve or enhance the condition of streets and street signs
Action Item: Geographically identify all street signs, evaluate their condition, and schedule replacement as needed
SIGNIFICANT CHANGES IN THE FY 2024 BUDGET
Appropriations for wages, taxes, and retirement increase to account for growth in salaries
Appropriations for engineering services decrease to reflect historical spending
Transfers for vehicle replacement reflect a reduction to the annual contribution for future equipment replacement
FY 2022FY 2023FY 2023FY 2024 WORKLOAD MEASURES ACTUAL BUDGET ESTIMATE BUDGET Square yards of contracted street maintenance - 90,000 102,000 100,000 Miles of city-owned and maintained streets 116 118 118 120 Number of utility cuts repaired 63 70 55 60
Repair 90% of utility cuts within 5 business days 95%95%90%95% Complete 100% service requests with 10 business days 100%95%100%100% Respond to 100% of sign damage reports within 1 day 100%100%100%100% PERSONNEL Street Superintendent 1.00 1.00 1.00 1.00 Senior Maintenance Technician 1.00 1.00 1.00 1.00 Maintenance Technician II 2.00 2.00 2.00 2.00 Maintenance Technician I 3.00 3.00 3.00 3.00 Total Employees (Full-Time Equivalents) 7.00 7.00 7.00 7.00 Page 106
PERFORMANCE MEASURES
General Fund - Streets (101-4-080)
Account FY 2021FY 2022FY 2023FY 2023FY 2024 Number Account Name ActualActualBudgetEstimatedBudget Personnel 1010Salaries and Wages 280,603 $ 272,678 $ 285,840 $ 257,000 $ 298,390 $ 1070Overtime Pay 1,981 8232,000 1,700 2,000 1210TMRS 29,095 28,785 30,280 28,000 32,760 1220 FICA 21,091 20,260 21,870 20,000 22,830 1230Employee Insurance40,904 48,401 55,890 48,520 62,030 1240Workers' Comp. Insurance7,651 9,654 10,240 11,904 12,290 1250Unemployment Compensation2,155 197 950 90 630 Total 383,480 380,798 407,070 367,214 430,930 Supplies 2010Office Supplies 318 - - -2030Chemical Supplies 1,237 3811,530 1,500 2,550 2090Tools and Other Supplies 7,047 7,916 7,000 7,500 8,000 2220Fuel 15,862 23,909 18,450 21,100 22,160 2400Clothing 5,397 5,146 6,750 6,600 6,750 2500Small Equipment 4,258 3,547 12,000 12,000 11,000 Total 34,119 40,899 45,730 48,700 50,460 Maintenance 3330Street 727,308 85,740 1,054,730 1,050,000 1,054,730 3340Sign 22,068 18,771 17,000 18,500 17,000 3360Sidewalk 25,127 3,546 20,000 16,600 20,000 4020Machinery and Equipment 13,864 15,300 13,000 11,000 14,000 4030Vehicle 48 - - -Total 788,415 123,357 1,104,730 1,096,100 1,105,730 Services 5110 License & Certification 64 - 140 140 1,730 5130Travel and Training 83 - 2,540 2503,240 5220Equipment Rental 1,327 7461,500 2,500 1,500 5340Building Maintenance Services 11,223 12,680 15,55015,550 8,070 5341Info Tech Services 13,817 10,670 5,270 5,270 6,660 5500General Liability 16,122 16,378 17,690 17,086 19,910 5620Engineering - - 50,000 40,000 45,000 5820Gas Service 97 169 - -5830Electric Service 244,813 247,659 264,440 255,090 265,410 5940Tipping/Hauling Fees 4,253 2,945 5,000 3,500 5,000 Total 291,799 291,247 362,130 339,386 356,520 Capital Outlay 8200Machinery and Equipment 8,105 - - -Total 8,105 - - -Transfers 9103Transfer to General Capital Projects1,696,500 650,000 - -9160Transfer to Grant Fund 302 - - -9176Transfer to Parks & Public Works 142,645 147,110 267,090 267,090 209,160 9202Transfer to Water & Sewer Fund - - 100,930 100,930 103,560 Total 1,839,447 797,110 368,020 368,020 312,720 Streets Expenditures3,345,365 $ 1,633,411 $ 2,287,680 $ 2,219,420 $ 2,256,360 $
Page 107
Parks & Recreation - Facilities
DIVISION MISSION AND DESCRIPTION
The mission of the Parks & Recreation-Facilities division is to provide clean, safe, and well-maintained outdoor recreation space to be enjoyed by all. This is accomplished by designing, building, and maintaining new and existing parks. Responsibilities include mowing recreation areas and City-owned rights of way; maintaining athletic fields and splash pads; and providing pest and weed control.
DIVISION GOALS AND ACTION ITEMS FOR FY 2024
Strategic Plan priorities addressed below: Quality of Life
Goal: Enhance the aesthetics and function of city parks where appropriate
Action Item: Implement a grading system to identify and prioritize aging park infrastructure
Goal: Expand the City of Belton park system
Action Item: Construct a new park around the historic standpipe and design the Liberty Valley Neighborhood Park
Goal: Operate and maintain superior youth sport and athletic facilities
Action Item: Explore the consolidation of baseball and related activities into Heritage Park
SIGNIFICANT CHANGES IN THE FY 2024 BUDGET
One Maintenance Technician I position has been added due to the growing workload for park maintenance
Small equipment expenditures rise to add automated ballfield lighting and shade covers for picnic tables
Park maintenance expenditures increase to replace park equipment and lamp shades along trails
Appropriations for contract mowing increase to mow highly visible rights of way including the interstate corridor
Capital outlay includes a truck for the new Maintenance Technician I position
FY 2022FY 2023FY 2023FY 2024 WORKLOAD MEASURES ACTUALBUDGET ESTIMATE BUDGET Acres of park space maintained 259 259 264 264 Number of playgrounds and ball fields maintained 34 34 34 35 Miles of trails maintained 6 6 8 8 PERFORMANCE
Percent of park land mowed at scheduled intervals 100%100%100%100% Percent of park equipment maintained in working condition 100%100%100%100% Percent of athletic fields maintained annually 100%100%100%100% PERSONNEL Assistant Director of Parks & Recreation 1.00 1.00 1.00 1.00 Senior Maintenance Technician 3.00 3.00 3.00 3.00 Maintenance Technician II 4.00 4.00 3.00 3.00 Maintenance Technician I 3.00 3.00 4.00 5.00 Total Employees (Full-Time Equivalents) 11.00 11.00 11.00 12.00 Page 108
MEASURES
Account FY 2021FY 2022FY 2023FY 2023FY 2024 Number Account Name ActualActualBudgetEstimatedBudget Personnel 1010Salaries and Wages 496,237 $ 485,487 $ 573,170 $ 515,000 $ 562,290 $ 1070Overtime Pay 139 1,425 750 500 1,600 1210TMRS 44,709 46,389 51,320 51,000 59,160 1220FICA 36,893 36,374 41,790 39,500 43,020 1230Employee Insurance65,167 74,355 88,500 72,000 83,510 1240Workers' Comp. Insurance6,781 8,682 9,330 12,300 17,170 1250Unemployment Compensation4,647 308 1,620 260 1,170 Total 654,573 653,020 766,480 690,560 767,920 Supplies 2010Office Supplies487 828 480 480 480 2030Chemical Supplies14,547 10,723 10,700 14,000 14,700 2070Janitorial Supplies6,451 7,828 9,100 9,000 12,100 2090Tools and Other Supplies13,509 5,871 5,580 5,000 7,250 2220Fuel23,944 34,031 24,770 23,340 24,510 2400Clothing5,503 7,940 8,550 7,100 8,810 2500Small Equipment6,460 9,050 38,700 34,000 55,250 Total70,901 76,271 97,880 92,920 123,100 Maintenance 3010Building1,213 1,269 5,500 5,500 2,500 3420Splash Pad18,547 16,237 14,680 15,400 20,380 3430Park52,641 59,314 53,600 52,000 78,500 3450Landscape5,035 5,621 5,900 5,200 20,000 4020Machinery and Equipment 19,795 15,755 14,900 13,000 14,900 Total 97,231 98,196 94,580 91,100 136,280 Services 5100Dues and Publications 381 496 560 450 570 5110License & Certification 77 685 660 650 660 5130Travel and Training 2,140 1,780 3,510 3,510 5,300 5220Equipment Rental 2,409 3,161 2,400 2,000 2,400 5340Building Maintenance Services 2,104 2,380 12,630 12,630 13,120 5341Info Tech Services 6,909 10,670 14,480 14,480 16,380 5500General Liability 23,447 23,821 25,730 26,980 32,110 5740Contract Mowing 60,716 49,621 58,200 46,000 142,200 5820Gas Service 986 1,014 1,020 1,130 1,300 5830Electric Service 55,234 64,985 53,700 51,460 56,140 Total 154,403 158,613 172,890 159,290 270,180 Capital Outlay 8200Machinery and Equipment 5,495 - - -8300Vehicles - - - - 45,000 Total 5,495 - - - 45,000 Transfers 9103Transfer to General Capital Projects20,000 - 50,000 50,000 55,000 9104Transfer to General Capital Equip 254,000 - - -9176Transfer to Parks & Public Works 80,716 83,900 122,570 122,570 97,240 9202Transfer to Water & Sewer Fund - - 42,280 42,280 43,310 Total 354,716 83,900 214,850 214,850 195,550 Parks & Recreation-Facilities Expenditures1,337,319 $ 1,070,000 $ 1,346,680 $ 1,248,720 $ 1,538,030 $
Page 109
General Fund - Parks & Recreation - Facilities (101-4-091)
Parks & Recreation – Community Center
DIVISION MISSION AND DESCRIPTION
The mission of the Parks & Recreation-Community Center division is to enhance the quality of life through the management, maintenance, and scheduling of events and recreational programs at the historic T. B. Harris Community Center. The duties of this division include facilitating and organizing the Belton Youth Advisory Commission programs.
DIVISION GOALS AND ACTION ITEMS FOR FY 2024
Strategic Plan priorities addressed below: Quality of Life, Parks and Natural Beauty
Goal: Enhance the parks system through Harris Community Center upgrades and increasing Harris Community Center rentals
Action Item: Improve functionality of the building with the addition of digital information boards, park art, and projector screens
Goal: Deliver outstanding customer service that meets the needs of renters
Action Item: Answer questions in a consistent manner and improve communication through electronic means
Goal: Maintain and operate an exceptionally clean and functional facility
Action Item: Establish cleaning procedures, schedule routine maintenance, organize supplies, and maintain technology
SIGNIFICANT CHANGES IN THE FY 2024 BUDGET
Small equipment expenditures increase to replace blinds throughout the Harris Community Center
Appropriations for building maintenance decrease after interior projects were completed or deferred last year
Capital outlay falls after replacing Harris Community Center windows during FY 2023
FY 2022FY 2023FY 2023FY 2024 WORKLOAD MEASURES ACTUALBUDGET ESTIMATE BUDGET Number of private and public events scheduled 700 750 825 825 Number of days with one program or event 275 320 275 275 Number of recreation classes 70 110 120 120 PERFORMANCE
Percentage change in number of private events scheduled 7% 7%10% 0% Percentage change in number of days with one program 5% 7%-14% 0% Percentage change in number of recreation classes 0%57% 9% 0% PERSONNEL Event Coordinator 1.00 1.00 1.00 1.00 Maintenance Technician I 0.50 0.50 0.50 0.50 Total Employees (Full-Time Equivalents) 1.50 1.50 1.50 1.50 Page 110
MEASURES
General Fund - Parks & Recreation - Community Center (101-4-092)
Account FY 2021FY 2022FY 2023FY 2023FY 2024 Number Account Name ActualActualBudgetEstimatedBudget Personnel 1010Salaries and Wages 78,740 $ 51,677 $ 62,960 $ 60,000 $ 63,660 $ 1210TMRS 8,511 5,429 6,630 4,900 6,950 1220 FICA 5,880 3,841 4,820 3,730 4,870 1230Employee Insurance9,783 7,658 8,210 9,360 13,660 1240Workers' Comp. Insurance1,036 1,336 1,090 1,870 2,070 1250Unemployment Compensation705 77 270 50 180 Total 104,655 70,018 83,980 79,910 91,390 Supplies 2010Office Supplies 511 382 450 445 700 2030Chemical Supplies 219 310 400 400 400 2070Janitorial Supplies 4,363 6,133 6,400 6,600 6,700 2090Tools and Other Supplies 739 1,735 1,590 1,550 3,290 2220Fuel 199 348 510 230 250 2400Clothing 199 117 250 140 300 2500Small Equipment 4,041 - 15,000 15,000 23,700 Total 10,271 9,025 24,600 24,365 35,340 Maintenance 3010Building 2,854 2,937 18,500 4,300 5,000 4020Machinery and Equipment 149 - 250 170 300 Total 3,003 2,937 18,750 4,470 5,300 Services 5010Marketing 1,241 1,271 1,150 1,165 2,450 5100Dues and Publications 123 46 320 300 150 5130 Travel and Training 499 604 2,180 1,500 2,180 5340Building Maintenance Services 50,332 54,040 66,260 66,260 68,820 5341Info Tech Services 34,817 18,780 9,530 9,530 12,950 5500General Liability 4,537 4,899 5,300 5,622 6,740 5820Gas Service 3,496 4,786 4,500 6,080 7,000 5830Electric Service 7,287 9,005 8,500 9,940 10,500 Total 102,332 93,431 97,740 100,397 110,790 Capital Outlay 8200Machinery and Equipment - - 120,000 118,600Total - - 120,000 118,600Parks-Community Center Expenditures220,261 $ 175,411 $ 345,070 $ 327,742 $ 242,820 $
Page 111
Parks & Recreation – Recreation
DIVISION MISSION AND DESCRIPTION
The mission of the Parks & Recreation-Recreation division is to enhance the quality of life through the development, implementation, and oversight of recreation and leisure activities at city park facilities. Responsibilities include verifying the condition of facilities; coordinating special events within City parks; and leasing facilities other than the Harris Center
DIVISION GOALS AND ACTION ITEMS FOR FY 2024
Strategic Plan categories addressed below: Quality of Life, Parks and Natural Beauty
Goal: Implement the Belton Parks & Recreation Strategic Plan
Action Item: Pursue expanded programming and events for youth including disc golf, pickleball, hiking, and archery
Goal: Increase opportunities to volunteer and participate in the Legacy Program
Action Item: Work with the Youth Advisory Commission and other local agencies to develop ways to volunteer service
Goal: Increase awareness of City of Belton recreation programs and offerings
Action Item: Expand community outreach and seek public input through social media and City of Belton website
SIGNIFICANT CHANGES IN THE FY 2024 BUDGET
Appropriations for wages, taxes, and retirement increase to account for growth in salaries
Travel and training expenditures increase to provide leadership training and certification opportunities for employees
Appropriations for events rise with the addition of a mother and son event
PERFORMANCE MEASURES
FY 2022FY 2023FY 2023FY 2024 WORKLOAD MEASURES ACTUALBUDGET ESTIMATE BUDGET Number of recreation programs scheduled 80 85 85 95 Number of events 40 50 45 50 Number of social media followers 3,700 4,200 5,000 5,500
Percentage change in number of recreation programs 6% 6% 0%11% Percentage change in number of events 25%25%-10%10% Percentage change in number of social media followers 14%14%19%10% PERSONNEL Director of Parks & Recreation 1.00 - -Recreation Superintendent - 1.00 1.00 1.00 Recreation Coordinator 1.00 1.00 1.00 1.00 Total Employees (Full-Time Equivalents) 2.00 2.00 2.00 2.00 Page 112
General Fund - Parks & Recreation - Recreation (101-4-093)
Account FY 2021FY 2022FY 2023FY 2023FY 2024 Number Account Name ActualActualBudgetEstimatedBudget Personnel 1010Salaries and Wages 107,464 $ 81,151 $ 122,100 $ 105,000 $ 130,090 $ 1210TMRS 9,952 7,239 10,930 9,300 12,200 1220FICA 8,069 6,098 9,350 8,250 9,960 1230Employee Insurance10,907 9,403 16,730 6,700 6,850 1240Workers' Comp. Insurance1,411 1,336 520 225 610 1250Unemployment Compensation862 81 410 90 270 Total 138,665 105,308 160,040 129,565 159,980 Supplies 2010Office Supplies286 199 400 350 900 2090Tools and Other Supplies267 4,515 2,350 3,500 2,600 2100Recreational Programming2,724 1,683 7,150 1,800 5,000 2120Promotional Materials and Prizes1,753 1,485 3,800 1,800 3,300 2400Clothing171 217 490 250 590 2600Postage39 26 100 70 100 Total5,240 8,125 14,290 7,770 12,490 Services 5010Marketing5,387 3,502 5,400 4,200 6,600 5100Dues and Publications340 196 490 800 950 5130Travel and Training1,747 2,023 6,000 6,000 10,700 5300Events17,831 16,481 22,800 19,000 24,000 5341Info Tech Services13,817 7,110 9,540 9,530 10,070 5500General Liability 346 366 400 450 520 Total 39,468 29,678 44,630 39,980 52,840 Parks-Recreation Expenditures183,373 $ 143,111 $ 218,960 $ 177,315 $ 225,310 $
Page 113
Planning
DIVISION MISSION AND DESCRIPTION
The Planning division addresses the immediate and long-term needs of the community by enhancing the quality of the City’s natural and built environments through the implementation of the comprehensive plan, zoning ordinance, subdivision ordinance, and design standards. The duties of this division include coordinating and updating the City’s master plans, reviewing subdivision plats, site plans, certificates of appropriateness, and zoning cases; monitoring development; maintaining records of land use; and collecting, maintaining, and mapping geospatial information for all City departments
DIVISION GOALS AND ACTION ITEMS FOR FY 2024
Strategic Plan priorities addressed below: Governance, Quality of Life, Connectivity
Goal: Ensure guiding documents are updated and relevant to support orderly and responsible development throughout the City
Action Item: Review development codes and recommend amendments as necessary
Goal: Provide GIS data and technology support for major initiatives
Action Item: Maintain a database of land-related inventories, including land use, zoning, rights of way and annexation agreements
Goal: Deliver exceptional customer service
Action Item: Understand the desired outcomes of developers, applying codes to help them through the development process
SIGNIFICANT CHANGES IN THE FY 2024 BUDGET
One Planning Technician position has been added to enhance customer service
Information technology services costs decrease due to changes to the cost allocation schedule for FY 2024
Appropriations for consulting decrease after completion of the historic preservation study during FY 2023
Transfers to TDHCA Housing Rehab reflects contributions towards HOME grant programs
PERFORMANCE MEASURES
FY 2022FY 2023FY 2023FY 2024 WORKLOAD MEASURES ACTUALBUDGET ESTIMATE BUDGET Number of subdivision plats received 39 45 45 45 Number of zoning cases received 46 40 40 40 Number of maps created 358 300 325 350
Percent of maps completed by requested deadline 100%100%100%100% Percent of first submittal reviews completed within 10 days 80%90%90%90% Percent of follow-up reviews completed within 5 days 80%90%90%90% PERSONNEL Planning Director 1.00 1.00 1.00 1.00 Planner 1.00 1.00 1.00 1.00 GIS Analyst 1.00 1.00 1.00 1.00 Planning Administrator - 1.00 1.00 1.00 Planning Technician 1.75 0.75 1.00 2.00 Total Employees (Full-Time Equivalents) 4.75 4.75 5.00 6.00 Page 114
General Fund - Planning (101-4-101)
Account FY 2021FY 2022FY 2023FY 2023FY 2024 Number Account Name ActualActualBudgetEstimatedBudget Personnel 1010Salaries and Wages 117,089 $ 155,649 $ 300,910 $ 320,110 $ 369,030 $ 1210TMRS 11,994 16,354 31,650 33,770 40,260 1220 FICA 8,454 11,356 23,020 23,650 28,240 1230Employee Insurance11,756 16,177 47,320 32,020 41,890 1240Workers' Comp. Insurance199 496 590 750 820 1250Unemployment Compensation 595 38 680 200 540 Total 150,087 200,070 404,170 410,500 480,780 Supplies 2010Office Supplies 959 809 1,800 2,500 1,800 2090Tools and Other Supplies 340 1,747 1,200 1,080 1,200 2400Clothing 38 - - -2600Postage 727 763 850 1,280 1,200 Total 2,064 3,319 3,850 4,860 4,200 Services 5000Public Notices 1,179 1,416 1,500 2,600 1,500 5010Marketing - - 600 -5100Dues and Publications 785 930 1,100 1,750 2,120 5130Travel and Training 651 3,046 8,400 6,000 10,380 5341Info Tech Services 17,271 17,780 59,220 59,220 49,170 5500General Liability 822 869 950 1,070 1,220 5630Consulting 75 4,820 31,700 41,320 16,700 5700Special Services 2,500 - - -Total 23,283 28,861 103,470 111,960 81,090 Transfers 9103Transfer to General Capital Projects - - 10,000 -9129Transfer to TDHCA Housing Rehab - - - 30,000 92,250 Total - - 10,000 30,000 92,250 Planning Expenditures175,434 $ 232,250 $ 521,490 $ 557,320 $ 658,320 $
Page 115
Inspections
DIVISION MISSION AND DESCRIPTION
The mission of the Inspections division is to enforce the City’s building, plumbing, electrical, mechanical, and energy codes to ensure the construction and maintenance of safe residential and commercial structures. Responsibilities include reviewing plans, issuing permits, inspecting construction, and removing unsafe structures through rehabilitation or condemnation.
DIVISION GOALS AND ACTION ITEMS FOR FY 2024
Strategic Plan priorities addressed below: Governance, Quality of Life
Goal: Ensure proposed developments meet all development requirements
Action Item: Support training opportunities to ensure staff obtain, maintain, and enhance licenses and certifications
Goal: Ensure existing structures are safe and meet all building and City codes
Action Item: Work with property owners to proactively address structures that do not meet the Property Maintenance Code
Goal: Deliver exceptional customer service
Action Item: Seek ways to improve the process for permit applications, permit issuance, and project completion
SIGNIFICANT CHANGES IN THE FY 2024 BUDGET
Information technology services costs increase due to changes to the cost allocation schedule for FY 2024
Appropriations for special services increase to continue third-party inspections of property
Appropriations for demolition and cleanup decrease to reflect historical spending
Transfers for equipment replacement increase due to rising costs for replacement vehicles
PERFORMANCE MEASURES
FY 2022FY 2023FY 2023FY 2024 WORKLOAD MEASURES ACTUALBUDGET ESTIMATE BUDGET Number of commercial plan reviews completed 91 150 180 150 Number of residential plan reviews completed 1,674 1,600 1,864 2,000 Number of inspections completed 5,629 5,300 5,664 5,700
Percent of inspections completed as scheduled 95%95%95%100% Percent of special permits/inspections completed in 24 hrs 100%100%100%100% Percent of first submittal plan completed within 7 days 95%95%95%100% PERSONNEL Building Official 1.00 1.00 1.00 1.00 Building Inspector 2.00 2.00 2.00 2.00 Total Employees (Full-Time Equivalents) 3.00 3.00 3.00 3.00 Page 116
General Fund - Inspections (101-4-102)
Account FY 2021FY 2022FY 2023FY 2023FY 2024 Number Account Name ActualActualBudgetEstimatedBudget Personnel 1010Salaries and Wages 201,270 $ 167,365 $ 200,440 $ 180,000 $ 182,730 $ 1210TMRS 20,599 17,577 21,090 19,200 19,940 1220FICA 15,225 12,681 15,340 14,200 13,980 1230Employee Insurance15,206 14,106 19,230 17,700 22,070 1240Workers' Comp. Insurance607 800 820 987 1,380 1250Unemployment Compensation932 27 410 120 270 Total 253,839 212,556 257,330 232,207 240,370 Supplies 2010Office Supplies752 1,237 750 1,280 800 2090Tools and Other Supplies586 792 1,000 700 900 2220Fuel3,281 4,462 4,240 4,220 4,440 2400Clothing913 235 1,150 800 1,150 2500Small Equipment- - 160 -2600Postage386 254 500 180 500 Total5,918 6,980 7,800 7,180 7,790 Services 5000Public Notices127 - 560 50 250 5100Dues and Publications392 2,284 500 500 700 5110License & Certification385 546 1,000 330 740 5130Travel and Training1,974 3,347 6,600 3,370 7,690 5341Info Tech Services20,726 21,330 35,120 35,120 41,260 5500General Liability 1,868 1,845 2,000 1,880 2,240 5700Special Services 184 37,910 46,000 88,000 53,400 5710Demolition and Cleanup - 13,005 27,200 - 13,600 5731Payment Processing Fees 11,066 17,836 21,000 10,000 21,000 Total 36,722 98,103 139,980 139,250 140,880 Transfers 9176Transfer to Equipment Replacement 8,802 9,070 7,330 7,330 30,170 Total 8,802 9,070 7,330 7,330 30,170 Inspections Expenditures305,281 $ 326,709 $ 412,440 $ 385,967 $ 419,210 $
Page 117
Library
DIVISION MISSION AND DESCRIPTION
Belton’s Lena Armstrong Public Library connects and engages the community through education, access, and inspiration. This division provides physical and electronic books, computer access, and office services to the public; serves in an archival capacity by collecting and preserving local history; coordinates community interaction through Christmas and summer reading programs; and partners with the local school district to promote early literacy.
DIVISION GOALS AND ACTION ITEMS FOR FY 2024
Strategic Plan categories addressed below: Quality of Life
Goal: Ensure the Lena Armstrong Public Library and its collection of materials meet the needs of a diverse and growing community
Action Item: Review the needs assessment and architect proposal to identify opportunities for incorporating some of its components
Goal: Create a vibrant gathering place for the community
Action Item: Coordinate with the school district to display student art and other projects
Goal: Provide exceptional customer service
Action Item: Continue implementation of Advancing Family Engagement in Libraries to provide programming for families
SIGNIFICANT CHANGES IN THE FY 2024 BUDGET
Employee insurance expenditures decrease due to the selection of coverage by employees
Appropriations for materials in electronic format decrease to reflect historical spending
Building maintenance and info tech services reflect changes to the cost allocation schedule for FY 2024
PERFORMANCE MEASURES
FY 2022FY 2023FY 2023FY 2024 WORKLOAD MEASURES ACTUALBUDGET ESTIMATE BUDGET Number of visitors per year 40,251 41,000 41,000 42,500 Number of volumes 30,423 35,000 32,500 33,000 Number of items catalogued and processed 2,765 2,900 2,700 2,750
Turnover rate (circulation / number of volumes) 2.9 2.4 2.8 2.9 Adult and young adult circulation 32,90430,00035,00038,000 Children's circulation 52,90642,00060,00070,000 PERSONNEL Library Director 1.00 1.00 1.00 1.00 Children's Library Clerk 1.00 1.00 1.00 1.00 Library Clerk I 3.00 3.00 3.00 3.00 Total Employees (Full-Time Equivalents) 5.00 5.00 5.00 5.00 Page 118
General Fund - Library (101-4-110)
Account FY 2021FY 2022FY 2023FY 2023FY 2024 Number Account Name ActualActualBudgetEstimatedBudget Personnel 1010Salaries and Wages 214,542 $ 220,747 $ 247,050 $ 230,600 $ 242,760 $ 1210TMRS 21,757 23,194 25,460 24,500 26,480 1220 FICA 15,899 16,787 18,520 17,700 18,580 1230Employee Insurance16,049 15,057 17,980 15,800 15,670 1240Workers' Comp. Insurance462 432 550 680 950 1250Unemployment Compensation 1,421 216 680 80 450 Total 270,130 276,433 310,240 289,360 304,890 Supplies 2010Office Supplies 1,322 1,568 1,730 2,000 2,000 2050Education Supplies 5,068 9,354 6,500 6,800 6,500 2090Tools and Other Supplies 5,753 6,174 6,750 6,000 9,600 2400Clothing 38 - - -2600Postage 486 668 710 1,100 1,000 2700Print Materials 34,040 29,765 36,000 36,000 36,000 2720Materials in Electronic Format 10,283 10,045 15,500 11,000 12,500 2740Other Materials (Audiovisual) 4,959 6,467 6,000 6,300 6,000 Total 61,949 64,041 73,190 69,200 73,600 Services 5010Marketing 446 622 700 600 1,200 5100Dues and Publications 2,286 1,969 3,140 2,500 3,140 5130Travel and Training 2,257 1,960 3,960 3,800 3,960 5340Building Maintenance Services 39,141 44,220 54,220 54,220 56,320 5341Info Tech Services 99,072 94,710 36,040 36,040 38,490 5500General Liability 3,015 3,272 3,540 3,840 4,550 5820Gas Service 1,261 1,655 1,730 1,620 1,870 5830Electric Service 4,987 6,318 4,680 5,740 6,130 Total 152,465 154,726 108,010 108,360 115,660 Library Expenditures484,544 $ 495,200 $ 491,440 $ 466,920 $ 494,150 $
Page 119
Other Costs
DIVISION MISSION AND DESCRIPTION
The Other Costs division contains funding for several non-departmental items, including contributions to several non-profit organizations and funding for contingencies that may occur during the fiscal year. The division also accounts for anticipated pay adjustments for employees Because this division performs no activity, the various goals, measures, and personnel are not listed. The expenditures previously reported here have been transferred into other divisions beginning in FY 2022.
DIVISION GOALS AND ACTION ITEMS FOR FY 2024
Strategic Plan categories addressed below: N/A
Goal: N/A
Action Item: N/A
Goal: N/A
Action Item: N/A
Goal: N/A
Action Item: N/A
SIGNIFICANT CHANGES IN THE FY 2024 BUDGET
N/A
PERFORMANCE MEASURES
FY 2022FY 2023FY 2023FY 2024 WORKLOAD MEASURES ACTUALBUDGET ESTIMATE BUDGET N/A N/A N/A N/A N/A N/A N/A N/A N/A N/A N/A N/A N/A N/A N/A
N/A N/A N/A N/A N/A N/A N/A N/A N/A N/A N/A N/A N/A N/A N/A Page 120
Account FY 2021FY 2022FY 2023FY 2023FY 2024 Number Account Name ActualActualBudgetEstimatedBudget Other Expenses 7600Contributions 170,451 - - -7700Contingency 269,655 - - -Total 440,106 - - -Other Costs Expenditures440,106 $ - $ - $ - $ - $
Page 121
General Fund - Other Costs (101-4-120)
Solid Waste
DIVISION MISSION AND DESCRIPTION
The mission of the Solid Waste division is to provide garbage and residential brush collection services in a timely, professional, and efficient manner. Duties include the collection of garbage, recyclables, brush, and limbs from properties throughout the City; implementing a route-based system for brush collection; and educating citizens of the availability of brush collection through videos, door hangers, and water bills. Since 1992, the City has contracted with a private firm for garbage collection services.
DIVISION GOALS AND ACTION ITEMS FOR FY 2024
Strategic Plan categories addressed below: Governance, Quality of Life
Goal: Provide reliable weekly collection of garbage, brush, and recyclable materials for residential customers
Action Item: Monitor third-party collection and proactively maintain City vehicles to ensure continuous brush truck operations
Goal: Educate residents on the weekly brush collection and regular bulk collection operations
Action Item: Distribute flyers in utility bills and promote the program on social media
Goal: Adopt a sustainable fee for operations
Action Item: Monitor route operations for maximum efficiency and effectiveness
SIGNIFICANT CHANGES IN THE FY 2024 BUDGET
Appropriations for wages, taxes, and retirement increase to account for growth in salaries
Fuel expenditures increase due to higher prices paid for fuel consumption
Expenditures for refuse collection increase due to a greater number of customers and higher cost for service
FY 2022FY 2023FY 2023FY 2024 WORKLOAD MEASURES ACTUAL BUDGET ESTIMATE BUDGET Cubic yards of brush collected 27,000 30,000 27,000 28,000 Number of households served 8,300 8,000 8,200 8,800 Number of special or fee brush stops 50 65 65 65
Response to brush work orders within 7 business days 85%80%80%80% Percentage increase in volume of brush collected 4% 3% 3% 0% Percentage increase in number of stops made 6%11% 3% 7% PERSONNEL Maintenance Technician II 1.00 1.00 1.00 1.00 Total Employees (Full-Time Equivalents) 1.00 1.00 1.00 1.00 Page 122
PERFORMANCE MEASURES
General Fund - Solid Waste (101-4-132)
Account FY 2021FY 2022FY 2023FY 2023FY 2024 Number Account Name ActualActualBudgetEstimatedBudget Personnel 1010 Administrative Salaries 63,541 $ 80,565 $ 37,970 $ 37,900 $ 41,310 $ 1070Overtime Pay - - - 150 150 1210TMRS 6,515 8,463 4,000 4,100 4,530 1220 FICA 4,725 5,904 2,910 2,910 3,160 1230Employee Insurance10,574 13,062 8,520 7,100 7,360 1240Workers' Comp. Insurance1,446 1,308 1,460 1,715 1,790 1250Unemployment Compensation426 47 140 20 90 Total 87,227 109,349 55,000 53,895 58,390 Supplies 2010Office Supplies 307 - - -2090Tools and Other Supplies 163 489 1,060 5001,060 2220Fuel 9,072 15,029 11,490 13,790 14,480 2400Clothing 750 644 1,130 1,000 1,130 Total 10,292 16,162 13,680 15,290 16,670 Services 5000Public Notices 524 565 1,300 600 600 5130Travel and Training 36 - - -5500General Liability 1,614 1,628 1,760 1,668 1,970 5920Refuse Collection Contract 1,407,515 1,556,935 1,722,200 1,800,000 1,980,000 5940Tipping/Hauling Fees 4,605 - 5,000 5,600 5,000 Total 1,414,294 1,559,128 1,730,260 1,807,868 1,987,570 Transfers 9160Transfer to Grant Fund 43 - - -9176Transfer to Equipment Replacement33,919 61,570 20,540 20,540 26,500 9202Transfer to Water & Sewer Fund - - 44,570 44,570 45,830 Total 33,962 61,570 65,110 65,110 72,330 Solid Waste Expenditures1,545,775 $ 1,746,209 $ 1,864,050 $ 1,942,163 $ 2,134,960 $
Page 123
Fleet Maintenance
DIVISION MISSION AND DESCRIPTION
The Fleet Maintenance division extends the usable life and ensures the safe operation of City equipment and vehicles by performing major and minor repairs; providing routine maintenance; fabricating steel products; and assisting other departments with logistics and delivery of services for various events and projects.
DIVISION GOALS AND ACTION ITEMS FOR FY 2024
Strategic Plan categories addressed below: Governance, Quality of Life
Goal: Reduce costs for external fleet maintenance on City-owned vehicles and equipment
Action Item: Train staff and implement new computer-based diagnostic software to keep more maintenance in-house
Goal: Support staff by providing safe, reliable equipment and vehicles for City operations
Action Item: Prioritize work orders and reduce downtime to two days or less
Goal: Address capital equipment needs
Action Item: Evaluate vehicle and equipment replacement plans twice per year for proactive and sustainable planning
SIGNIFICANT CHANGES IN THE FY 2024 BUDGET
Appropriations for wages, taxes, and retirement increase to account for growth in salaries
Vehicle maintenance expenditures increase to reflect rising costs for labor and materials
Transfers for equipment replacement increase due to rising costs for replacement vehicles
PERFORMANCE MEASURES
FY 2022FY 2023FY 2023FY 2024 WORKLOAD MEASURES ACTUAL BUDGET ESTIMATE BUDGET Number of work orders completed 1,194 1,200 1,200 1,200 Number of city vehicles maintained 104 92 95 100 Number of pieces of equipment maintained 127 130 130 135
Response to work orders within one day of receipt 100%100%100%100% Percentage of repairs completed within 2 working days 92%90%90%90% Percentage of repairs completed in-house 91%90%90%90% PERSONNEL Shop Superintendent 1.00 1.00 1.00 1.00 Senior Mechanic 1.00 1.00 1.00 1.00 Mechanic 2.00 2.00 2.00 2.00 Total Employees (Full-Time Equivalents) 4.00 4.00 4.00 4.00 Page 124
Account FY 2021FY 2022FY 2023FY 2023FY 2024 Number Account Name ActualActualBudgetEstimatedBudget Personnel 1010Salaries and Wages 176,304 $ 181,655 $ 196,460 $ 197,500 $ 212,480 $ 1070Overtime Pay 932 271 600 900 1,500 1210TMRS 17,825 19,127 20,730 21,400 22,430 1220FICA 12,219 12,659 15,030 14,300 15,720 1230Employee Insurance19,784 30,509 39,490 34,000 33,530 1240Workers' Comp. Insurance2,567 3,323 3,910 4,340 5,000 1250Unemployment Compensation1,021 99 540 120 360 Total 230,652 247,643 276,760 272,560 291,020 Supplies 2010Office Supplies226 120 - -2030Chemical Supplies2,158 1,811 2,950 1,700 2,950 2090Tools and Other Supplies4,211 4,781 3,930 5,400 4,930 2220Fuel1,737 2,869 2,070 2,660 2,800 2400Clothing2,646 3,101 3,000 4,000 3,500 2500Small Equipment5,324 4,198 6,000 5,221 7,100 Total16,302 16,880 17,950 18,981 21,280 Maintenance 4020Machinery and Equipment1,066 4,264 1,500 4,000 3,500 4030Vehicle124,034 152,779 124,000 171,000 160,000 Total125,100 157,043 125,500 175,000 163,500 Services 5100Dues and Publications40 110 110 110 110 5110License & Certification101 190 230 150 410 5130 Travel and Training 618 2,306 4,580 3,500 4,580 5340Building Maintenance Services 77,160 87,170 26,720 26,720 27,750 5341Info Tech Services 17,271 17,780 15,600 15,600 15,680 5500General Liability 2,943 2,989 3,230 3,246 3,870 5820Gas Service 1,660 2,192 - -5830Electric Service 1,789 2,381 1,650 2,070 2,250 Total 101,582 115,118 52,120 51,396 54,650 Transfers 9160Transfer to Grant Fund 268 - - -9176Transfer to Equipment Replacement 6,931 7,140 5,750 5,750 11,300 9202Transfer to Water & Sewer Fund - - 8,460 8,460 8,670 Total 7,199 7,140 14,210 14,210 19,970 Fleet Maintenance Expenditures480,835 $ 543,824 $ 486,540 $ 532,147 $ 550,420 $
Page 125
General Fund - Fleet Maintenance (101-4-141)
Engineering
DIVISION MISSION AND DESCRIPTION
The City contracts with a private firm for much of its engineering services. The Engineering division contains the funding for this contract as well as funding for a portion of City personnel costs for those employees who support the contractor in the oversight of projects Because the scope of work that is performed by this division is primarily determined by specific projects, the various goals, measures, and personnel are not listed This division is being eliminated in FY 2023 with costs assigned to other departments and projects.
DIVISION GOALS AND ACTION ITEMS FOR FY 2024
Strategic Plan categories addressed below: N/A
Goal: N/A
Action Item: N/A
Goal: N/A
Action Item: N/A
Goal: N/A
Action Item: N/A
SIGNIFICANT CHANGES IN THE FY 2024 BUDGET
N/A
PERFORMANCE MEASURES
FY 2022FY 2023FY 2023FY 2024 WORKLOAD MEASURES ACTUAL BUDGET ESTIMATE BUDGET N/A N/A N/A N/A N/A N/A N/A N/A N/A N/A N/A N/A N/A N/A N/A
N/A N/A N/A N/A N/A N/A N/A N/A N/A N/A N/A N/A N/A N/A N/A Page 126
Account FY 2021FY 2022FY 2023FY 2023FY 2024 Number Account Name ActualActualBudgetEstimatedBudget Personnel 1010Salaries and Wages 97,137 $ 76,627 $ - $ - $ - $ 1210TMRS 9,581 8,076 - -1220FICA 7,021 5,714 - -1230Employee Insurance 4,202 8,768 - -1240Workers' Comp. Insurance 719 - - -1250Unemployment Compensation 270 10 - -Total 118,930 99,195 - -Services 5620Engineering 27,049 54,891 - -Total 27,049 54,891 - -Engineering Expenditures145,979 $ 154,086 $ - $ - $ - $ General Fund - Engineering (101-4-150) Page 127
Page 128
Overview
DebtServiceFundisusedforpaymentoftheCity'slong-termdebt. Bondobligationshavebeenusedtopurchaseparkland,parkimprovements, streetandsidewalkimprovements,bridges,PoliceDepartmentexpansion, andtrafficimprovementprojects. Belowarejustafewoftheprojectsthat havebeenfunded.
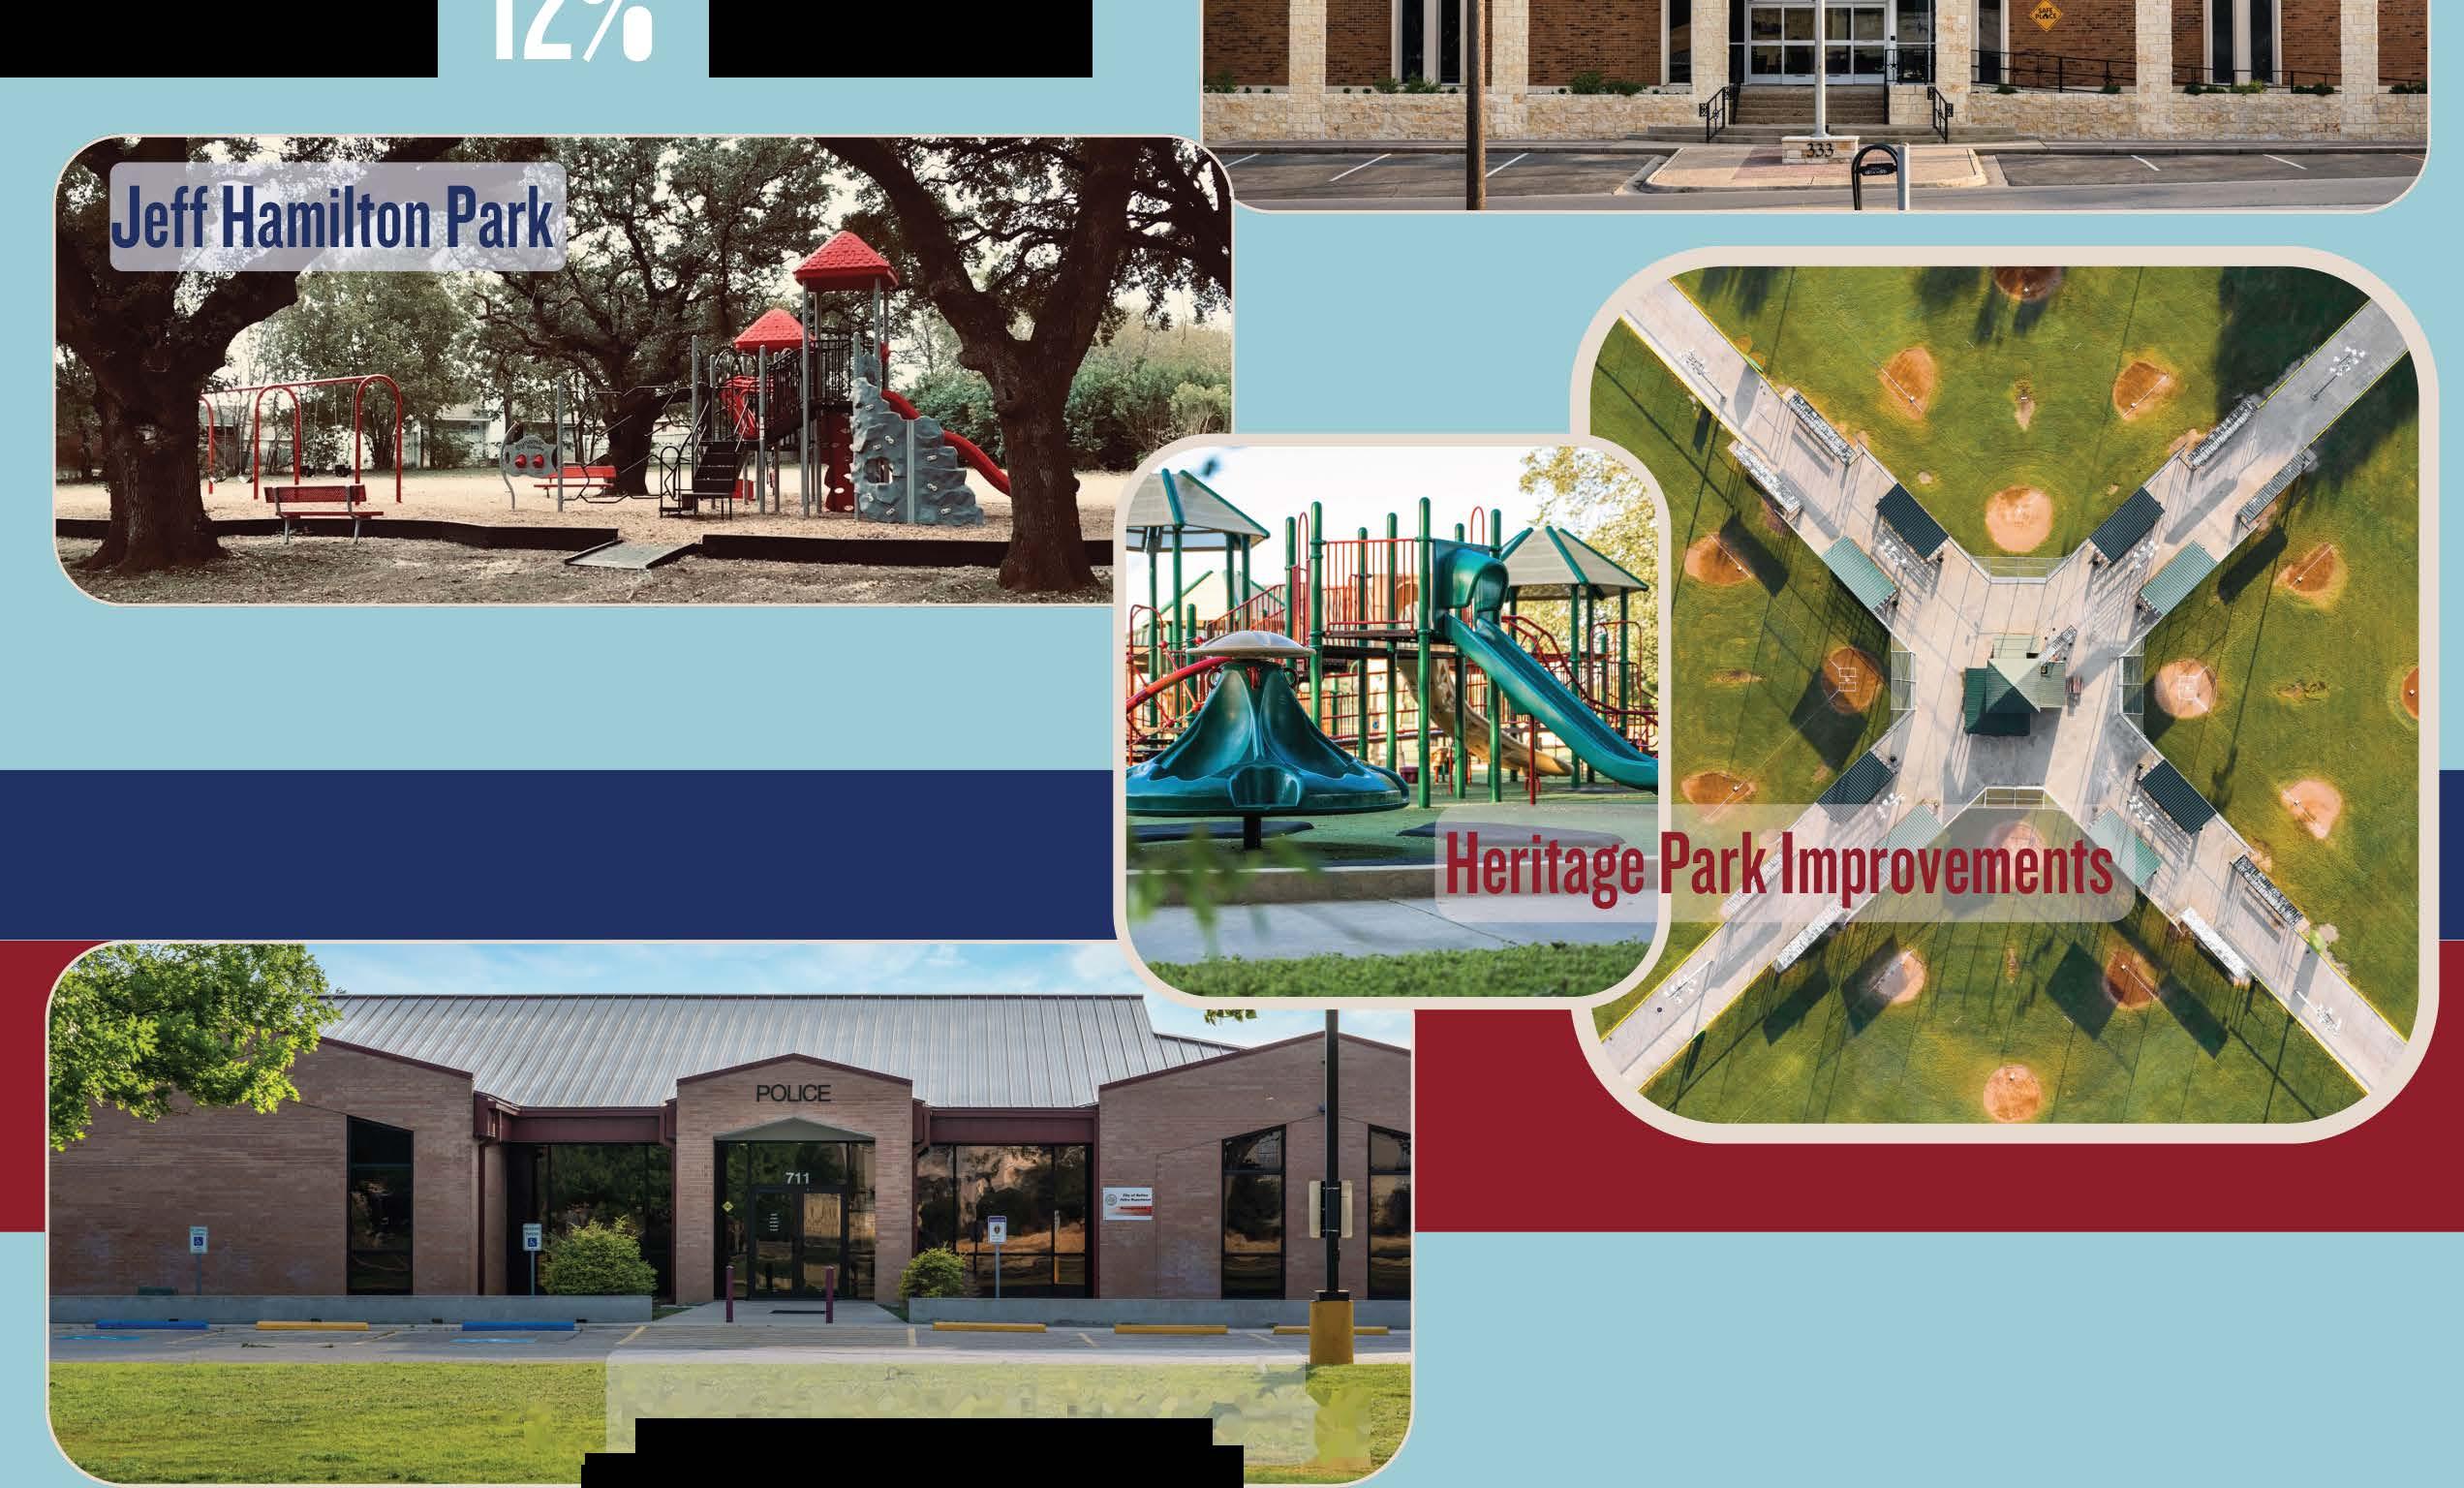


FireStation2 DebtServiceis I 1 PropertyTaxRate ' -��- PoliceDepartmentExpansion:5., CityHallRenovation_·
Debt Service Fund Overview
The Debt Service Fund is used for the accumulation of resources for the payment of the City's general long-term debt.
Payment of current year general debt obligations is provided by a dedicated portion of current year property tax collections. The debt rate for FY 2024 is $0.0663 or twelve percent of the total tax rate of $0.5326 per $100 of taxable value.
Long-term debt at September 30, 2023 is comprised of the following debt issues:
All taxable property in the City of Belton is subject to the assessment, levy and collection by the City of an annual ad valorem tax levied, within the limits prescribed by law, sufficient to provide for the payment of principal and interest on debt issued by the government. Article XI, Section 5, of the Texas Constitution is applicable to the City, and limits its maximum ad valorem tax rate to $2.50 per $100 of assessed valuation for all City purposes. The City operates under a Home-Rule Charter, which limits the tax rate to $1.90 per $100 of assessed valuation for all City purposes. Administratively, the Attorney General of the State of Texas will only permit the allocation of $1.50 of the $2.50 maximum rate for all general obligation debt service, as calculated at the time of issuance. The City's total tax rate of $0.5326 and debt rate of $0.0663 are well below the maximum rates that are allowed by law.
Description Principal General Obligation Bonds, Series 2005290,000 General Obligation Refunding Bonds, Series 2017690,000 General Obligation Refunding Bonds, Series 20194,330,000 Total General Obligation Bonds5,310,000 $ Certificates of Obligation, Series 2008486,338 $ Certificates of Obligation, Series 2015 700,000 Certificates of Obligation, Series 2018 2,030,000 Total Certficates of Obligation 3,216,338 $ Total General Long-Term Debt 8,526,338 $
2023 (FY 2024) Total Assessed Value 2,183,716,392 $ Limit on Amount Designated for Debt Service $1.50 per $100 Legal Debt Limit 32,755,746 $ FY 2024 Debt Service Paid with Property Taxes 1,205,260 $ Percentage of Debt Service Limit 3.68%
Page 130
Debt Service Fund Statement of Fund Balance
Actual ActualBudgetEstimatedProjected Fiscal Year Ending September 30 2021 2022 2023 2023 2024 Budget Basis: Beginning Restricted Fund Balance (GAAP) 30,513 $ 74,204 $ 11,541 $ 11,541 $ 27,744 $ Revenues 1 1,219,325 1,116,878 1,210,150 1,212,483 1,251,020 Expenditures (1,175,634) (1,179,541) (1,196,380) (1,196,280) (1,205,260) Net Increase / (Decrease) in Fund Balance 43,691 (62,663) 13,770 16,203 45,760 Ending Restricted Fund Balance (Budget) 74,204 $ 11,541 $ 25,311 $ 27,744 $ 73,504 $ Reconciliation to GAAP: Ending Restricted Fund Balance (Budget) 74,204 $ 11,541 $ 25,311 $ 27,744 $ 73,504 $ Adjustment 2 - - - -Restricted Fund Balance (GAAP) 74,204 11,541 25,311 27,744 73,504 Unassigned Fund Balance (GAAP) - - - -Assigned Fund Balance (GAAP) - - - -Non-Spendable Fund Balance (GAAP) - - - -Total Fund Balance (GAAP) 74,204 $ 11,541 $ 25,311 $ 27,744 $ 73,504 $ Notes: 1 Excludes Use of Prior Years' Fund Balance 2 An adjustment is made to restricted fund balance, if necessary, during the conversion from a budget basis to an accrual basis (GAAP).
$‐$10,000 $20,000 $30,000 $40,000 $50,000 $60,000 $70,000 $80,000 2021 Actual2022 Actual2023 Budget2023 Estimated 2024 Projected Fund Balance Fiscal Year Ending September 30 Fund Balance History Unassigned Fund Balance (GAAP) Assigned Fund Balance (GAAP) Restricted Fund Balance (GAAP) Non‐Spendable Fund Balance (GAAP) Page 131
Debt Service Fund (115-3) Revenues
Account FY 2021FY 2022FY 2023FY 2023FY 2024 Number Account Name ActualActualBudgetEstimatedBudget Property Taxes 1010Current Ad Valorem Taxes 1,418,518 $ 1,268,656 $ 1,423,040 $ 1,390,702 $ 1,447,810 $ 1030Delinquent Ad Valorem Taxes 13,969 10,809 11,160 4,651 10,000 1040Penalty & Interest 14,364 12,046 10,670 10,947 12,600 1060 Ad Valorem to TIRZ (228,179) (207,410) (235,550) (232,917) (250,670) Total 1,218,672 1,084,101 1,209,320 1,173,383 1,219,740 Miscellaneous Income 9100Interest Income 653 2,777 830 39,100 31,280 Total 653 2,777 830 39,100 31,280 Other Financing Sources 8101Transfer from General Fund - 30,000 - -Total - 30,000 - -Debt Service Fund Revenues1,219,325 $ 1,116,878 $ 1,210,150 $ 1,212,483 $ 1,251,020 $
Page 132
Debt Service Fund (115-4-015)
Account FY 2021FY 2022FY 2023FY 2023FY 2024 Number Account Name ActualActualBudgetEstimatedBudget Debt Service 6010Principal Payments 801,675 831,675 875,390 875,390 914,100 6020Interest Payments 367,706 340,982 312,790 312,790 282,960 6100Paying Agent Fees 1,142 8581,200 1,100 1,200 6110 Arbitrage Rebate Calculation Fees 5,111 6,026 7,000 7,000 7,000 Total 1,175,634 1,179,541 1,196,380 1,196,280 1,205,260 Debt Service Fund Expenditures1,175,634 $ 1,179,541 $ 1,196,380 $ 1,196,280 $ 1,205,260 $
Page 133
Debt Service Fund
Amortization Summary Grand Total - All Obligations PaymentPrincipalInterest Principal Balance 9/30/2023 8,526,338 $ FY 2024 1,197,049 914,100 282,949 7,612,238 FY 2025 1,198,571 947,812 250,759 6,664,426 FY 2026 1,198,555 981,525 217,030 5,682,901 FY 2027 1,199,424 1,015,238 184,186 4,667,663 FY 2028 1,152,674 1,002,663 150,011 3,665,000 FY 2029 1,044,400 930,000 114,400 2,735,000 FY 2030 1,037,050 955,000 82,050 1,780,000 FY 2031 588,400 535,000 53,400 1,245,000 FY 2032 587,350 550,000 37,350 695,000 FY 2033 585,850 565,000 20,850 130,000 FY 2034 68,900 65,000 3,900 65,000 FY 2035 66,950 65,000 1,950Grand Total 9,925,173 $ 8,526,338 $ 1,398,835 $ - $ Page 134
Purpose
Debt Service Fund
General Obligation Bonds, Series 2005
Proceeds from the sale of the Series 2005 General Obligation Bonds will be used for (i) constructing, improving and purchasing land for streets and related drainage facilities; (ii) for constructing, improving and purchasing land for storm drainage works and facilities; and (iii) for constructing, improving and purchasing land for municipal parks and recreational facilities.
Bond Amount $4,500,000 Date of Issue 8/1/2005 Interest Rate 3.54% Date of Maturity 8/1/2025
PaymentPrincipalInterest Principal Balance 9/30/2023 290,000 $ FY 2024 150,266 140,000 10,266 150,000 FY 2025 155,310 150,000 5,310Total 305,576 $ 290,000 $ 15,576 $ - $ Page 135
Debt Service Fund
Certificates of Obligation, Series 2008
Purpose Proceeds from the sale of the Series 2008 Certificates will be used for (i) constructing, improving, extending and upgrading City streets, bridges, sidewalks, intersections and other traffic improvements; (ii) constructing, improving and extending the City's waterworks and sewer system; and (iii) the payment of professional services in connection therewith.
Bond Amount $1,485,000 Date of Issue 8/1/2008 Interest Rate 4.19% Date of Maturity 8/1/2028
PaymentPrincipalInterest Principal Balance 9/30/2023 486,338 $ FY 2024 109,478 89,100 20,378 397,238 FY 2025 109,456 92,812 16,644 304,426 FY 2026 109,280 96,525 12,755 207,901 FY 2027 108,949 100,238 8,711 107,663 FY 2028 112,174 107,663 4,511Total 549,337 $ 486,338 $ 62,999 $ - $ Page 136
Purpose
Debt Service Fund
Certificates of Obligation, Series 2015
Proceeds from the sale of the Certificates will be used for (i) constructing, improving, extending, expanding, upgrading and/or developing City streets, bridges, sidewalks, intersections and other traffic improvement projects, any related drainage improvements (ii) constructing, improving, and/or extending the City's waterworks and sewer system; and (iii) the payment of professional services in connection therewith.
Bond Amount $1,070,000 Date of Issue 4/1/2015 Interest Rate 2.0% - 3.0% Date of Maturity 8/1/2035
PaymentPrincipalInterest Principal Balance 9/30/2023 700,000 $ FY 2024 69,950 50,000 19,950 650,000 FY 2025 73,950 55,000 18,950 595,000 FY 2026 72,850 55,000 17,850 540,000 FY 2027 66,200 50,000 16,200 490,000 FY 2028 69,700 55,000 14,700 435,000 FY 2029 68,050 55,000 13,050 380,000 FY 2030 66,400 55,000 11,400 325,000 FY 2031 74,750 65,000 9,750 260,000 FY 2032 72,800 65,000 7,800 195,000 FY 2033 70,850 65,000 5,850 130,000 FY 2034 68,900 65,000 3,900 65,000 FY 2035 66,950 65,000 1,950Total 841,350 $ 700,000 $ 141,350 $ - $ Page 137
Purpose
Debt Service Fund
General Obligation Refunding Bonds, Series 2017
Proceeds from the sale of the Bonds will be used for (i) refunding certain maturities of the City's outstanding obligations (specifically the Certificates of Obligation, Series 2007) to achieve a debt service savings, and (ii) paying the costs of issuing the Bonds.
Bond Amount $1,565,000 Date of Issue 5/31/2017 Interest Rate 1.05% - 2.10% Date of Maturity 8/1/2027
PaymentPrincipalInterest Principal Balance 9/30/2023 690,000 $ FY 2024 188,455 175,000 13,455 515,000 FY 2025 180,305 170,000 10,305 345,000 FY 2026 177,075 170,000 7,075 175,000 FY 2027 178,675 175,000 3,675Total 724,510 $ 690,000 $ 34,510 $ - $ Page 138
Purpose
Debt Service Fund
Certificates of Obligation, Series 2018
Proceeds from the sale of the Certificates will be used for (i) constructing, improving, renovating and/or equipping City parks, including the purchase of land for the expansion of Heritage Park and (ii) the payment of professional services in connection therewith.
Bond Amount $2,185,000 Date of Issue 7/19/2018 Interest Rate 3.0% - 5.0% Date of Maturity 8/1/2030
PaymentPrincipalInterest Principal Balance 9/30/2023 2,030,000 $ FY 2024 159,800 95,000 64,800 1,935,000 FY 2025 160,050 100,000 60,050 1,835,000 FY 2026 320,050 265,000 55,050 1,570,000 FY 2027 327,100 280,000 47,100 1,290,000 FY 2028 453,700 415,000 38,700 875,000 FY 2029 456,250 430,000 26,250 445,000 FY 2030 458,350 445,000 13,350Total 2,335,300 $ 2,030,000 $ 305,300 $ - $ Page 139
Purpose
Debt Service Fund
General Obligation Refunding Bonds, Series 2019
Proceeds from the sale of the Bonds will be used for (i) refunding certain maturities of the City's outstanding obligations (specifically the Certificates of Obligation, Series 2013) to achieve a debt service savings, and (ii) paying the costs of issuing the Bonds.
Bond Amount $4,796,000 Date of Issue 12/5/2019 Interest Rate 3.0% - 4.0% Date of Maturity 8/1/2033
PaymentPrincipalInterest Principal Balance 9/30/2023 4,330,000 $ FY 2024 519,100 365,000 154,100 3,965,000 FY 2025 519,500 380,000 139,500 3,585,000 FY 2026 519,300 395,000 124,300 3,190,000 FY 2027 518,500 410,000 108,500 2,780,000 FY 2028 517,100 425,000 92,100 2,355,000 FY 2029 520,100 445,000 75,100 1,910,000 FY 2030 512,300 455,000 57,300 1,455,000 FY 2031 513,650 470,000 43,650 985,000 FY 2032 514,550 485,000 29,550 500,000 FY 2033 515,000 500,000 15,000Total 5,169,100 $ 4,330,000 $ 839,100 $ - $ Page 140
Overview

Thehoteloccupancytaxwasestablishedin1959andgivenauthoritytomunicipalitiesinthe1970's. Thistaxwasinstitutedandrestrictedtopromote tourismandtheconvention/hotelindustry. BeltonisthankfultohavetheBellCountyExpocenterthatbringsmanyvisitorstoBelton. TheCityplans manyeventsforFY24including ChristmasontheChisholmTrail,4thofJulyevents,B4festivalandasolareclipseevent.


This fund accounts for:
Hotel/Motel Tax Fund Overview / Statement of Fund Balance
1.Revenues received from the Hotel Occupancy Tax as levied by ordinance 10885-1 at the rate of 7% of the room charge.
2.Expenditures as authorized by the Statute (Chapter 156, Tax Code) and approved by City Council to be considered as spent in a manner which directly enhances and promotes tourism and the convention and hotel industry, including:
a.Funding the establishment or improvement of a convention center
b.Paying the administrative costs for facilitating convention registration
c.Paying for tourism-related advertising and promotion of the City
d.Paying for bonds issued for these purposes
Excludes Use of Prior Years' Fund Balance
An adjustment is made to restricted fund balance, if necessary, during the conversion from a budget basis to an accrual basis (GAAP).
Actual ActualBudgetEstimatedProjected Fiscal Year Ending September 30 2021 2022 2023 2023 2024 Budget Basis: Beginning Restricted Fund Balance (GAAP) 341,218 $ 454,451 $ 605,962 $ 605,962 $ 816,320 $ Revenues 1 235,342 293,940 288,600 383,518 444,310 Expenditures (122,109) (142,429) (168,180) (173,160) (344,350) Net Increase / (Decrease) in Fund Balance 113,233 151,511 120,420 210,358 99,960 Ending Restricted Fund Balance (Budget) 454,451 $ 605,962 $ 726,382 $ 816,320 $ 916,280 $ Reconciliation to GAAP: Ending Restricted Fund Balance (Budget) 454,451 $ 605,962 $ 726,382 $ 816,320 $ 916,280 $ Adjustment 2 - - - -Restricted Fund Balance (GAAP) 454,451 605,962 726,382 816,320 916,280 Unassigned Fund Balance (GAAP) - - - -Assigned Fund Balance (GAAP) - - - -Non-Spendable Fund Balance (GAAP) - - - -Total Fund Balance (GAAP) 454,451 $ 605,962 $ 726,382 $ 816,320 $ 916,280 $ Notes: 1
2
$‐$100,000 $200,000 $300,000 $400,000 $500,000 $600,000 $700,000 $800,000 $900,000 $1,000,000 2021 Actual 2022 Actual 2023 Budget 2023 Estimated 2024 Projected Fund Balance Fiscal Year Ending September 30 Fund Balance History Unassigned Fund Balance (GAAP) Assigned Fund Balance (GAAP) Restricted Fund Balance (GAAP) Non‐Spendable Fund Balance (GAAP) Page 142
Account FY 2021FY 2022FY 2023 FY 2023 FY 2024 Number Account Name ActualActualBudgetEstimatedBudget Franchise & Other Taxes 1400City Hotel/Motel Tax 225,475 $ 277,528 $ 274,600 $ 339,899 $ 403,190 $ 1401County Hotel/Motel Tax 9,449 12,291 13,500 16,119 19,120 Total 234,924 289,819 288,100 356,018 422,310 Miscellaneous Income 9100Interest Income 418 4,121 500 27,500 22,000 Total 418 4,121 500 27,500 22,000 Hotel/Motel Tax Fund Revenues235,342 $ 293,940 $ 288,600 $ 383,518 $ 444,310 $ Hotel/Motel Tax Fund (114-3) Revenues Page 143
Hotel/Motel Tax Fund (114-4-024)
Account FY 2021FY 2022FY 2023FY 2023FY 2024 Number Account Name ActualActualBudgetEstimatedBudget Personnel 1010Salaries and Wages 23,166 $ 23,878 $ - $ - $ - $ 1210TMRS 2,370 2,508 - -1220FICA 1,745 1,798 - -1230Employee Insurance3,291 3,625 - -1240Workers' Comp. Insurance34 - - -1250Unemployment Compensation124 4 - -Total 30,730 31,813 - -Supplies 2010Office Supplies40 21 100 50 100 Total40 21 100 50 100 Services 5010Marketing18,515 29,814 25,070 42,000 60,000 5100Dues and Publications- 245 1,050 750 750 5130Travel and Training78 453 2,050 2,450 2,050 5500General Liability87 91 - -5630Consulting- - - - 80,000 Total18,680 30,603 28,170 45,200 142,800 Other Expenses 7400Sponsorships Tourism30,580 40,667 92,000 80,000 146,500 7401Visitor Center Support12,500 12,500 12,500 12,5007403Historical Preservation2,043 - - -7404City Tourism Support2,536 1,825 - -Total 47,659 54,992 104,500 92,500 146,500 Capital Outlay 8200Machinery and Equipment - - - -Total - - - -Transfers 9101Transfer to General Fund - - 35,410 35,410 54,950 9184Transfer to Special Events Fund 25,000 25,000 - -Total 25,000 25,000 35,410 35,410 54,950 Hotel/Motel Tax Fund Expenditures122,109 $ 142,429 $ 168,180 $ 173,160 $ 344,350 $
Page 144
Overview
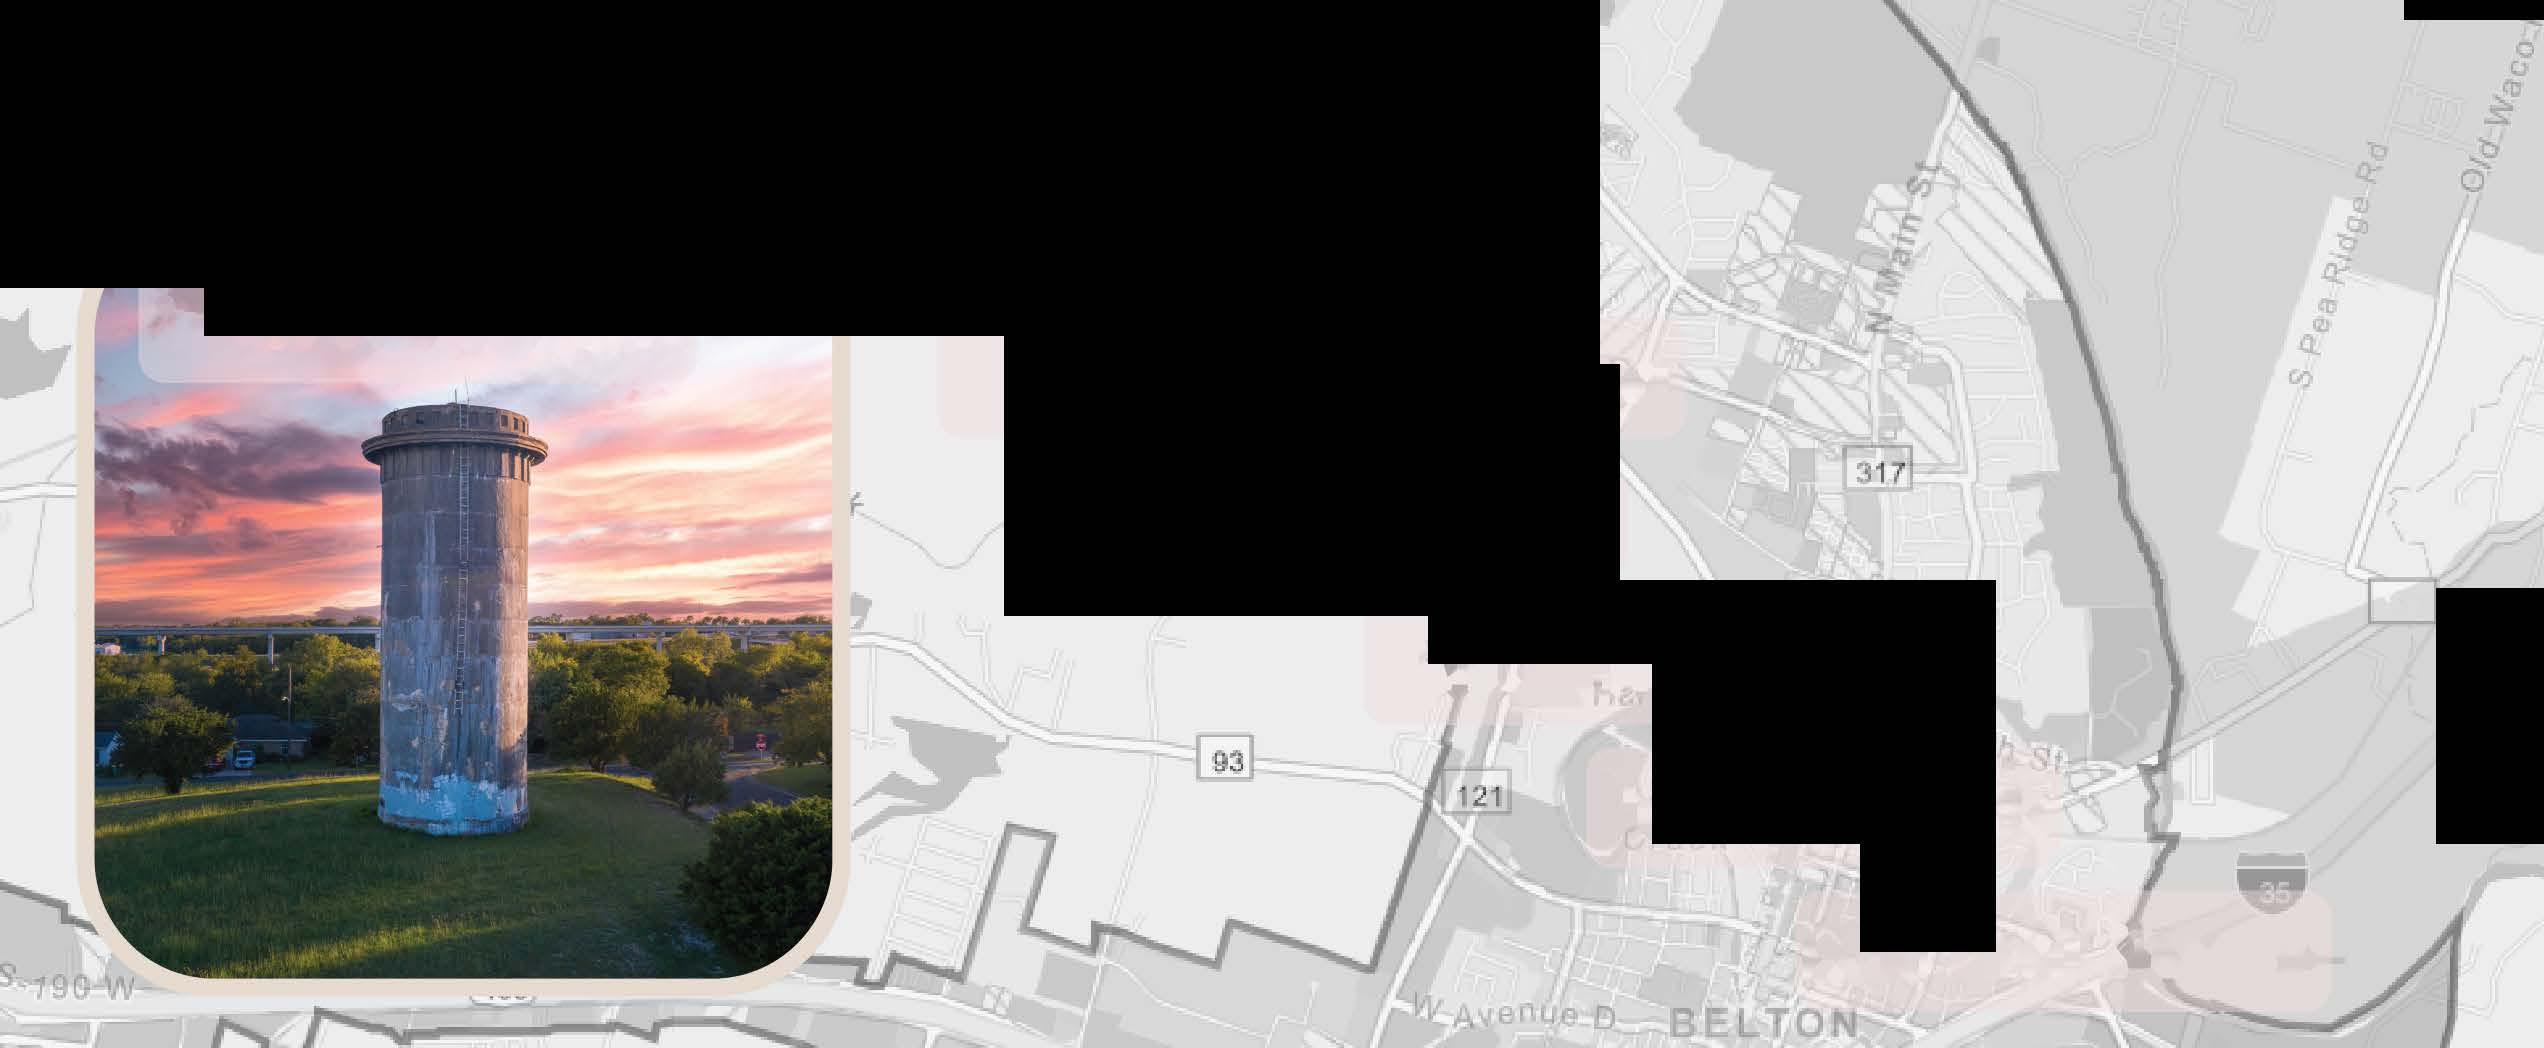
TIRZstandsfor theTax IncrementReinvestmentZone. TheTIRZwas established in2004 to help promote growthin downtown Belton. Bell County andtheCityofBeltonbothagreedtocontributetheirportionsofpropertytax tothisfundevery year. TheTIRZagreementexpiresin2042. Beloware afewofthepastandfutureplannedprojects.
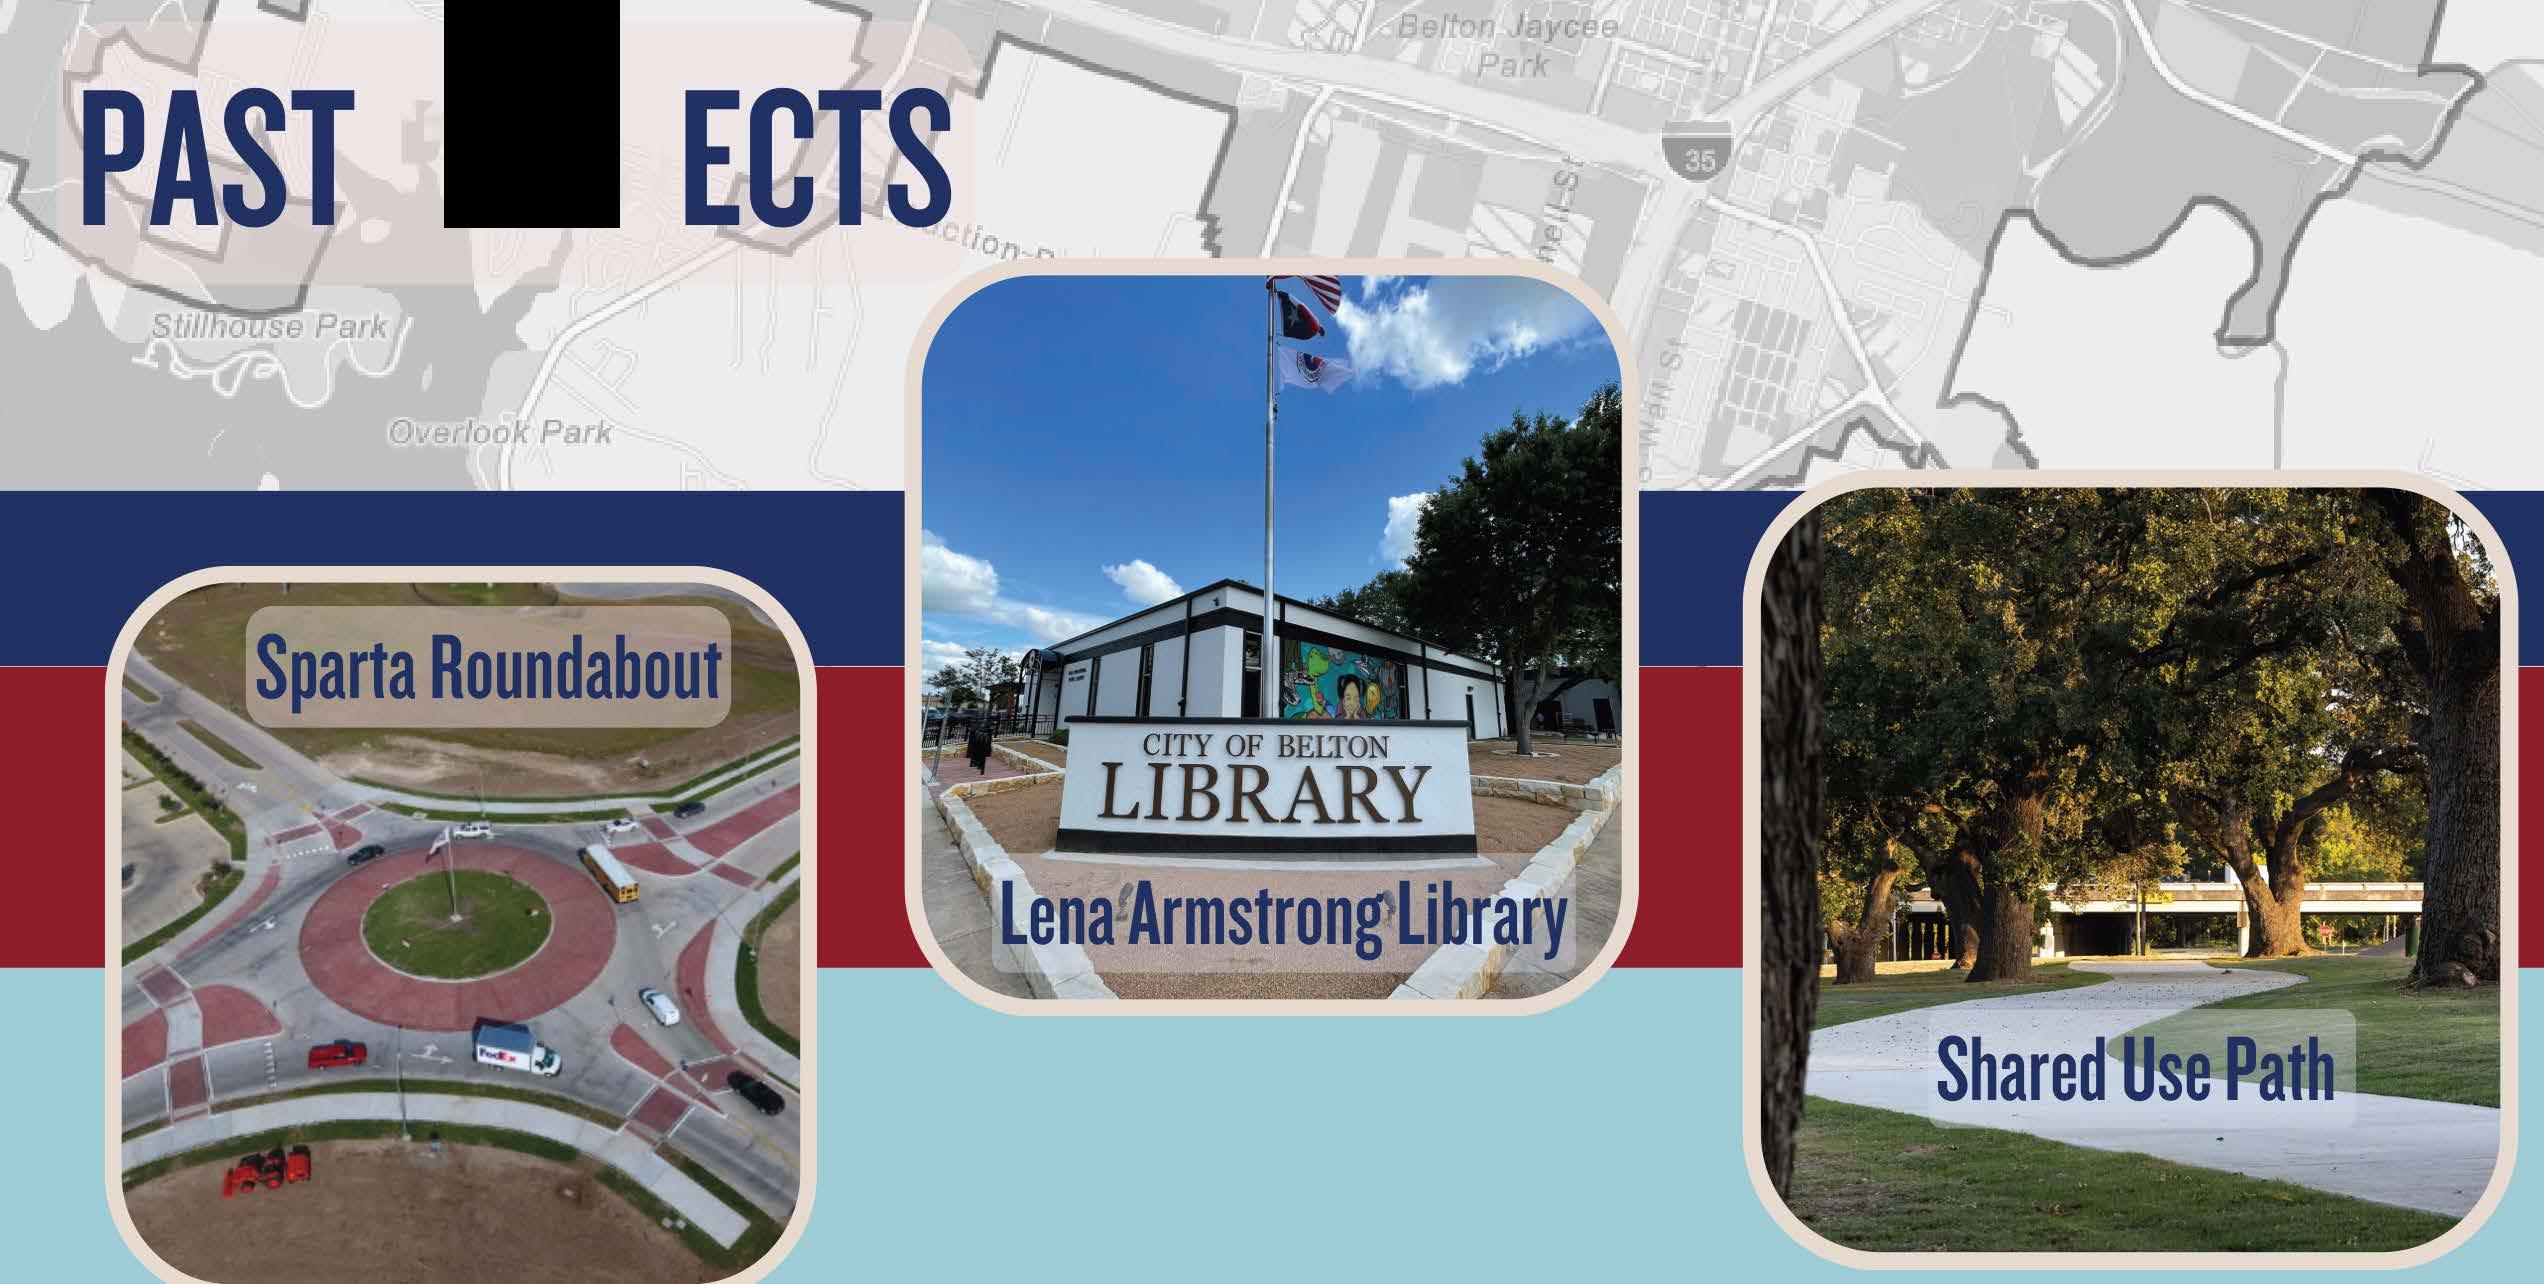

FUTUREPROJECTS...

StandpipeRestoration ConnellStreetReconstruction --- SouthwestParkway 817 EastCentralBridge f;: 1 PenelopeSidewalk MainStreetSidewalk
PROJ
TIRZ Fund Overview / Statement of Fund Balance
The TIRZ Fund is used to account for the accumulation of resources from ad valorem taxes collected on the incremental values in the Belton Tax Increment Reinvestment Zone No. 1, which was created in 2004. The revenues can only be expended on projects within the boundaries of the Zone that have been approved by both the TIRZ Board and the City Council. The City of Belton and Bell County participate in the TIRZ. In 2022, the TIRZ boundary was expanded. The term was also extended to 2042.
1 An adjustment is made to restricted fund balance, if necessary, during the conversion from a budget basis to an accrual basis (GAAP).
Fund Balance History
ActualActualBudgetEstimatedProjected Fiscal Year Ending September 3020212022202320232024 Budget Basis: Beginning Restricted Fund Balance (GAAP) 294,013 $ 661,040 $ 1,001,077 $ 1,001,077 $ 1,120,296 $ Revenues 2,316,221 2,494,727 2,828,190 2,751,609 3,193,920 Expenditures (1,949,194) (2,154,690) (2,671,210) (2,632,390) (3,020,950) Net Increase / (Decrease) in Fund Balance 367,027 340,037 156,980 119,219 172,970 Ending Restricted Fund Balance (Budget) 661,040 $ 1,001,077 $ 1,158,057 $ 1,120,296 $ 1,293,266 $ Reconciliation to GAAP: Ending Restricted Fund Balance (Budget) 661,040 $ 1,001,077 $ 1,158,057 $ 1,120,296 $ 1,293,266 $ Adjustment 1 - - - -Restricted Fund Balance (GAAP) 661,040 1,001,077 1,158,057 1,120,296 1,293,266 Unassigned Fund Balance (GAAP) - - - -Assigned Fund Balance (GAAP) - - - -Non-Spendable Fund Balance (GAAP) - - - -Total Fund Balance (GAAP) 661,040 $ 1,001,077 $ 1,158,057 $ 1,120,296 $ 1,293,266 $ Notes:
$‐$200,000 $400,000 $600,000 $800,000 $1,000,000 $1,200,000 $1,400,000 2021 Actual2022 Actual2023 Budget2023 Estimated 2024 Projected Fund Balance Fiscal Year Ending September 30
Unassigned Fund Balance (GAAP) Assigned Fund Balance (GAAP) Restricted Fund Balance (GAAP) Non‐Spendable Fund Balance (GAAP) Page 146
TIRZ Fund Revenue Trend
FY 2020FY 2021FY 2022FY 2023FY 2023FY 2024 ActualActualActualBudgetEstimatedBudget Revenues County TIRZ Contribution 735,127 $ 893,761 $ 915,998 $ 1,037,940 $ 958,225 $ 1,161,460 $ City TIRZ Contribution 1,155,204 1,421,889 1,566,771 1,789,550 1,769,884 2,013,660 Miscellaneous Income 1,066,075 571 11,958 700 23,500 18,800 Total Revenue 2,956,406 $ 2,316,221 $ 2,494,727 $ 2,828,190 $ 2,751,609 $ 3,193,920 $ $‐$500,000 $1,000,000 $1,500,000 $2,000,000 $2,500,000 $3,000,000 $3,500,000 2020 Actual2021 Actual2022 Actual2023 Budget2023 Estimate2024 Budget County TIRZ Contribution City TIRZ Contribution Miscellaneous Income Page 147
TIRZ Fund (123-3) Revenues


Account FY 2021FY 2022FY 2023FY 2023FY 2024 Number Account Name ActualActualBudgetEstimatedBudget Ad Valorem Taxes 1011County TIRZ Contribution 893,761 $ 915,998 $ 1,037,940 $ 958,225 $ 1,161,460 $ 1012City TIRZ Contribution 1,421,889 1,566,771 1,789,550 1,769,884 2,013,660 Total 2,315,650 2,482,769 2,827,490 2,728,109 3,175,120 Miscellaneous Income 9100Interest Income 571 11,958 70023,500 18,800 Total 571 11,958 70023,500 18,800 TIRZ Fund Revenues2,316,221 $ 2,494,727 $ 2,828,190 $ 2,751,609 $ 3,193,920 $
County TIRZ Contribution 36% City TIRZ Contribution 63% Interest Income 1% TIRZ Revenues County TIRZ Contribution City TIRZ Contribution Interest Income Page 148
TIRZ Fund Category Summary
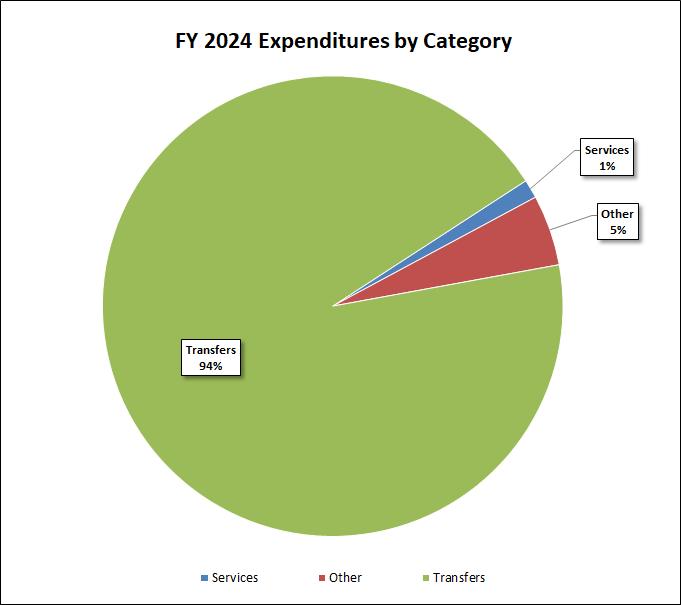
FY 2021FY 2022FY 2023FY 2023FY 2024 Description ActualActualBudgetEstimatedBudget Services 36,400 $ 37,220 $ 50,000 $ 31,500 $ 40,000 $ Debt Service 414,090 402,391 265,800 265,480Other 18,498 32,549 120,000 100,000 150,000 Transfers 1,480,206 1,682,530 2,235,410 2,235,410 2,830,950 TIRZ Fund 1,949,194 $ 2,154,690 $ 2,671,210 $ 2,632,390 $ 3,020,950 $
Page 149
Account FY 2021FY 2022FY 2023FY 2023FY 2024 Number Account Name ActualActualBudgetEstimatedBudget Services 5630Consulting 36,400 $ 37,220 $ 50,000 $ 31,500 $ 40,000 $ Total 36,400 37,220 50,000 31,500 40,000 Debt Service 6010Principal Payments 380,000 380,000 255,000 255,0006020Interest Payments 33,685 22,110 10,200 10,2006100Paying Agent Fees 94 80 100 806110 Arbitrage Rebate Calculation Fees 311 201 500 200Total 414,090 402,391 265,800 265,480Other Expenses 7630Façade and Improvement Grants 18,498 32,549 120,000 100,000 150,000 Total 18,498 32,549 120,000 100,000 150,000 Transfers 9101Transfer to General Fund 30,206 32,530 35,410 35,410 24,950 9165Transfer to TIRZ Cap Projects Fund1,450,000 1,650,000 2,200,000 2,200,000 2,806,000 Total 1,480,206 1,682,530 2,235,410 2,235,410 2,830,950 TIRZ Fund Expenditures1,949,194 $ 2,154,690 $ 2,671,210 $ 2,632,390 $ 3,020,950 $
Page 150
TIRZ Fund (123-4-023)
Overview

TheWaterandSewerDepartmentsareresponsibleforallthewaterandsewerlinemaintenancethroughouttheCity. Thesemenandwomenare essentialpersonnelthatworktirelesslyfortheCity,attimescominginallhoursofthenighttofixwaterandsewerleaksthathavenoregardfortime. WeareverythankfulforallofthepublicworksemployeesthatkeepBeltonrunning. TheCityhasaginginfrastructureneedsandouremployees makesurewemaintainanamazinglevelofcustomerservice. CapitalprojectsintheWaterandSewer Fundareessentialforthegrowthand reconstructionofourwaterandsewerlines.
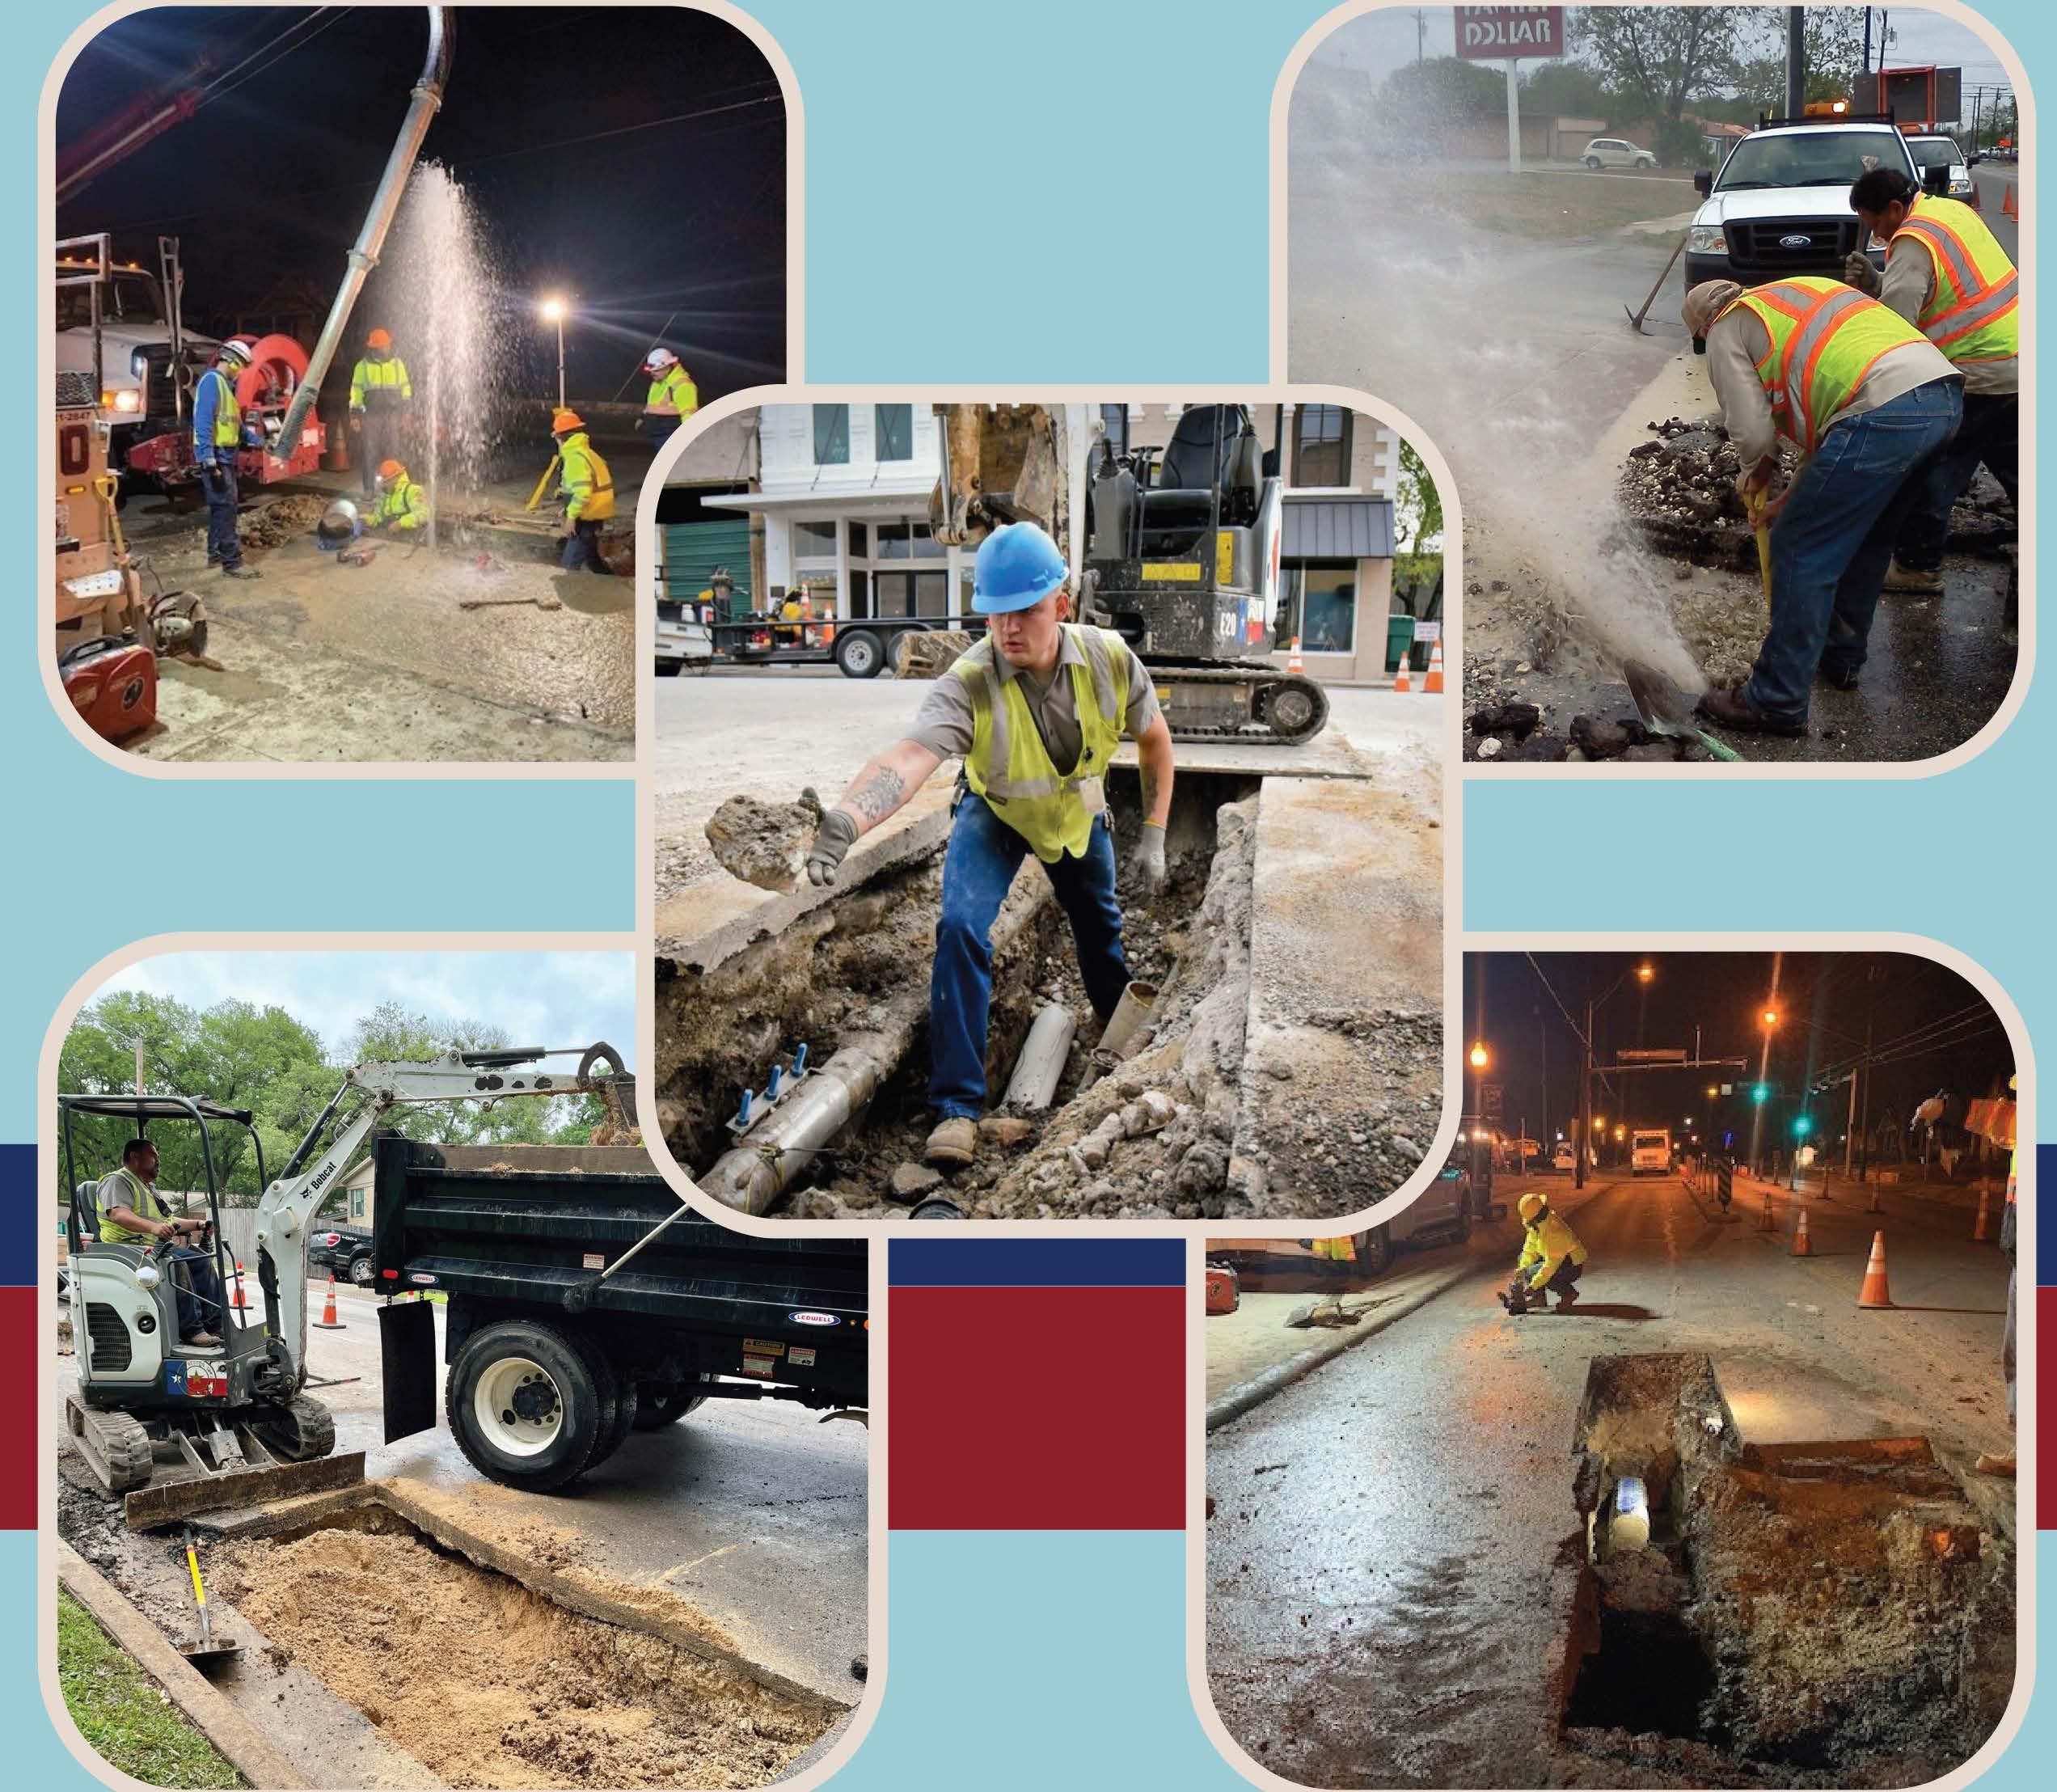
Water & Sewer Fund Overview
The Water & Sewer Fund is established to account for the City’s water distribution, sewer collection and sewer treatment operations. Being an enterprise fund, it is designed to be financed and operated in a manner like private businesses. The cost for providing these services to the public is to be recovered primarily through user charges. Capital improvements, such as water and sewer line upgrades, water distribution enhancements, and improvements to the wastewater treatment plant are often funded through Capital Project Funds which are not included in the annual operating budget. However, maintenance of utility infrastructure is provided by the Water & Sewer Fund.
Utility Rates
Updated in 2022, a new utility rate structure came into effect in FY 2023. The water base rate, or minimum bill, is now based upon meter size and includes 2,000 gallons of water flow. Two water volumetric rates have been established, with customers paying a fee for each 1,000 gallons above 2,000 gallons. The sewer base rate is the same regardless of meter size and includes 2,000 gallons of sewer flow. The sewer volumetric rate charged for consumption over 2,000 gallons is the same rate for all customer classes. For services provided outside of the city limits, all rates are 1.25 times the prevailing rate within the City of Belton.
Water Source
The City of Belton obtains its water from Belton Lake through a partnership with Bell County Water Control and Improvement District #1 (BCWCID), Brazos River Authority (BRA), and Center Texas Water Supply Corporation (CTWSC). Raw water is purchased from BCWCID and CTWSC. Election use and option water costs for FY 2024 are shown below.
Water Rates FY 2021 FY 2022 FY 2023 FY 2024 Base Rates by Meter Size 5/8 or 3/4-inch $ 17.00 $ 17.00 $ 17.00 $ 17.00 1-inch 17.00 17.00 25.25 25.25 1.5-inch 17.00 17.00 40.76 40.76 2-inch 17.00 17.00 59.37 59.37 3-inch 17.00 17.00 109.00 109.00 4-inch 17.00 17.00 164.84 164.84 6-inch 17.00 17.00 319.94 319.94 8-inch 17.00 17.00 505.06 506.06 10-inch 17.00 17.00 723.21 723.21 12-inch 17.00 17.00 2057.09 2057.09 Volumetric Rates Domestic $ 3.70 $ 3.70 $ 3.70 $ 3.70 Sprinkler 3.70 3.70 4.12 4.12 Sewer Rates FY 2021 FY 2022 FY 2023 FY 2024 Base $ 14.00 $ 14.00 $ 16.25 $ 17.38 Volumetric 5.00 5.00 7.50 8.00
Type of Water Water Rights in Acre Feet Cost per Acre Foot Election Use Water – BCWCID 3,310 $31.59 Option Water – BCWCID 1,656 $15.98 System Water - BCWCID 1,000 $88.00 Option Water – BRA 2,500 $14.96 Option Water – CTWSC 100 $13.91 Page 152
Water & Sewer Fund Statement of Fund Balance
1 Excludes Use of Prior Years' Fund Balance
2 An adjustment is made to unrestricted net assets, if necessary, during the conversion from a budget basis to an accrual basis (GAAP).
3 City policy requires a minimum fund balance of three months of budgeted expenditures plus one year of debt service.
Fund Balance History
Unrestricted Net Assets (GAAP) Restricted Net Assets (GAAP) Net Investment in Capital Assets (GAAP)
Actual ActualBudgetEstimatedProjected Fiscal Year Ending September 30 2021 2022 2023 2023 2024 Budget Basis: Beginning Unrestricted Net Assets (GAAP) 6,660,027 $ 6,587,866 $ 6,407,688 $ 6,407,688 $ 6,717,536 $ Revenues 1 9,208,905 10,635,243 11,777,510 12,893,730 14,027,320 Expenses (9,457,345) (10,403,372) (12,137,280) (12,583,882) (13,910,620) Net Increase / (Decrease) in Net Assets (248,440) 231,871 (359,770) 309,848 116,700 Ending Unrestricted Net Assets (Budget) 6,411,587 $ 6,819,737 $ 6,047,918 $ 6,717,536 $ 6,834,236 $ Reconciliation to GAAP: Ending Unrestricted Net Assets (Budget) 6,411,587 $ 6,819,737 $ 6,047,918 $ 6,717,536 $ 6,834,236 $ Adjustment 2 176,279 (412,049) - -Unrestricted Net Assets (GAAP) 6,587,866 6,407,688 6,047,918 6,717,536 6,834,236 Restricted Net Assets (GAAP) 69,380 9,021 9,021 9,021 9,021 Net Investment in Capital Assets (GAAP) 28,828,712 18,545,636 18,545,636 18,545,636 18,545,636 Total Fund Balance (GAAP) 35,485,958 $ 24,962,345 $ 24,602,575 $ 25,272,193 $ 25,388,893 $ Minimum Unrestricted Net Assets3 3,927,271 $ 4,185,718 $ 4,985,860 $ 4,985,860 $ 5,396,745 $ Unrestricted Net Assets in Excess of Minimum 2,660,595 $ 2,221,970 $ 1,062,058 $ 1,731,676 $ 1,437,491 $
Notes:
$‐$5,000,000 $10,000,000 $15,000,000 $20,000,000 $25,000,000 $30,000,000 $35,000,000 $40,000,000 2021 Actual2022 Actual2023 Budget2023 Estimated2024 Projected Fund Balance Fiscal
September 30
Year Ending
Page 153
Water & Sewer Fund Recap
FY 2021FY 2022FY 2023FY 2023FY 2024 ActualActualBudgetEstimatedBudget Revenues Water Revenue 5,173,213 $ 5,997,746 $ 5,543,620 $ 5,897,215 $ 6,146,600 $ Sewer Revenue 3,457,342 3,906,383 5,255,500 5,520,927 6,675,610 Other Fees 463,244 565,020 560,900 502,383 533,710 Miscellaneous Income 113,211 166,094 130,610 686,325 406,150 Other Financing Sources 1,895 - 646,650 286,880 265,250 Total Revenue 9,208,905 10,635,243 12,137,280 12,893,730 14,027,320 Expenses Utility Administration Division 857,601 1,204,402 1,592,890 1,560,223 1,677,820 Utility Finance Division 598,157 2,281,240 2,705,650 2,754,264 2,806,060 Water Division 3,927,737 3,772,447 3,517,550 4,007,708 4,464,200 Sewer-Collection Division 875,820 1,728,291 1,144,100 1,106,747 799,800 Sewer-Lift Stations Division 1,156,722 1,416,992 3,177,090 3,154,940 4,162,740 Other Costs Division 2,041,305 - - -Total Expenses 9,457,342 10,403,372 12,137,280 12,583,882 13,910,620 Net Income / (Loss) (248,437) $ 231,871 $ - $ 309,848 $ 116,700 $ Page 154
Water & Sewer Fund Revenue Trend
FY 2020FY 2021FY 2022FY 2023FY 2023FY 2024 ActualActualActualBudgetEstimatedBudget Revenues Water Revenue 5,244,147 $ 5,173,213 $ 5,997,746 $ 5,543,620 $ 5,897,215 $ 6,146,600 $ Sewer Revenue 3,289,304 3,457,342 3,906,383 5,255,500 5,520,927 6,675,610 Other Fees 437,875 463,244 565,020 560,900 502,383 533,710 Miscellaneous Income 121,068 113,211 166,094 130,610 686,325 406,150 Other Financing Sources - 1,895 - 646,650 286,880 265,250 Total Revenue 9,092,394 $ 9,208,905 $ 10,635,243 $ 12,137,280 $ 12,893,730 $ 14,027,320 $ $‐$2,000,000 $4,000,000 $6,000,000 $8,000,000 $10,000,000 $12,000,000 $14,000,000 $16,000,000 2020 Actual2021 Actual2022 Actual2023 Budget2023 Estimate2024 Budget Water Revenue Sewer Revenue Other Fees Miscellaneous Income Other Financing Sources Page 155
Distribution of Water & Sewer Fund Revenue


Water Charges 6,146,600 $ 43.8% Sewer Charges 6,675,610 $ 47.6% Other Fees 533,710 $ 3.8% Miscellaneous Income 406,150 $ 2.9% Other Financing Sources 265,250 $ 1.9% 14,027,320 $ 100.0%
Water Charges 44% Sewer Charges 47% Other Fees 4% Miscellaneous Income 3% Other Financing Sources 2%
Water Charges Sewer Charges Other Fees Miscellaneous Income Other Financing Sources Page 156
Revenues
Water & Sewer Fund (202-3) Revenues
Account FY 2021FY 2022FY 2023FY 2023FY 2024 Number Account Name ActualActualBudgetEstimatedBudget Charges for Service 5500Water Revenue 5,151,909 $ 5,967,837 $ 5,523,970 $ 5,859,915 $ 6,113,000 $ 5505Sale of Bulk Water 21,304 29,909 19,650 37,300 33,600 5510Sewer Revenue 3,457,342 3,906,383 5,255,500 5,520,927 6,675,610 5610Late Payment Fees 75,680 111,830 87,340 124,000 117,920 5620Reconnect Fees 12,315 8,160 11,160 8,900 8,530 5630New Service Fees 26,360 28,820 25,430 28,400 28,610 5640Transfer Fees 840 1,220 9701,250 1,240 5650Taps & Connections 348,049 414,990 436,000 339,833 377,410 Total 9,093,799 10,469,149 11,360,020 11,920,525 13,355,920 Miscellaneous Income 6100Sale of City Property 11,500 - - -6700Miscellaneous Income 19,403 21,832 25,680 247,165 25,780 6780Credit Card Fees 74,727 95,002 95,930 116,160 121,970 9100Interest Income 7,581 49,260 9,000 323,000 258,400 Total 113,211 166,094 130,610 686,325 406,150 Other Financing Sources 8101Transfer from General Fund - - 196,240 196,240 201,370 8161Transfer from ARPA Fund - - 28,280 28,2808178Transfer from Building Maintenance - - 8,460 8,460 8,670 8257Transfer from CDBG Grant Fund 1,895 - - -8707 Transfer from Drainage Fund - - 53,900 53,900 55,210 9999Use of Accumulated Reserves - - 359,770 -Total 1,895 - 646,650 286,880 265,250 Water & Sewer Fund Revenues9,208,905 $ 10,635,243 $ 12,137,280 $ 12,893,730 $ 14,027,320 $
Page 157
Water & Sewer Fund Division Summary


FY 2024 Expenses by Division

FY 2021FY 2022FY 2023FY 2023FY 2024 ActalActualBudgetEstimatedBudget Water and Sewer Fund 1 Utility Administration Division 857,601 $ 1,204,402 $ 1,592,890 $ 1,560,223 $ 1,677,820 $ Utility Finance Division 598,157 2,281,240 2,705,650 2,754,264 2,806,060 Water Division 3,927,737 3,772,447 3,517,550 4,007,708 4,464,200 Sewer-Collection Division 875,820 1,728,291 1,144,100 1,106,747 799,800 2 Sewer-Lift Stations Division 1,156,722 1,416,992 3,177,090 3,154,940 4,162,740 3 Other Costs Division 2,041,305 - - -Water and Sewer Fund 9,457,342 $ 10,403,372 $ 12,137,280 $ 12,583,882 $ 13,910,620 $
Utility Administration Division 12% Utility Finance Division 20% Water Division 32% Sewer‐Collection Division 6% Sewer‐Lift Stations Division 30%
Utility Administration Division Utility Finance Division Water Division Sewer‐Collection Division Sewer‐Lift Stations Division Page 158
Water & Sewer Fund Category Summary


FY 2024 Expenses by Category


FY 2021FY 2022FY 2023FY 2023FY 2024 Description ActalActualBudgetEstimatedBudget Personnel 1,912,712 $ 2,009,655 $ 1,974,120 $ 1,828,999 $ 2,263,120 $ Supplies 121,192 136,185 163,700 152,940 169,290 Maintenance 172,962 284,648 234,050 218,400 206,550 Services 524,837 711,913 858,590 920,976 786,020 Debt Service 1,541,305 1,621,339 1,954,450 1,956,757 1,955,340 Other Expenses - 20,215 50,000 26,000 25,000 Water Purchases 1,488,154 1,662,8741,637,480 1,920,790 1,911,200 Sewage Treatment 826,568 803,220 878,520 874,500 939,420 Capital Outlay 502,773 174,513 200,000 288,150 577,500 Transfers 2,366,839 2,978,810 4,186,370 4,396,370 5,077,180 Water and Sewer Fund 9,457,342 $ 10,403,372 $ 12,137,280 $ 12,583,882 $ 13,910,620 $
Personnel 16% Supplies 1% Maintenance 1% Services 6% Debt Service 14% Other Expenses 0% Water Purchases 14% Sewage Treatment 7% Capital Outlay 4% Transfers 37%
Personnel Supplies Maintenance Services Debt Service Other Expenses Water Purchases Sewage Treatment Capital Outlay Transfers Page 159
Account FY 2021FY 2022FY 2023FY 2023FY 2024 NumberAccount Name ActualActualBudgetEstimatedBudget Personnel 1010Salaries and Wages 1,400,030 $ 1,477,535 $ 1,404,490 $ 1,324,140 $ 1,641,530 $ 1070Overtime Pay 43,062 36,915 29,520 35,460 36,300 1210TMRS 149,791 157,888 150,860 144,140 182,880 1220FICA 107,341 110,282 109,530 100,200 128,200 1230Employee Insurance192,242 208,383 254,340 201,740 238,290 1240Worker's Comp Insurance11,921 18,144 21,450 22,729 33,040 1250Unemployment Compensation8,325 5083,930 5902,880 Total1,912,712 2,009,655 1,974,120 1,828,999 2,263,120 Supplies 2010Office Supplies5,283 5,467 6,500 5,600 6,700 2030Chemical Supplies7,215 8,159 12,350 9,660 13,300 2090Tools and Other Supplies26,694 30,039 29,780 29,420 29,980 2220Fuel41,391 58,141 46,010 49,060 51,540 2400Clothing14,095 13,393 17,300 21,600 23,260 2500Small Equipment17,934 15,363 45,560 26,800 38,060 2600Postage8,580 5,623 6,200 10,800 6,450 Total121,192 136,185 163,700 152,940 169,290 Maintenance 3130Water System104,689 103,650 139,700 140,000 103,200 3190Water Samples7,654 9,825 12,000 9,500 12,000 3230Sewer Line11,423 65,958 21,000 16,000 22,000 3240Lift Station34,740 81,349 37,000 31,250 45,000 4020Equipment and Machinery 14,456 23,866 24,350 21,650 24,350 Total 172,962 284,648 234,050 218,400 206,550 Services 5000Public Notices 5,299 3,800 6,700 4,950 6,100 5010Marketing 825 - 600 6005100Dues and Publications 5,067 6,634 5,6605,610 7,120 5110License & Certification 2,821 2,279 5,2303,160 6,700 5130Travel & Training 11,283 9,026 17,150 17,600 33,780 5190Employee Testing 30 234 - -5340Building Maintenance Services 69,252 66,940 82,080 82,080 85,260 5341Info Tech Services 160,586 194,730 237,380 237,380 213,700 5500General Liability 39,111 40,832 44,120 44,756 53,150 5600 Audit 10,862 11,881 11,220 11,220 11,490 5610Legal - - 1,000 -5620Engineering 17,301 - - -5630Consulting 24,260 111,640 209,000 205,580 19,400 5700Special Services 11,803 11,492 11,500 11,840 12,200 5730Bill Processing and Mailing 39,296 38,424 45,000 42,500 45,000 5731Payment Processing Fees 61,586 94,598 74,000 125,000 150,000 5760Collection Fees 557 292 900 400 900 5820Gas Service 2,420 4,297 6,390 7,630 8,790 5830Electric Service 62,478 114,814 100,660 120,670 132,430 Total 524,837 711,913 858,590 920,976 786,020 Debt Service 6010Principal Payments 1,029,900 1,054,900 1,330,350 1,330,350 1,365,800 6020Interest Payments 506,648 561,102 621,200 621,200 584,170 6100Paying Agent Fees 848 1,168 9001,170 1,170 6110Arbitrage Rebate Calculation Fees 3,909 4,169 2,000 4,037 4,200 Total 1,541,305 1,621,339 1,954,450 1,956,757 1,955,340
Line Item Expense Detail Page 160
Water & Sewer Fund
Account FY 2021FY 2022FY 2023FY 2023FY 2024 NumberAccount Name ActualActualBudgetEstimatedBudget Water & Sewer Fund Line Item Expense Detail Other Expenses 7700Contingency- 20,215 50,000 26,000 25,000 Total - 20,215 50,000 26,000 25,000 Water Purchases 7200Election Use and Option Water 238,236 248,367261,220 255,260 265,440 7210Water Purchases - Debt Services 375,154 378,060405,500 590,700 515,000 7220Water Purchases - Treated Water 859,011 1,020,619 955,000 1,059,000 1,115,000 7230Water System Fees 15,753 15,828 15,760 15,830 15,760 Total 1,488,154 1,662,874 1,637,480 1,920,790 1,911,200 Sewage Treatment 7330TBWWTP Operations 738,793 742,303 813,520 810,000 874,420 7340TBWWTP and Main Lift Station 87,775 60,917 65,000 64,500 65,000 Total 826,568 803,220 878,520 874,500 939,420 Capital Outlay 8100Buildings 19,993 - - -8200Machinery and Equipment 232,770 - - - 155,000 8300Vehicle - - - - 122,500 8400Computer Equipment - - - 24,1508901Water Meter and Tap Materials 182,910 174,513 200,000 264,000 300,000 8951Lift Station 67,100 - - -Total 502,773 174,513 200,000 288,150 577,500 Transfers 9101Transfer to General Fund 164,075 172,520 783,570 783,570 852,480 9160Transfer to Grant Fund 4,527 - - -9199Transfer to General Fund 394,054 426,680 441,990 441,990 492,000 9209Transfer to Water and Sewer Cap1,275,000 2,039,000 2,550,000 2,550,000 3,100,000 9274Transfer to 2015 CO's - W/S 114,577 - - -9279Transfer to Water and Sewer Equip209,507 135,510 135,710 135,710 132,700 9282Transfer to Water Meter Replacement205,099 205,100 275,100 485,100 500,000 Total 2,366,839 2,978,810 4,186,370 4,396,370 5,077,180 Water & Sewer Fund Expenses9,457,342 $ 10,403,372 $ 12,137,280 $ 12,583,882 $ 13,910,620 $ Page 161
Utility Administration
DIVISION MISSION AND DESCRIPTION
The mission of the Utility Administration division is to provide administrative functions, oversight, and support of water and sewer department operations. Responsibilities of the division include overseeing utility infrastructure projects; administering water and sewer regulatory programs; reviewing proposed development infrastructure for compliance with engineering standards; directing the water conservation program; and preserving existing utility assets.
DIVISION GOALS AND ACTION ITEMS FOR FY 2024
Strategic Plan priorities addressed below: Quality of Life, Economic Development, Connectivity
Goal: Address infrastructure and capital equipment needs
Action Item: Set aside funding for the wastewater treatment plant expansion and water meter replacement program
Goal: Facilitate projects that will provide stability and improved performance with existing utilities
Action Item: Implement recommendations from the water and wastewater master plan update
Goal: Work cooperatively with other agencies to maximize project success
Action Item: Cultivate partnerships with the Texas Department of Transportation and other agencies on pending projects
SIGNIFICANT CHANGES IN THE FY 2024 BUDGET
One Assistant Director of Public Works has been added to enhance customer service
Consulting expenses decrease after completion of the water and wastewater master plan during FY 2023
Appropriations for contingencies decrease to reflect historical spending
Capital outlay reflects the acquisition of three vehicles
PERFORMANCE MEASURES
FY 2022FY 2023FY 2023FY 2024 WORKLOAD MEASURES ACTUALBUDGETESTIMATEBUDGET Number of annual regulatory reports 10 10 10 10 Average daily water demand in gallons 3,790,000 3,600,000 3,600,000 3,750,000 Average daily gallons of wastewater sent for treatment 1,600,000 2,000,000 2,000,000 2,100,000
Percent of days in compliance with TCEQ and EPA rules 100%100%100%100% Percent of construction projects completed under budget 75%75%75%75% Percent of construction projects in compliance with SWP3 100%100%100%100% PERSONNEL Director of Public Works 1.00 1.00 1.00 1.00 Assistant Director of Public Works - 1.00 1.00 2.00 Construction Inspector 1.00 1.00 1.00 1.00 Assistant Construction Inspector 1.00 1.00 1.00 1.00 Program Manager 1.00 1.00 1.00 1.00 GIS Technician 1.00 1.00 1.00 1.00 Office Manager 1.00 1.00 -Administrative Assistant 1.00 1.00 2.00 2.00 Total Employees (Full-Time Equivalents) 7.00 8.00 8.00 9.00 Page 162
Account FY 2021FY 2022FY 2023FY 2023FY 2024 Number Account Name ActualActualBudgetEstimatedBudget Personnel 1010Salaries and Wages 491787557,738 $ 518,360 $ 518,360 $ 621,250 $ 1070Overtime Pay 1,675 1,307 1,200 1,150 1,200 1210TMRS 51,206 57,414 54,650 54,900 67,890 1220 FICA 36,407 40,043 39,660 39,000 47,530 1230Employee Insurance 51,558 69,271 74,170 61,500 71,680 1240Workers' Comp. Insurance 1,882 3,602 6,890 4,330 4,290 1250Unemployment Compensation 2,184 200 1,080 180 810 Total 636,699 729,575 696,010 679,420 814,650 Supplies 2010Office Supplies 1,212 2,267 4,000 2,400 4,000 2090Tools and Other Supplies 4,697 3,568 4,650 4,600 4,300 2220Fuel 4,722 7,712 6,310 5,040 5,300 2400Clothing 1,298 1,698 2,540 2,200 2,970 2500Small Equipment 1,878 4,082 17,160 5,000 5,010 2600Postage 3,571 3,316 3,800 3,800 3,800 Total 17,378 22,643 38,460 23,040 25,380 Maintenance 4020Machinery and Equipment 626 6 150 50 150 Total 626 6 150 50 150 Services 5000Public Notices 3,017 3,360 4,000 3,500 4,000 5100Dues and Publications 4,037 4,511 4,550 4,500 6,010 5110License & Certification 114 519 1,020 600 950 5130Travel and Training 5,198 2,618 4,910 6,000 17,200 5190Employee Testing 30 234 - -5340 Building Maintenance Services 69,252 66,940 82,080 82,080 85,260 5341Info Tech Services 62,784 90,830 111,420 111,420 100,450 5500General Liability 4,970 5,004 5,410 6,493 7,640 5610Legal - - 1,000 -5620 Engineering 13,270 - - -5630 Consulting 15,877 103,210 200,000 197,100 10,000 5700Special Services 346 - - -5820 Gas Service 255 337 3,2904,160 4,790 5830Electric Service 6,859 8,600 6,900 8,020 8,940 Total 186,009 286,163 424,580 423,873 245,240 Other Expenses 7700Contingency - 20,215 50,000 26,000 25,000 Total - 20,215 50,000 26,000 25,000 Capital Outlay 8200Machinery and Equipment 9,700 - - -8300 Vehicle - - - - 122,500 8400 Computer Equipment - - - 24,150Total 9,700 - - 24,150 122,500 Transfers 9101Transfer to General Fund - - 374,360 374,360 428,420 9160Transfer to Grant Fund 605 - - -9209 Transfer to WS Capital Projects - 139,000 - -9279 Transfer to WS Equip Replacement 6,584 6,800 9,330 9,330 16,480 Total 7,189 145,800 383,690 383,690 444,900 Utility Administration Expenses857,601 $ 1,204,402 $ 1,592,890 $ 1,560,223 $ 1,677,820 $ Water & Sewer Fund - Utility Administration (202-4-201) Page 163
Utility Finance
DIVISION MISSION AND DESCRIPTION
The mission of the Utility Finance division is to provide timely billing and collection of City-provided water, sewer, refuse, and drainage services in a courteous and responsive manner. Duties include maintaining deposit, billing, and payment information for all utility customers; billing utility accounts on a four-cycle per month basis; processing requests for service connection and disconnection; and handling customer inquiries.
DIVISION GOALS AND ACTION ITEMS FOR FY 2024
Strategic Plan priorities addressed below: Governance
Goal: Increase the amount of electronic billing and collection
Action Item: Continue educating customers on the benefits of automated payments
Goal: Modernize the utility bill delivery and payment processes
Action Item: Implement new software that streamlines payment processing in a more secure environment
Goal: Provide exceptional customer service
Action Item: Create an environment of positive, professional interaction and seek customer feedback
SIGNIFICANT CHANGES IN THE FY 2024 BUDGET
Appropriations for wages, taxes, and retirement increase to account for growth in salaries
Payment processing fees increase as more customers pay utility bills with credit cards
Transfers to the General Fund increase due to changes to the cost allocation schedule for FY 2024
FY 2022FY 2023FY 2023FY 2024 WORKLOAD MEASURES ACTUALBUDGETESTIMATEBUDGET Number of utility bills generated annually 95,339 100,450 102,100 106,700 Number of utility bills sent electronically 34,602 33,290 35,780 37,570 Number of utility bills paid electronically 30,603 31,270 32,130 33,740
Percentage of customer who pay bills electronically 32%35%31%35% Percentage of utility bills issued within one week of reads 85%95%90%95% Reconciliation of all cash transactions on a daily basis 100%100%100%100% PERSONNEL Senior Accountant 1.00 1.00 1.00 1.00 Customer Service Representative II 3.00 2.00 2.00 2.00 Customer Service Representative I - 1.00 1.00 1.00 Total Employees (Full-Time Equivalents) 4.00 4.00 4.00 4.00 Page 164
PERFORMANCE MEASURES
Account FY 2021FY 2022FY 2023FY 2023FY 2024 Number Account Name ActualActualBudgetEstimatedBudget Personnel 1010Salaries and Wages 300,517 $ 320,821 $ 193,230 $ 195,800 $ 201,590 $ 1210TMRS 30,758 33,704 20,330 20,650 21,990 1220 FICA 21,652 23,154 14,790 13,100 15,430 1230Employee Insurance36,923 41,482 43,630 40,100 42,950 1240Workers' Comp. Insurance436 397 380 451 550 1250Unemployment Compensation 1,602 56 540 90 360 Total 391,888 419,614 272,900 270,191 282,870 Supplies 2010Office Supplies 2,715 2,454 2,500 3,200 2,700 2090Tools and Other Supplies 180 800 500 300 500 2500Small Equipment 1,807 4205,500 5003,000 2600Postage 5,009 2,307 2,400 7,000 2,650 Total 9,711 5,981 10,900 11,000 8,850 Services 5000Public Notices 547 - 1,200 600 600 5010Marketing 825 - 600 6005130Travel and Training - - 1,000 2,500 3,600 5341Info Tech Services 60,721 67,220 77,70077,700 73,430 5500General Liability 2,324 1,969 2,1302,326 2,740 5600 Audit 10,862 11,881 11,22011,220 11,490 5630Consulting 8,383 8,430 9,0008,480 9,400 5700Special Services 11,457 11,492 11,50011,840 12,200 5730Bill Processing and Mailing 39,296 38,424 45,00042,500 45,000 5731Payment Processing Fees 61,586 94,598 74,000 125,000 150,000 5760Collection Fees 557 292 900 400 900 Total 196,558 234,306 234,250 283,166 309,360 Debt Service 6010Principal Payments - 1,054,900 1,330,350 1,330,350 1,365,800 6020Interest Payments - 561,102 621,200 621,200 584,170 6100Paying Agent Fees - 1,168 9001,170 1,170 6110 Arbitrage Rebate Calculation Fees - 4,169 2,000 4,037 4,200 Total - 1,621,339 1,954,450 1,956,757 1,955,340 Transfers 9101Transfer to General Fund - - 233,150 233,150 249,640 Total - - 233,150 233,150 249,640 Utility Finance Expenses598,157 $ 2,281,240 $ 2,705,650 $ 2,754,264 $ 2,806,060 $
Page 165
Water & Sewer Fund - Utility Finance (202-4-202)
Water
DIVISION MISSION AND DESCRIPTION
The mission of the Water division is to provide a safe and adequate water distribution system that meets or exceeds the standards for a “superior” water system for the domestic, industrial and fire protection needs of customers in a manner than conserves and best uses crucial water resources The responsibilities of this division include maintaining the water distribution system; making service taps and installing new services; constructing new and replacement water mains and service lines; and timely repairing water leaks
DIVISION GOALS AND ACTION ITEMS FOR FY 2024
Strategic Plan priorities addressed below: Governance, Quality of Life
Goal: Address infrastructure needs
Action Item: Replace degrading valves and add flushing assemblies to help distribute water
Goal: Maintain “superior” water system status with the Texas Commission on Environmental Quality
Action Item: Exercise all valves on a regular basis to ensure operation when needed
Goal: Provide reliable, quality water of sufficient quantity and pressure to all customers
Action Item: Modernize the SCADA monitoring system by constructing a workspace to easily view and access controls
SIGNIFICANT CHANGES IN THE FY 2024 BUDGET
Two Meter Reader I positions have been added due to the increasing workload as the customer count grows
Electric service expenses increase due to rising prices for electricity
Capital outlay reflects the acquisition of an excavator, two pickup trucks, and water tap materials
Transfers for water meter replacement increase to set aside funding for the water metering infrastructure project
FY 2022FY 2023FY 2023FY 2024 WORKLOAD MEASURES ACTUAL BUDGET ESTIMATE BUDGET Miles of water mains maintained 165 169 167 169 Number of water main repairs 28 20 22 24 Number of service line repairs 44 55 50 40 PERFORMANCE MEASURES Percent of unaccounted water loss 10%10% 8% 8% Percent of days in compliance with quality standards 100%100%100%100% Response to water main breaks within twenty minutes 100%100%100%100% PERSONNEL Assistant Director of Public Works 1.00 - -Water Superintendent 1.00 1.00 1.00 1.00 Senior Maintenance Technician 1.00 1.00 1.00 2.00 Environmental Compliance Technician 1.00 1.00 1.00 1.00 Maintenance Technician II 1.00 1.00 1.00 2.00 Maintenance Technician I 5.00 5.00 5.00 3.00 Senior Meter Reader 1.00 1.00 1.00 1.00 Meter Reader I 1.00 1.00 1.00 3.00 Total Employees (Full-Time Equivalents) 12.00 11.00 11.00 13.00 Page 166
Account FY 2021FY 2022FY 2023FY 2023FY 2024 Number Account Name ActualActualBudgetEstimatedBudget Personnel 1010Salaries and Wages 371,365 $ 369,916 $ 460,860 $ 398,000 $ 559,710 $ 1070Overtime Pay 24,317 17,498 14,000 18,800 20,000 1210TMRS 41,231 40,716 49,950 44,500 63,160 1220FICA 30,289 28,953 36,330 31,500 44,350 1230Employee Insurance61,286 53,777 80,830 56,700 77,230 1240Workers' Comp. Insurance6,584 10,161 9,890 12,308 21,160 1250Unemployment Compensation2,726 186 1,490 200 1,170 Total 537,798 521,207 653,350 562,008 786,780 Supplies 2010Office Supplies980 537 - -2030Chemical Supplies1,438 933 1,750 1,360 4,700 2090Tools and Other Supplies14,942 15,939 15,030 17,000 14,830 2220Fuel20,680 28,289 22,000 21,500 22,580 2400Clothing7,915 7,432 9,070 13,500 13,500 2500Small Equipment9,443 10,861 22,900 21,300 30,050 Total55,398 63,991 70,750 74,660 85,660 Maintenance 3130Water System104,689 103,650 139,700 140,000 103,200 3190Water Samples7,654 9,825 12,000 9,500 12,000 4020Machinery and Equipment5,875 19,225 11,000 13,000 11,000 Total118,218 132,700 162,700 162,500 126,200 Services 5000Public Notices1,735 440 1,500 850 1,500 5100 Dues and Publications 705 1,712 650 650 650 5110License & Certification 1,673 1,369 2,750 1,900 4,150 5130Travel and Training 3,633 4,863 7,940 7,000 10,110 5341Info Tech Services 15,892 20,960 33,590 33,590 26,850 5500General Liability 18,131 19,602 21,180 21,650 25,750 5620Engineering 4,031 - - -5820Gas Service 140 140 - -5830Electric Service 27,496 49,596 34,240 56,690 60,820 Total 73,436 98,682 101,850 122,330 129,830 Water Purchases 7200Election Use and Option Water 238,236 248,367 261,220 255,260 265,440 7210Water Purchases - Debt Service 375,154 378,060 405,500 590,700 515,000 7220Water Purchases - Treated Water 859,011 1,020,619 955,000 1,059,000 1,115,000 7230Water System Fees 15,753 15,828 15,760 15,830 15,760 Total 1,488,154 1,662,874 1,637,480 1,920,790 1,911,200 Capital Outlay 8200Machinery and Equipment 217,751 - - - 85,000 8300Vehicles - - - - 70,000 8901Water Meter and Tap Materials 182,910 174,513 200,000 264,000 300,000 Total 400,661 174,513 200,000 264,000 455,000
Page 167
Water & Sewer Fund - Water (202-4-210)
Account FY 2021FY 2022FY 2023FY 2023FY 2024 Number Account Name ActualActualBudgetEstimatedBudget Water & Sewer Fund - Water (202-4-210) Transfers 9101Transfer to General Fund82,037 86,260 88,030 88,030 87,210 9160Transfer to Grant Fund 2,362 - - -9199Transfer to General Fund 236,268 262,210 264,660 264,660 298,000 9209Transfer to Water and Sewer Cap 675,000 510,000 - -9279Transfer to Water and Sewer Equip 53,306 54,910 63,630 63,630 84,320 9282Transfer to Water Meter Replacement205,099 205,100 275,100 485,100 500,000 Total 1,254,072 1,118,480 691,420 901,420 969,530 Water Expenses3,927,737 $ 3,772,447 $ 3,517,550 $ 4,007,708 $ 4,464,200 $ Page 168
Page 169
Sewer - Collection
DIVISION MISSION AND DESCRIPTION
The Sewer-Collection division strives to provide an efficient sewage system to protect the public health, safety, and water quality of the community. The responsibilities of this division include maintaining the sewer collection system; making service taps and installing new service; and timely replacing deteriorated sections of mains and service lines
DIVISION GOALS AND ACTION ITEMS FOR FY 2024
Strategic Plan categories addressed below: Governance, Quality of Life
Goal: Provide reliable operation of sewer service
Action Item: Flush sewer lines, replace failing sewer mains, and install city cleanouts where there currently are none
Goal: Prepare for future growth and additional demand for services
Action Item: Analyze and implement elements of the wastewater master plan
Goal: Continue enforcement of the City’s fats, oils, and grease ordinance
Action Item: Review all non-residential development plans and monitor cleaning and maintenance of grease traps
SIGNIFICANT CHANGES IN THE FY 2024 BUDGET
Appropriations for wages, taxes, and retirement increase to account for growth in salaries
Transfers for capital projects decrease after the deferral of the Mary Jane and E Avenue J sewer line project in FY 2023
Transfers for equipment replacement reflects changes to the funding plan for FY 2024
FY 2022FY 2023FY 2023FY 2024 WORKLOAD MEASURES ACTUAL BUDGET ESTIMATE BUDGET Miles of sanitary sewer lines maintained 132 129 138 139 Number of requests due to sewer blockage 62 70 65 60 Number of sewer taps made 272 425 282 300 PERFORMANCE MEASURES Percent of sewer system washed annually 15%15%15%15% Percent of days in compliance with quality standards 100%100%100%100% Percent of grease traps inspected annually 100%100%100%100% PERSONNEL Senior Maintenance Technician 1.00 1.00 1.00 1.00 Maintenance Technician II 2.00 2.00 1.00 1.00 Maintenance Technician I 2.00 2.00 3.00 3.00 Total Employees (Full-Time Equivalents) 5.00 5.00 5.00 5.00 Page 170
Water & Sewer Fund - Sewer - Collection (202-4-221)
Account FY 2021FY 2022FY 2023FY 2023FY 2024 Number Account Name ActualActualBudgetEstimatedBudget Personnel 1010Salaries and Wages 194,278 $ 184,296 $ 184,100 $ 163,680 $ 203,780 $ 1070Overtime Pay 15,404 17,035 13,000 14,500 14,000 1210TMRS 21,931 21,238 20,740 19,000 23,700 1220FICA 16,172 15,250 15,080 13,600 16,660 1230Employee Insurance34,393 34,254 44,150 33,500 35,940 1240Workers' Comp. Insurance2,523 3,320 3,390 4,700 5,680 1250Unemployment Compensation1,561 57 680 100 450 Total 286,262 275,450 281,140 249,080 300,210 Supplies 2010Office Supplies376 209 - -2030Chemical Supplies4,402 7,040 7,900 7,900 7,900 2090Tools and Other Supplies6,222 8,881 7,850 7,000 8,600 2220Fuel13,643 18,822 15,000 17,670 18,560 2400Clothing4,122 3,464 4,650 5,000 5,750 2500Small Equipment3,756 - - -Total32,521 38,416 35,400 37,570 40,810 Maintenance 3230Sewer Line11,423 65,958 21,000 16,000 22,000 4020Machinery and Equipment3,638 3,726 6,500 6,500 6,500 Total15,061 69,684 27,500 22,500 28,500 Services 5100Dues and Publications250 336 380 380 380 5110License & Certification923 391 1,350 550 1,490 5130 Travel and Training 2,060 1,545 2,470 2,000 2,040 5341Info Tech Services 21,189 15,720 14,670 14,670 12,970 5500General Liability 5,452 6,119 6,610 5,417 6,360 Total 29,874 24,111 25,480 23,017 23,240 Capital Outlay 8100Buildings 19,993 - - -8200Machinery and Equipment 5,319 - - -Total 25,312 - - -Transfers 9101Transfer to General Fund 82,038 86,260 88,030 88,030 87,210 9160Transfer to Grant Fund 1,109 - - -9199Transfer to General Fund 157,786 164,470 177,330 177,330 194,000 9209Transfer to Water and Sewer Cap 100,000 1,000,000 450,000 450,000 100,000 9279Transfer to Water and Sewer Equip 145,857 69,900 59,220 59,220 25,830 Total 486,790 1,320,630 774,580 774,580 407,040 Sewer - Collection Expenses875,820 $ 1,728,291 $ 1,144,100 $ 1,106,747 $ 799,800 $
Page 171
Sewer – Lift Stations
DIVISION MISSION AND DESCRIPTION
The mission of the Sewer-Lift Stations division is to provide for the operation and maintenance of the lift stations that are a vital element of the sewer collection system. The responsibilities of this division include maintaining seventeen lift stations; inspecting and monitoring the operational status of the lift stations; and ensuring that all stations receive proper preventive maintenance
DIVISION GOALS AND ACTION ITEMS FOR FY 2024
Strategic Plan categories addressed below: Governance, Quality of Life
Goal: Provide reliable operation of sewer service
Action Item: Analyze, repair, and upgrade communication signals at problematic sites
Goal: Reduce employee callouts due to power failures
Action Item: Install emergency generators at selected sites
Goal: Reduce areas of inflow/infiltration into the sewer system
Action Item: Investigate all upstream manholes and cleanouts, making adjustments as necessary
SIGNIFICANT CHANGES IN THE FY 2024 BUDGET
Lift station maintenance expenses increase after the addition of the South Belton regional lift station
Treatment plant operations expense increases as maintenance costs and treatment volume grows
Transfers for capital projects increase to set aside cash for significant utility projects
PERFORMANCE MEASURES
FY 2022FY 2023FY 2023FY 2024 WORKLOAD MEASURES ACTUAL BUDGET ESTIMATE BUDGET Number of lift stations 16 18 17 17 Number of lift stations with SCADA 12 15 13 13 Number of lift stations with generators 7 12 10 10
Percent of lift station generators cleaned annually 100%100%100%100% Percent of days in compliance with quality standards 100%100%100%100% Percent of days without an overflow 100%100%100%100% PERSONNEL Lift Station Mechanic 1.00 1.00 1.00 1.00 Total Employees (Full-Time Equivalents) 1.00 1.00 1.00 1.00 Page 172
Water & Sewer Fund - Sewer - Lift Stations (202-4-222)
Account FY 2021FY 2022FY 2023FY 2023FY 2024 Number Account Name ActualActualBudgetEstimatedBudget Personnel 1010 Administrative Salaries 42,083 $ 44,764 $ 47,940 $ 48,300 $ 55,200 $ 1070Overtime Pay 1,666 1,075 1,320 1,010 1,100 1210TMRS 4,665 4,816 5,190 5,090 6,140 1220FICA 2,821 2,882 3,670 3,000 4,230 1230Employee Insurance8,082 9,599 11,560 9,940 10,490 1240Workers' Comp. Insurance496 664 900 940 1,360 1250Unemployment Compensation252 9 140 20 90 Total 60,065 63,809 70,720 68,300 78,610 Supplies 2030Chemical Supplies1,375 186 2,700 400 700 2090Tools and Other Supplies653 851 1,750 520 1,750 2220Fuel2,346 3,318 2,700 4,850 5,100 2400Clothing760 799 1,040 900 1,040 2500Small Equipment1,050 - - -Total6,184 5,154 8,190 6,670 8,590 Maintenance 3240Lift Station34,740 81,349 37,000 31,250 45,000 4020Machinery and Equipment4,317 909 6,700 2,100 6,700 Total39,057 82,258 43,700 33,350 51,700 Services 5100Dues and Publications75 75 80 80 80 5110License & Certification111 - 110 110 110 5130Travel and Training392 - 830 100 830 5500 General Liability 8,234 8,138 8,790 8,870 10,660 5820Gas Service 2,025 3,820 3,100 3,470 4,000 5830Electric Service 28,123 56,618 59,520 55,960 62,670 Total 38,960 68,651 72,430 68,590 78,350 Sewage Treatment 7330TBWWTP Operations 738,793 742,303 813,520 810,000 874,420 7340TBWWTP and Main Lift Station 87,775 60,917 65,000 64,500 65,000 Total 826,568 803,220 878,520 874,500 939,420 Capital Outlay 8951Lift Station 67,100 - - -Total 67,100 - - -Transfers 9160Transfer to Grant Fund 451 - - -9209Transfer to Water and Sewer Cap - 390,000 2,100,000 2,100,000 3,000,000 9274Transfer to 2015 CO's - W/S 114,577 - - -9279Transfer to Water and Sewer Equip 3,760 3,900 3,530 3,530 6,070 Total 118,788 393,900 2,103,530 2,103,530 3,006,070 Sewer - Lift Stations Expenses1,156,722 $ 1,416,992 $ 3,177,090 $ 3,154,940 $ 4,162,740 $
Page 173
Water & Sewer - Other Costs
DIVISION MISSION AND DESCRIPTION
The Water & Sewer Other Costs division contains funding for several non-departmental items, including debt payments, capital transfers, and funding for contingencies that may occur during the fiscal year. The division also accounts for anticipated pay adjustments for employees Because this division performs no activity, the various goals, measures, and personnel are not listed. The expenses previously reported here have been transferred into other divisions beginning in FY 2022.
DIVISION GOALS AND ACTION ITEMS FOR FY 2024
Strategic Plan categories addressed below: N/A
Goal: N/A
Action Item: N/A
Goal: N/A
Action Item: N/A
Goal: N/A
Action Item: N/A
SIGNIFICANT CHANGES IN THE FY 2024 BUDGET
N/A
FY 2022FY 2023FY 2023FY 2024 WORKLOAD MEASURES ACTUAL BUDGET ESTIMATE BUDGET N/A N/A N/A N/A N/A N/A N/A N/A N/A N/A N/A N/A N/A N/A N/A
N/A N/A N/A N/A N/A N/A N/A N/A N/A N/A N/A N/A N/A N/A N/A Page 174
PERFORMANCE MEASURES
Account FY 2021FY 2022FY 2023FY 2023FY 2024 Number Account Name ActualActualBudgetEstimatedBudget Debt Service 6010Principal Payments 1,029,900 $ - $ - $ - $ - $ 6020Interest Payments 506,648 - - -6100Paying Agent Fees 848 - - -6110 Arbitrage Rebate Calculation Fees 3,909 - - -Total 1,541,305 - - -Other Expenses 7700Contingency - - -Total - - - -Transfers 9209Transfer to Water & Sewer Capital 500,000 - - -Total 500,000 - - -Other Costs Expenses2,041,305 $ - $ - $ - $ - $ Water & Sewer Fund - Other Costs (202-4-230) Page 175
Water & Sewer Fund
Amortization
PaymentPrincipalInterest Principal Balance 9/30/2022 20,413,950 $ FY 2024 1,949,968 1,365,800 584,168 19,048,150 FY 2025 1,952,275 1,406,250 546,025 17,641,900 FY 2026 1,953,264 1,446,700 506,564 16,195,200 FY 2027 1,948,724 1,487,150 461,574 14,708,050 FY 2028 2,013,205 1,598,050 415,155 13,110,000 FY 2029 1,649,308 1,285,000 364,308 11,825,000 FY 2030 1,647,908 1,325,000 322,908 10,500,000 FY 2031 1,645,208 1,365,000 280,208 9,135,000 FY 2032 1,646,158 1,410,000 236,158 7,725,000 FY 2033 1,642,058 1,445,000 197,058 6,280,000 FY 2034 1,651,958 1,495,000 156,958 4,785,000 FY 2035 1,650,458 1,535,000 115,458 3,250,000 FY 2036 1,087,808 1,015,000 72,808 2,235,000 FY 2037 400,858 355,000 45,858 1,880,000 FY 2038 398,758 360,000 38,758 1,520,000 FY 2039 401,558 370,000 31,558 1,150,000 FY 2040 399,158 375,000 24,158 775,000 FY 2041 401,470 385,000 16,470 390,000 FY 2042 398,385 390,000 8,385Grand Total24,838,480 $ 20,413,950 $ 4,424,530 $ - $ Page 176
Summary Grand Total - All Obligations
Water & Sewer Fund
Certificates of Obligation, Series 2008
Purpose Proceeds from the sale of the Series 2008 Certificates will be used for (i) constructing, improving, extending and upgrading City streets, bridges, sidewalks, intersections and other traffic improvements; (ii) constructing, improving and extending the City's waterworks and sewer system; and (iii) the payment of professional services in connection therewith.
Bond Amount $180,000 Date of Issue 8/1/2008 Interest Rate 4.19% Date of Maturity 8/1/2028
PaymentPrincipalInterest Principal Balance 9/30/2023 58,950 $ FY 2024 13,270 10,800 2,470 48,150 FY 2025 13,267 11,250 2,017 36,900 FY 2026 13,246 11,700 1,546 25,200 FY 2027 13,206 12,150 1,056 13,050 FY 2028 13,597 13,050 547Total 66,586 $ 58,950 $ 7,636 $ - $ Page 177
Purpose
Water & Sewer Fund
Certificates of Obligation, Series 2015
Proceeds from the sale of the Certificates will be used for (i) constructing, improving, extending, expanding, upgrading and/or developing City streets, bridges, sidewalks, intersections and other traffic improvement projects, any related drainage improvements (ii) constructing, improving, and/or extending the City's waterworks and sewer system; and (iii) the payment of professional services in connection therewith.
Bond Amount $8,595,000 Date of Issue 4/1/2015 Interest Rate 2.0% - 3.0% Date of Maturity 8/1/2035
PaymentPrincipalInterest Principal Balance 9/30/2023 5,635,000 $ FY 2024 565,900 405,000 160,900 5,230,000 FY 2025 562,800 410,000 152,800 4,820,000 FY 2026 564,600 420,000 144,600 4,400,000 FY 2027 567,000 435,000 132,000 3,965,000 FY 2028 563,950 445,000 118,950 3,520,000 FY 2029 565,600 460,000 105,600 3,060,000 FY 2030 566,800 475,000 91,800 2,585,000 FY 2031 562,550 485,000 77,550 2,100,000 FY 2032 563,000 500,000 63,000 1,600,000 FY 2033 563,000 515,000 48,000 1,085,000 FY 2034 567,550 535,000 32,550 550,000 FY 2035 566,500 550,000 16,500Total 6,779,250 $ 5,635,000 $ 1,144,250 $ - $ Page 178
Purpose
Water & Sewer Fund
Certificates of Obligation, Series 2016
Proceeds from the sale of the Certificates will be used for (i) constructing, improving and/or extending the City's water and sewer system, including construction of a North Belton water tank and South Belton sewer extension, including the acquisition of any necessary easements of land and (ii) the payment of professional services in connection therewith.
Bond Amount $9,585,000 Date of Issue 12/1/2016 Interest Rate 3.00% Date of Maturity 8/1/2036
PaymentPrincipalInterest Principal Balance 9/30/2023 8,215,000 $ FY 2024 856,450 610,000 246,450 7,605,000 FY 2025 858,150 630,000 228,150 6,975,000 FY 2026 859,250 650,000 209,250 6,325,000 FY 2027 854,750 665,000 189,750 5,660,000 FY 2028 1,034,800 865,000 169,800 4,795,000 FY 2029 683,850 540,000 143,850 4,255,000 FY 2030 682,650 555,000 127,650 3,700,000 FY 2031 681,000 570,000 111,000 3,130,000 FY 2032 683,900 590,000 93,900 2,540,000 FY 2033 681,200 605,000 76,200 1,935,000 FY 2034 683,050 625,000 58,050 1,310,000 FY 2035 684,300 645,000 39,300 665,000 FY 2036 684,950 665,000 19,950Total 9,928,300 $ 8,215,000 $ 1,713,300 $ - $ Page 179
Purpose
Water & Sewer Fund
General Obligation Refunding Bonds, Series 2017
Proceeds from the sale of the Bonds will be used for (i) refunding certain maturities of the City's outstanding obligations (specifically the Certificates of Obligation, Series 2007) to achieve a debt service savings, and (ii) paying the costs of issuing the Bonds.
Bond Amount $1,350,000 Date of Issue 5/31/2017 Interest Rate 1.05% - 2.10% Date of Maturity 8/1/2027
PaymentPrincipalInterest Principal Balance 9/30/2023 435,000 $ FY 2024 113,490 105,000 8,490 330,000 FY 2025 116,600 110,000 6,600 220,000 FY 2026 114,510 110,000 4,510 110,000 FY 2027 112,310 110,000 2,310Total 456,910 $ 435,000 $ 21,910 $ - $ Page 180
Purpose
Water & Sewer Fund
Certificates of Obligation, Series 2022
Proceeds from the sale of the Certificates will be used for (i) constructing, improving and/or extending the City's water and sewer system, including construction of a North Belton elevated storage tank, McFarland Estates water and sewer improvements, Sixth Avenue water line replacement, and Loop 121 pump replacements, including any associated street and sidewalk improvements, including the acquisition of any necessary easements of land and (ii) the payment of professional services in connection therewith.
Bond Amount $6,295,000 Date of Issue 2/8/2022 Interest Rate 2.00% - 4.00% Date of Maturity 8/1/2042
PaymentPrincipalInterest Principal Balance 9/30/2023 6,070,000 $ FY 2024 400,858 235,000 165,858 5,835,000 FY 2025 401,458 245,000 156,458 5,590,000 FY 2026 401,658 255,000 146,658 5,335,000 FY 2027 401,458 265,000 136,458 5,070,000 FY 2028 400,858 275,000 125858 4,795,000 FY 2029 399,858 285,000 114,858 4,510,000 FY 2030 398,458 295,000 103,458 4,215,000 FY 2031 401,658 310,000 91,658 3,905,000 FY 2032 399,258 320,000 79,258 3,585,000 FY 2033 397,858 325,000 72,858 3,260,000 FY 2034 401,358 335,000 66,358 2,925,000 FY 2035 399,658 340,000 59,658 2,585,000 FY 2036 402,858 350,000 52,858 2,235,000 FY 2037 400,858 355,000 45,858 1,880,000 FY 2038 398,758 360,000 38,758 1,520,000 FY 2039 401,558 370,000 31,558 1,150,000 FY 2040 399,158 375,000 24,158 775,000 FY 2041 401,470 385,000 16,470 390,000 FY 2042 398,385 390,000 8,385Total 7,607,434 $ 6,070,000 $ 1,537,434 $ - $ Page 181
Water & Sewer Fund Long-Term Forecast
FY 2024FY 2025FY 2026FY 2027FY 2028 Beginning Fund Balance $ 6,717,536 $ 6,852,756 $ 8,284,913 $ 9,011,197 $ 8,763,735 Water Revenue6,146,600 6,638,328 7,169,394 7,742,946 8,362,381 Sewer Revenue6,675,610 7,209,659 7,786,432 8,409,346 9,082,094 Other Revenues1,205,110 1,229,212 1,253,796 1,278,872 1,304,450 Total Revenue14,027,320 15,077,199 16,209,622 17,431,164 18,748,925 Personnel2,249,400 2,534,364 2,776,426 2,943,011 3,119,592 Other Expenditures4,032,680 4,819,357 5,468,831 6,201,522 6,839,544 Debt Service 1,955,340 2,625,092 4,212,244 4,515,960 4,575,564 Transfers5,077,180 2,228,728 2,338,338 2,455,632 2,581,160 Capital577,500 1,437,500 687,500 1,562,500 1,312,500 Total Expenditures13,892,100 13,645,042 15,483,339 17,678,626 18,428,360 Revenue Over/(Under) Expenditures 135,220 1,432,157 726,284 (247,462) 320,565 Ending Fund Balance $ 6,852,756 $ 8,284,913 $ 9,011,197 $ 8,763,735 $ 9,084,300 Less: 3-Month Minimum Balance3,470,126 $ 3,411,260 $ 3,870,835 $ 4,419,656 $ 4,607,090 $ Less: Debt Service1,955,340 $ 2,625,092 $ 4,212,244 $ 4,515,960 $ 4,575,564 $ 5,425,466 $ 6,036,352 $ 8,083,079 $ 8,935,616 $ 9,182,654 $ Forecasted Fund Balance in Excess of Minimum $ 1,427,290 $ 2,248,561 $ 928,118 $ (171,881) $ (98,354)
$4,500,000 $5,000,000 $5,500,000 $6,000,000 $6,500,000 $7,000,000 $7,500,000 $8,000,000 $8,500,000 $9,000,000 $9,500,000 FY 2024FY 2025FY 2026FY 2027FY 2028 Forecasted Ending Fund Balance Minimum Fund Balance Ending Fund Balance Page 182
Water and Sewer Fund Long-Term Forecast Assumptions
Revenue Forecast
Waterandsewerrevenuesareprojectedtogrowby8%peryear.Higherrevenueisdrivenby greaterconsumptionfromagrowingpopulationaswellasrisingutilityrates.In2022,theCity conductedawaterandsewerratestudytoestablishabaselineforfutureratesthatmayberequiredto coverpendingutilityprojects.
Otherrevenueisprincipallycomprisedofinterestincome,creditcardfees,tapfees,and transfersfromotherfunds.TheCityisprojectinganaveragegrowthrateof2%forotherrevenue. Tapsfeeswilllikelyincreasewiththecustomercount.Transfersforallocatedpersonnelwillincrease alongwithannualsalaries.InterestincomeisprojectedtofallfromthelevelseeninFY2024but remainsstableintheoutyears.
ExpenditureForecast
PersonnelcostsgrowconsiderablyinFY2024withtheadditionofanAssistantDirectorof PublicWorkspositionandtwoMeterReaderpositions.Forfutureyears,a6%increaseinpersonnel costsshouldcoverannualpayincreases,retirementcontributions,andinsurancepremiums.The needforuptofouradditionalpositionswasidentifiedduringthestrategicplanningworkshops.The costforadditionalpositionsisnotincludedinthelong-termforecastassumptions.
Otherexpendituresconsistofoperatingexpensesforwaterandsewerlines/liftstations,and waterpurchases.Thisexpenditurecategoryisgreatlyimpactedbyinflationandaginginfrastructure thatrequiresmoremaintenance.Weareprojectingan8%increaseperyeartomeetthe water/wastewaterneedsofoursystem.
Transfers,debtservice,andcapitalexpendituresaredependentontransfersforallocated personnelandadministrativecosts,debtservicepayments,andcapitalprojectsthatarefundedwith operatingfunds.Theseitemsvaryperyear.
FutureBudgetsandStrategicGoals
CityCouncildeterminedthequalityoflifeasbeingoneofthegoalsinourstrategicplan.Partof thequalityoflifegoalishavingadequatewaterandwastewaterinfrastructure.Ourlong-termforecast ispreparingfortheincreaseddemandforourwaterandwastewatersystems.Wehavealso accountedformanyinfrastructureprojectsinthewaterandsewersystemthatneedupdatingor reconstruction.Inthefiscalyear2024,specifically,wehaveaddedmanynewemployeestoalso addressthestrategicgoalofservicedeliverywiththedesiretoaddmoreemployeesasneededto ensureourcommunityhasthebestcustomerservicepossible.
Asshowninthelong-rangeoperatingfinancialplan,thefundbalancewillbeatorbelowthe minimumamountallowedbypolicyinFY2027andFY2028.Utilityratesand/ordiscretionary expendituresmayneedtobeadjustedinthoseyearstoincreasereserves.
Water revenue growth8% Personnel cost growth6% Sewer revenue growth8% Other expenditure growth8% Other revenue growth2% Transfers, debt and capitalAs Needed
Revenue Assumptions Expenditure Assumptions
Page 183
Page 184
Overview

The Drainage Fund is responsible for maintaining the City's drainage system and protecting the water quality through stormwatermaintenance. Beltonhasseveral bodies of water, and a landscape that has many elevation changes., This can be a potentialproblemifdrainageisnotapriority. The City is blessed to have an amazing staff
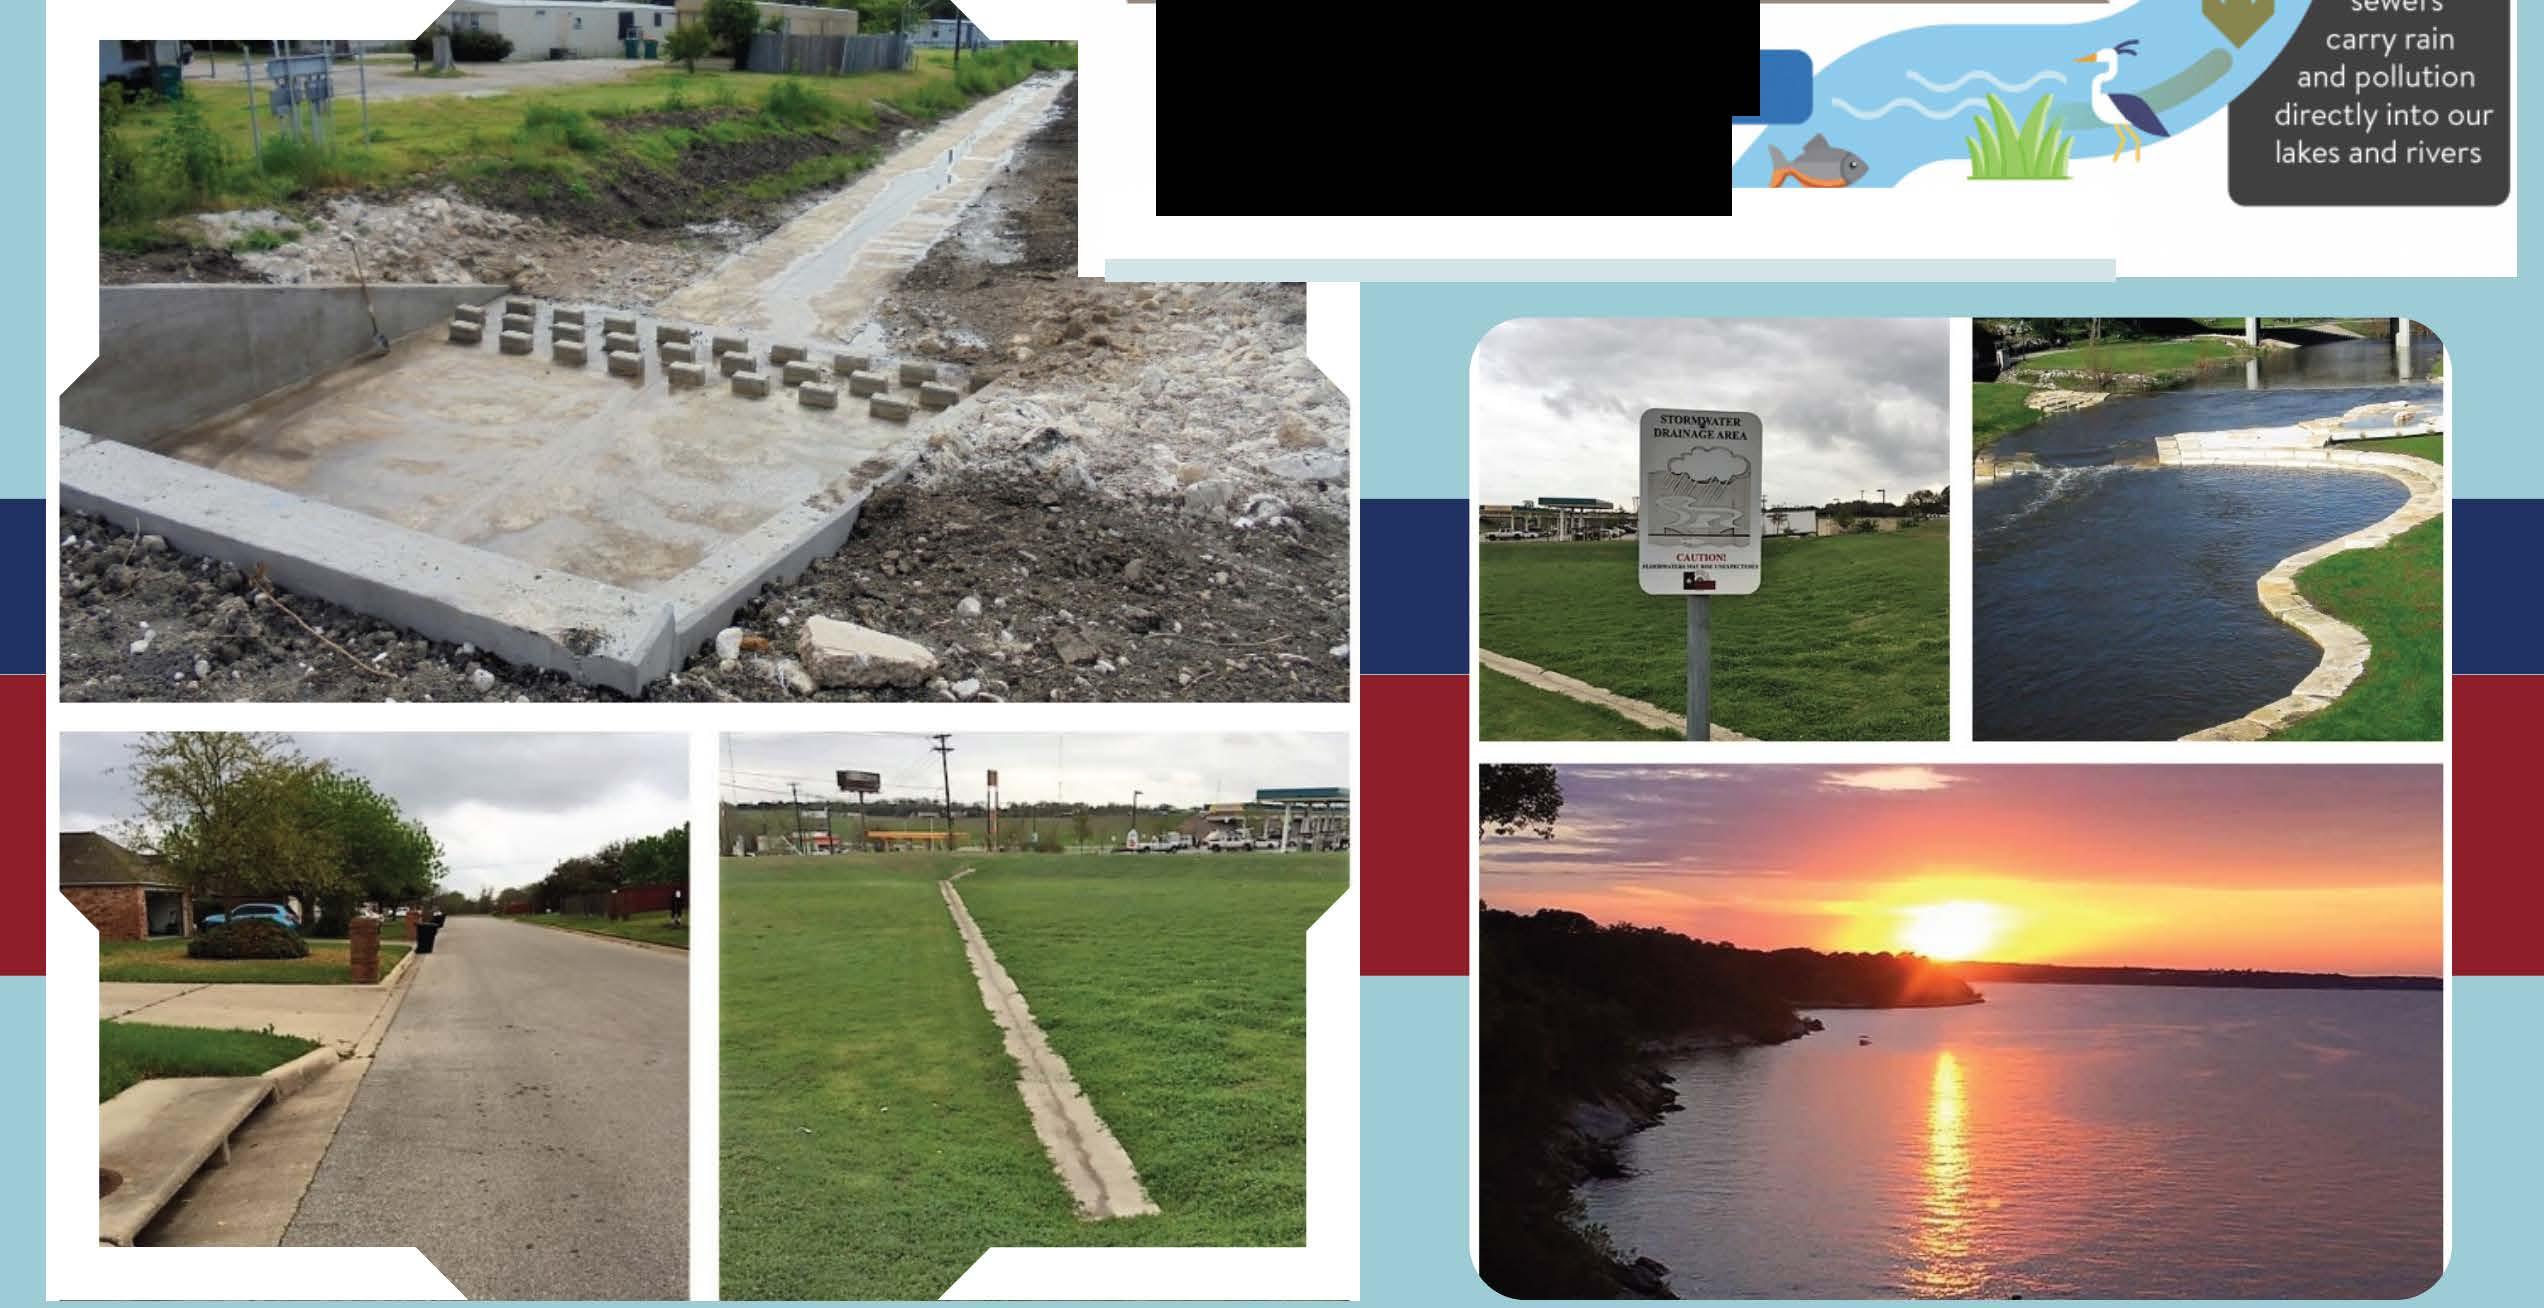

that addresses these issues on a
preventative basis to ensure great customer servicetoourcitizens.

StormwaterPollution ✓✓✓✓✓✓✓✓ ✓ , ✓✓�✓✓ ,__ j-, ✓✓✓ Ourcitiesand towns havelots of paved surfaces that wash pollution intoourlakes and rivers when it rains.
��
Healthy ecosystems need clean water ImageprovidedbyMinnesotaPollutionControlAgency
Drainage Fund Overview / Statement of Fund Balance
The Drainage Fund is an enterprise fund that is used to account for all costs related to stormwater management. These activities are financed through a drainage fee charged to residents. In November 2007, City Council declared by ordinance that drainage was a utility of the City. The storm drainage fees became effective in February 2008.
1 Excludes Use of Prior Years' Fund Balance
2 An adjustment is made to unrestricted net assets, if necessary, during the conversion from a budget basis to an accrual basis (GAAP).
3 City policy requires a minimum fund balance of three months of budgeted expenditures plus one year of debt service.
Actual ActualBudgetEstimatedProjected Fiscal Year Ending September 30 2021 2022 2023 2023 2024 Budget Basis: Beginning Unrestricted Net Assets (GAAP) 256,816 $ 317,237 $ 297,483 $ 297,483 $ 364,253 $ Revenues 1 531,566 561,415 582,100 622,847 647,530 Expenses (484,169) (534,951) (582,100) (556,077) (759,460) Net Increase / (Decrease) in Net Assets 47,397 26,464 - 66,770 (111,930) Ending Unrestricted Net Assets (Budget) 304,213 $ 343,701 $ 297,483 $ 364,253 $ 252,323 $ Reconciliation to GAAP: Ending Unrestricted Net Assets (Budget) 304,213 $ 343,701 $ 297,483 $ 364,253 $ 252,323 $ Adjustment 2 13,024 (46,218) - -Unrestricted Net Assets (GAAP) 317,237 297,483 297,483 364,253 252,323 Restricted Net Assets (GAAP) - - - -Net Investment in Capital Assets (GAAP) 4,287,467 4,077,832 3,780,832 3,780,832 3,483,832 Total Fund Balance (GAAP) 4,604,704 $ 4,375,315 $ 4,078,315 $ 4,145,085 $ 3,736,155 $ Minimum Unrestricted Net Assets3 158,605 $ 167,905 $ 170,235 $ 170,235 $ 186,583 $ Unrestricted Net Assets in Excess of Minimum 158,632 $ 129,578 $ 127,248 $ 194,018 $ 65,740 $ Notes:
$‐$500,000 $1,000,000 $1,500,000 $2,000,000 $2,500,000 $3,000,000 $3,500,000 $4,000,000 $4,500,000 $5,000,000 2021 Actual2022 Actual 2023 Budget 2023 Estimated 2024 Projected Fund Balance Fiscal Year Ending September 30 Fund Balance History Unrestricted Net Assets (GAAP) Restricted Net Assets (GAAP) Net Investment in Capital Assets (GAAP) Page 186
Drainage Fund Revenue Trend
FY 2020FY 2021FY 2022FY 2023FY 2023FY 2024 ActualActualActualBudgetEstimatedBudget Revenues Storm Drainage Fee 517,462 $ 531,251 $ 558,905 $ 579,000 $ 605,057 $ 635,300 $ Miscellaneous Income 2,799 315 2,510 3,100 17,790 12,230 Use of Accumulated Reserves - - - - - 111,930 Total Revenue 520,261 $ 531,566 $ 561,415 $ 582,100 $ 622,847 $ 759,460 $ $‐$100,000 $200,000 $300,000 $400,000 $500,000 $600,000 $700,000 $800,000 2020 Actual2021 Actual2022 Actual2023 Budget2023 Estimate2024 Budget Storm Drainage Fee Miscellaneous Income Other Financing Sources Page 187
Drainage Fund (707-3) Revenues
Account FY 2021FY 2022FY 2023FY 2023FY 2024 Number Account Name ActualActualBudgetEstimatedBudget Charges for Service 5700Storm Drainage Fee 531,251 $ 558,905 $ 579,000 $ 605,057 $ 635,300 $ Total 531,251 558,905 579,000 605,057 635,300 Miscellaneous Income 9100Interest Income 315 2,510 600 15,290 12,230 Total 315 2,510 600 15,290 12,230 Other Financial Sources 8161Transfer from ARPA Fund - - 2,500 2,5009999Use of Accumulated Reserves - - - - 111,930 Total - - 2,500 2,500 111,930 Drainage Fund Revenues531,566 $ 561,415 $ 582,100 $ 622,847 $ 759,460 $
Page 188
Drainage Fund Category Summary


FY 2024 Expenses by Category


FY 2021FY 2022FY 2023FY 2023FY 2024 Description ActalActualBudgetEstimatedBudget Personnel 235,704 $ 253,905 $ 201,880 $ 199,620 $ 206,460 $ Supplies 15,986 28,822 17,120 20,760 39,130 Maintenance 13,041 24,703 54,360 37,500 73,000 Services 15,295 23,472 37,560 27,140 66,690 Debt 25,708 24,869 25,130 25,007 25,120 Capital Outlay - - - -Transfers 178,435 179,180 246,050 246,050 349,060 Drainage Fund 484,169 $ 534,951 $ 582,100 $ 556,077 $ 759,460 $
Personnel 27% Supplies 5% Maintenance 10% Services 9% Debt 3% Transfers 46%
Personnel Supplies Maintenance Services Debt Transfers Page 189
Drainage
DIVISION MISSION AND DESCRIPTION
The mission of the Drainage division is to provide and maintain a stormwater management system that conveys stormwater in a safe manner. The responsibilities of this division include constructing and maintaining drainage infrastructure; addressing a hierarchy of storm drainage priorities; maintaining the stormwater master plan; and sweeping the City to aid in the protection of water quality.
DIVISION GOALS AND ACTION ITEMS FOR FY 2024
Strategic Plan categories addressed below: Governance, Quality of Life
Goal: Ensure functionality and capacity of City-owned drainage facilities
Action Item: Mow, inspect, and clean all drainage facilities at least quarterly
Goal: Reduce stormwater pollutants and improve curb appearance
Action Item: Sweep all City streets at least once per year and downtown areas ahead of scheduled events
Goal: Minimize illicit discharges in stormwater runoff
Action Item: Identify, clean, and proactively mitigate pollutants in drainage channels
SIGNIFICANT CHANGES IN THE FY 2024 BUDGET
Flood warning expenses decrease after the replacement of various sensors during FY 2023
Transfers for capital projects decline due to the TIRZ Fund participation in the E 4th/N Blair drainage project
Transfers for capital equipment increase to accelerate funding for a six-year street sweeper in 2026
PERFORMANCE MEASURES
FY 2022FY 2023FY 2023FY 2024 WORKLOAD MEASURES ACTUALBUDGETESTIMATEBUDGET Number of city-owned and maintained detention ponds 18 18 19 19 Number of hours spent maintaining ponds and channels 3,000 3,200 3,200 3,300 Cubic yards of materials collected by street sweeper 2,400 2,400 2,400 2,500
Percent of streets swept annually 100%100%100%100% Percent of days in compliance with quality standards 100%100%100%100% Percent of City-owned detention ponds maintained annually 100%100%100%100% PERSONNEL Senior Maintenance Technician 1.00 1.00 1.00 1.00 Maintenance Technician I 3.00 3.00 3.00 3.00 Total Employees (Full-Time Equivalents) 4.00 4.00 4.00 4.00 Page 190
Account FY 2021FY 2022FY 2023FY 2023FY 2024 Number Account Name ActualActualBudgetEstimatedBudget Personnel 1010Salaries and Wages 178,647 $ 181,022 $ 136,350 $ 135,000 $ 142,920 $ 1070Overtime Pay 920 945 1,000 1,600 1,100 1210TMRS 17,393 19,167 14,450 14,500 15,710 1220 FICA 12,561 13,791 10,510 10,500 11,020 1230Employee Insurance21,908 35,261 34,060 33,500 29,420 1240Workers' Comp. Insurance2,898 3,695 4,970 4,450 5,930 1250Unemployment Compensation1,377 24 540 70 360 Total 235,704 253,905 201,880 199,620 206,460 Supplies 2030Chemical Supplies 298 - 250 190 250 2090Tools and Other Supplies 3,228 12,146 4,460 3,000 20,460 2220Fuel 7,347 13,440 9,50014,770 15,510 2400Clothing 2,550 3,236 2,9102,800 2,910 2500Small Equipment 2,563 - - -Total 15,986 28,822 17,120 20,760 39,130 Maintenance 3630Drainage Facilities 9,319 1,001 25,000 12,000 60,000 4020Machinery and Equipment 1,213 4,997 1,500 3,500 3,000 4200Flood Warning 2,509 18,705 27,860 22,000 10,000 Total 13,041 24,703 54,360 37,500 73,000 Services 5020Public Education 547 2,669 3,500 2,700 4,300 5100Dues and Publications 202 22 500 100 500 5130Travel and Training 30 - 1,000 5001,000 5220Equipment Rental 2,055 - 3,000 1,500 2,000 5340Building Maintenance Services - - - - 8,080 5341Info Tech Services - - 6,770 6,770 7,820 5500General Liability 2,608 2,484 2,7902,570 2,990 5620Engineering 9,853 18,297 20,000 13,000 15,000 5630Consulting - - - - 25,000 Total 15,295 23,472 37,560 27,140 66,690 Debt Service 6010Principal Payments 18,425 18,425 19,300 19,263 20,100 6020Interest Payments 6,948 6,176 5,410 5,404 4,600 6100Paying Agent Fees 67 - 70 70 70 6110 Arbitrage Rebate Calculation Fees 268 268 350 270 350 Total 25,708 24,869 25,130 25,007 25,120 Transfers 9101Transfer to General Fund - - 46,650 46,650 47,580 9202Transfer to Water and Sewer Fund - - 53,900 53,900 55,210 9160Transfer to Grant Fund 75 - - -9767Transfer to Drainage Capital Proj 150,000 150,000 96,780 96,780 87,550 9787Transfer to Drainage Capital Equip 28,360 29,180 48,720 48,720 158,720 Total 178,435 179,180 246,050 246,050 349,060 Drainage Fund Expenses484,169 $ 534,951 $ 582,100 $ 556,077 $ 759,460 $ Drainage
Page 191
Fund (707-4-080)
Drainage Fund
Amortization Summary Grand Total - All Obligations PaymentPrincipalInterest Principal Balance 9/30/2023109,712 $ FY 2024 24,697 20,100 4,597 89,612 FY 2025 24,693 20,938 3,755 68,674 FY 2026 24,652 21,775 2,877 46,899 FY 2027 24,577 22,612 1,965 24,287 FY 2028 25,305 24,287 1,018Grand Total 123,924 $ 109,712 $ 14,212 $ - $ Page 192
Drainage Fund
Certificates of Obligation, Series 2008
Purpose Proceeds from the sale of the Series 2008 Certificates will be used for (i) constructing, improving, extending and upgrading City streets, bridges, sidewalks, intersections and other traffic improvements; (ii) constructing, improving and extending the City's waterworks and sewer system; and (iii) the payment of professional services in connection therewith.
Bond Amount $335,000 Date of Issue 8/1/2008 Interest Rate 4.19% Date of Maturity 8/1/2028
PaymentPrincipalInterest Principal Balance 9/30/2023 109,712 $ FY 202424,697 20,100 4,597 89,612 FY 2025 24,693 20,938 3,755 68,674 FY 2026 24,652 21,775 2,877 46,899 FY 2027 24,577 22,612 1,965 24,287 FY 2028 25,305 24,287 1,018Total 123,924 $ 109,712 $ 14,212 $ - $ Page 193
Drainage Fund Long-Term Forecast
FY 2024FY 2025FY 2026FY 2027FY 2028 Beginning Fund Balance $ 364,253 $ 364,253 $ 368,500 $ 376,298 $ 360,581 Storm Drainage Fee635,300 667,065 700,418 735,439 772,211 Other Revenues12,230 12,230 12,230 12,230 12,230 Total Revenue647,530 679,295 712,648 747,669 784,441 Personnel204,730 217,014 230,035 243,837 258,467 Other Expenditures118,620 128,110 138,358 149,427 161,381 Debt Service 25,120 24,697 24,693 51,427 117,002 Transfers299,060 305,227 311,765 318,695 326,040 Capital- - - -Total Expenditures647,530 675,048 704,851 763,385 862,890 Revenue Over/(Under) Expenditures - 4,247 7,797 (15,716) (78,449) Ending Fund Balance $ 364,253 $ 368,500 $ 376,298 $ 360,581 $ 282,133 Less: 3-Month Minimum Balance161,883 $ 168,762 $ 176,213 $ 190,846 $ 215,723 $ Less: Debt Service25,120 $ 24,697 $ 24,693 $ 51,427 $ 117,002 $ 187,003 $ 193,459 $ 200,906 $ 242,273 $ 332,725 $ Forecasted Fund Balance in Excess of Minimum $ 177,251 $ 175,041 $ 175,392 $ 118,308 $ (50,592)
$150,000 $200,000 $250,000 $300,000 $350,000 $400,000 FY 2024 FY 2025 FY 2026 FY 2027 FY 2028 Forecasted Ending Fund Balance Minimum Fund Balance Ending Fund Balance Page 194
Drainage Fund Long-Term Forecast Assumptions
Revenue Forecast
Drainagerevenueisprojectedtogrowby5%peryear.Higherrevenueisdrivenbyagrowing customercount.AdrainagefeestudyisplannedforFY2024todeterminewhethercurrentratesare sufficienttocoverthecostoffuturecapitalandmaintenanceprojects.Otherrevenue,whichis comprisedofinterestincome,isexpectedtofallfromthelevelseeninFY2024butremainstablein theoutyears.
ExpenditureForecast
Personnelexpensesincludeannualpayincreases,retirementcontributions,andinsurance premiums.TheCityisforecastinga6%increaseinpersonnelcostsoverthenextfiveyears.This allowstheCitytostaycompetitiveinthemarketaswellasretainvaluableemployees.
Otherexpendituresconsistofsupplies,services,andmaintenancecostsforthedrainage system.Thisexpenditurecategoryisgreatlyimpactedbyinflationandtheconditionofthe infrastructure.Weareprojectingan8%increaseperyeartomeettheneedsofoursystem.
Transfers,debtservice,andcapitalexpendituresaredependentontransfersforallocated personnelandadministrativecosts,debtservicepayments,andcapitalprojectsthatarefundedwith operatingfunds.Theseitemsvaryperyear.
FutureBudgetsandStrategicGoals
Asshowninthelong-rangeoperatingfinancialplan,thefundbalancewillbeatorbelowthe minimumamountallowedbypolicyinFY2028ifdebtisissuedfortwodrainageprojectsin2027. Thedrainagefeerateand/ordiscretionaryexpendituresmayneedtobeadjustedinfutureyearsto increasereserves.However,fundingcouldbeavailablefromothersources,suchastheTax IncrementReinvestmentZone,whichwouldeliminatetheneedforsuchdebtissuance.Thefund balancewouldremainabovetheminimuminthatcase.
Drainage fee revenue growth 5% Personnel cost growth 6% Other revenue growth 0% Other expenditure growth 8% Transfers, debt and capital As Needed
Revenue Assumptions Expenditure Assumptions
Page 195
Page 196


InformationTechnologyFund Overview The Information Technology Department is responsible for the developing, securing and storing of electronic data and assistingintheuseofsoftwarethroughouttheentireCityofBelton. 177 Software 147 . Applications Personnel Equipment C t Maintained 66 ompu ers 3 CyberSecurity )..,_, �--� , .-:J;] :� .a�j-��-�J• �:\�, .. ,r;1
Information Technology Fund Overview / Statement of Fund Balance
The Information Technology Fund is an internal service fund used to account for all costs of providing general information technology services to City divisions. These activities are financed through charges to the divisions for services rendered. Established in FY 2021, this fund merged with the Information Technology Equipment Replacement Fund that was formerly a non-major governmental fund.
Fund Balance History
Actual ActualBudgetEstimatedProjected Fiscal Year Ending September 30 2021 2022 2023 2023 2024 Budget Basis: Beginning Unrestricted Net Assets (GAAP) 79,302 $ (17,877) $ 123,676 $ 123,676 $ 316,498 $ Revenues 1 818,707 901,311 1,103,840 1,106,800 1,050,130 Expenses (854,074) (766,278) (966,060) (913,978) (954,190) Net Increase / (Decrease) in Net Assets (35,367) 135,033 137,780 192,822 95,940 Ending Unrestricted Net Assets (Budget) 43,935 $ 117,156 $ 261,456 $ 316,498 $ 412,438 $ Reconciliation to GAAP: Ending Unrestricted Net Assets (Budget) 43,935 $ 117,156 $ 261,456 $ 316,498 $ 412,438 $ Adjustment 2 (61,812) 6,520 - -Unrestricted Net Assets (GAAP) (17,877) 123,676 261,456 316,498 412,438 Restricted Net Assets (GAAP) - - - -Net Investment in Capital Assets (GAAP) 158,768 127,095 127,095 127,095 127,095 Total Fund Balance (GAAP) 140,891 $ 250,771 $ 388,551 $ 443,593 $ 539,533 $ Notes: 1 Excludes Use of Prior Years' Fund Balance 2 An adjustment is made to unrestricted net assets, if necessary, during the conversion from a budget basis to an accrual basis (GAAP).
$(100,000) $‐$100,000 $200,000 $300,000 $400,000 $500,000 $600,000 2021 Actual 2022 Actual 2023 Budget 2023 Estimated 2024 Projected Fund Balance Fiscal Year Ending September 30
Unrestricted Net Assets (GAAP) Restricted Net Assets (GAAP) Net Investment in Capital Assets (GAAP) Page 198
Information Technology Fund (177-3)
Account FY 2021FY 2022FY 2023 FY 2023 FY 2024 Number Account Name ActualActualBudgetEstimatedBudget Charges for Service 5901IT Services - General Fund 654,356 $ 694,310 $ 847,250 $ 847,250 $ 816,560 $ 5902IT Services - Water & Sewer Fund 160,586 194,730 237,380 237,380 213,700 5903IT Services - BEDC 3,750 5,000 5,000 5,000 5,000 5904IT Services - Building Maintenance - 7,108 4,210 4,210 4,600 5905IT Services - Drainage Fund - - 6,770 6,770 7,820 Total 818,692 901,148 1,100,610 1,100,610 1,047,680 Miscellaneous Income 9100Interest Income 15 163 100 3,060 2,450 Total 15 163 100 3,060 2,450 Other Financing Sources 8161Transfer from ARPA Fund - - 3,130 3,130Total - - 3,130 3,130Information Technology Fund Revenues818,707 $ 901,311 $ 1,103,840 $ 1,106,800 $ 1,050,130 $
Page 199
Revenues
Information Technology Fund Category Summary


FY 2024 Expenses by Category

FY 2021FY 2022FY 2023FY 2023FY 2024 Description ActalActualBudgetEstimatedBudget Personnel 187,659 $ 210,514 $ 306,640 $ 291,548 $ 309,680 $ Supplies 52,182 127,292 13,170 23,480 29,800 Maintenance 340,460 345,868 436,750 392,500 443,940 Services 97,218 82,604 88,500 85,450 99,370 Capital Outlay 176,555 - 121,000 121,000 71,400 Information Technology Fund 854,074 $ 766,278 $ 966,060 $ 913,978 $ 954,190 $
Personnel 32% Supplies 3% Maintenance 47% Services 10% Capital Outlay 8%
Personnel Supplies Maintenance Services Capital Outlay Page 200
Page 201
Information Technology
DIVISION MISSION AND DESCRIPTION
The Information Technology division has operational, strategic, and fiscal responsibility for the innovation, implementation, and advancement of technology in the City. The division strives to provide technology support that helps develop, enhance, and manage the City enterprise networks with the highest quality technology-based services in the most cost-effective manner. An internal service fund of the City, the Information Technology Fund was established in FY 2021 to consolidate costs and management responsibilities for information technology services.
DIVISION GOALS AND ACTION ITEMS FOR FY 2024
Strategic Plan categories addressed below: Governance, Public Safety
Goal: Maintain network operability and optimal connectivity
Action Item: Add a secondary 1GB ISP fiber connection for redundancy
Goal: Provide a safe, secure network environment while safeguarding data
Action Item: Provide cybersecurity training and replace equipment as needed to maintain the highest level of protection
Goal: Ensure the computer network remains current, efficient, and functional
Action Item: Continue upgrading hardware in accordance with the capital replacement plan
SIGNIFICANT CHANGES IN THE FY 2024 BUDGET
Small equipment expenditures increase to purchase phones, projectors, and surveillance cameras
Appropriations for communication reflects a reclassification of costs from the computer system maintenance account
Capital outlay includes funding for the replacement of copiers and computers
PERFORMANCE MEASURES
FY 2022FY 2023FY 2023FY 2024 WORKLOAD MEASURES ACTUALBUDGETESTIMATEBUDGET Number of computers supported 145 185 147 147 Number of servers supported 20 20 20 20 Number of work orders submitted 1,437 1,500 1,550 1,550
Percent of network uptime 100%100%100%100% Percent of system uptime 100%100%100%100% Percent of service requests cleared within 3 days of receipt 95%100%98%100% PERSONNEL Information Technology Director 1.00 1.00 1.00 1.00 Information Technology Analyst 1.00 2.00 1.00 1.00 Information Technology Specialist - - 1.00 1.00 Total Employees (Full-Time Equivalents) 2.00 3.00 3.00 3.00 Page 202
Information Technology Fund (177-4-071)
Account FY 2021FY 2022FY 2023FY 2023FY 2024 NumberAccount Name ActualActual BudgetEstimatedBudget Personnel 1010Salaries and Wages 148,643 $ 167,237 $ 237,400 $ 230,000 $ 242,620 $ 1210TMRS 15,241 17,571 24,970 24,150 26,470 1220 FICA 11,077 12,501 18,170 17,100 18,560 1230Employee Insurance11,945 12,989 25,240 19,900 21,240 1240Workers' Comp. Insurance220 198 450 338 520 1250Unemployment Compensation 533 18 410 60 270 Total 187,659 210,514 306,640 291,548 309,680 Supplies 2010Office Supplies 45 180 450 220 450 2090Tools & Other Supplies 3,720 4,445 3,280 3,800 4,000 2400Clothing 305 266 400 530 580 2500Small Equipment 48,112 122,401 9,040 18,930 24,770 Total 52,182 127,292 13,170 23,480 29,800 Maintenance 4020Machinery & Equipment 11,918 16,006 13,310 17,500 18,810 4160Computer System Maintenance 328,542 329,862 423,440 375,000 425,130 Total 340,460 345,868 436,750 392,500 443,940 Services 5100Dues & Publications 175 175 700 375 700 5130Travel & Training 4,973 4,686 8,700 6,900 5,900 5210Equipment Lease 5,629 - - -5500General Liability 346 366 400 675 1,120 5810Communication Services 86,095 77,377 78,700 77,500 91,650 Total 97,218 82,604 88,500 85,450 99,370 Capital Outlay 8200Machinery & Equipment 22,975 - - -8400Computer Equipment 153,580 - 121,000 121,000 71,400 Total 176,555 - 121,000 121,000 71,400 Information Technology Fund Expenses854,074 $ 766,278 $ 966,060 $ 913,978 $ 954,190 $
Page 203
Page 204
BuildingMaintenanceFund
Overview
The BuildingMaintenance Departmentprovidescleanlinessand maintenance toallCityfacilities. The Citycurrently haseight mainfacilities,manysmallbuildingsatpublicworksandparks,aswellastraillights.
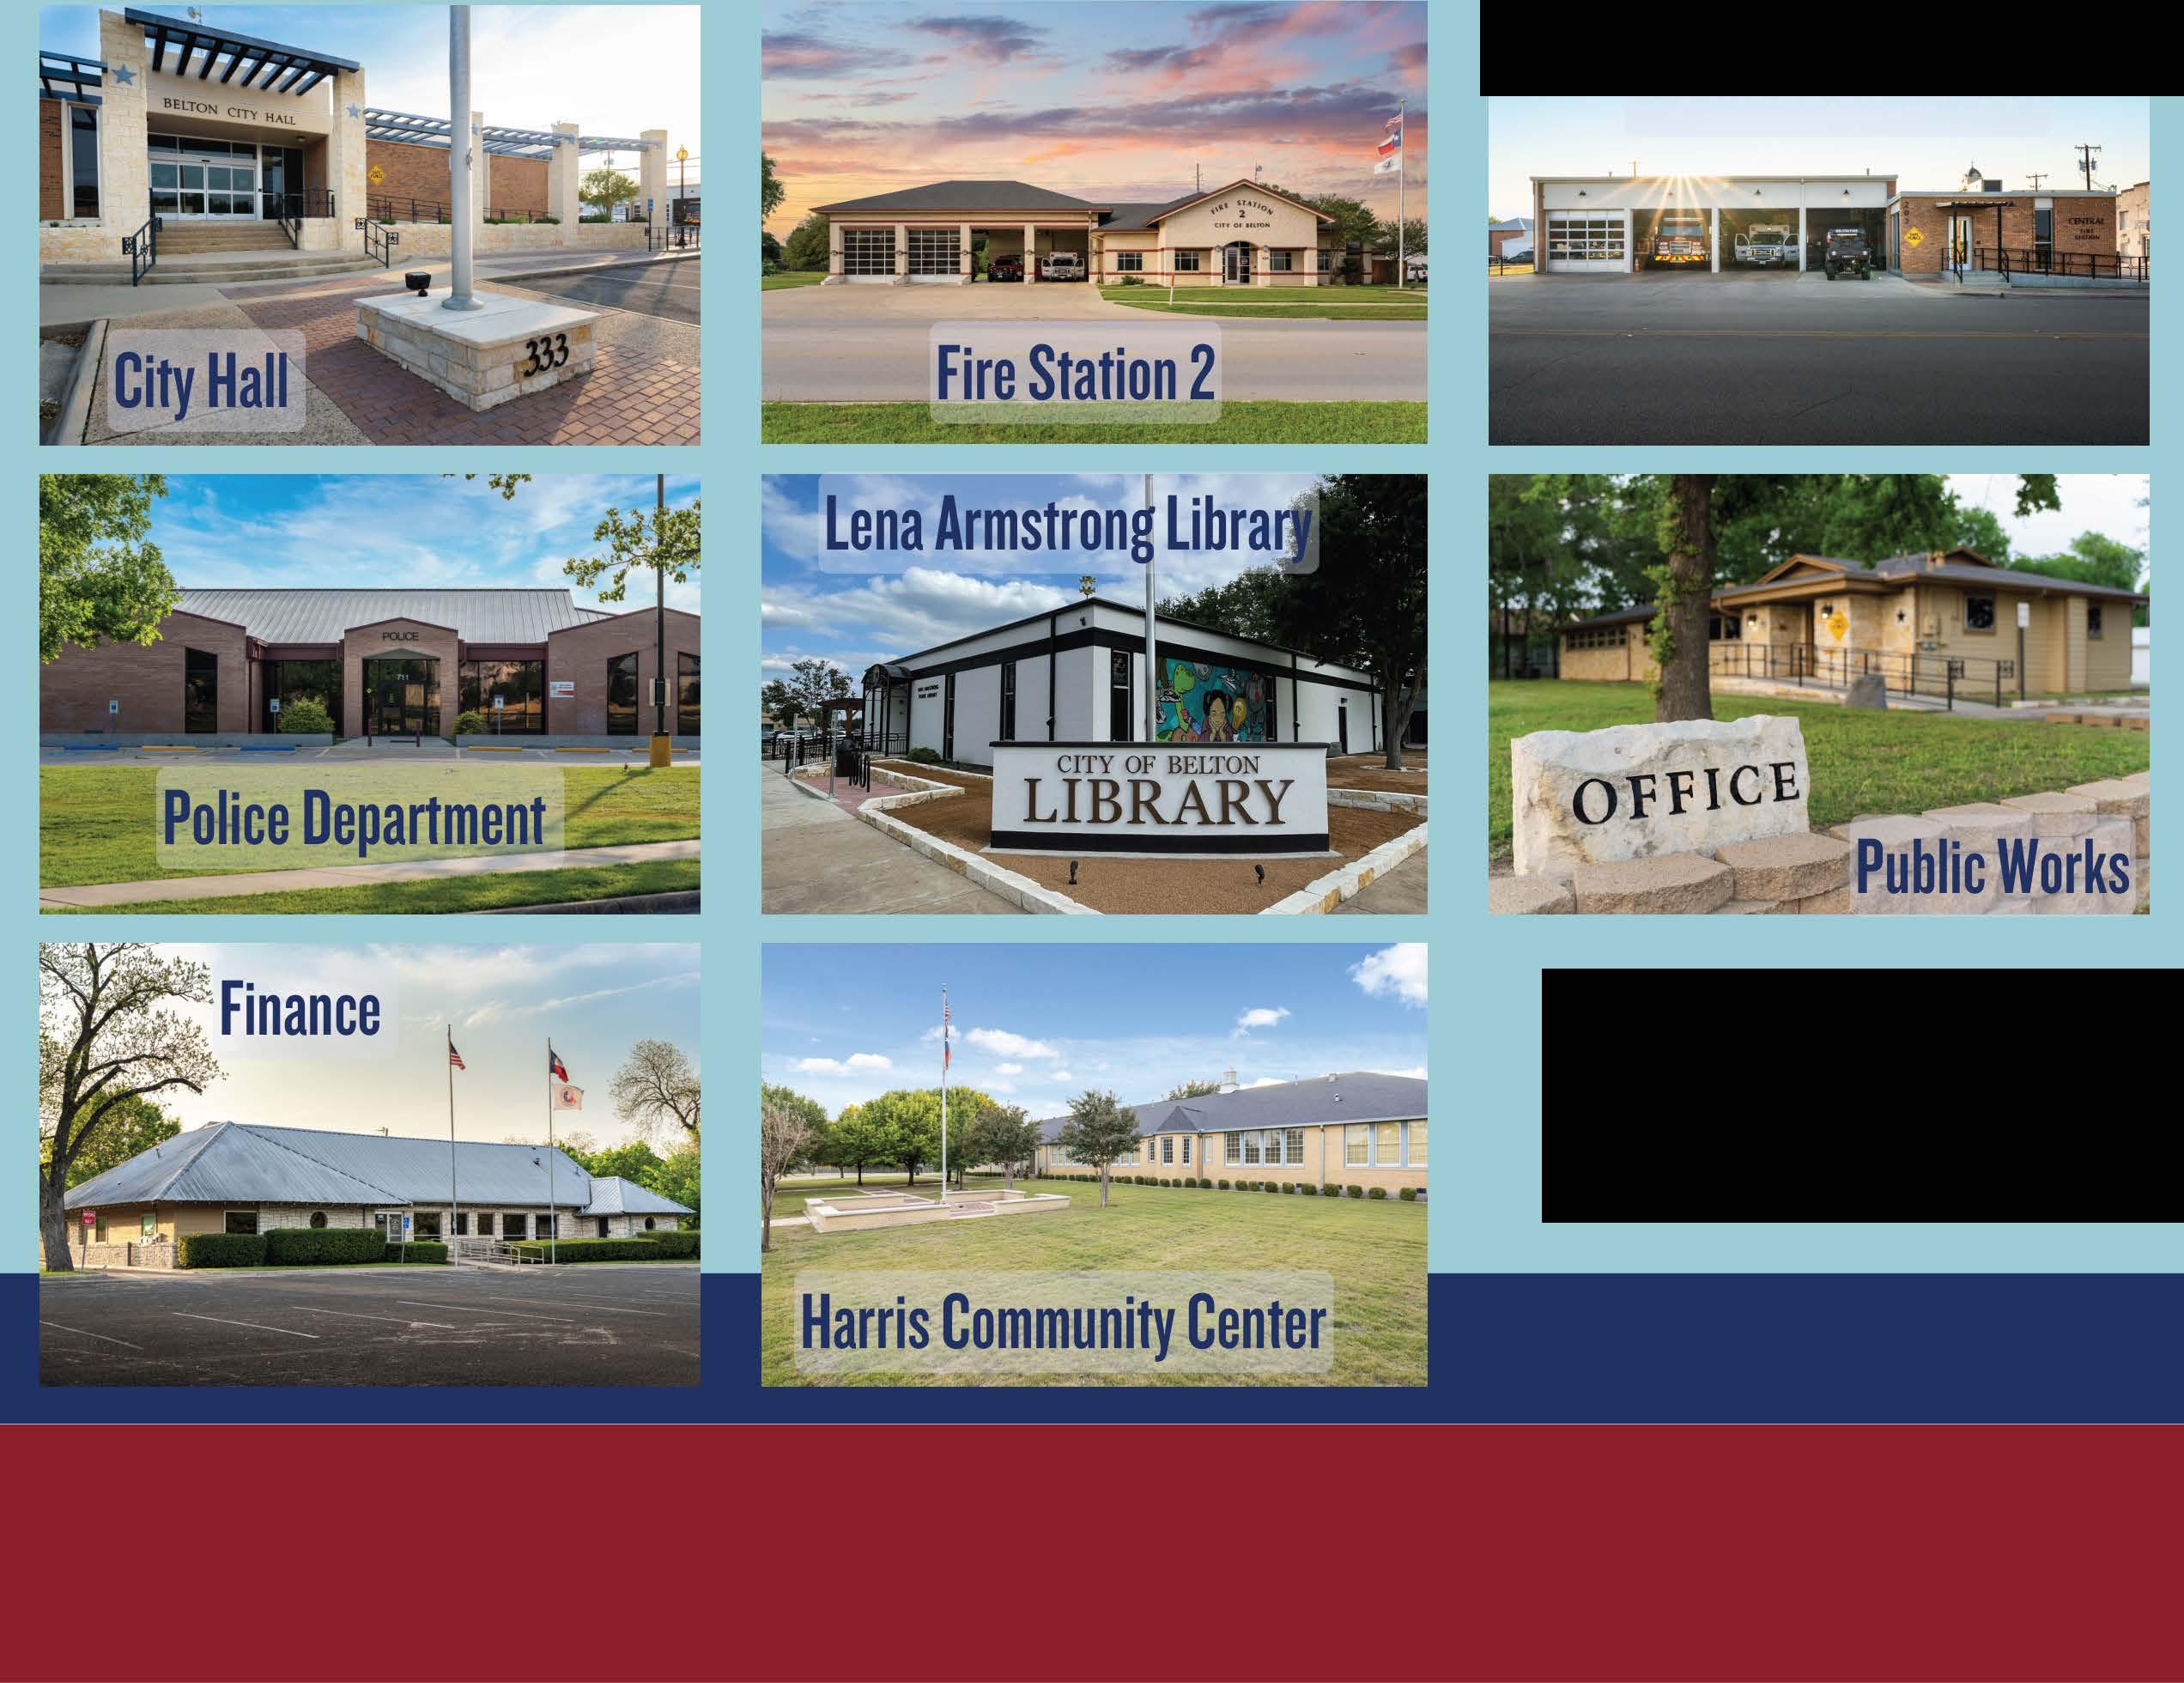
53,827 SquareFeet

CentralFireStation
Building Maintenance Fund Overview / Statement of Fund Balance
The Building Maintenance Fund is an internal service fund used to account for all costs of providing routine building maintenance services to City divisions. These activities are financed through charges to the divisions for services rendered. Established in FY 2021, this fund merged with the HVAC Replacement Fund that was formerly a non-major governmental fund.
Notes:
1 Excludes Use of Prior Years' Fund Balance
2 An adjustment is made to unrestricted net assets, if necessary, during the conversion from a budget basis to an accrual basis (GAAP).
Actual ActualBudgetEstimatedProjected Fiscal Year Ending September 30 2021 2022 2023 2023 2024 Budget Basis: Beginning Unrestricted Net Assets (GAAP) 6,622 $ 23,755 $ 109,032 $ 109,032 $ 178,144 $ Revenues 1 443,548 458,854 494,590 500,290 547,900 Expenses (364,476) (386,007) (422,020) (431,178) (449,460) Net Increase / (Decrease) in Net Assets 79,072 72,847 72,570 69,112 98,440 Ending Unrestricted Net Assets (Budget) 85,694 $ 96,602 $ 181,602 $ 178,144 $ 276,584 $ Reconciliation to GAAP: Ending Unrestricted Net Assets (Budget) 85,694 $ 96,602 $ 181,602 $ 178,144 $ 276,584 $ Adjustment 2 (61,939) 12,430 - -Unrestricted Net Assets (GAAP) 23,755 109,032 181,602 178,144 276,584 Restricted Net Assets (GAAP) - - - -Net Investment in Capital Assets (GAAP) - - - -Total Fund Balance (GAAP) 23,755 $ 109,032 $ 181,602 $ 178,144 $ 276,584 $
$‐$50,000 $100,000 $150,000 $200,000 $250,000 $300,000 2021 Actual2022 Actual2023 Budget2023 Estimated2024 Projected Fund Balance Fiscal Year Ending September 30 Fund Balance History Unrestricted Net Assets (GAAP) Restricted Net Assets (GAAP) Net Investment in Capital Assets (GAAP) Page 206
Building Maintenance Fund (178-3) Revenues
Account FY 2021FY 2022FY 2023FY 2023FY 2024 Number Account Name ActualActualBudgetEstimatedBudget Charges for Service 5901Maintenance Services-General Fund374,265 $ 391,200 $ 409,200 $ 409,200 $ 449,920 $ 5902Maintenance Services-Water Sewer69,252 66,940 82,080 82,080 85,260 5905Maintenance Services-Drainage - - - - 8,080 Total 443,517 458,140 491,280 491,280 543,260 Miscellaneous Income 9100Interest Income 31 714 100 5,800 4,640 Total 31 714 100 5,800 4,640 Other Financing Sources 8161Transfer from ARPA Fuund - - 3,210 3,210Total - - 3,210 3,210Building Maintenance Fund Revenues443,548 $ 458,854 $ 494,590 $ 500,290 $ 547,900 $
Page 207
Building Maintenance Fund Category Summary


FY 2024 Expenses by Category

FY 2021FY 2022FY 2023FY 2023FY 2024 Description ActualActualBudgetEstimatedBudget Personnel 218,036 $ 259,300 $ 304,830 $ 292,690 $ 310,440 $ Supplies 27,973 35,065 39,000 38,010 43,860 Maintenance 85,766 64,841 60,110 82,700 75,000 Services 18,838 12,521 9,620 9,318 11,490 Transfers 13,863 14,280 8,460 8,460 8,670 Building Maintenance Fund 364,476 $ 386,007 $ 422,020 $ 431,178 $ 449,460 $
Personnel 69% Supplies 10% Maintenance 17% Services 2% Transfers 2%
Personnel Supplies Maintenance Services Transfers Page 208
Page 209
Building Maintenance
DIVISION MISSION AND DESCRIPTION
The mission of the Building Maintenance division is to maintain and clean City buildings and facilities to ensure a safe and attractive environment for employees and visitors. The responsibilities of this division include performing daily janitorial services; repairing and maintaining buildings and park facilities; managing and constructing building improvements; and managing pest control and other maintenance contracts. An internal service fund of the City, the Building Maintenance Fund was established in FY 2021 to consolidate costs and management responsibilities for building maintenance.
DIVISION GOALS AND ACTION ITEMS FOR FY 2024
Strategic Plan categories addressed below: Quality of Life
Goal: Maximize asset life, reliability, and performance
Action Item: Schedule, perform, and document preventive maintenance activities on City facilities
Goal: Improve City buildings and facilities
Action Item: Facilitate discussions with departments about the condition, expansion, or replacement of existing buildings
Goal: Encourage job training and personal development
Action Item: Foster a positive work atmosphere built on communication, safety, standards of excellence and leadership expectation
SIGNIFICANT CHANGES IN THE FY 2024 BUDGET
Appropriations for wages, taxes, and retirement increase to account for growth in salaries
Building maintenance expenditures increase due to rising costs for materials and preventive maintenance
HVAC expenditures increase to replace several units
PERFORMANCE MEASURES
FY 2022FY 2023FY 2023FY 2024 WORKLOAD MEASURES ACTUALBUDGETESTIMATEBUDGET Square footage of buildings cleaned 39,781 39,781 41,406 41,400 Number of requests for service 1,500 1,600 1,200 1,200 Number of hours spent maintaining buildings 6,500 7,000 6,000 6,000
Repond to HVAC issues within one hour of call for service 99%100%100%100% Percent of service performed by in-house staff 85%85%90%90% Maintenance concerns addressed within 24 hours 100%95%95%95% PERSONNEL Building Superintendent 1.00 1.00 1.00 1.00 Senior Maintenance Technician 1.00 1.00 1.00 1.00 Maintenance Technician I 1.00 1.00 1.00 1.00 Custodian II 2.00 2.00 2.00 2.00 Total Employees (Full-Time Equivalents) 5.00 5.00 5.00 5.00 Page 210
Building Maintenance Fund (178-4-142)
Account FY 2021FY 2022FY 2023FY 2023FY 2024 Number Account Name ActualActual BudgetEstimatedBudget Personnel 1010Salaries and Wages 156,595 $ 185,821 $ 216,180 $ 211,000 $ 219,630 $ 1070Overtime Pay 668 1,267 800 200 1,000 1210TMRS 16,127 19,707 22,190 21,600 23,410 1220FICA 11,684 14,260 16,540 15,000 16,810 1230Employee Insurance28,481 34,219 42,570 39,100 42,400 1240Workers' Comp. Insurance3,220 3,725 5,780 5,700 6,680 1250Unemployment Compensation1,261 301 770 90 510 Total 218,036 259,300 304,830 292,690 310,440 Supplies 2010Office Supplies186 248 - -2070Janitorial Supplies16,352 14,264 17,000 15,700 17,000 2090Tools & Other Supplies4,503 12,324 14,000 13,970 18,500 2220Fuel4,398 6,180 5,670 5,740 6,030 2400Clothing1,495 2,049 2,330 2,600 2,330 2500Small Equipment1,039 - - -Total 27,973 35,065 39,000 38,010 43,860 Maintenance 3010Building44,423 45,616 41,110 56,500 47,000 3020HVAC41,343 19,225 19,000 26,200 28,000 Total85,766 64,841 60,110 82,700 75,000 Services 5100Dues & Publications- - 140 - 150 5130Travel & Training54 - 830 500 1,340 5341 Info Tech Services 13,817 7,110 4,210 4,210 4,600 5500General Liability 3,647 3,311 3,580 3,608 4,310 5820Gas Service 394 535 - -5830Electric Service 926 1,565 860 1,000 1,090 Total 18,838 12,521 9,620 9,318 11,490 Transfers 9176Transfer to Parks & Public Works 13,863 14,280 - -9202Transfer to Water & Sewer Fund - - 8,460 8,460 8,670 Total 13,863 14,280 8,460 8,460 8,670 Building Maintenance Fund Expenses364,476 $ 386,007 $ 422,020 $ 431,178 $ 449,460 $
Page 211
Page 212
CAPITAL IMPROVEMENTS PROGRAM OVERVIEW
2024 – 2028
The FY 2024-2028 Capital Improvements Program (CIP) represents the City’s plan for infrastructure development. The Capital Improvements Program is reviewed each year to reflect changing priorities and to provide a framework for identifying capital requirements; the impact of capital projects on operating budgets; scheduling; and coordinating related projects.
The Capital Improvements Program has two primary components. The General Government CIP represents non-utility projects such as streets, parks, and general government facilities. Typically, these projects will be funded via general obligation bonds, certificates of obligation, tax revenue, or other financing methods. The Utility CIP represents projects that benefit the City’s utility funds These projects are typically funded with utility rate revenue or bonds secured by rate revenue.
The CIP budget is a five-year program that is compiled by City staff. Necessary projects are identified; costs are estimated; and possible funding sources are acknowledged. Additional operating and maintenance costs are also reflected for each project. Recommended capital improvements are reviewed by the City Manager. Afterwards, they are sent to City Council for final approval.
FY 2024 CAPITAL-RELATED EXPENDITURES
A total of $31,458,600 will be spent for capital-related items during FY 2024 Most of these expenditures ($30,704,700 or 98%) can be attributed to the Capital Improvements Program. The remaining amount ($753,900) is directly related to routine capital expenditures
Capital Improvements Program (CIP) Public Safety Projects $ 180,000 Parks and Recreation Projects 2,270,000 Streets and Sidewalk Projects 9,706,000 Special and General Projects 443,700 Utility Projects 18,105,000 Total CIP Expenditures $30,704,700 Routine Expenditures General Fund $ 45,000 Water & Sewer Fund 577,500 Hotel Motel Tax Fund 25,000 Information Technology Fund 56,400 Economic Development Corporation 50,000 Total Routine Expenditures $ 753,900 Total Capital-Related Expenditures $31,458,600 Page 213
CAPITAL IMPROVEMENTS PROGRAM OVERVIEW
2024 – 2028
GENERAL GOVERNMENT PROJECTS
Public Safety Projects
Two public safety projects are planned. One project will increase the number of parking spaces at the Police Department facility. The Fire Department will add new fitness and training building behind Fire Station 2
Parks and Recreation Projects
Park amenities will be added to Heritage Park during the five-year period. Restoration of the Historic Standpipe, construction of Standpipe Park, and the rehabilitation of the historic Mount Zion Methodist Church should begin in 2024
Streets and Sidewalks Projects
The five-year plan calls for the design or reconstruction of several roadways, including Connell Street, Wheat Road, and Mesquite Road Replacing the East Central Avenue bridge is a significant project scheduled for 2024 Extension of W Avenue D will provide additional access to the Belton Business Park. Southwest Parkway will be extended from Loop 121 to Huey Drive. Reconstructing and widening Toll Bridge Road from Shanklin Road to the Lampasas River will facilitate development in the southern sector of the city. Sidewalks will be constructed along Penelope Street and Main Street.
Special and General Projects
Public Works will replace several pieces of aging equipment in accordance with the equipment replacement plan. Funding will also be set aside to accommodate future Bell County projects with the boundaries of the Tax Increment Reinvestment Zone #1.
UTILITY PROJECTS
The Utility CIP reflects projects to meet future development or to replace aging infrastructure that is susceptible to failure. These projects are typically included in the five-year utility rate study as well as the utility master plan Utility projects may be advanced or postponed over the five-year program as development often determines the timing.
Water Projects
Ten projects have been identified for the Capital Improvements Program for the next five years Several projects replace failing or undersized water lines and valves throughout Belton. A project to replace several towers will improve functionality of the vital SCADA alert system. A significant multi-year project, replacing the City’s aging water metering infrastructure will begin in 2024. The second phase of the Loop 121 utility relocation project is expected in 2025.
Wastewater Projects
Eight wastewater projects are included in the CIP. Wastewater treatment capacity will be expanded in 2024 with the Temple-Belton WWTP Phase II project. Replacing and upsizing an essential force main will better handle flows and prevent erosion of the mains. Other projects will address various failing or undersized sewer lines.
Page 214
Drainage Projects
The largest of three drainage projects is the addition of new culverts and channels at East 4th Avenue and North Blair. In 2027, a new detention pond will be constructed to reduce flooding near Avenue I. Mesquite Road culverts may be replaced in 2028.
IMPACT UPON FUTURE BUDGETS
The City of Belton utilizes the most beneficial method of financing capital projects including cash, bonds, special entity contributions, and grants. The appropriate financing method depends, in part, upon the effect to the property tax rate.
The Capital Improvements Program calls for minimal spending of General Fund revenue over the five-year period. This, however, is highly dependent upon the receipt of grant funds for several projects. If grants are not awarded, it will be necessary to increase the General Fund contribution or issue more debt to complete the projects. The Belton Economic Development Corporation and the Belton Tax Increment Reinvestment Zone No. 1 will contribute approximately $27,000,000 towards several vital projects.
$10,548,000 of tax-supported bonds may be issued over the next five years. Annual debt service could increase by $785,000 by 2028. Assuming taxable property values remained at $2.2 billion, the debt service portion of the property tax rate could increase by a total of 3.6 cents. In addition to tax-supported debt, the utility fund may issue $17,474,000 of rate-supported bonds during this timeframe. Annual debt service for the utilities would consequently increase by $1,301,000 in 2028.
The Capital Improvements Program contains the anticipated operating costs associated with each project. Over the five-year program, operations and maintenance costs related to the general government and utility projects are expected to change by $38,000 and $12,500, respectively. Lower maintenance costs are expected as aging infrastructure is being replaced.
Projected Annual Debt Service (All Obligations)
$‐$1,000,000 $2,000,000 $3,000,000 $4,000,000 $5,000,000 $6,000,000 20242025202620272028
Existing Debt Additional Debt for CIP Page 215
Capital Improvements Program
Fiscal Years 2024 - 2028
General Government Projects
Project Type/ Estimated Project Expenditures by Fiscal Year Ending Project Summary 20242025202620272028Total Public Safety Projects Police Department Secured Parking 30,000 $ -$ -$ -$ -$ 30,000 $ Fire Department Fitness and Training Building150,000 - - - - 150,000 Total Public Safety Projects 180,000 - - - - 180,000 Parks and Recreation Projects Heritage Park Amenities - - - 2,000,000 - 2,000,000 Standpipe Park 1,500,000 - - - - 1,500,000 Historic Standpipe Restoration 270,000 - - - - 270,000 Mount Zion Methodist Church Rehabilitation 500,000 - - - - 500,000 Total Parks and Recreation Projects 2,270,000 - - 2,000,000 - 4,270,000 Streets and Sidewalks Projects W Avenue D Extension - 2,200,000 - - - 2,200,000 Southwest Parkway 1,900,000 - - - - 1,900,000 E Central Avenue Bridge Replacement 6,200,000 - - - - 6,200,000 Connell Street Reconstruction 1,606,000 776,000 - 9,298,000 - 11,680,000 Brenda Lane Reconstruction - - - 1,250,000 - 1,250,000 Penelope Sidewalks Central to Water Street - 400,000 - - - 400,000 E 24th Avenue Widening at Main Street - - - - 1,300,000 1,300,000 Toll Bridge Road Reconstruction - 4,000,000 - - 2,500,000 6,500,000 Capitol Way Extension - - - 3,800,000 - 3,800,000 Wheat Road Design - - 1,007,000 - - 1,007,000 Mesquite Road Design - - - 1,161,000 - 1,161,000 Main St Sidewalk Turtle Creek Apts to Rabern - 700,000 - - - 700,000 Total Streets and Sidewalks Projects 9,706,000 8,076,000 1,007,000 15,509,000 3,800,000 38,098,000 Special and General Projects Public Works Equipment Replacement 443,700 - 115,440 - - 559,140 Bell County Facilities - - - - 1,300,000 1,300,000 Total Special and General Projects 443,700 - 115,440 - 1,300,000 1,859,140 Total Expenditures For All Projects 12,599,700 $ 8,076,000 $ 1,122,440 $ 17,509,000 $ 5,100,000 $ 44,407,140 $ Estimated Funding Amount by Fiscal Year Sources of Funding 20242025202620272028Total Bond Issuances - $ -$ - $ 10,548,000 $ -$ 10,548,000 $ Grants 5,950,000 - - - - 5,950,000 Operating Fund Revenues - - - - -BEDC Funding - 2,200,000 - - - 2,200,000 TIRZ Funding 4,826,000 1,876,000 1,007,000 6,961,000 5,100,000 19,770,000 Other Funding 1,823,700 4,000,000 115,440 - - 5,939,140 Total Funding For All Projects 12,599,700 $ 8,076,000 $ 1,122,440 $ 17,509,000 $ 5,100,000 $ 44,407,140 $ Operations & Maintenance (O&M) Expenditures by Fiscal Year Departments with O&M 20242025202620272028Total Fire 1,000 $ 1,000 $ 1,000 $ 1,000 $ 1,000 $ 5,000 $ Public Works - Streets (2,000) 2,000 2,000 (2,000) (2,000) (2,000) Parks and Recreation 5,000 5,000 5,000 10,000 10,000 35,000 Total Change to O&M Expenditures 4,000 $ 8,000 $ 8,000 $ 9,000 $ 9,000 $ 38,000 $ Page 216
Capital Improvements Program
Fiscal Years 2024 - 2028
Utility Projects
Project Type/ Estimated Project Expenditures by Fiscal Year Ending Project Summary 20242025202620272028Total Water Projects Old Golf Course Road Water Line - $ - $ 1,473,750 $ - $ - $ 1,473,750 $ Mary Jane Water Line Replacement - - - 437,500 - 437,500 E Central Water Line Upsize - 312,500 - - - 312,500 S Pearl Water Line - 187,500 - - - 187,500 N Blair/Flat/Walker Looped Water Service - - 375,000 - - 375,000 Loop 121 Utility Relocation Phase 2 - 1,100,000 - - - 1,100,000 Water Metering Infrastructure Replacement 350,000 400,000 425,000 - - 1,175,000 SCADA/Omni Antenna Tower Project 280,000 - - - - 280,000 Citywide Valve Replacement 100,000 - - - - 100,000 North Belton Water Line Replacement 1,250,000 - - - - 1,250,000 Total Water Projects 1,980,000 2,000,000 2,273,750 437,500 - 6,691,250 Wastewater Projects Temple-Belton WWTP Phase 2 15,000,000 - - - - 15,000,000 Main Belton Lift Station Force Main 1,125,000 - - - - 1,125,000 College Street Sewer Replacement - - - - 812,500 812,500 Mary Jane and E Ave J Sewer - - - 500,000 - 500,000 E Ave M Sewer Replacement - 625,000 - - - 625,000 W Ave B Near Mitchell Sewer Line - 312,500 - - - 312,500 Hilltop Sewer Replacement - - 312,500 - - 312,500 Mitchell Branch Sewer Upsize/Interceptor - - 4,125,000 - - 4,125,000 Total Wastewater Projects 16,125,000 937,500 4,437,500 500,000 812,500 22,812,500 Drainage Projects E 4th Ave/N Blair Drainage - 1,400,000 - - - 1,400,000 Avenue I Detention Pond - - - 625,000 - 625,000 Mesquite Road Drainage - - - - 500,000 500,000 Total Drainage Projects - 1,400,000 - 625,000 500,000 2,525,000 Total Expenditures For All Projects 18,105,000 $ 4,337,500 $ 6,711,250 $ 1,562,500 $ 1,312,500 $ 32,028,750 $ Estimated Funding Amount by Fiscal Year Sources of Funding 20242025202620272028Total Bond Issuances 11,875,000 $ -$ 5,598,750 $ - $ - $ 17,473,750 $ Grants - - - - -Operating Fund Revenues 3,000,000 1,437,500 687,500 1,562,500 1,312,500 8,000,000 BEDC Funding - - - - -TIRZ Funding - 1,900,000 - - - 1,900,000 Other Funding 3,230,000 1,000,000 425,000 - - 4,655,000 Total Funding For All Projects 18,105,000 $ 4,337,500 $ 6,711,250 $ 1,562,500 $ 1,312,500 $ 32,028,750 $ Operations & Maintenance (O&M) Expenditures by Fiscal Year Departments with O&M 20242025202620272028Total Water (5,000) $ (7,000) $ (10,000) $ (11,250) $ (11,250) $ (44,500) $ Wastewater 10,000 8,000 7,000 6,000 5,000 36,000 Drainage - (1,000) (1,000) - (2,000) (4,000) Total Change to O&M Expenditures 5,000 $ - $ (4,000) $ (5,250) $ (8,250) $ (12,500) $ Page 217
General Government
Police Department Secured Parking
Project Description
This project adds parking spaces in the secured area of the Police Department complex.
Effect Upon Operations & Maintenance
No significant change to operation and maintenance expenditures are anticipated with this item. Estimated
Public Safety
20242025202620272028 Cost by Fiscal Year30,000 $ -$-$ -$ -$
of Funding Identified 20242025202620272028 Bond Issuances -$ -$ -$ -$ -$ Grants - - - -Operating Fund Revenues - - - -BEDC Funding - - - -TIRZ Funding - - - -Other Funding 30,000 - - -Operations and Maintenance Costs 20242025202620272028 Cost by Fiscal Year -$ -$ -$ -$ -$
Improvements Program Project Detail Sheet Fiscal Years 2024 - 2028 Page 218
Project Cost30,000 $
Sources
Capital
Capital Improvements Program Project Detail Sheet
General Government
Fire
Project Description
This 60'x40' metal building behind Fire Station 2 will serve as both a fitness area and training area. The facility will be used by all firefighters, relocating fitness equipment from hazardous areas within the stations. Plans include a 30'x30' fitness room, a 40'x30' open area, and two 10'x15' storage areas.
Effect
Public Safety
Department Fitness and Training Building
Annual maintenance
Estimated Project Cost150,000 $ 20242025202620272028 Cost by Fiscal Year150,000 $ - $ -$-$ -$ Sources of Funding Identified 20242025202620272028 Bond Issuances -$ -$ -$ -$ -$ Grants - - - -Operating Fund Revenues - - - -BEDC Funding - - - -TIRZ Funding - - - -Other Funding 150,000 - - -Operations and Maintenance Costs 20242025202620272028 Cost by Fiscal Year 1,000 $ 1,000 $ 1,000 $ 1,000 $ 1,000 $
Upon Operations & Maintenance
costs are expected to increase by $1,000 per year.
Fiscal Years 2024 - 2028 Page 219
General Government
Heritage Park Amenities
Project Description
Capital Improvements Program Project Detail Sheet
Fiscal Years 2024 - 2028
Parks and Recreation
After completing the road, utilities, and features in 2023, only future amenities are included in this item. A four-phase approach to construction was scheduled:
Phase 1Extension of 24th Avenue into new parkland(Complete)
Phase 2aExtension of temporary roadway(Complete)
Phase 2bMaster planning(Complete)
Phase 3Extension of permanent road and utilities(Complete) Park features and facilities(Ongoing)
Effect Upon Operations & Maintenance
Annual maintenance costs are expected to increase by $5,000 per year to maintain the park.
Estimated Project Cost2,000,000 $
20242025202620272028 Cost by Fiscal Year$ - $ - $ 2,000,000 $ - $ Sources of Funding Identified 20242025202620272028 Bond Issuances - $ - $ - $ - $ - $ Grants - - - -Operating Fund Revenues - - - -BEDC Funding - - - -TIRZ Funding - - - 2,000,000Other Funding - - - -Operations and Maintenance Costs 20242025202620272028 Cost by Fiscal Year - $ - $ - $ 5,000 $ 5,000 $
Phase 4
Page 220
Capital Improvements Program Project Detail Sheet
Project Description
This project will create a new park on 2.3 acres of elevated land next to the historic Belton Standpipe. It will include open space, a walking trail, soccer goals, benches, storyboards that tell Belton history, and the Standpipe. Grant funding is anticipated for this project in addition to the $750,000 provided by the American Rescue Plan Act.
Annual maintenance costs are expected to increase by $5,000 per year to maintain the park.
Government Parks and Recreation
General
Standpipe Park
Maintenance
Effect Upon Operations &
Estimated Project Cost1,500,000 $ 20242025202620272028 Cost by Fiscal Year1,500,000 $ - $ -$-$ -$ Sources of Funding Identified 20242025202620272028 Bond Issuances -$ -$ -$ -$ -$ Grants 750,000 - - -Operating Fund Revenues - - - -BEDC Funding - - - -TIRZ Funding - - - -Other Funding 750,000 - - -Operations and Maintenance Costs 20242025202620272028 Cost by Fiscal Year 5,000 $ 5,000 $ 5,000 $ 5,000 $ 5,000 $
Years 2024 - 2028 Page 221
Fiscal
Capital Improvements Program Project Detail Sheet
Project Description
This project will restore the historic Standpipe, a national historic landmark, in the City of Belton. A study conducted in 2017 identified $270,000 in repairs aimed at safety and appropriate restoration. The Standpipe will be the centerpiece for Standpipe Park. Funding for the project is provided by the American Rescue Plan Act and the Tax Increment Reinvestment Zone. Effect
No significant change to operation and maintenance expenditures are anticipated with this item.
Government
and Recreation
General
Parks
Historic Standpipe Restoration
Upon Operations & Maintenance
Estimated Project Cost270,000 $ 20242025202620272028 Cost by Fiscal Year270,000 $ - $ - $ - $ - $ Sources of Funding Identified 20242025202620272028 Bond Issuances - $ - $ - $ - $ - $ Grants - - - -Operating Fund Revenues - - - -BEDC Funding - - - -TIRZ Funding 120,000 - - -Other Funding 150,000 - - -Operations and Maintenance Costs 20242025202620272028 Cost by Fiscal Year - $ - $ - $ - $ - $
Years 2024 - 2028 Page 222
Fiscal
Capital Improvements Program Project Detail Sheet
Fiscal Years 2024 - 2028
General Government Parks and Recreation
Mount Zion Methodist Church Rehabilitation
Project Description
This neighborhood revitalization project includes the rehabilitation and restoration of the vacant structure of the historical Mount Zion Methodist Church and surrounding area. Funding will be provided by the American Rescue Plan Act, Federal and State grants, and Mount Zion Methodist Church.
Effect Upon Operations & Maintenance
No significant change to operation and maintenance expenditures are anticipated with this item.
Estimated Project Cost500,000 $ 20242025202620272028 Cost by Fiscal Year500,000 $ - $ -$-$ -$ Sources of Funding Identified 20242025202620272028 Bond Issuances -$ -$ -$ -$ -$ Grants 200,000 - - -Operating Fund Revenues - - - -BEDC Funding - - - -TIRZ Funding - - - -Other Funding 300,000 - - -Operations and Maintenance Costs 20242025202620272028 Cost by Fiscal Year -$ -$ -$ -$ -$
Page 223
Capital Improvements Program Project Detail Sheet
Project Description
This project will extend W Avenue D west of Loop 121 into the Belton Business Park.
Effect
Annual maintenance costs are expected to increase by $1,000 per year.
Government
Sidewalks
General
Streets and
W Avenue D Extension
Maintenance
Upon Operations &
Estimated Project Cost2,200,000 $ 20242025202620272028 Cost by Fiscal Year$ 2,200,000 $ - $ - $ - $ Sources of Funding Identified 20242025202620272028 Bond Issuances - $ - $ - $ - $ - $ Grants - - - -Operating Fund Revenues - - - -BEDC Funding - 2,200,000 - -TIRZ Funding - - - -Other Funding - - - -Operations and Maintenance Costs 20242025202620272028 Cost by Fiscal Year - $ 1,000 $ 1,000 $ 1,000 $ 1,000 $
Page 224
Fiscal Years 2024 - 2028
Capital Improvements Program Project Detail Sheet
Fiscal Years 2024 - 2028
General Government Streets and Sidewalks
Southwest Parkway
Project Description
This project will extend Southwest Parkway from Liberty Park Drive to Huey Drive, allowing for crossing over Mitchell Branch and additional egress points.
Effect
Annual maintenance costs are expected to increase by $1,000 per year.
Upon Operations & Maintenance
Estimated Project Cost1,900,000 $ 20242025202620272028 Cost by Fiscal Year1,900,000 $ - $ - $ - $ - $
of Funding Identified 20242025202620272028 Bond Issuances - $ - $ - $ - $ - $ Grants - - - -Operating Fund Revenues - - - -BEDC Funding - - - -TIRZ Funding 1,900,000 - - -Other Funding - - - -Operations and Maintenance Costs 20242025202620272028 Cost by Fiscal Year 1,000 $ 1,000 $ 1,000 $ 1,000 $ 1,000 $
Sources
Page 225
Capital Improvements Program Project Detail Sheet
General Government Streets and Sidewalks
E Central Avenue Bridge Replacement
Project Description
This project will replace a substandard, 10' wide low water street crossing, extending over Nolan Creek east of IH-35. The current bridge acts as a dam and threatens adjacent property with flooding. The City of Belton proposes to replace and relocate the bridge. Federal Community Project Funding provided $5.0M of the funds needed for the project while the Tax Increment Reinvestment Zone provided $1.2M.
Effect Upon Operations & Maintenance
Annual maintenance costs are expected to decrease by $3,000 per year.
Estimated Project Cost6,200,000 $ 20242025202620272028 Cost by Fiscal Year6,200,000 $ - $ - $ - $ - $ Sources of Funding Identified 20242025202620272028 Bond Issuances - $ - $ - $ - $ - $ Grants 5,000,000 - - -Operating Fund Revenues - - - -BEDC Funding - - - -TIRZ Funding 1,200,000 - - -Other Funding - - - -Operations and Maintenance Costs 20242025202620272028 Cost by Fiscal Year (3,000) $ (3,000) $ (3,000) $ (3,000) $ (3,000) $
Years 2024 - 2028 Page 226
Fiscal
Capital Improvements Program Project Detail Sheet Fiscal
General Government Streets and Sidewalks
Connell Street Reconstruction
Project Description
This project will reconstruct Connell Street with four 11' wide lanes, a 10' wide shared use path and 5' sidewalk. The project also includes drainage and water improvements as well as landscaping. Design and ROW acquisition will occur in 2024 and 2025 with construction planned in 2027.
Effect Upon Operations & Maintenance
Annual maintenance costs are expected to decrease by $3,000 per year once constructed.
$ 20242025202620272028 Cost by Fiscal Year1,606,000 $ 776,000 $ - $ 9,298,000 $ - $ Sources of Funding Identified 20242025202620272028 Bond Issuances - $ - $ - $ 9,298,000 $ - $ Grants - - - -Operating Fund Revenues - - - -BEDC Funding - - - -TIRZ Funding 1,606,000 776,000 - -Other Funding - - - -Operations and Maintenance Costs 20242025202620272028 Cost by Fiscal Year - $ - $ - $ (3,000) $ (3,000) $
Estimated Project Cost11,680,000
Years 2024 - 2028 Page 227
Capital Improvements Program Project Detail Sheet
Fiscal Years 2024 - 2028
General Government Streets and Sidewalks
Brenda Lane Reconstruction
Project Description
This project will reconstruct Brenda Lane, located east of FM 1670, which has poor drainage.
Effect Upon Operations & Maintenance
Annual maintenance costs are expected to decrease by $1,000 per year.
Project Cost1,250,000 $ 20242025202620272028 Cost by Fiscal Year-$ -$ -$ 1,250,000 $ - $ Sources of Funding Identified 20242025202620272028 Bond Issuances -$ -$ -$ 1,250,000 $ - $ Grants - - - -Operating Fund Revenues - - - -BEDC Funding - - - -TIRZ Funding - - - -Other Funding - - - -Operations and Maintenance Costs 20242025202620272028 Cost by Fiscal Year -$ -$ -$ (1,000) $ (1,000) $
Estimated
Page 228
Capital Improvements Program Project Detail Sheet
General Government Streets and Sidewalks
Penelope Sidewalks Central to Water Street
Project Description
This project will replace the failing sidewalk on S Penelope near Cochran, Blair & Potts.
Effect
No significant change to operation and maintenance expenditures are anticipated with this item.
upon Operations & Maintenance
Estimated Project Cost400,000 $ 20242025202620272028 Cost by Fiscal Year-$ 400,000 $ - $ -$-$ Sources of Funding Identified 20242025202620272028 Bond Issuances -$ -$ -$ -$ -$ Grants - - - -Operating Fund Revenues - - - -BEDC Funding - - - -TIRZ Funding - 400,000 - -Other Funding - - - -Operations and Maintenance Costs 20242025202620272028 Cost by Fiscal Year -$ -$ -$ -$ -$
Years 2024 - 2028 Page 229
Fiscal
Capital Improvements Program
General Government Streets and Sidewalks
E 24th Avenue Widening at Main Street
Project Description
This project includes widening of E 24th Avenue between Main Street and N Beal, adding sidewalks, and improving drainage along the roadway.
Effect
No significant change to operation and maintenance expenditures are anticipated with this item.
upon Operations & Maintenance
Estimated Project Cost1,300,000 $ 20242025202620272028 Cost by Fiscal Year$ - $ - $ - $ 1,300,000 $
of Funding Identified 20242025202620272028 Bond Issuances - $ - $ - $ - $ - $ Grants - - - -Operating Fund Revenues - - - -BEDC Funding - - - -TIRZ Funding - - - - 1,300,000 Other Funding - - - -Operations and Maintenance Costs 20242025202620272028 Cost by Fiscal Year - $ - $ - $ - $ - $
Sources
Page 230
Project Detail Sheet Fiscal Years 2024 - 2028
Capital Improvements Program Project Detail Sheet
General Government Streets and Sidewalks
Toll Bridge Road Reconstruction
Project Description
This project includes reconstructing and widening Toll Bridge Road from Shanklin Road to the Lampasas River. The road will be converted from a County road into a three-lane thoroughfare with a center turn lane. A hike and bike trail will be included along the River Farms property frontage. The River Farms MUD Agreement calls for the developer to pay for the first phase and a portion of the second phase to Shanklin. The City will complete the project in 2028.
Effect Upon Operations & Maintenance
Annual maintenance costs are expected to increase by $3,000 per year.
Estimated Project Cost6,500,000 $ 20242025202620272028 Cost by Fiscal Year$ 4,000,000 $ - $ - $ 2,500,000 $ Sources of Funding Identified 20242025202620272028 Bond Issuances - $ - $ - $ - $ - $ Grants - - - -Operating Fund Revenues - - - -BEDC Funding - - - -TIRZ Funding - - - - 2,500,000 Other Funding - 4,000,000 - -Operations and Maintenance Costs 20242025202620272028 Cost by Fiscal Year - $ 3,000 $ 3,000 $ 3,000 $ 3,000 $
Page 231
Fiscal Years 2024 - 2028
Capital Improvements Program
General Government Streets and Sidewalks
Capitol Way Extension
Project Description
This project will extend Capitol Way from E Grove Road to Shanklin Road.
Effect
No significant change to operation and maintenance expenditures are anticipated with this item.
Upon Operations & Maintenance
20242025202620272028 Cost by Fiscal Year-$ -$ -$ 3,800,000 $ - $
of Funding Identified 20242025202620272028 Bond Issuances -$ -$ -$ -$ -$ Grants - - - -Operating Fund Revenues - - - -BEDC Funding - - - -TIRZ Funding - - - 3,800,000Other Funding - - - -Operations and Maintenance Costs 20242025202620272028 Cost by Fiscal Year -$ -$ -$ -$ -$
Estimated Project Cost3,800,000 $
Sources
Detail
Fiscal Years 2024 - 2028 Page 232
Project
Sheet
Capital Improvements Program Project Detail Sheet
Fiscal Years 2024 - 2028
General Government Streets and Sidewalks
Wheat Road Design
Project Description
This project includes the design of a north-south neighborhood collector roadway that provides circulation between Red Rock Drive and Sparta Road, including pedestrian elements and a concept for connection with IH-14.
Effect Upon Operations & Maintenance
No significant change to operation and maintenance expenditures are anticipated with this item.
Estimated Project Cost1,007,000 $ 20242025202620272028 Cost by Fiscal Year$ - $ 1,007,000 $ - $ - $
of Funding Identified 20242025202620272028 Bond Issuances - $ - $ - $ - $ - $ Grants - - - -Operating Fund Revenues - - - -BEDC Funding - - - -TIRZ Funding - - 1,007,000 -Other Funding - - - -Operations and Maintenance Costs 20242025202620272028 Cost by Fiscal Year - $ - $ - $ - $ - $
Sources
Page 233
Capital Improvements Program Project Detail Sheet
Fiscal Years 2024 - 2028
General Government Streets and Sidewalks
Mesquite Road Design
Project Description
This project includes the design of an East/West minor collector roadway that improves connectivity in the Southeastern portions of the community. The roadway will also connect to the future Southwest Parkway that has been identified in the City's thoroughfare plan.
Effect Upon Operations & Maintenance
No significant change to operation and maintenance expenditures are anticipated with this item.
Estimated Project Cost1,161,000 $ 20242025202620272028 Cost by Fiscal Year-$ -$ -$ 1,161,000 $ - $
of Funding Identified 20242025202620272028 Bond Issuances -$ -$ -$ -$ -$ Grants - - - -Operating Fund Revenues - - - -BEDC Funding - - - -TIRZ Funding - - - 1,161,000Other Funding - - - -Operations and Maintenance Costs 20242025202620272028 Cost by Fiscal Year -$ -$ -$ -$ -$
Sources
Page 234
Capital Improvements Program Project Detail Sheet
Fiscal Years 2024 - 2028
General Government Streets and Sidewalks
Main Street Sidewalk Turtle Creek Apts to Rabern
Project Description
This five-foot sidewalk will begin on Industrial Road adjacent to Turtle Creek Apartments and run West towards Main Street before turning North, terminating at the NE corner of Extraco Bank. This project includes crossing a drainage structure to improve pedestrian mobility in the area.
Effect Upon Operations & Maintenance
No significant change to operation and maintenance expenditures are anticipated with this item. Estimated Project
20242025202620272028 Cost by Fiscal Year-$ 700,000 $ - $ -$-$
of Funding Identified 20242025202620272028 Bond Issuances -$ -$ -$ -$ -$ Grants - - - -Operating Fund Revenues - - - -BEDC Funding - - - -TIRZ Funding - 700,000 - -Other Funding - - - -Operations and Maintenance Costs 20242025202620272028 Cost by Fiscal Year -$ -$ -$ -$ -$
Cost700,000 $
Sources
Page 235
Capital Improvements Program Project Detail Sheet
General Government
Project Description
This project replaces Public Works equipment that has reached the end of its useful life in accordance with the capital equipment replacement plan, including:
2024Compact motor grader (new fleet addition)239,700
20242005 Caterpillar 9146 wheel loader204,000
20262006 Ford F650 dump truck115,440
Effect Upon Operations & Maintenance
Annual maintenance costs are expected to decrease by $5,000 to $10,000 per year after replacement.
Estimated Project Cost559,140 $
Special
and General Public Works Equipment Replacement
20242025202620272028 Cost by Fiscal Year443,700 $ - $ 115,440 $ - $ -$ Sources of Funding Identified 20242025202620272028 Bond Issuances -$ -$ -$ -$ -$ Grants - - - -Operating Fund Revenues - - - -BEDC Funding - - - -TIRZ Funding - - - -Other Funding 443,700 - 115,440 -Operations and Maintenance Costs 20242025202620272028 Cost by Fiscal Year (5,000) $ (5,000) $ (10,000) $ (10,000) $ (10,000) $
Fiscal Years 2024 - 2028 Page 236
Capital Improvements Program Project Detail Sheet
Fiscal Years 2024 - 2028
Project Description
This project accounts for funding set aside to accommodate future Bell County projects within the boundaries of Tax Increment Reinvestment Zone #1 with a range of options for use including land acquisition, building design and/or construction.
Effect
No significant change to operation and maintenance expenditures are anticipated with this item.
Government
Bell
Facilities
General
Special and General
County
Upon Operations & Maintenance
Estimated Project Cost1,300,000 $ 20242025202620272028 Cost by Fiscal Year-$ -$ -$ -$ 1,300,000 $ Sources of Funding Identified 20242025202620272028 Bond Issuances -$ -$ -$ -$ -$ Grants - - - -Operating Fund Revenues - - - -BEDC Funding - - - -TIRZ Funding - - - - 1,300,000 Other Funding - - - -Operations and Maintenance Costs 20242025202620272028 Cost by Fiscal Year -$ -$ -$ -$ -$
Page 237
Old Golf Course Road Water Line
Project Description
This project will replace the failing undersized waterline on Old Golf Course Road.
Annual maintenance costs are expected to decrease by $3,000 per year.
Utility Water
Operations & Maintenance
Effect Upon
Estimated Project Cost 1,473,750 $ 20242025202620272028 Cost by Fiscal Year -$ -$ 1,473,750 $ -$ -$ Sources of Funding Identified 20242025202620272028 Bond Issuances -$ -$ 1,473,750 $ -$ -$ Grants - - - -Operating Fund Revenues - - - -BEDC Funding - - - -TIRZ Funding - - - -Other Funding - - - -Operations and Maintenance Costs 20242025202620272028 Cost by Fiscal Year -$ -$ (3,000) $ (3,000) $ (3,000) $
Years 2024 - 2028 Page 238
Capital Improvements Program Project Detail Sheet Fiscal
Project Description
This project will replace the failing waterline on Mary Jane.
Effect
Annual maintenance costs are expected to decrease by $1,250 per year.
Utility Water
Mary Jane Water Line Replacement
Upon Operations & Maintenance
Estimated Project Cost 437,500 $ 20242025202620272028 Cost by Fiscal Year -$ -$ -$ 437,500 $ -$ Sources of Funding Identified 20242025202620272028 Bond Issuances -$ -$ -$ -$ -$ Grants - - - -Operating Fund Revenues - - - 437,500BEDC Funding - - - -TIRZ Funding - - - -Other Funding - - - -Operations and Maintenance Costs 20242025202620272028 Cost by Fiscal Year -$ -$ -$ (1,250) $ (1,250) $
Fiscal Years 2024 - 2028 Page 239
Capital Improvements Program Project Detail Sheet
Capital Improvements Program Project Detail Sheet
Project Description
This project will replace the 2" and 1" undersized waterlines east of Nolan Creek bridge in the shirt-tale bend area.
Effect
No change to operation and maintenance expenditures are anticipated with this item.
Utility Water
E Central Water Line Upsize
Upon Operations & Maintenance
Estimated Project Cost 312,500 $ 20242025202620272028 Cost by Fiscal Year -$ 312,500 $ -$ -$ -$ Sources of Funding Identified 20242025202620272028 Bond Issuances -$ -$ -$ -$ -$ Grants - - - -Operating Fund Revenues - 312,500 - -BEDC Funding - - - -TIRZ Funding - - - -Other Funding - - - -Operations and Maintenance Costs 20242025202620272028 Cost by Fiscal Year -$ -$ -$ -$ -$
Years 2024 - 2028 Page 240
Fiscal
Project
This project consists of upsizing the waterline on S. Pearl from 1" to 8".
Effect Upon
Annual maintenance costs are expected to decrease by $2,000 per year.
Utility Water
Pearl Water Line
S
Description
Operations
Maintenance
&
Estimated Project Cost 187,500 $ 20242025202620272028 Cost by Fiscal Year -$ 187,500 $ -$ -$ -$ Sources of Funding Identified 20242025202620272028 Bond Issuances -$ -$ -$ -$ -$ Grants - - - -Operating Fund Revenues - 187,500 - -BEDC Funding - - - -TIRZ Funding - - - -Other Funding - - - -Operations and Maintenance Costs 20242025202620272028 Cost by Fiscal Year -$ (2,000) $ (2,000) $ (2,000) $ (2,000) $
Fiscal Years 2024 - 2028 Page 241
Capital Improvements Program Project Detail Sheet
Capital Improvements Program Project Detail Sheet
N Blair/Flat/Walker Looped Water Service
Project Description
The project consists of looping existing water lines between the named streets to improve water pressures and service due to small lines.
Effect
No change to operation and maintenance expenditures are anticipated with this item.
Water
Utility
Upon Operations & Maintenance
Estimated Project Cost 375,000 $ 20242025202620272028 Cost by Fiscal Year -$ -$ 375,000 $ -$ -$ Sources of Funding Identified 20242025202620272028 Bond Issuances -$ -$ -$ -$ -$ Grants - - - -Operating Fund Revenues - - 375,000 -BEDC Funding - - - -TIRZ Funding - - - -Other Funding - - - -Operations and Maintenance Costs 20242025202620272028 Cost by Fiscal Year -$ -$ -$ -$ -$
Years 2024 - 2028 Page 242
Fiscal
Capital Improvements Program Project Detail Sheet
Loop 121 Utility Relocations Phase 2
Project Description
The project will relocate water and sewer utilities in preparation of the Loop 121 Widening Project Phase 2.
Effect Upon
No change to operation and maintenance expenditures are anticipated with this item.
Utility Water
Operations & Maintenance
Estimated Project Cost 1,100,000 $ 20242025202620272028 Cost by Fiscal Year -$ 1,100,000 $ -$ -$ -$ Sources of Funding Identified 20242025202620272028 Bond Issuances -$ -$ -$ -$ -$ Grants - - - -Operating Fund Revenues - - - -BEDC Funding - - - -TIRZ Funding - 1,100,000 - -Other Funding - - - -Operations and Maintenance Costs 20242025202620272028 Cost by Fiscal Year -$ -$ -$ -$ -$
Years 2024 - 2028 Page 243
Fiscal
Capital Improvements Program Project Detail Sheet
Fiscal Years 2024 - 2028
Project Description
This project consists of replacing aging water metering infrastructure throughout the City of Belton, specificially meters and registers. Anticipating the replacement of approximately 1,000 meters per year, the project will span multiple years.
Effect Upon Operations & Maintenance
No change to operation and maintenance expenditures are anticipated with this item.
Utility Water Water Metering Infrastructure Replacement
Estimated Project Cost 1,175,000 $ 20242025202620272028 Cost by Fiscal Year 350,000 $ 400,000 $ 425,000 $ -$ -$ Sources of Funding Identified 20242025202620272028 Bond Issuances -$ -$ -$ -$ -$ Grants - - - -Operating Fund Revenues - - - -BEDC Funding - - - -TIRZ Funding - - - -Other Funding 350,000 400,000 425,000 -Operations and Maintenance Costs 20242025202620272028 Cost by Fiscal Year -$ -$ -$ -$ -$
Page 244
Capital Improvements Program Project Detail Sheet
Fiscal
SCADA/Omni Antenna Tower Project
Project
This project will replace several towers within the city to accommodate better reception and functionality of the SCADA alert system.
Effect
No change to operation and maintenance expenditures are anticipated with this item.
Utility Water
Description
Upon Operations & Maintenance
Estimated Project Cost 280,000 $ 20242025202620272028 Cost by Fiscal Year 280,000 $ -$ -$ -$ -$ Sources of Funding Identified 20242025202620272028 Bond Issuances -$ -$ -$ -$ -$ Grants - - - -Operating Fund Revenues - - - -BEDC Funding - - - -TIRZ Funding - - - -Other Funding 280,000 - - -Operations and Maintenance Costs 20242025202620272028 Cost by Fiscal Year -$ -$ -$ -$ -$
Years 2024 - 2028 Page 245
Capital Improvements Program Project Detail Sheet
Project
This project will replace all non-functioning gate valves within the distribution system that have deteriorated or failed. These replacements will allow for isolation of the system within zones.
Effect
No change to operation and maintenance expenditures are anticipated with this item.
Utility Water
Valve Replacement
Citywide
Description
Upon Operations & Maintenance
Estimated Project Cost 100,000 $ 20242025202620272028 Cost by Fiscal Year 100,000 $ -$ -$ -$ -$ Sources of Funding Identified 20242025202620272028 Bond Issuances -$ -$ -$ -$ -$ Grants - - - -Operating Fund Revenues - - - -BEDC Funding - - - -TIRZ Funding - - - -Other Funding 100,000 - - -Operations and Maintenance Costs 20242025202620272028 Cost by Fiscal Year -$ -$ -$ -$ -$
Years 2024 - 2028 Page 246
Fiscal
Capital Improvements Program Project Detail Sheet Fiscal
Project Description
This project includes replacing aging water lines and connections in the area of Guthrie, Oak, and Summit. This area has experienced numerous failures recently. The lack of a valve leaves this entire looped section without water when a failure occurs.
Effect Upon Operations & Maintenance
Annual maintenance costs are expected to decrease by $5,000 per year.
Utility Water North Belton Water Line Replacement
Estimated Project Cost 1,250,000 $ 20242025202620272028 Cost by Fiscal Year 1,250,000 $ -$ -$ -$ -$
of Funding Identified 20242025202620272028 Bond Issuances 1,250,000 $ -$ -$ -$ -$ Grants - - - -Operating Fund Revenues - - - -BEDC Funding - - - -TIRZ Funding - - - -Other Funding - - - -Operations and Maintenance Costs 20242025202620272028 Cost by Fiscal Year (5,000) $ (5,000) $ (5,000) $ (5,000) $ (5,000) $
Sources
2028 Page 247
Years 2024 -
Capital Improvements Program Project Detail Sheet
Fiscal Years 2024 - 2028
Temple-Belton WWTP Phase 2
Project Description
This project will expand capacity by adding new biological treatment trains, disinfection, and solids handling capabilities at the Temple-Belton wastewater treatment plant.
Effect Upon Operations & Maintenance
Annual maintenance costs are expected to increase by $10,000 per year.
Utility Wastewater
Estimated Project Cost 15,000,000 $ 20242025202620272028 Cost by Fiscal Year 15,000,000 $ - $ -$ -$ -$
of Funding Identified 20242025202620272028 Bond Issuances 9,500,000 $ -$ -$ -$ -$ Grants - - - -Operating Fund Revenues3,000,000 - - -BEDC Funding - - - -TIRZ Funding - - - -Other Funding 2,500,000 - - -Operations and Maintenance Costs 20242025202620272028 Cost by Fiscal Year 10,000 $ 10,000 $ 10,000 $ 10,000 $ 10,000 $
Sources
Page 248
Capital Improvements Program Project Detail Sheet
Main Belton Lift Station Force Main
Project Description
This project replaces and upsizes existing force mains to handle flows and to prevent erosion of the mains.
Effect Upon
No change to operation and maintenance expenditures are anticipated with this item.
Utility Wastewater
Operations
Maintenance
&
Estimated Project Cost 1,125,000 $ 20242025202620272028 Cost by Fiscal Year 1,125,000 $ -$ -$ -$ -$ Sources of Funding Identified 20242025202620272028 Bond Issuances 1,125,000 $ -$ -$ -$ -$ Grants - - - -Operating Fund Revenues - - - -BEDC Funding - - - -TIRZ Funding - - - -Other Funding - - - -Operations and Maintenance Costs 20242025202620272028 Cost by Fiscal Year -$ -$ -$ -$ -$
Years 2024 - 2028 Page 249
Fiscal
Capital Improvements Program Project Detail Sheet
Project Description
This project replaces sewer lines on College Street from 9th Avenue to 11th Avenue.
Effect Upon
Annual maintenance costs are expected to decrease by $1,000 per year.
Utility Wastewater
Replacement
College Street Sewer
Operations
Maintenance
&
Estimated Project Cost 812,500 $ 20242025202620272028 Cost by Fiscal Year -$ -$ -$ -$ 812,500 $ Sources of Funding Identified 20242025202620272028 Bond Issuances -$ -$ -$ -$ -$ Grants - - - -Operating Fund Revenues - - - - 812,500 BEDC Funding - - - -TIRZ Funding - - - -Other Funding - - - -Operations and Maintenance Costs 20242025202620272028 Cost by Fiscal Year -$ -$ -$ -$ (1,000) $
Years 2024 - 2028 Page 250
Fiscal
Capital Improvements Program Project Detail Sheet
Mary Jane and E Ave J Sewer
Project Description
This project replaces the undersized sewer at Mary Jane and E Avenue J.
Effect Upon Operations & Maintenance
Annual maintenance costs are expected to decrease by $1,000 per year.
Utility Wastewater
Estimated Project Cost 500,000 $ 20242025202620272028 Cost by Fiscal Year -$ -$ -$ 500,000 $ -$ Sources of Funding Identified 20242025202620272028 Bond Issuances -$ -$ -$ -$ -$ Grants - - - -Operating Fund Revenues - - - 500,000BEDC Funding - - - -TIRZ Funding - - - -Other Funding - - - -Operations and Maintenance Costs 20242025202620272028 Cost by Fiscal Year -$ -$ -$ (1,000) $ (1,000) $
Years 2024 - 2028 Page 251
Fiscal
Project
The project will replace the sewer main on E Avenue M from Highland Drive to Sharon Road.
Effect Upon
Annual maintenance costs are expected to decrease by $1,000 per year.
Utility Wastewater E Ave M Sewer Replacement
Description
Maintenance
Operations &
Estimated Project Cost 625,000 $ 20242025202620272028 Cost by Fiscal Year -$ 625,000 $ -$ -$ -$ Sources of Funding Identified 20242025202620272028 Bond Issuances -$ -$ -$ -$ -$ Grants - - - -Operating Fund Revenues - 625,000 - -BEDC Funding - - - -TIRZ Funding - - - -Other Funding - - - -Operations and Maintenance Costs 20242025202620272028 Cost by Fiscal Year -$ (1,000) $ (1,000) $ (1,000) $ (1,000) $
Years 2024 - 2028 Page 252
Capital Improvements Program Project Detail Sheet Fiscal
W Ave B near Mitchell Sewer Line
Project Description
This project will replace a deteriorating clay sewer line on W Avenue B.
Annual maintenance costs are expected to decrease by $1,000 per year.
Utility Wastewater
Operations & Maintenance
Effect Upon
Estimated Project Cost 312,500 $ 20242025202620272028 Cost by Fiscal Year -$ 312,500 $ -$ -$ -$ Sources of Funding Identified 20242025202620272028 Bond Issuances -$ -$ -$ -$ -$ Grants - - - -Operating Fund Revenues - 312,500 - -BEDC Funding - - - -TIRZ Funding - - - -Other Funding - - - -Operations and Maintenance Costs 20242025202620272028 Cost by Fiscal Year -$ (1,000) $ (1,000) $ (1,000) $ (1,000) $
Improvements
Fiscal Years 2024 - 2028 Page 253
Capital
Program Project Detail Sheet
Capital Improvements Program Project Detail Sheet
Project
This project includes replacing collapsed clay sewer lines between N Blair Street and Hilltop, north of E 14th Avenue.
Effect Upon
Annual maintenance costs are expected to decrease by $1,000 per year.
Utility Wastewater Hilltop Sewer Replacement
Description
Operations
Maintenance
&
Estimated Project Cost 312,500 $ 20242025202620272028 Cost by Fiscal Year -$ -$ 312,500 $ -$ -$
of Funding Identified 20242025202620272028 Bond Issuances -$ -$ -$ -$ -$ Grants - - - -Operating Fund Revenues - - 312,500 -BEDC Funding - - - -TIRZ Funding - - - -Other Funding - - - -Operations and Maintenance Costs 20242025202620272028 Cost by Fiscal Year -$ -$ (1,000) $ (1,000) $ (1,000) $
Sources
Years 2024 - 2028 Page 254
Fiscal
Capital Improvements Program Project Detail Sheet
Fiscal Years 2024 - 2028
Mitchell Branch Sewer Upsize/Interceptor
Project Description
This project consists of upsizing the existing sewer line, or placing a parallel interceptor, to handle flows from Shanklin/BISD/Three Creeks through Mitchell Branch.
Effect Upon
No change to operation and maintenance expenditures are anticipated with this item.
Utility Wastewater
Operations
Maintenance
&
Estimated Project Cost 4,125,000 $ 20242025202620272028 Cost by Fiscal Year -$ -$ 4,125,000 $ -$ -$
of Funding Identified 20242025202620272028 Bond Issuances -$ -$ 4,125,000 $ -$ -$ Grants - - - -Operating Fund Revenues - - - -BEDC Funding - - - -TIRZ Funding - - - -Other Funding - - - -Operations and Maintenance Costs 20242025202620272028 Cost by Fiscal Year -$ -$ -$ -$ -$
Sources
Page 255
Capital Improvements Program Project Detail Sheet
Fiscal Years 2024 - 2028
Utility
E 4th Ave/N Blair Drainage
Project Description
This project adds new culverts and channels at E 4th Avenue and N Blair to receive runoff in a school area.
Effect Upon Operations & Maintenance
Annual maintenance costs are expected to decrease by $1,000 per year.
Drainage
Estimated Project Cost 1,400,000 $ 20242025202620272028 Cost by Fiscal Year -$ 1,400,000 $ -$ -$ -$
of Funding Identified 20242025202620272028 Bond Issuances -$ -$ -$ -$ -$ Grants - - - -Operating Fund Revenues - - - -BEDC Funding - - - -TIRZ Funding - 800,000 - -Other Funding - 600,000 - -Operations and Maintenance Costs 20242025202620272028 Cost by Fiscal Year -$ (1,000) $ (1,000) $ (1,000) $ (1,000) $
Sources
Page 256
Capital Improvements Program Project Detail Sheet
Project Description
This project consists of constructing a detention pond near Avenue I to reduce flooding near property owned by the Belton Housing Authority.
Effect
Annual maintenance costs are expected to increase by $1,000 per year.
Drainage
Detention
Utility
Avenue I
Pond
Maintenance
Upon Operations &
Estimated Project Cost 625,000 $ 20242025202620272028 Cost by Fiscal Year -$ -$ -$ 625,000 $ -$
of Funding Identified 20242025202620272028 Bond Issuances -$ -$ -$ -$ -$ Grants - - - -Operating Fund Revenues - - - 625,000BEDC Funding - - - -TIRZ Funding - - - -Other Funding - - - -Operations and Maintenance Costs 20242025202620272028 Cost by Fiscal Year -$ -$ -$ 1,000 $ 1,000 $
Sources
Years 2024 - 2028 Page 257
Fiscal
Capital Improvements Program Project Detail Sheet
Utility
Mequite Road Drainage
Project Description
This project will replace the undersized culvert and widen Mesquite Road to pass a 100-year flood event.
Effect Upon Operations & Maintenance
Annual maintenance costs are expected to decrease by $2,000 per year.
Drainage
Estimated Project Cost 500,000 $ 20242025202620272028 Cost by Fiscal Year - $ -$ -$ - $ 500,000 $ Sources of Funding Identified 20242025202620272028 Bond Issuances - $ -$ -$ -$ -$ Grants - - - -Operating Fund Revenues - - - - 500,000 BEDC Funding - - - -TIRZ Funding - - - -Other Funding - - - -Operations and Maintenance Costs 20242025202620272028 Cost by Fiscal Year - $ -$ -$ - $ (2,000) $
Years 2024 - 2028 Page 258
Fiscal
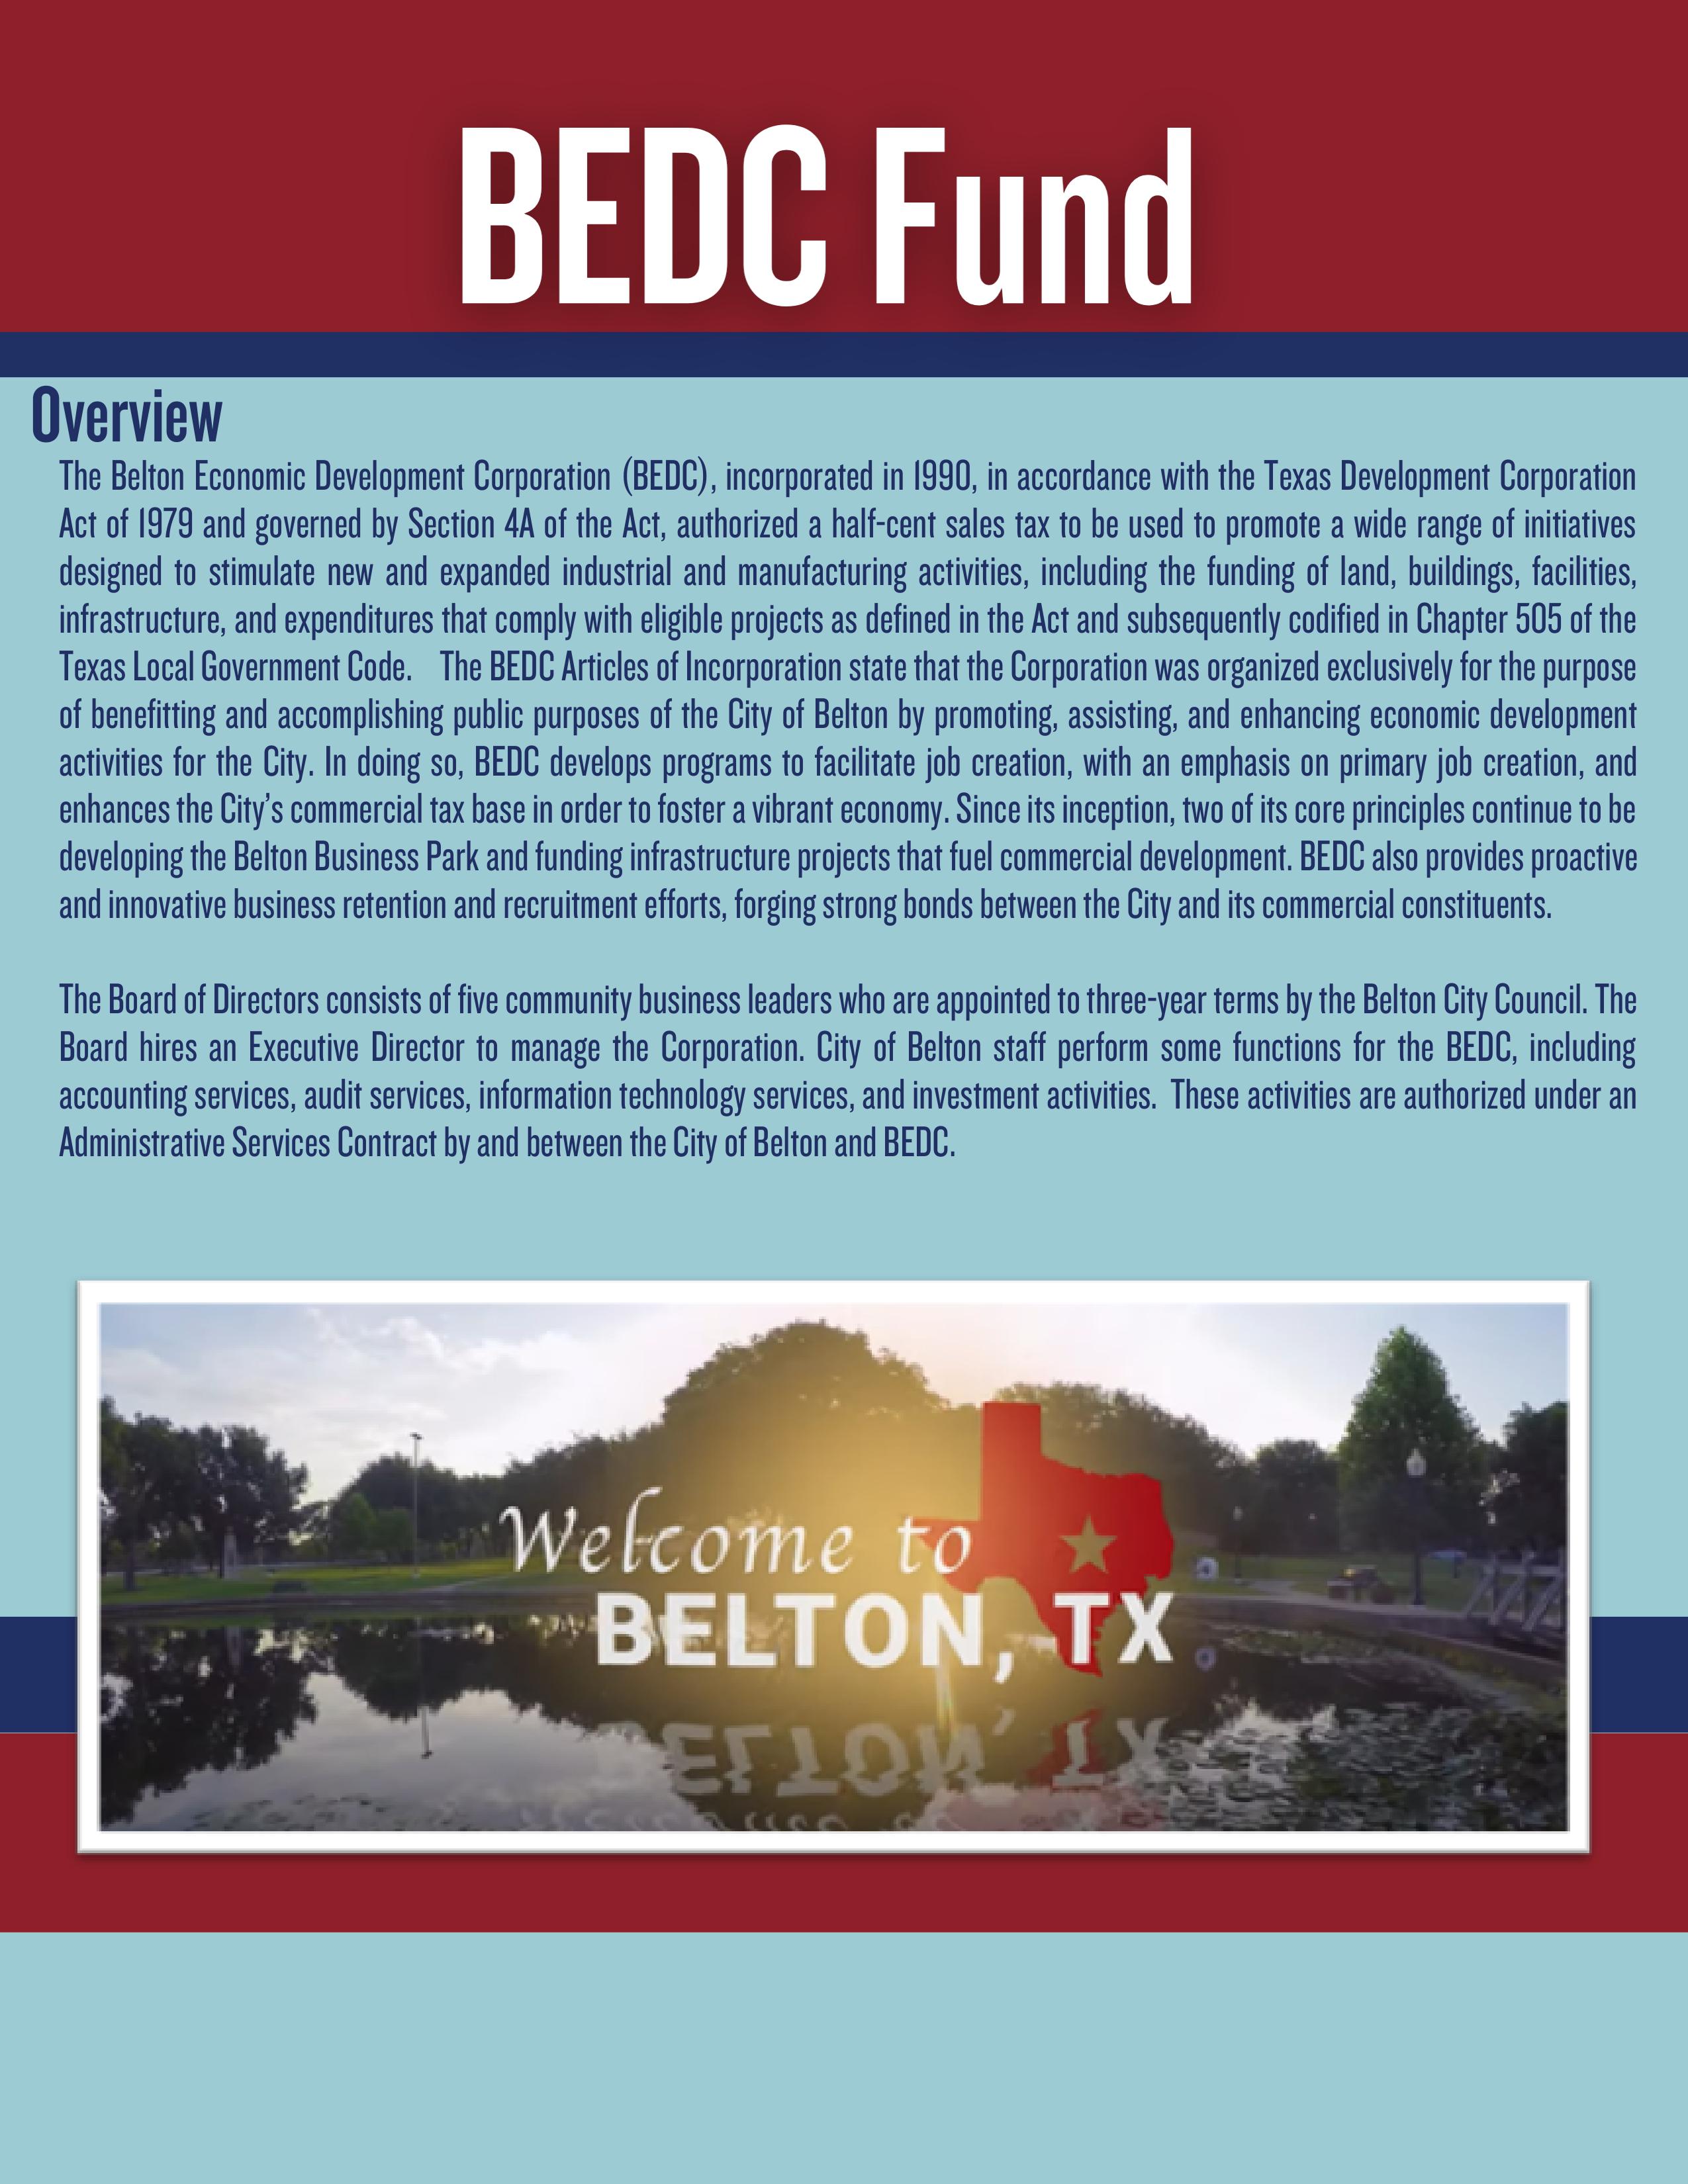
BEDC Fund Statement of Fund Balance
Notes:
1 Excludes Use of Prior Years' Fund Balance
2 An adjustment is made to unrestricted net assets, if necessary, during the conversion from a budget basis to an accrual basis (GAAP).
Fund Balance History
Actual ActualBudgetEstimatedProjected Fiscal Year Ending September 30 2021 2022 2023 2023 2024 Budget Basis: Beginning Unrestricted Net Assets (GAAP) 2,634,678 $ 4,575,797 $ 6,958,149 $ 6,958,149 $ 9,819,437 $ Revenues 1 2,488,409 2,940,184 3,114,250 4,671,900 3,555,410 Expenses (459,276) (569,711) (1,940,100) (1,810,612) (1,991,310) Net Increase / (Decrease) in Net Assets 2,029,133 2,370,473 1,174,150 2,861,288 1,564,100 Ending Unrestricted Net Assets (Budget) 4,663,811 $ 6,946,270 $ 8,132,299 $ 9,819,437 $ 11,383,537 $ Reconciliation to GAAP: Ending Unrestricted Net Assets (Budget) 4,663,811 $ 6,946,270 $ 8,132,299 $ 9,819,437 $ 11,383,537 $ Adjustment 2 (88,014) 11,879 - -Ending Unrestricted Net Assets (GAAP) 4,575,797 6,958,149 8,132,299 9,819,437 11,383,537 Restricted Net Assets (GAAP) - - - -Net Investment in Capital Assets (GAAP) 1,438,001 1,392,375 1,392,375 1,392,375 1,392,375 Total Fund Balance (GAAP) 6,013,798 $ 8,350,524 $ 9,524,674 $ 11,211,812 $ 12,775,912 $
$‐$2,000,000 $4,000,000 $6,000,000 $8,000,000 $10,000,000 $12,000,000 $14,000,000 2021 Actual2022 Actual2023 Budget2023 Estimated2024 Projected Fund Balance Fiscal Year Ending September 30
Unrestricted Net Assets (GAAP) Restricted Net Assets (GAAP) Net Investment in Capital Assets (GAAP) Page 260
BEDC Fund Revenue Trend
FY 2020FY 2021FY 2022FY 2023FY 2023FY 2024 ActualActualActualBudgetEstimatedBudget Revenues Sales Tax 2,042,479 $ 2,447,756 $ 2,860,330 $ 3,056,460 $ 3,095,400 $ 3,250,170 $ Rental Income 34,476 30,040 27,600 27,600 27,600 27,600 Miscellaneous Income 429,706 10,613 52,254 30,190 1,548,900 277,640 Total Revenue 2,506,661 $ 2,488,409 $ 2,940,184 $ 3,114,250 $ 4,671,900 $ 3,555,410 $ $‐$500,000 $1,000,000 $1,500,000 $2,000,000 $2,500,000 $3,000,000 $3,500,000 $4,000,000 $4,500,000 $5,000,000 2020 Actual2021 Actual2022 Actual2023 Budget2023 Estimate2024 Budget Sales Tax Rental Income Miscellaneous Income Page 261
BEDC Fund (505-3) Revenues
Account FY 2021FY 2022FY 2023FY 2023FY 2024 Number Account Name ActualActualBudgetEstimatedBudget Franchise & Other Taxes 1210Sales Tax 2,447,756 $ 2,860,330 $ 3,056,460 $ 3,095,400 $ 3,250,170 $ Total 2,447,756 2,860,330 3,056,460 3,095,400 3,250,170 Charges for Service 5210Rental Income 30,040 27,600 27,600 27,600 27,600 Total 30,040 27,600 27,600 27,600 27,600 Miscellaneous Income 6100Sale of City Property - - - 1,201,3006700Miscellaneous Income - 600 15,600 -6710Interest on Notes Receivable 7,268 6,1905,590 4,800 3,400 9100Interest Income 3,345 45,464 9,000 342,800 274,240 Total 10,613 52,254 30,190 1,548,900 277,640 BEDC Fund Revenues2,488,409 $ 2,940,184 $ 3,114,250 $ 4,671,900 $ 3,555,410 $
Page 262
BEDC Fund Category Summary


FY 2024 Expenditures by Category

FY 2021FY 2022FY 2023FY 2023FY 2024 Description ActualActualBudgetEstimatedBudget Personnel 213,584 $ 234,456 $ 278,430 $ 277,078 $ 287,990 $ Supplies 4,489 3,786 5,170 4,100 5,170 Maintenance 28,719 29,967 86,740 37,250 87,180 Services 139,140 151,502 219,760 182,084 206,770 Capital Outlay 73,344 - 50,000 10,100 50,000 Transfers - 150,000 1,300,000 1,300,000 1,354,200 BEDC Fund 459,276 $ 569,711 $ 1,940,100 $ 1,810,612 $ 1,991,310 $
Personnel 15% Maintenance 4% Services 10% Capital Outlay 3% Transfers 68%
Personnel Maintenance Services Capital Outlay Transfers Page 263
Belton Economic Development Corporation
DIVISION MISSION AND DESCRIPTION
The mission of the Belton Economic Development Corporation is to promote, assist, and enhance economic development activities within the City of Belton with special emphasis on job retention, job creation, and capital investment.
DIVISION GOALS AND ACTION ITEMS FOR FY 2024
Strategic Plan categories addressed below: Economic Development
Goal: Facilitate new and existing business expansion to create employment opportunities and enhance the tax base
Action Item: Promote Belton through various platforms/partnerships and maintain programs for business recruitment and retention
Goal: Aid in the development of infrastructure to stimulate commercial and industrial activity
Action Item: Identify, design, and fund vital utility and roadway projects, in partnership with the City, to encourage development
Goal: Participate in downtown redevelopment efforts to support small business retention and attraction
Action Item: Partner in the implementation of the Imagine Belton Plan
SIGNIFICANT CHANGES IN THE FY 2024 BUDGET
Appropriations for wages, taxes, and retirement increase to account for growth in salaries
Marketing expenditures increase to promote the Imagine Belton Plan
Appropriations for special services decreases with reduced spending on property development services
Transfers for capital projects increase to cover the updated cost projection for the IH-14 wastewater project
FY 2022FY 2023FY 2023FY 2024 WORKLOAD MEASURES ACTUAL BUDGET ESTIMATE BUDGET Number of real estate inquiries engaged 65 70 68 70 Number of commercial/industrial sites listed on website 67 75 76 80 Amount invested in infrastructure to promote development $150,000$1,300,000$1,300,000$1,354,200 PERFORMANCE MEASURES Number of commercial/industrial enties on tax roll 614 590 588 620 Number of BEDC real estate transactions 0 2 3 3 Estimated number of job in Belton 10,50010,75010,55010,600 PERSONNEL Executive Director 1.00 1.00 1.00 1.00 Director of Business Retention and Expansion 0.75 0.75 0.75 0.75 Administrative Assistant 0.50 1.00 1.00 1.00 Total Employees (Full-Time Equivalents) 2.25 2.75 2.75 2.75 Page 264
Account FY 2021FY 2022FY 2023FY 2023FY 2024 Number Account Name ActualActualBudgetEstimatedBudget Personnel 1010Salaries and Wages 167,495 $ 182,958 $ 208,570 $ 211,000 $ 216,660 $ 1070Overtime Pay - - - 100 200 1210TMRS 17,141 19,225 21,940 22,300 23,660 1220FICA 11,743 12,964 15,960 15,300 16,580 1230Employee Insurance16,164 18,859 31,150 28,000 30,150 1240Workers' Comp. Insurance239 298 400 338 470 1250Unemployment Compensation802 152 410 40 270 Total 213,584 234,456 278,430 277,078 287,990 Supplies 2010Office Supplies2,780 1,157 1,720 1,300 1,720 2090Tools and Other Supplies1,377 2,189 3,000 2,400 3,000 2600Postage332 440 450 400 450 Total4,489 3,786 5,170 4,100 5,170 Maintenance 3010Building3,219 8,632 12,500 5,000 17,560 3530Business Park22,793 20,309 72,240 30,600 67,240 4160Computer System2,707 1,026 2,000 1,650 2,380 Total28,719 29,967 86,740 37,250 87,180 Services 5000Public Notices- 499 750 150 250 5010Marketing55,835 68,294 40,000 48,000 45,000 5100Dues and Publications15,254 15,603 18,730 16,300 18,880 5130Travel and Training1,825 6,811 15,680 12,000 15,680 5200 Office Lease 8,168 - - -5500General Liability 3,344 5,092 4,100 3,244 5,260 5600 Audit 3,621 3,961 3,830 3,880 3,830 5610Legal 7,970 7,330 20,000 9,800 15,000 5620Engineering 25,767 20,124 27,000 21,000 30,000 5700Special Services 1,712 3,525 66,000 49,000 52,030 5720Industry Training - - 1,000 - 1,000 5780 Admin Fees 11,250 12,500 12,500 12,500 12,500 5810Communication Services - 1,048 1,870 1,820 2,070 5820Gas Service 1,111 1,278 1,200 1,400 1,610 5830Electric Service 1,044 4,348 5,000 1,490 1,560 5870Business Park Lighting 1,129 - - -5880Water Service 1,110 1,089 2,100 1,500 2,100 Total 139,140 151,502 219,760 182,084 206,770 Capital Outlay 8000Land - - - 10,1008100Buildings 40,990 - - -8400Computer Equipment 7,054 - - -8500Furniture 25,300 - - -8700Park Infrastructure - - 50,000 - 50,000 Total 73,344 - 50,000 10,100 50,000 Transfers 9521Transfer to BEDC Capital Projects - 150,000 1,300,000 1,300,000 1,354,200 Total - 150,000 1,300,000 1,300,000 1,354,200 BEDC Fund Expenditures459,276 $ 569,711 $ 1,940,100 $ 1,810,612 $ 1,991,310 $
Page 265
BEDC Fund (505-4-501)
COME EXPERIENCE ALL THINGS BELTON
Events and Concerts

Bell County Expo Center- concert venue, livestock arena, conference center. City of Belton sponsored events include Christmas at the Chisolm Trail, B4 Festival, 4th of July Parade and PRCA Rodeo, Movies in the Park, Soggy Doggy Day, Family Fishing and Fun, Father Daughter Dance, and One Community One Day.
Trails and Fields

Nolan Creek Hike and Bike trail, baseball, softball, soccer, sand volleyball, basketball, pickleball courts, disc golf, dog park, playgrounds (handicap accessible).

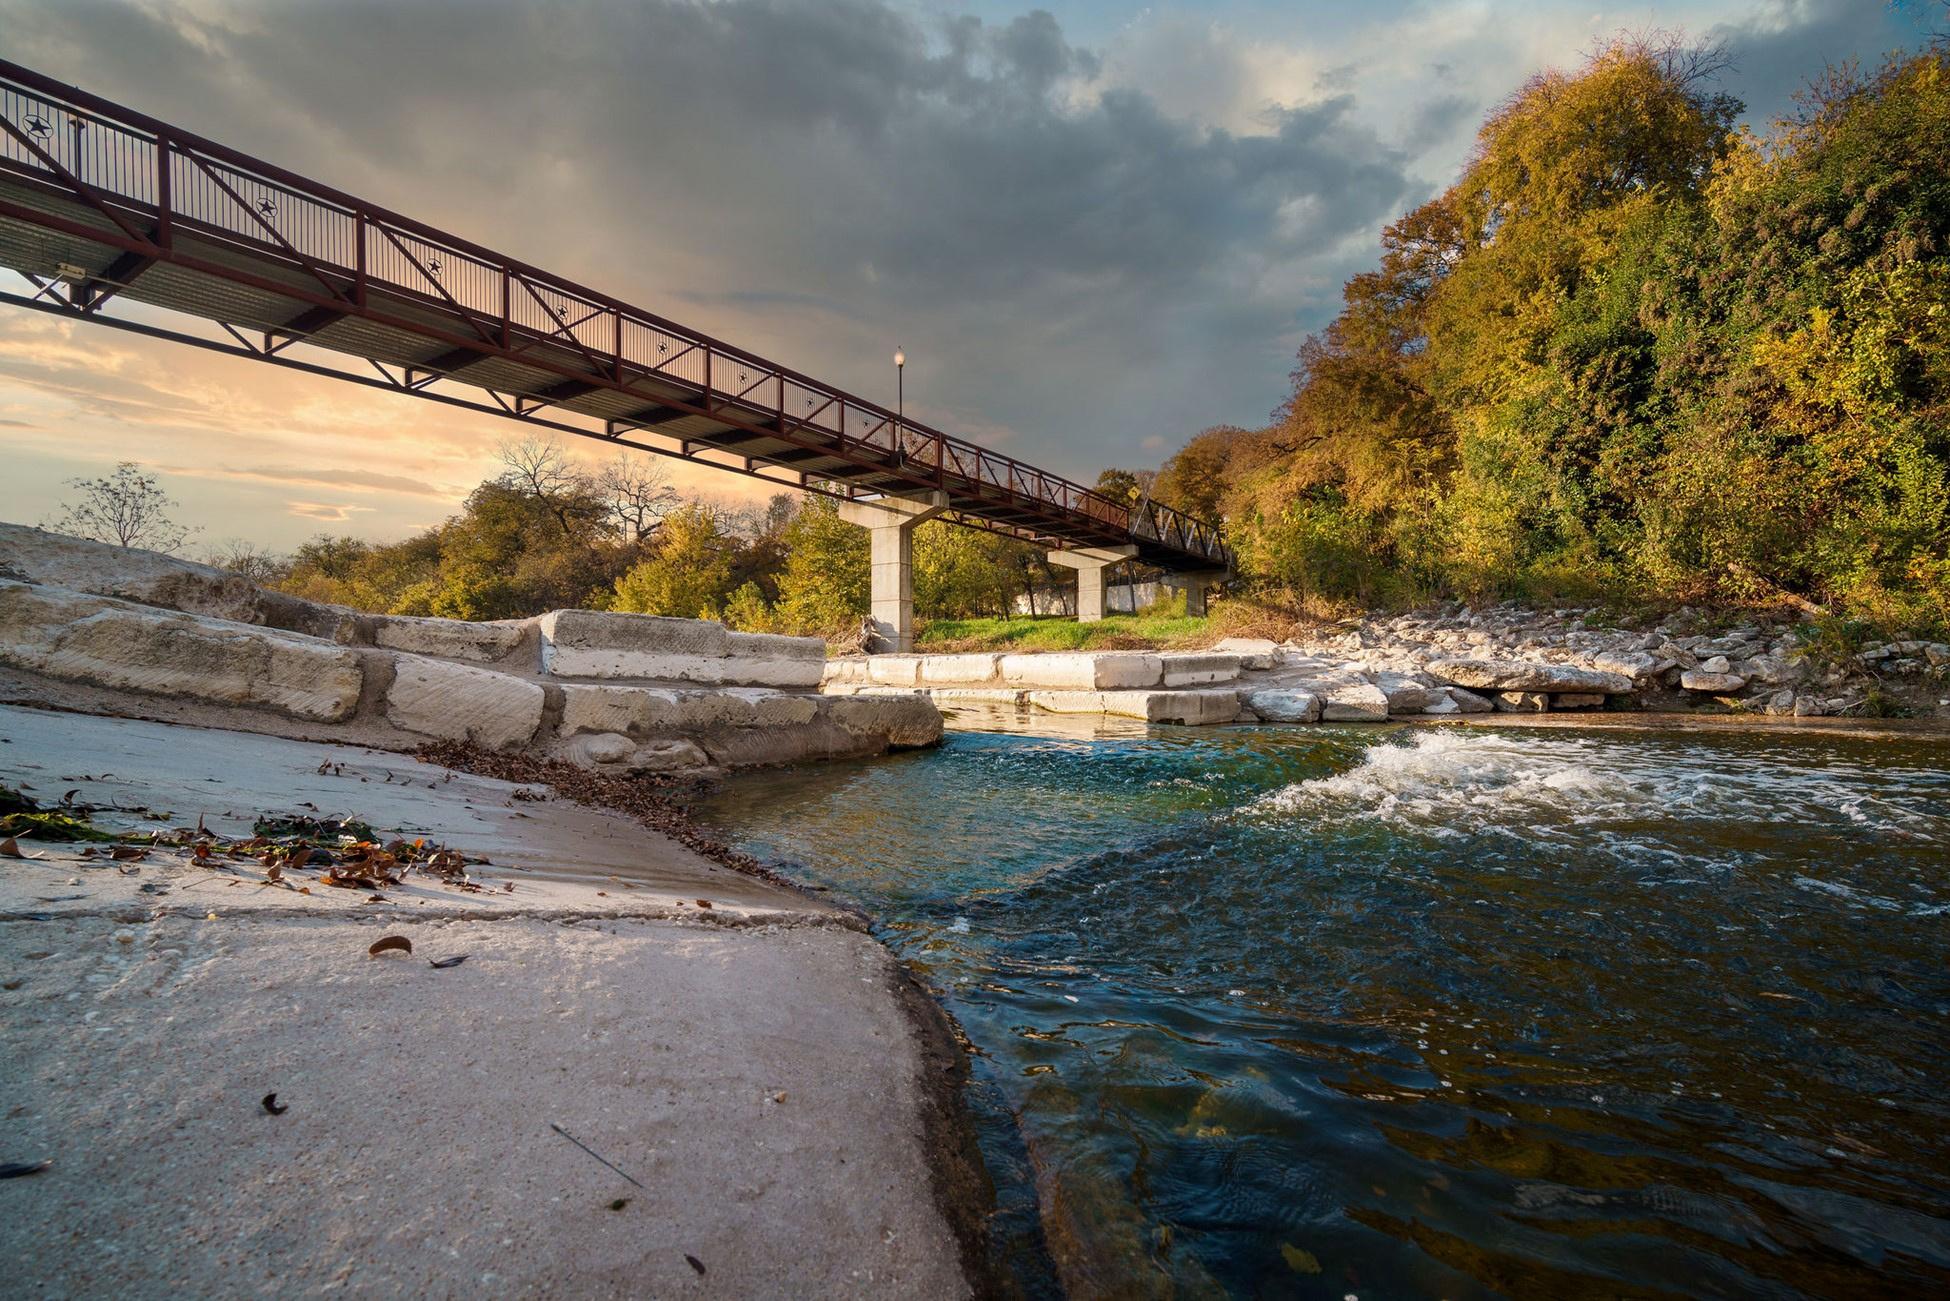
Tubing & Kayaking

Belton is the place to go for water activities we have Lake Belton, Stillhouse Lake, Nolan Creek, and coming soon fishing pier and kayak launch to Heritage Park with the expansion at Leon River. Belton offers amazing outdoor recreation: fishing, boating, skiing, camping, hiking, tubing, and kayaking for the whole family.
Page 266
CITY AND AREA DEMOGRAPHICS
LOCATION

Belton is situated along the banks of the Leon River in the rapidly growing Central Corridor of Texas. It is on Interstate 35 near the geographic center of the state, approximately 137 miles south of Dallas/Fort Worth and 60 miles north of Austin. Local topography varies from rolling plains to wooded hills with two large lakes just ten minutes from downtown. Within a 175 mile radius of Belton is a market of over 9.4 million people, including the Dallas/Fort Worth Metroplex, San Antonio, and much of Houston. This region encompasses 55 percent of the population of Texas.

Distance to: Austin 60 miles Denver 888 miles Dallas 137 miles Atlanta 870 miles San Antonio 139 miles Chicago 1,104 miles Houston 172 miles Los Angeles 1,391 miles El Paso 589 miles New York 1,696 miles Dallas Houston San Antonio El Paso Denver Chicago Los Angeles Georgia New York Belton ★ Page 267
City of Belton Average Climate
Average Winter Temperature High 60° F Low 40° F Average Summer Temperature High 96° F Low 74° F Average Annual Temperature High 77° F Low 55° F Average Annual Precipitation 35.25" Elevation 525 Feet -0.25 0.25 0.75 1.25 1.75 2.25 2.75 3.25 3.75 4.25 0 10 20 30 40 50 60 70 80 90 100 Jan Feb Mar Apr May Jun Jul Aug Sep Oct Nov Dec
CLIMATE
Precipitation High Temperature Low Temperature Page 268
POPULATION
(Bell, Coryell Counties)
Population Composition:
Under 18: 35.6%
18 – 64: 53.9%
Over 65: 10.5%
Female: 55.5%
Male: 44.5%
Veterans: 1,473
Households: 7,652
Population History
High school graduate or higher, age 25 or older: 85.0%
Bachelor’s degree or higher, age 25 or older: 28.4%
According to the U.S. Census Bureau, Belton’s population consists of 56.0% White, 29.2% Hispanic or Latino, 8.7% African American, and 6.1% all other ethnicities.
2022 2020 2010 2000 1990 Belton 24,327 23,050 18,216 14,623 12,476 Bell County 388,386 370,644 310,235 237,974 191,088 Killeen/Temple MSA 496,228 477,082 385,623 312,952 255,301
1,000 21,000 41,000 61,000 81,000 101,000 121,000 141,000 Belton Temple Harker Heights Killeen Salado Population by City 0 100,000 200,000 300,000 400,000 500,000 1990 2000 2010 2020 2022
Page 269
Belton Bell County Killeen/Temple MSA
EDUCATION
Belton Independent School District:
•3 - high schools, 4 - junior high schools, 11 - elementary schools
• BISD received a A – Superior Achievement in the State of Texas FIRST ratings and a B rating based on the Accountability Ratings as of 2022.
Higher Education:
• Belton: University of Mary Hardin-Baylor


• Bell County: Texas A & M College of Medicine, Temple
Temple College, Temple
Central Texas College, Killeen
Texas A&M University Central Texas, Killeen
• Area Colleges:
Baylor University, Waco
McLennan Community College, Waco
Texas State Technical College, Waco
Southwestern University, Georgetown

The University of Texas, Austin
St. Edwards University, Austin
Huston-Tillotson College, Austin
Concordia University, Austin
Austin Community College, Austin
Texas A & M University, College Station
Texas State College, San Marcos
Page 270
TRANSPORTATION
Highways: Interstate 35, Interstate 14 (US Highway 190), State Highway 317, Loop 121, FM 436, FM 439, FM 93.
Bus Lines: HOP public bus line which runs from Copperas Cove to Temple.
Railroad: Santa Fe Railroad, Georgetown Railroad, AMTRAK passenger service in Temple.
Air: Killeen-Fort Hood Regional Airport, Temple Draughton Miller Central Regional Airport, Austin Bergstrom International Airport.
INDUSTRIES
Belton's business community is diversified, with various sectors – manufacturing and distribution, retail, education, healthcare, government, and IT business process services.
The industrial sector is represented by companies manufacturing modular home structures, agriculture equipment, fiberglass tanks, roofing material, specialty advertising products, corrugated boxes, exercise equipment, school and office furniture, rapid prototypes, and centrifugal alloy castings. Various warehousing and distribution operations handle, industrial gases, snack foods and parcel delivery.
Fort Cavazos U.S. Army Installation is located 17 miles west of Belton. It is the largest United States Army Training Post, the largest single-site employer in the State of Texas with a force of more than 55,374, and a key economic driver for the area. The Texas Comptroller’s office reports that Fort Cavazos' economic impact to the state was an estimated $28.8 billion in 2021
Health care represents the largest private industry in Bell County. Over 23,794 individuals are employed in the medical field. Baylor Scott & White Health, the largest not-for-profit health system in the State of Texas, has a significant presence in Central Texas. This includes Scott & White Memorial Hospital, ranked by U.S. News and World Report as one of the top 10 hospitals in the state of Texas; McLane Children’s Hospital; and dozens of primary, urgent, and specialty care clinics staffed by over 800 physicians and 8,000 employees. Other medical facilities also service the area such as: Olin E. Teague Veteran's Center, Cedar Crest Hospital & Clinic, Metroplex Hospital, Seton Medical Harker Heights Center, and Darnall Army Medical Center.
There are five banks and two credit unions represented in Belton with branch offices located throughout Bell County and Central Texas.
Page 271
EMPLOYEES BY PRODUCT


MAJOR EMPLOYERS Employer Product Employees BISD Education 1,990 Bell County Government 1,250 University of Mary Hardin-Baylor Education 660 TruMH (a Clayton Homes Co) Manufacturing/Distribution 556 HEB Grocery Retail/Service 433 CGI IT/Business Process Services 315 Cedar Crest Hospital & Clinic Healthcare 294 Wal-Mart Retail/Service 272 UPS-Customer Center Distribution 212 City of Belton Government 194
Education Government Manufacturing/Distribution Retail/Service Healthcare IT/Business Process Services Distribution Page 272
PROPERTY & TAXES
The top 10 property taxpayers within the City limits have a combined taxable value for 2022 of $178,572,513, and are comprised of the following organizations:
PARKS & RECREATION
Lakes: Belton Lake (7,400 acres) and Stillhouse Hollow Lake (6,340 acres) offer outdoor recreation, fishing, boating, skiing, boat rentals, launching ramps, picnic grounds, restrooms, restaurants, snack bars, drinking water, camping areas, RV areas, marinas, and nature trails.
Harris Community Center: This renovated structure is situated gracefully along Nolan Creek and is an ideal setting for meetings, receptions, and reunions. The original building was constructed in 1936 and housed the Harris School, a historic African American school recognized with a state historical marker for its contribution to African American education. The building and grounds were conveyed from the school district to the City of Belton in 2005 for renovation. The Center was dedicated in July 2006 in conjunction with the West Belton-Harris High Ex-Student’s Association annual reunion. The Center has already received numerous awards and accolades, and ensures that the legacy, heritage, and contributions of those who came before us will be remembered.
Bell County Museum: One of twelve remaining Carnegie Libraries in Texas, this historic building was restored in 1990 and now stands as the major collection of Bell County history. In 1991, the Bell County Museum was awarded the entire collection of artifacts of Miriam "Ma" Ferguson, the first woman governor of Texas and a native of Bell County.
Taxpayer Taxable Assessed Value River Springs at barge Ranch $36,328,138 Turtle Creek Investments 29,549,378 Oncor Electric Delivery 22,261,160 Chappell Hill Equity III 17,726,352 Legacy Landing Group 17,193,760 Colonial Crossing Company 16,377,917 Wal-Mart Real Estate Business Trust 10,850,000 Stratasys Direct Manufacturing 9,877,808 CMH Manufacturing Inc 9,376,427 2007 Belton Shady Lane 9,031,573
Page 273
Bell County Expo Center: Central Texas' best entertainment complex, the Expo Center includes a 9,400 seat main arena, a special events room, an assembly hall, an exposition building, and equine/livestock complex and champions club. Home of the Central Texas State Fair.
Heritage Park: This is a 150-acre park along the Leon River and is home to our baseball and soccer association with 5 baseball game fields and 4 soccer game fields. It has a 1.5acre dog park with a large dog side and a small dog side. This park also includes an inclusive handicap playground with artificial turf and a rentable pavilion next to it. It also has walking trails, fishing dock, picnic areas and a community garden that can be reserved for growing your own vegetables. There are lighted parking lots with plenty of open space for just about any outdoor activity. More recently a championship 18-hole disc golf course was added to Heritage Park. People from across the country have come to play on the disc golf course.
Chisholm Trail Park: This a 34-acre park and is home to our softball association with 3 softball game fields and 2 practice soccer fields. It has lighted walking trail, several picnic areas a horseshoe pit, basketball court, sand pit volleyball court, 2-pickle ball courts and a new playground for the kids. This park features a parking lot next to a large, covered pavilion breezeway for exercise classes with a large restroom nearby.
Harris Community Park: This park includes a playground, splash pad, picnic tables, horseshoe pits and three pavilions with restrooms. It is located near the renovated Harris Community Center and overlooks Nolan Creek and the Hike and Bike Trail.
Page 274
SummerFun USA: A water amusement park along the banks of the Leon River adjacent to Heritage Park. The park includes a swimming pool, giant water slides, children's area, concessions, and picnic area.
Independence Day Celebration and PRCA Rodeo: The Annual 4th of July Celebration has been celebrated since the late 1800's and attracts crowds from all over Central Texas. The Celebration includes a kick-off street party at the Bell County Courthouse on the square, a three-day Professional Rodeo Cowboy Association Rodeo, a family fun carnival, God and Country concert featuring religious and Texas music, July 4th parade and patriotic program, and a day full of activities in Yettie Polk Park. Festivities in Yettie Polk Park include Children's Day in the Park, Old Fiddler's Contest, gospel singing, arts and crafts festival, and food booths. The Celebration is sponsored by the Belton Area Chamber of Commerce.
Page 275
Mural outside Cochran, Blair & Potts, Belton, TX
BUDGET GLOSSARY
Account Number: A code made up of numbers used to classify how specific dollar amounts come into the City or how they are being spent.
Accounting System: The methods and records established to identify, assemble, analyze, classify, record and report the City's transactions and to maintain accountability for the related assets and liabilities.
Accounts Payable (AP): A short-term (one year or less) liability reflecting amounts owed for goods and services received by the City.
Accounts Receivable (AR): An asset reflecting amounts due from other persons/organizations for goods and services furnished by the City.
Accrual Accounting: A basis of accounting in which revenues and expenses are recorded at the time they occur, rather than at the time cash is received or paid by the City.
Ad Valorem Taxes: Commonly referred to as property taxes. The charges levied on all real, and certain personal property according to the property's assessed value and the tax rate. Also known as property taxes.
Amortization: An accounting method that reduces the value of a loan or an intangible asset, over time.
Annual Comprehensive Financial Report: The City’s complete set of financial statements issued by a government entity in accordance with the requirements of the Government Accounting Standards Board. The report is comprised of the introductory, financial, and statistical sections in which all the annual reports for that specific fiscal year are summarized.
Appropriation: An authorization made by the City Council which permits the City to make expenditures and incur obligations.
Arbitrage: The reinvestment of the proceeds of tax-exempt securities in materially higher-yielding taxable securities.
Assessed Value: A valuation set upon real estate or other property as a basis for levying property taxes. All property values within the City of Belton are assessed by the Bell County Appraisal District.
Asset: The resources and property of the City that can be used or applied to cover liabilities.
Page 276
Audit: An examination or verification of the financial accounts and records. The City is required to have an annual audit conducted by qualified certified public accountant, concluding in a written report called the Annual Report (AR).
Available Cash: Unobligated cash and cash equivalents.
Balanced Budget: A balanced budget occurs when the total sources of revenues a government collects in a year is equal to the amount it spends on goods, services, and debt service. In Texas, municipalities are allowed to use available fund balance as sources.
Basis of Accounting: Refers to when revenues, expenditures, expenses and transfers (and the related assets and liabilities) are recorded and reported in the financial statements.
Bond: A written promise to pay a specified sum of money (called the principal amount) at a specified date or dates in the future (called the maturity dates), and carrying interest at a specified rate, usually paid periodically. The difference between a bond and a note is that a bond is issued for a longer period and requires greater legal formality. The most common types of bonds are general obligation and revenue bonds. Bonds are usually used for construction of large capital projects, such as buildings, streets, and water/sewer system improvements.
Bonded Debt: The portion of indebtedness represented by outstanding (unpaid) bonds.
Bonds Issued: Bonds sold by the City.
Bonds Payable: The face value of bonds issued and unpaid.
Budget: A financial plan for a specified period of time (fiscal year for the City) that includes an estimate of proposed expenditures and the means for financing them.
Capital Assets: Assets of a long-term character which are intended to be held or used, such as land, buildings, machinery, furniture and equipment.
Capital Expenditures: Expenditures for the construction, purchase or renovation of City facilities or property with a value exceeding $20,000 and a useful life greater than two years.
CIP: Capital Improvements Program. A plan for capital expenditures to provide longlasting physical improvements to be incurred over a fixed period of several future years.
Capital Outlay: Expenditures resulting in the acquisition of or addition to the City's fixed assets.
Page 277
Capital Projects Fund: A fund created to account for financial resources to be used for the acquisition or construction of major capital facilities or equipment.
Cash: Currency on hand and demand deposits with banks or other financial institutions.
Cash Basis: A basis of accounting in which transactions are recorded on when cash is received or disbursed.
Cash Equivalents: Short-term, highly liquid investments that are readily convertible to known amounts of cash.
Certificate of Obligation (CO): Legal debt instruments used to finance capital improvement projects. Certificates of obligation are backed by the full faith and credit of the government entity and are fully payable from a property tax levy. Certificates of obligation differ from general obligation debt in that they are approved by the City Council and are not voter approved.
Component Unit: Legally separate organization for which the elected officials of the City are financially accountable.
Contingency: The appropriation of funds for future allocation in the event specified budget allocations are insufficient and additional funding is required.
Current Taxes: Taxes that are levied and due within the ensuing fiscal year.
De Minimis Rate: The rate that would generate an additional $500,000 in revenue for the M&O rate plus the current debt rate.
Debt Service Fund: A fund established to account for funds needed to make principal and interest payments on outstanding bonds when due. Also referred to as an Interest and Sinking Fund.
Debt Service Requirements: The amount of money required to pay interest and principal for a specified period on outstanding debt.
Delinquent Taxes: Property taxes remaining unpaid after the due date. Delinquent taxes incur penalties and interest at rates specified by law.
Department: A functional group of the City with related activities aimed at accomplishing a major City service or program.
Depreciation: The proration of the cost of a fixed asset over the estimated service life of the asset. Each period is charged with a portion of such cost, and through this process, the entire cost of the asset is ultimately charged off as an expense.
Page 278
Division: A grouping of related activities within a particular department. For example, Code Compliance is a division of the Police Department.
Encumbrance: The commitment of appropriated funds to purchase an item or service. An encumbrance differs from an account payable in that a commitment is referred to as an encumbrance before goods or services are received. After receipt, the commitment is referred to as an account payable.
Enterprise Fund: See Proprietary Fund.
Expenditure: If accounts are kept on the accrual basis, this term designates total charges incurred, whether paid or unpaid. If they are kept on the cash basis, the term covers only actual disbursements for these purposes. (Note: An encumbrance is not an expenditure. An encumbrance reserves funds to be expended.)
Expense: Charges incurred, whether paid or unpaid, for operation, maintenance, interest and other charges which are presumed to benefit the current fiscal period.
Equity: The difference between assets and liabilities of the fund.
Fiscal Year (FY)(Period): The time period designated by the City signifying the beginning and ending period for recording the financial transactions of the City. The City of Belton's fiscal year begins each October 1st and ends the following September 30th.
Full Faith and Credit: A pledge of the City's taxing power to repay debt obligations. Bonds carrying such pledges are referred to as general obligation bond or tax-supported debt.
Fund: Separate fiscal and accounting entities with their own resources and budgets necessary to carry on specific activities and attain certain objectives.
Fund Balance: The difference between fund assets and fund liabilities of governmental & trust funds. Fund balance for general fund types using modified accrual accounting closely equates to available cash.
General Fund (GF): The largest fund within the City. Accounts for all financial resources except those required to be accounted for in another fund. The General Fund contains the activities commonly associated with municipal government, such as police and fire protection, libraries, streets, and parks and recreation.
General Obligation Bonds: Bonds that finance a variety of public projects such as streets, buildings, and capital improvements. The repayment of these bonds is usually made from the Debt Service Fund. They are backed by the full faith and credit of the City and voter approved.
Page 279
Goals: Department/division objectives intended to be accomplished or begun within the coming fiscal year.
Governmental Funds: Funds generally used to account for tax-supported activities. These include the General Fund, Debt Service Fund, and Capital Projects Funds.
Grant: Contributions or gifts of cash or other assets from another government to be used for a specific purpose, activity or facility.
Infrastructure: Long-lived capital assets that normally are stationary in nature and can be preserved for a significantly greater number of years than most capital assets. Examples of infrastructure assets include roads, bridges, drainage systems, and water and sewer systems.
Interest and Sinking Fund: See Debt Service Fund.
Interfund Transfers: Amount transferred from one fund to another.
Intergovernmental Revenue: Revenues received from another governmental entity, such as county, state or federal governments.
Machinery & Equipment: Property that does not lose its identity when removed from its location and is not changed materially or consumed immediately by use.
Maintenance: The act of keeping assets in a state of good repair. It includes preventive maintenance; normal periodic repairs; part replacement and so forth needed to maintain the asset so that it continues to provide normal service.
Mission: The basic purpose of a department/division - the reason for its existence.
Modified Accrual Basis: This method of governmental accounting recognizes revenues when they are measurable and available and expenditures when goods or services are received (except for principal and interest on long-term debt, which is recognized when paid).
No-New-Revenue Tax Rate: The total rate that is needed to raise the same amount of revenue from the same properties in consecutive years.
Operating Budget: Plans of current expenditures and the proposed means of financing them. The annual operating budget is the primary means by which most of the financing activities of the City are controlled.
Operating Expenses: Proprietary fund expenses related directly to the Fund's primary activities.
Page 280
Operating Income: The excess of proprietary fund operating revenues over operating expenses.
Operating Revenues: Proprietary fund revenues directly related to the fund's primary activities. They consist primarily of user charges for goods and services.
Ordinance: A formal legislative enactment by the City Council.
Paying Agent: An entity responsible for paying of bond principal and interest on behalf of the City.
Principal: The face value of a bond, payable on stated dates of maturity.
Property Taxes: See Ad Valorem Taxes.
Proprietary Fund: Also referred to as an Enterprise Fund. A governmental accounting fund in which the services provided, such as water and sewer service, are financed and operated similarly to those in a private business. The intent is that the costs of providing these services be recovered through user charges (e.g. water/sewer bills).
Refunding: The issuance of new debt whose proceeds are used to repay previously issued debt. The proceeds may be used immediately for this purpose (a current refunding), or they may be placed with an escrow agent and invested until they are used to pay principal and interest on the old debt at a future time (an advanced refunding).
Reimbursements: Interfund transactions that constitute reimbursements to a fund for expenditures or expenses initially made from it, but that properly apply to another fund.
Resolution: A special or temporary order of the City Council. Requires less formality than an ordinance.
Retained Earnings: An equity account reflecting the accumulated earning of a proprietary fund.
Revenue Bonds: Bonds whose principal and interest are payable exclusively from earnings of a proprietary fund.
R U OK? Outreach program operated by the Police Department & CHIPS volunteers that consists of periodic phone calls to participating senior citizens as part of a welfare check.
Special Revenue Fund: Accounts for the proceeds of specific revenue sources that are legally restricted to expenditure for specified purposes.
Taxable Value: The assessed value of property less any exemptions available on that specific property. The tax rate is applied to the taxable value to arrive at a tax levy.
Page 281
Tax Base: The total taxable value of all real and personal property in the City as of January 1st of each year, as certified by the Tax Appraisal District, less any exemptions.
Taxes: Compulsory charges levied by a government to finance services performed for the common benefit.
Tax Levy: The resultant product when the tax rate per one hundred dollars is multiplied by the tax base.
Tax Rate: The amount of tax levied for each $100 of taxable value.
Tax Roll: The official list showing the amount of taxes levied against each taxpayer or property.
TML: The Texas Municipal League is a voluntary coalition of Texas municipalities created for the purpose of furthering and enhancing causes of mutual interest to Texas cities. The League offers educational and training opportunities, legislative activities and legal advisement to its members. Additionally, the League has intergovernmental risk pools that offer insurance coverage on an elective basis.
TMRS: The Texas Municipal Retirement System provides retirement plans to its member cities. Each city selects its own plan and its contributions are computed on each individual city’s plan and actuarial information. The City of Belton currently offers its employees a retirement plan with 2:1 matching, 5 year vesting and retirement eligibility at age 60 with 10 years of service and at any age with 20 years of service.
Unencumbered Balance: The amount of an appropriation that is not expended or encumbered. It is essentially the amount of money still available for future purchases.
User Charges: The payment of a fee for direct receipt of a public service by the party benefiting from the service (e.g. water and sewer fees).
Voter-Approval Tax Rate: The rate that raises 3.5% more in revenue for maintenance and operation expenditures plus the debt service rate.
Page 282
ACRONYMS
ACFR Annual Comprehensive Financial Report
AR Annual Report (audit)
ARPA American Rescue Plan Act
BACFS Belton Area Citizens for Seniors
BCWCID Bell County Water Control and Improvement District
BEDC Belton Economic Development Corporation
BISD Belton Independent School District
BRA Brazos River Authority
BS&W Baylor Scott and White
CHIPS Citizens Helping in Police Service
CIP Capital Improvements Program
CO Certificates of Obligation
CPA Certified Public Accountant
CTCOG Central Texas Council of Governments
CTWSC Central Texas Water Supply Corporation
DBBA Downtown Belton Business Alliance
DRWSC Dog Ridge Water Supply Corporation
EMS Emergency Medical Services
ETJ Extra-Territorial Jurisdiction
FB Fund Balance
FD Fire Department
FICA Federal Insurance Contribution Act (commonly referred to as Social Security)
FTA Failure to Appear
FTE Full-Time Equivalent
FY Fiscal Year
GAAP Generally Accepted Accounting Procedures
GASB Governmental Accounting Standards Board
GF General Fund
GFOA Government Finance Officers Association
GFOAT Government Finance Officers Association of Texas
GIS Geographic Information System
HOTDA Heart of Texas Defense Alliance
HVAC Heating, ventilation, and air conditioning
IT Information Technology
KTMPO Killen-Temple Metropolitan Planning Organization
LEOSE Law Enforcement Officer Standards and Education
M&O Maintenance and Operation
O&M Operations and Maintenance
P&R Parks and Recreation
PD Police Department
PH Public Hearing
PPFC Public Property Finance Corporation
PW Public Works
ROW Right of way
Page 283
TBD To Be Determined
TBWWTP Temple-Belton Wastewater Treatment Plant
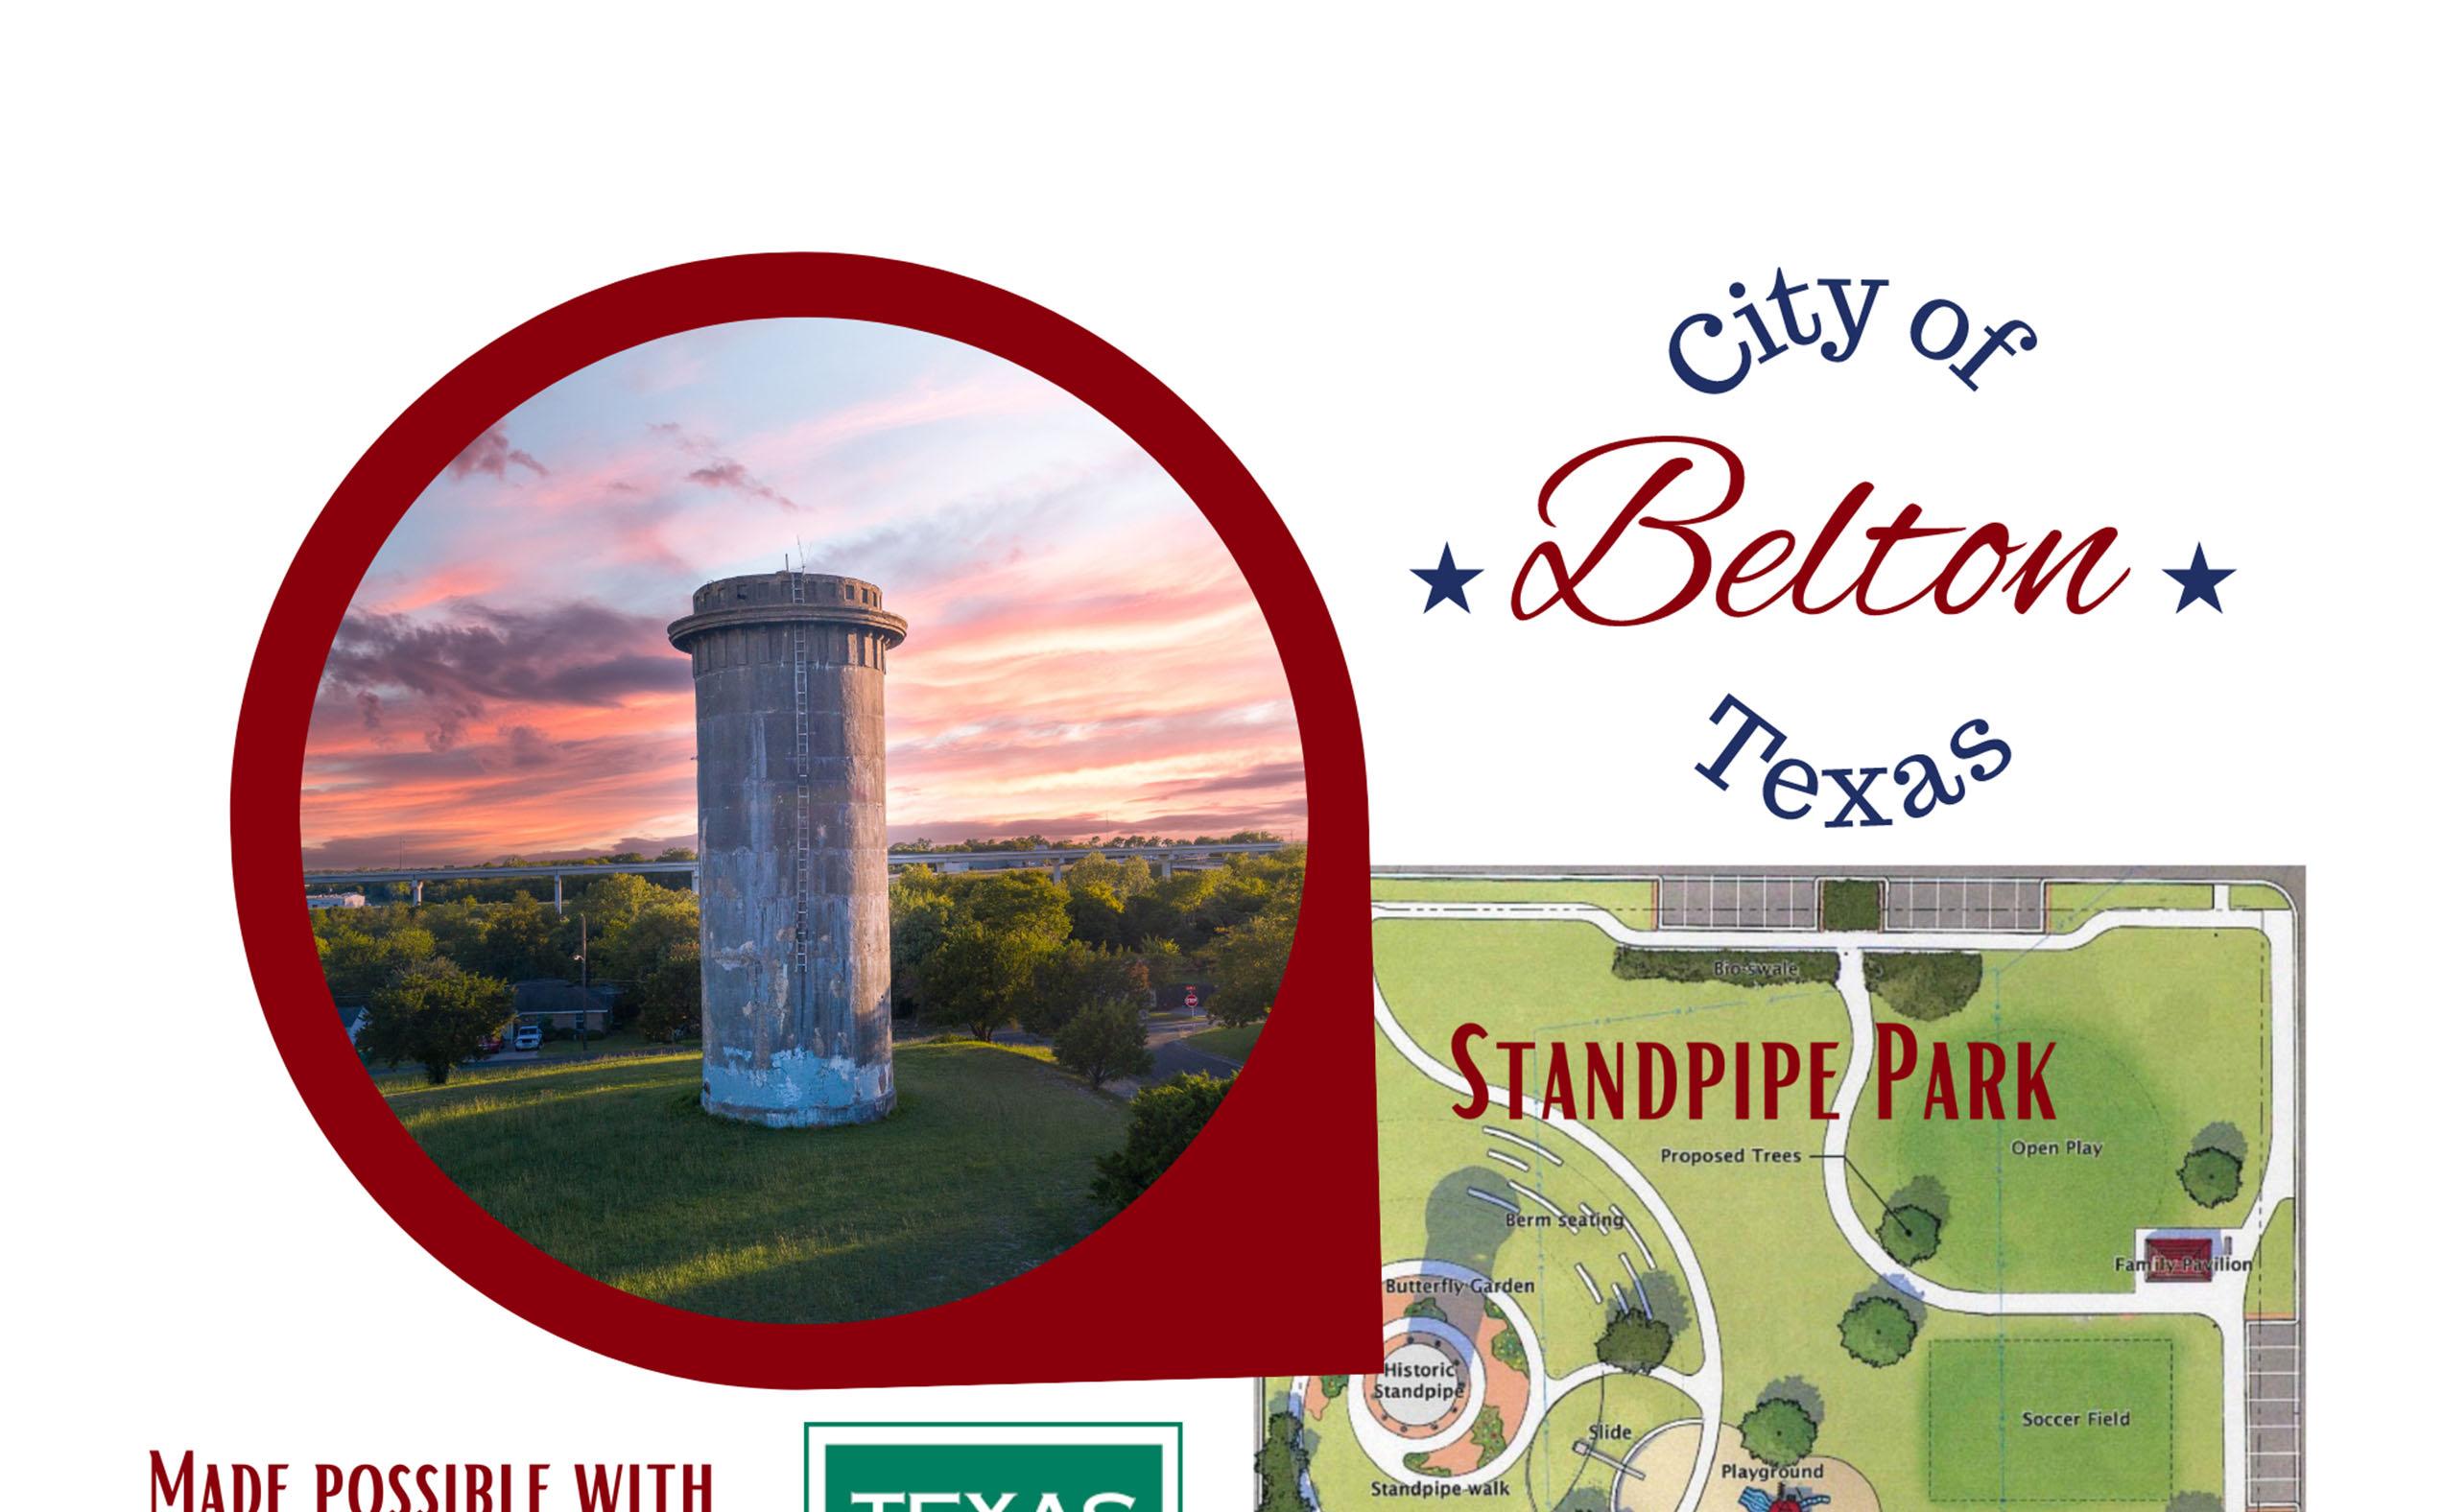
TCEQ Texas Commission on Environmental Quality

TDFA Texas Dormitory Finance Authority
TDHCA Texas Department of Housing & Community Affairs
TIRZ Tax Increment Reinvestment Zone
TML Texas Municipal League
TMRS Texas Municipal Retirement System
TP&W Texas Parks & Wildlife
TWC Texas Workforce Commission – Unemployment Compensation
TxDOT Texas Department of Transportation
UMHB University of Mary Hardin-Baylor
USACE United States Army Core of Engineers
WS Water and Sewer
YAC Youth Advisory Commission
Page 284
Page 285