Editor’s Message
Construction economics Joshua Mutize, PQS Construction Economist Editor elow are Statistics Canada reports on Building Construction Price Index and Building Permit metrics. This information is being printed in its full version as obtained from Statistics Canada. At the bottom of this report, we have provided contact information on how to obtain additional data or access original reports from Statistics Canada. Information is being provided for free and not intended for commercial marketing.
Building Construction Price Index Second Quarter 2011 – Statistics Canada The composite price index for nonresidential building construction increased by 1.2% in the second quarter compared with the previous quarter. The quarterly advance was mainly a result of wage increases and the continued strength of construction material prices.
All seven of the census metropolitan areas (CMAs) surveyed reported quarterly increases ranging from 0.6% to 1.5%. Ottawa–Gatineau, Ontario part (+1.5%) and Toronto (+1.4%) recorded the largest gains. Year over year, the composite price index for non-residential building construction was up 3.2%. Of the CMAs surveyed, Ottawa–Gatineau, Ontario part (+4.4%) and Toronto (+3.9%) recorded the largest increases while Calgary (+1.9%) registered the smallest gain. Note: This release presents data that are not seasonally adjusted and the indexes published are subject to a one quarter revision period after dissemination of a given quarter’s data. Table 1 Non-residential building construction price indexes The non-residential building construction price indexes for the third quarter will be released on November 15.
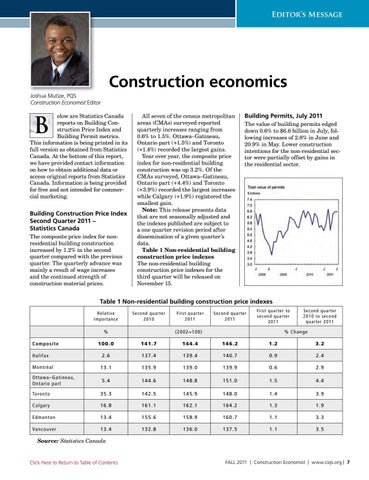
Building Permits, July 2011 The value of building permits edged down 0.6% to $6.6 billion in July, following increases of 2.8% in June and 20.9% in May. Lower construction intentions for the non-residential sector were partially offset by gains in the residential sector.
Table 1 Non-residential building construction price indexes Relative importance
Second quarter 2010
%
Composite
First quarter 2011
Second quarter 2011
First quarter to second quarter 2011
(2002=100)
Second quarter 2010 to second quarter 2011
% Change
1 0 0 .0
1 4 1 .7
144.4
146.2
1.2
3. 2
2. 6
137. 4
139.4
140.7
0.9
2 .4
13. 1
135. 9
139.0
139.9
0.6
2.9
5. 4
144. 6
148.8
151.0
1.5
4.4
Toron t o
35. 3
142. 5
145.9
148.0
1.4
3 .9
C alga r y
16. 8
161. 1
162.1
164.2
1.3
1.9
Ed mo n t o n
13. 4
155. 6
158.9
160.7
1.1
3 .3
Van c o u ver
13. 4
132. 8
136.0
137.5
1.1
3.5
H alifa x Mont r éa l Otta wa–Gat in ea u , Onta r io par t
Source: Statistics Canada
Click Here to Return to Table of Contents
FALL 2011 | Construction Economist | www.ciqs.org | 7


