4
Effective Performance Management Development of scorecard thinking
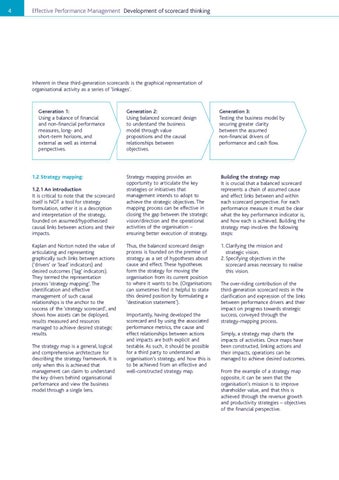
Inherent in these third-generation scorecards is the graphical representation of organisational activity as a series of ‘linkages’.
Generation 1: Using a balance of financial and non-financial performance measures, long- and short-term horizons, and external as well as internal perspectives.
1.2 Strategy mapping: 1.2.1 An introduction It is critical to note that the scorecard itself is NOT a tool for strategy formulation, rather it is a description and interpretation of the strategy, founded on assumed/hypothesised causal links between actions and their impacts. Kaplan and Norton noted the value of articulating and representing graphically such links between actions (‘drivers’ or ‘lead’ indicators) and desired outcomes (‘lag’ indicators). They termed the representation process ‘strategy mapping’. The identification and effective management of such causal relationships is the anchor to the success of the ‘strategy scorecard’, and shows how assets can be deployed, results measured and resources managed to achieve desired strategic results. The strategy map is a general, logical and comprehensive architecture for describing the strategy framework. It is only when this is achieved that management can claim to understand the key drivers behind organisational performance and view the business model through a single lens.
Generation 2: Using balanced scorecard design to understand the business model through value propositions and the causal relationships between objectives.
Generation 3: Testing the business model by securing greater clarity between the assumed non-financial drivers of performance and cash flow.
Strategy mapping provides an opportunity to articulate the key strategies or initiatives that management intends to adopt to achieve the strategic objectives. The mapping process can be effective in closing the gap between the strategic vision/direction and the operational activities of the organisation – ensuring better execution of strategy.
Building the strategy map It is crucial that a balanced scorecard represents a chain of assumed cause and effect links between and within each scorecard perspective. For each performance measure it must be clear what the key performance indicator is, and how each is achieved. Building the strategy map involves the following steps:
Thus, the balanced scorecard design process is founded on the premise of strategy as a set of hypotheses about cause and effect. These hypotheses form the strategy for moving the organisation from its current position to where it wants to be. (Organisations can sometimes find it helpful to state this desired position by formulating a ‘destination statement’).
1. Clarifying the mission and strategic vision. 2. Specifying objectives in the scorecard areas necessary to realise this vision.
Importantly, having developed the scorecard and by using the associated performance metrics, the cause and effect relationships between actions and impacts are both explicit and testable. As such, it should be possible for a third party to understand an organisation’s strategy, and how this is to be achieved from an effective and well-constructed strategy map.
The over-riding contribution of the third-generation scorecard rests in the clarification and expression of the links between performance drivers and their impact on progress towards strategic success, conveyed through the strategy-mapping process. Simply, a strategy map charts the impacts of activities. Once maps have been constructed, linking actions and their impacts, operations can be managed to achieve desired outcomes. From the example of a strategy map opposite, it can be seen that the organisation’s mission is to improve shareholder value, and that this is achieved through the revenue growth and productivity strategies – objectives of the financial perspective.