
JOURNAL CHOA November2022 CHOA LEADS The New Climate Bargain Alberta Advances Multiple Carbon Storage Hubs Relative Permeability Expressions Part 1 Executive Summary Part 2 About Geothermal GEOTHERMAL ENERGY SERIES
Table of Contents CHOA.AB.CA /CANADIAN-HEAVY-OILASSOCIATION /CANADIANHEAVYOIL ASSOCIATION @CDN_CHOA +1 403 269 1755 GEOTHERMAL ENERGY SERIES Page 3 Message from the CHOA Journal Team Page 4 The New Climate Bargain Page 10 Alberta Advances Multiple Car Storage Hubs Page 22 Synopsis: Relative Permeability Expressions Better Suited for Simulation of Gravity Drainage Processes Page 32 Part 1 Executive Summary Page 42 Part 2 About Geothermal

A Message from the good people bringing you the CHOA JOURNAL
CHOA LEADS
CHOA’s JOURNAL is evolving with you, as we LEAD through the long-term energy transition together. A more digestible, more readable JOURNAL delivered as: a weekly eJOURNAL, highlighting the latest article (or two) by email and social media plus a full digital flipbook JOURNAL every month or two, for a reflective read - archived on the CHOA website, too.
All delivered in modern, easy-on-the-eyes layouts.
Always bringing you the technical and business information of interest to you right now.
This series of the JOURNAL is entitled, “CHOA LEADS”. CONNECT. SHARE. LEARN. LEAD.
3ICHOAJOURNAL-NOVEMBER2022
The New Climate Bargain
BY RBC ECONOMICS RESEARCH
Canada can still reach its 2050 Net Zero targets, but it may not be a linear journey.
CHOAJOURNAL NOVEMBER2022I4
Climate Change, Meet Energy Security
Russia’s invasion of Ukraine is a cataclysmic moment for global energy markets As governments and consumers grapple with energy shortages and high gas and power bills, climate change policies are being thrust into competition with energy security.
The old energy order is giving way to a new, disorderly one as Europe and Asia seek alternate supplies to replace Russian exports Moscow’s ploy to exploit Europe’s energy vulnerability will not be forgotten in a hurry, and has accelerated two contradictory responses: rapid decarbonization and a scramble to raise fossil fuel production at least in the short term.
The dichotomy underscores a hard truth: short of major additional action, oil and gas will likely remain critical and contentious energy sources for longer than some think.
How does higher output square with their ambitious emissions reduction plans?
If governments fail to balance climate action and energy security, will high energy costs and emissions erode public trust?

“The old energy order is giving way to a new, disorderly one … ”
5ICHOAJOURNAL NOVEMBER2022
This poses some critical questions for the West:
Canada can still reach its 2050 Net Zero targets, but it may not be a linear journey The Canadian government has called for more oil and gas production to help ease the global crisis in the short run, while maintaining a firm commitment to competitive and decarbonized oil and gas in the long run.
Our research shows both goals are within reach—but at significant cost Canada can still reach its 2050 Net Zero targets, but it may not be a linear journey. There isn’t a moment to lose. Policy action over the next 24 months must chart Canada’s climate-and-energy path to Net Zero by 2050.
CHOAJOURNAL NOVEMBER2022I6
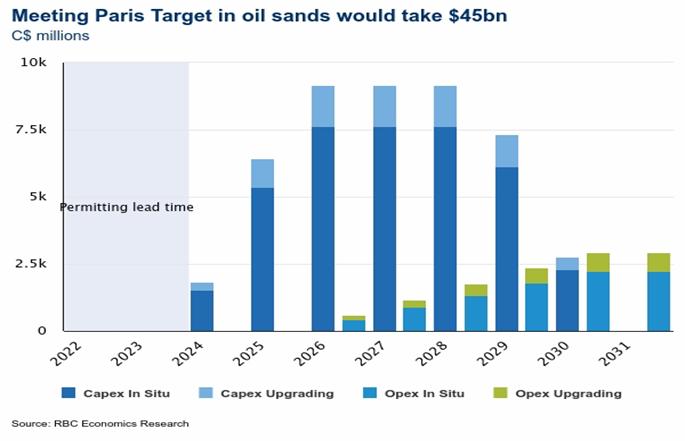
Meeting Paris Target in oil sands would take $45bn
Key Findings
Canada’s oil and gas sector can support near-term energy security while advancing climate action, but will need regulatory certainty and support at all levels of government.
Oil sands and conventional producers could raise production by up to 500,000 barrels per day from 2021 levels.
This could add 9 million tonnes of greenhouse gases per year, costing at least $1.5 billion annually to abate but bringing potential net benefits of $10.5 billion annually. Critically, if Canadian barrels displace those of other producers, there would be no additional global emissions.
Meeting climate targets despite new production will demand significant investment in methane reductions, as well as electrification and carbon capture across industries.

Cutting emissions 40% from current levels in the oil sands by 2030 will likely require $45 billion to $65 billion in capital spending between 2024 and 2030, peaking at about $9 billion per year mid-decade.
Full upstream decarbonization with carbon capture, utilization and storage (CCUS), a critical emissions reduction technology, will require oil prices averaging roughly US$50 WTI through 2050.
A deliberate approach to deploying decarbonization technology in the oil sands is needed to avoid over-investing in costly solutions. CCUS should be viewed as just one tool at Canada’s disposal.
Read Full Article 7ICHOAJOURNAL NOVEMBER2022

Carbon

Storage Hubs
happening with Alberta carbon hubs? Who’s who in the RFPP zoo?
and what’s “A-CO2”? CHOAJOURNAL NOVEMBER2022I10
MARTIN KING, RBN ENERGY, LLC Anything
Oh,
Capturing carbon dioxide (CO2) emissions from industrial and oil and gas activities is already a big challenge but having a safe, permanent place to store them is vital if the goal is to meet or exceed emission reduction targets To this end, Alberta, home to most of Canada’s oil and gas industry, including the vast oil sands, is steadily advancing plans to develop carbon sequestration hubs and underground reservoirs across the province in parallel with above ground CO2 capture plants and pipelines. In separate announcements this year, the province gave the go ahead to 25 projects to develop sequestration hubs and determine if they can achieve commercial viability. In today’s article, we consider Alberta’s latest efforts to push forward with its emissions capture and storage plans.
“
… this year, [Alberta] gave the go ahead to 25 projects to develop sequestration hubs and determine if they can achieve commercial viability.”estration has taken on added urgency.”
Large-scale CCS will likely be necessary for Alberta to meet its emissions reduction targets.
Alberta and Saskatchewan appear to have ample technical sequestration capacity.
A competitive process is in place for developing open-access carbon sequestration hubs.
Alberta has given the go-ahead to 25 carbon hub Request for Project Proposals.
11ICHOAJOURNAL NOVEMBER2022
There remains much debate about the cost, scalability and technical challenges of CCS on this scale.
Alberta has long been a leader in the production of hydrocarbons — and the emissions associated with them. Although there has been intensified focus on increasing production of oil and gas in light of the current North American and global focus on energy security, and in response to greatly improved prices for oil and gas, Canada’s producers and provincial regulatory agencies have also kept their eye on the ball in terms of advancing plans to reduce and capture anthropogenic CO2 (A CO2) emissions those associated with human activities. In the year or so since we last looked at this topic, Alberta has been advancing legislation and laying the groundwork for the development of carbon sequestration hubs through which A-CO2 would be injected deep into underground reservoirs where it would be permanently sequestered “forever and for always.” With the pressure being increased on the oil and gas sector by the Canadian federal government to meet emission-reduction targets by 2030, determining sites for sequestration has taken on added urgency.
“With the pressure being increased on the oil and gas sector by the Canadian federal government to meet emission-reduction targets by 2030, determining sites for sequestration has taken on added urgency.”
In Part 1 of this series, we undertook a high level review of the A CO2 emissions profile for Canada and its oil and natural gas industry In that discussion, we mentioned that Canada accounts for under 2% of global A CO2 emissions, a share which has been falling slowly over the past 20 years as emissions and the share of emissions from other major developing economies such as China have been growing steadily.
We also noted that even though Canada’s overall emissions profile has held relatively steady over the past two decades, decreases in some sectors of its economy have been offset by a rising share of emissions from the oil and gas sector, from around 20% in 2000 to near 27% in 2019, with a majority of that increase driven by emissions from Alberta’s oil sands. Finally, we discussed three project proposals put forward by major energy players that would capture and sequester emissions from the oil sands and other energy related activities.
CHOAJOURNAL NOVEMBER2022I12
“
… even though Canada’s overall emissions profile has held relatively steady over the past two decades, decreases in some sectors of its economy have been offset by a rising share of emissions from the oil and gas sector … ”
We moved past proposals in Part 2 by examining active and pending capture/sequestration projects in the oil and gas sector The first of these is the Weyburn Midale site in southern Saskatchewan, at which captured and injected A CO2 is used for enhanced oil recovery (EOR). In operation since the late 1990s, it remains one of the most successful carbon capture and sequestration (CCS) projects in the world, handling emissions from a synthetic fuels plant just across the U.S. Canada border in North Dakota, as well as a nearby coal fired power plant in southern Saskatchewan. Aspects of the use of A CO2 for EOR projects can be found in our The Air That I Breathe series Two other operating projects, Quest, operated by Shell Canada at its Scotford Upgrader, and the Alberta Carbon Trunkline (ACTL), which transports captured A CO2 for EOR operations in Alberta, continue to advance the goal of capturing an ever-increasing share of emissions in the province. Another Shell project in advanced planning is Polaris, which would capture additional emissions from its Scotford Upgrader as well as establish a larger carbon sequestration hub for use by third party emitters. Two other initiatives being advanced involve the production of blue hydrogen from natural gas, which would capture the emissions associated with the production process. Readers that want to learn more about the technologies, challenges, and economics of CCS should reference our Way Down in the Hole series.
Canada’s Standing in the World’s Emissions
There is certainly plenty to consider in terms of projects that capture A CO2, primarily in Alberta, but before we get to the all-important part of our discussion in terms of sequestration hubs, let’s update ourselves on Canada’s standing in terms of emissions since our discussion in Part 1.
13ICHOAJOURNAL NOVEMBER2022
In that prior analysis, we discussed emissions data by sector up to 2019 from Environment and Climate Change Canada (ECCC), which has since released 2020 figures and to which we have added our own estimates of 2021 emissions using data from the 2022 edition of the BP Statistical Review. A curious item that we did note was that ECCC has revised upward its greenhouse gas (GHG) emission estimates from 2005 onward compared to the dataset that we used one year ago, with all of the upward revisions being attributed to the oil and gas sector.
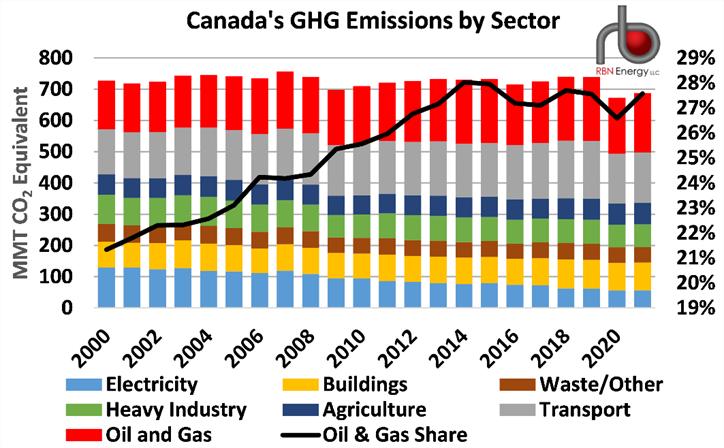
Canada’s total A CO2 equivalent (A CO2e) GHG emissions fell nearly 9% in 2020 to 673 million tonnes (MMT), in line with the reduced economic activity that was the hallmark of COVID lockdowns that year (height of the stacked columns in Figure 1). With recovery getting underway in 2021, total GHG emissions are estimated to have risen just over 2% to 687 MMT. The share of emissions from the oil and gas sector (solid black line) was around 28%, very close to the share it has held since 2013 (but higher than in last year’s dataset).
“
… in 2021, … the share of [Canada’s] emissions from the oil and gas sector was around 28%, very close to the share it has held since 2013 … ” Figure 1 Canada’s GHG Emissions by Sector Source: ECCC, BP, RBN
CHOAJOURNAL NOVEMBER2022I14
In terms of emissions from the oil and gas sector, after falling 12% in 2020 to 179 MMT, we estimate these rebounded by 6% to just under 190 MMT in 2021 as the sector recovered from the market devastation of 2020 (height of stacked columns in Figure 2). What is of note is that emissions from the oil sands are estimated to have risen by 7% in 2021 to their highest level on record at 86.5 MMT and constitute just under a 46% share of all the emissions from the oil and gas sector (solid red line). With crude oil output from oil sands upgrading and in-situ operations hitting record levels in 2021, these activities account for the bulk of the increase in emissions from oil and gas as well as their significant share in the sector’s total. Clearly, there appear to be plenty of emissions across the oil and gas sector in Alberta that could find a home deep underground via CCS.
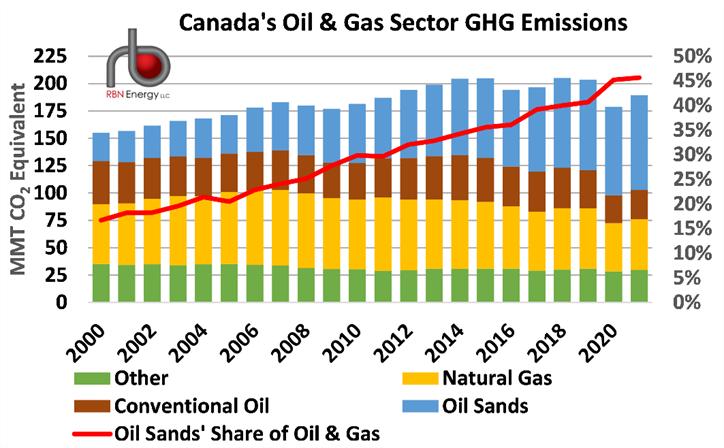
“Clearly, there appear to be plenty of emissions across the oil and gas sector in Alberta that could find a home deep underground via CCS.”
15ICHOAJOURNAL NOVEMBER2022
Figure 2: Canada’s Oil Gas Sector GHG Emissions. Source: ECCC, RBN
Progress on Alberta CCS Projects
Alberta is no stranger to CCS projects, especially for EOR operations Smallscale EOR has been under continuous development in Alberta since 1984, with two sites still operating to this day. An additional EOR project, Clive EOR in central Alberta, ramped up its operations in the past two years and receives its CO2 via the ACTL pipeline; however, all current CCS projects in Alberta, excluding the Weyburn Midale site in Saskatchewan, are injecting less than 3 MMT/year of CO2. With a sequestration challenge that could be in excess of 60 to 80 MMT/year by 2030, depending on how rigorously future emissionreduction targets are imposed, there is a lot more work that needs to be done to identify sequestration sites and hubs through which CO2 from various emitters can be injected.
To that end, the Alberta provincial government has been developing legislation and identifying potential sequestration sites across the province. Sequestration rights are being established through a competitive process whose goal is the development of sequestration hubs and underground pore spaces where CO2 can be permanently stored. The hubs are intended to be open access for third party emitters and gather CO2 from a variety of local or regional industrial sources
“Sequestration rights are being established through a competitive process whose goal is the development of sequestration hubs … intended to be open access for third-party emitters and gather CO2 from a variety of local or regional industrial sources.”
CHOAJOURNAL NOVEMBER2022I16
Alberta Requests for Carbon Hub Full Project Proposals (RFPPs)
In the fall of 2021, the government gathered expressions of interest from companies intent on developing and operating sequestration hubs. Given extensive interest from that initial exercise, the government went to the next step, developing a Request for Full Project Proposals (RFPPs) in which successful companies would ultimately be granted a carbon sequestration agreement Successful candidates would have the right to drill wells, evaluate geologic zones, and monitor any injected CO2, while providing a just and reasonable cost recovery structure for the development and management of such hubs, including open access to potential emitters for injection.
Six RFPPs were announced by the government in March 2022 (Figure 3) that would allow the companies to further explore the development of carbon hubs in the Alberta Heartland Region, just outside the provincial capital of Edmonton, home to numerous large emitters in the form of fertilizer, cement, petrochemical, and refining operations That does not guarantee that these projects will go ahead but sets the stage for further development under the purview of the provincial government. Based on posted data for these proposals, we estimate that the six could have a combined sequestration capacity of at least 60 MMT/year (red box in Figure 3) Such a figure would capture just over 23% of Alberta’s 2020 emissions of 257 MMT, as reported by ECCC. These projects would not cover most oil and gas activities but could provide a base for sequestration in the region into which those activities could be tied.
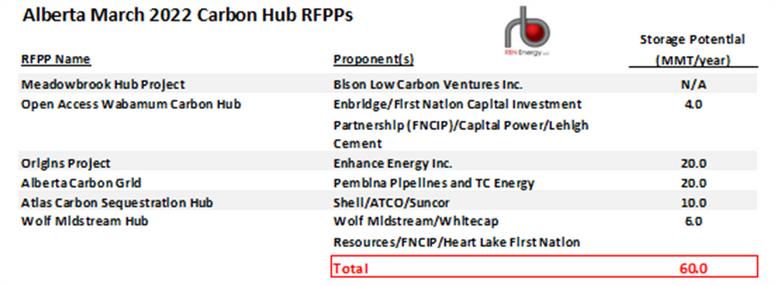 Figure 3. Alberta March 2022 Carbon Hub RFPPs. Source: Government of Alberta
17ICHOAJOURNAL NOVEMBER2022
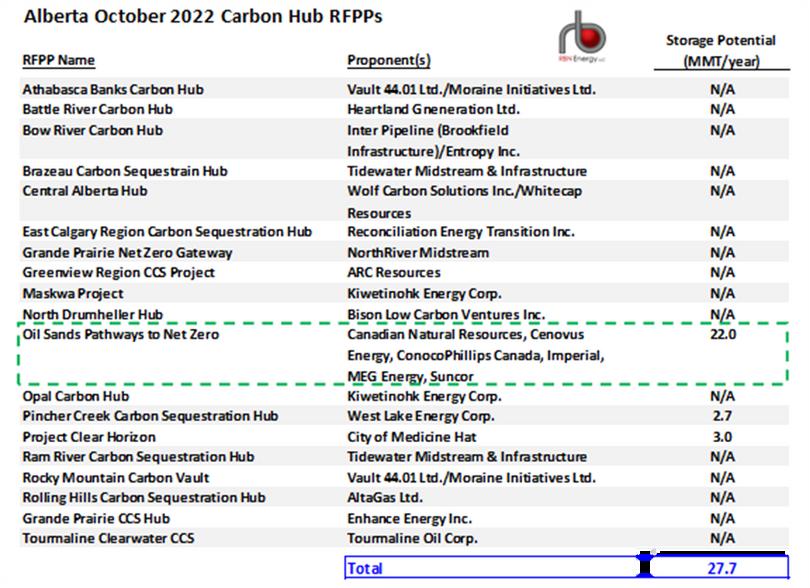
The government announced an additional 19 RFPPs (Figure 4) in early October that would be considered for further development and cover other regions of the province outside its industrial heartland. Though details are scant for many of these projects, they suggest at least 27.7 MMT/year of sequestration potential (blue box in Figure 4) That potential will increase as additional details emerge for other projects. What is noteworthy is that the much discussed Oil Sands Pathways to Net Zero project (dashed green box) was chosen. It is being strongly pursued by six of Alberta’s oil sands producers, which account for 95% of the production from the oil sands and the majority of the emissions. At 22 MMT/year, this would cover roughly a quarter of the 2021 oil sands emissions we mentioned earlier, although other projects will likely be proposed and developed
“The much-discussed Oil Sands Pathways to Net Zero project … is being strongly pursued by six of Alberta’s oil sands producers, which account for 95% of the production from the oil sands and the majority of the emissions.”
CHOAJOURNAL NOVEMBER2022I18
Figure 4 Alberta October 2022 Carbon Hub RFPPs Source: Government of Alberta
Of course, not all of these projects from the March or October announcements will reach the finish line as the onus is on the companies to demonstrate that their concept will work and meet the guidelines established by the province That said, there is much debate about cost, scalability, and the sheer technical challenge of capturing so much CO2, as the province and the oil and gas sector are feeling the collective pressure to have CCS projects up and running sooner than later, given the federal government’s current view that emissions from the oil and gas sector need to be reduced 42% (85.5 MMT) by 2030 versus 2019 emission levels. As to whether this magnitude of emission capture in such a short timeline can be met remains an open question and vigorous discussions continue among the province, affected companies, and the federal government as to the best means to implement or modify such a policy.
Beyond Carbon Hub Proposals
The development of carbon hubs is a cornerstone of Alberta’s emissionreduction goals, but the province is also moving ahead on other fronts. In July, it announced grants totalling C$40 million (US$29 million) intended to advance CCS technologies under its Carbon Capture Kickstart program, part of the larger Emissions Reduction Alberta initiative. A great deal of other government funded research is being pursued through the Alberta Innovates program.
Vast CCS Potential in Alberta and Saskatchewan
Being an oil and gas producing region, Alberta does have geology on its side based on data from the North American Carbon Storage Atlas. Numerous deep geologic zones have been identified across the province which appear very suitable for long term sequestration, with one zone (Basal Cambrian Sands) estimated to have the potential to store up to 19,200 MT of CO2. Based on the province’s 2020 emissions of 257 MMT we mentioned earlier, this would represent about 74 years of emissions storage and nearly 150 years of storage if only half of those emissions were captured. The storage potential for the same zone in neighboring Saskatchewan is measured in thousands of years. That might not be quite forever and for always, but it’s pretty close.
This article was authored by Martin King and originally published by RBN Energy, LLC.
Read Original Article 19ICHOAJOURNAL NOVEMBER2022

Connect.Share.Learn.Lead. September October November December 09 10 11 12 May June July August 05 06 07 08 January February March April 01 02 03 04 SluggingitOut(SIO) CHOAAGM StampedeSTOMP FORE!CHOA GolfInvitational WinterBonspiel CHOAJournal CHOAJournal CHOAJournal CHOAJournal CHOAJournal CHOAJournal CHOALEARNS#1 StrategySpeaker Series CHOALEARNS#2 StrategySpeaker Series 24thWPC CHOALEARNS#7 StrategySpeaker Series CHOALEARNS#3 TechnicalSpeaker Series CHOALEARNS#6 TechnicalSpeaker Series CHOALEARNS#8 TechnicalSpeaker Series CHOALEARNS#5 TechnicalSpeaker Series CHOALEARNS#4 TechnicalSpeaker Series www.choa.ab.ca 2023 CHOA EVENTS CHOACONNECTS Visit our website for updates on 2023 CHOA Events

CEPTING CONTENT PROPOSALS FOR 2023 ISSUES OF THE JOURNAL ENJOY THE JOURNAL? LIKE TO PUBLISH THE JOURNAL? Business Articles Opinion Pieces Tech Flashes Industry Briefs Full Technical Articles (peer-reviewed) Contactusnowatoffice@choa.ab.ca CONNECT.SHARE.LEARN.LEAD.
BY SUBODH GUPTA
Synopsis of Recent Papers
(SPE205883, SPE210445) Relative Permeability Expressions Better Suited for Simulation of Gravity Drainage Processes CHOAJOURNAL NOVEMBER2022I22
When my esteemed colleagues at the editorial committee of CHOA Journal asked me to provide a synopsis of my recent papers on relative permeability, developed in the quest of proper simulation of SAGD, and other gravity drainage processes, I gladly accepted. While the actual papers are publicly available (see references), this brief writeup should serve to tell what these papers are about.

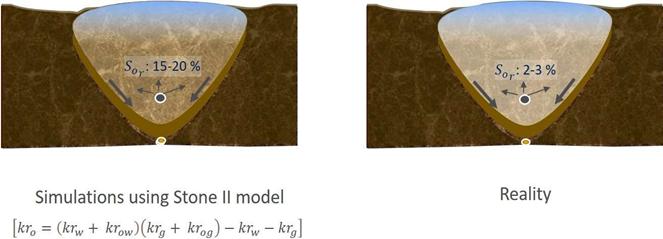
Motivation for these papers has been to address issues with the simulation of gravity drainage processes such as SAGD or SAP. (Gupta S., 2021) deals with and addresses a problem in much used Stones II model for the simulation of SAGD. In reality, the residual oil saturation in SAGD chamber from retrieved cores decreases with time and is found to be as low as 1-2 % But application of Stone II predicts Sor settling down at around 20%.
Figure 1. Simulation with Stone-II vs. reality
While use of the new fundamentals-based rel perms presented last year fixed that problem (Figure 1), it did not address another issue related to the gravity drainage processes the counter current movement of gas and liquids and the resultant slow-down of each on account of mutually acting interfacial shear stress. Counter current movement essentially comes into the picture on account of gravity in the potential gradient term ( ). In absence of gravity, both the gas and the liquids have the same driving force (��P ⁄����).
“If proper rel. perms are not used … a history match of the actual slower rise of steam chamber will falsely indicate existence of impermeable barriers even … where none really exist.”
23ICHOAJOURNAL NOVEMBER2022
If proper rel. perms are not used in simulation of SAGD or SAP, a history match of the actual slower rise of steam chamber will falsely indicate existence of impermeable barriers even in perfectly homogeneous reservoirs, where none really exist (Figure 2).
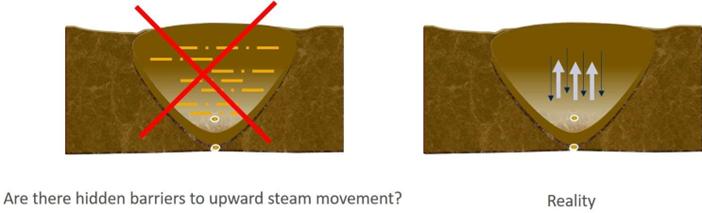
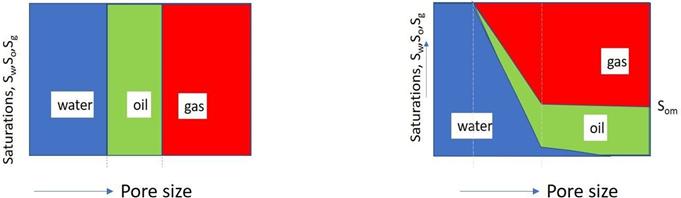
Figure 2. Simulation with gravity-free vs. gravity incorporated rel. perms
This issue is taken up and resolved with the development of more comprehensive rel. perms incorporating gravity in (Gupta S., 2022). As before the porous medium is approximated by a bundle of tubes having a size distribution. This is the same approach taken by the classical researchers. The difference here comes from the fact as to how the fluid saturations are distributed in the pores of difference size and based on recent insights from X ray tomography imaging published by Alhosani (2021). In Figure 3, the left diagram depicts the classical view, and the right one incorporating the new insight In the classical approach it was assumed the wetting phase occupies the smallest pores, gas phase the largest pores and the intermediate phase the intermediate sized pores.
Figure 3. Modern insight into pore occupancy order
CHOAJOURNAL NOVEMBER2022I24
The X ray imaging from Alhouseni et al. clearly shows that all pores are accessible to all phases, with saturation in the smallest pores dominated by wetting phase, in the largest pores by gas, and in the intermediate pores by the intermediate phase. Thus, in most pores all three phases co exist and co flow. This necessitates development of multi phase flow equations in tubular channels as opposed to the use of Poeseuille’s equation classically, justified as in any given pore size only the flow of a single phase occurred.
This difference also naturally explains why relative permeability expressions should be temperature dependent. When these expressions are used in conjunction with a pore-size distribution and tortuosity factor (to account for the difference in linear tubular channels vs. tortuous flow in porous media) the resultant rel. perm equations are given as shown here (Figure 4).
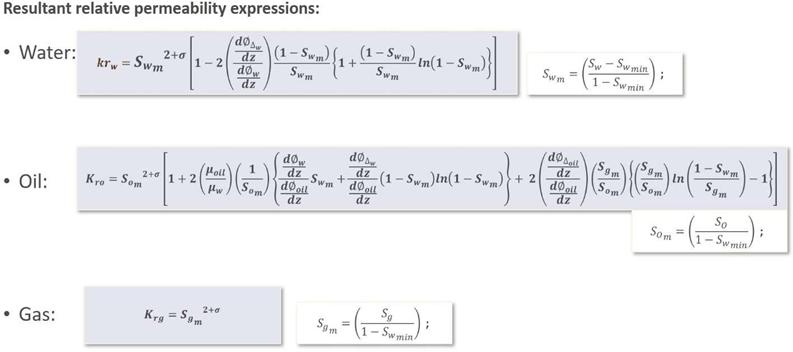
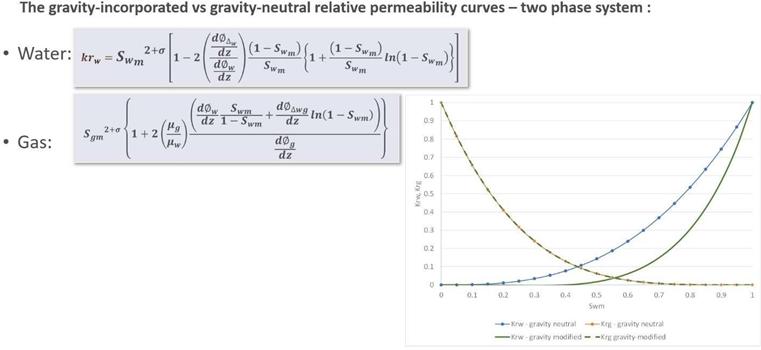
Figure 4. New gravity incorporated rel. perms
“
…
X-ray imaging … clearly shows that all pores are accessible to all phases, with saturation in the smallest pores dominated by wetting phase, in the largest pores by gas, and in the intermediate pores by the intermediate phase. Thus, in most pores all three phases co-exist and co-flow.”
25ICHOAJOURNAL NOVEMBER2022
They are evidently more involved compared to gravity-free equations presented in the 2021 paper as they also have the ratios of various potential gradient terms (with specific definition of each in the paper), in addition to the expected functions of various phase saturations.

When angle of tilt in flow is set to zero or when value of gravity is set to zero, these equations revert back to the equations presented earlier. In this way the model presented here is internally consistent, and more comprehensive than the earlier model.
To graphically visualize the kind of difference gravity and the resultant counter current flow can introduce in rel. perms, some reasonable values are fed in an example with just two phases gas and water. For illustrative purposes the expressions for two phases, gas – water system and the 3-phase system are derived separately in the paper and as a consistency check when saturation for one of the phases is set to zero, the 3 phase expressions collapse to the 2-phase one.
In the presented graph (Figure 5), with the incorporation of gravity, the water rel perm shifts downward But the gas rel perm does not change perceptibly This is reasonable to expect as the gravity dependent factoring becomes negligible due to viscosity of gases being 2 orders of magnitude smaller than that of liquid
Figure 5. Graphical visuation of changes: gravity free vs. gravity incorporated rel. perms
CHOAJOURNAL NOVEMBER2022I26
In conclusion, (Gupta S., 2022) extends the derivation contained in (Gupta S., 2021) and starting with proper force balance in a tilted or vertical flow scenario, presents gravity incorporated relative permeabilities. These rel. perm expressions are more comprehensive and revert to the earlier expressions when gravity dependent term vanishes. This also implies that they are anisotropic, being different for horizontal flow vs. the vertical flow. When used, these rel. perms show a slow-down of draining liquids in a counter current flow situation. In simulation of SAGD, they show the expected slow down of chamber rise even in a homogeneous reservoir which otherwise might give a false impression of being on account of permeability barriers
References
Abdulla Alhosani· Branko Bijeljic, M. J. (2021). Pore-Scale Imaging and Analysis of Wettability Order, Trapping and Displacement in Three-Phase Flow in Porous Media with Various Wettabilities. Transport in Porous Media. doi:10.1007/s11242-021-01595-1
Gupta, Subodh.(2021). Issue with Stone-II Three Phase Permeability Model, and A Novel Robust Fundamentals-Based Alternative to It. Paper presented at the SPE Annual Technical Conference and Exhibition. Dubai, UAE: SPE. (SPE205883)
Gupta, Subodh. (2022) "Physics-Based 3-Phase Relative Permeability for Gas-Liquid Counter-Current Flow." Paper presented at the SPE Annual Technical Conference and Exhibition, Houston, Texas, USA: SPE. (SPE210445)
“ … gravity-incorporated relative permeabilities [equations are presented] … that show a slow-down of draining liquids in a counter current flow situation … which otherwise might give a false impression of being on account of permeability barriers.”
27ICHOAJOURNAL NOVEMBER2022
CHOA PLATINUM SPONSORS

CHOA GOLD SPONSORS


CHOA SILVER SPONSORS
CHOA BRONZE SPONSORS
GEOTHERMAL ENERGY SERIES O&G EXPERTISE UNLOCKING THE EARTH’S ENERGY POTENTIAL: EXECUTIVE SUMMARY AUTHORS: Tim Monachello, CFA, Analyst, Managing Director, ATB Capital Markets Patrick Tang, CFA, CPA, Associate, ATB Capital Markets CHOAJOURNAL NOVEMBER2022I32
This article is the first in a series on how Geothermal Energy can impact the energy industry and net zero transition. The articles have been developed from a thematic report issued by ATB Capital Markets earlier this year.
This first article is an executive summary – the next articles in the series will address Conventional Geothermal, Enhanced Geothermal, Opportunities for the Oil and Gas Service Sector, Economic and Strategic Factors, and the Regional Landscape for Geothermal Development.
EXECUTIVE SUMMARY
Geothermal Has the Potential to be a Game Changer
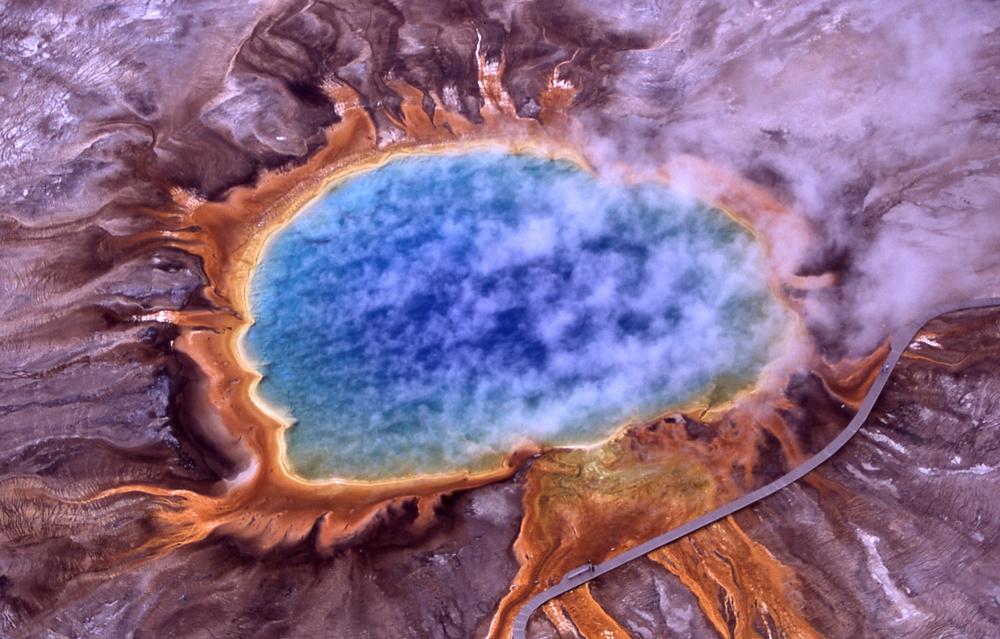
The heat generated in the core of the Earth is an enormous source of renewable power enough to power the globe many times over. While historical geothermal developments have been largely limited to high temperature hydrothermal resources, typically situated at or near tectonic fault lines where the Earth’s crust is thinnest, new technologies are being developed that could significantly increase the viability of geothermal power generation in lower temperature resource areas and even in areas without natural aquifers. Ultimately, we believe innovations over the coming decades could make geothermal energy production viable in nearly any location on Earth and widely competitive with other forms of renewable and non-renewable energy while also having the advantages of being zero emission, baseload, and having the optionality of both distributed and centralized energy production.
“
… it is conceivable that geothermal could be among the fastest-growing sources of energy globally and could grow to become a significant contributor to the global energy mix.”
Ultimately, we believe step change innovations in geothermal have the potential to make geothermal among the preferred forms of power generation in this blue sky scenario, it is conceivable that geothermal could be among the fastest growing sources of energy globally and could grow to become a significant contributor to the global energy mix
33ICHOAJOURNAL NOVEMBER2022
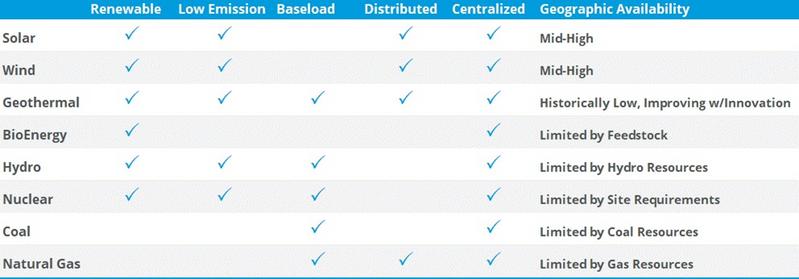
Geothermal vs. Other Energy Sources
Figure 1 Geothermal vs. Other Energy Sources
Source: ATB Capital Markets Inc.
Innovation Could Unlock Geothermal Power as a Core Renewable Energy Source Around the Globe
Geothermal energy has been a relatively overlooked source of renewable power over recent decades, as the competitiveness of commercial projects has largely been limited by the scarcity of high quality hydrothermal resource. These resources have generally been concentrated in areas with strong flow properties and where the Earth’s crust is thinner and therefore hottergenerally along tectonic plate boundaries. That said, new innovations are emerging that have the potential to 1) improve returns from lower-temperature resources, 2) access higher temperature resources that are ubiquitously present at deeper intervals, and 3) reduce the flow requirements of geothermal resources Overall, these innovations have the potential to make geothermal a competitive and viable renewable energy source around the globe. Within this report, we highlight various innovations being pursued to advance the state of geothermal power generation projects, and we include various case studies highlighting interesting projects and technologies.
CHOAJOURNAL NOVEMBER2022I34
35ICHOAJOURNAL NOVEMBER2022
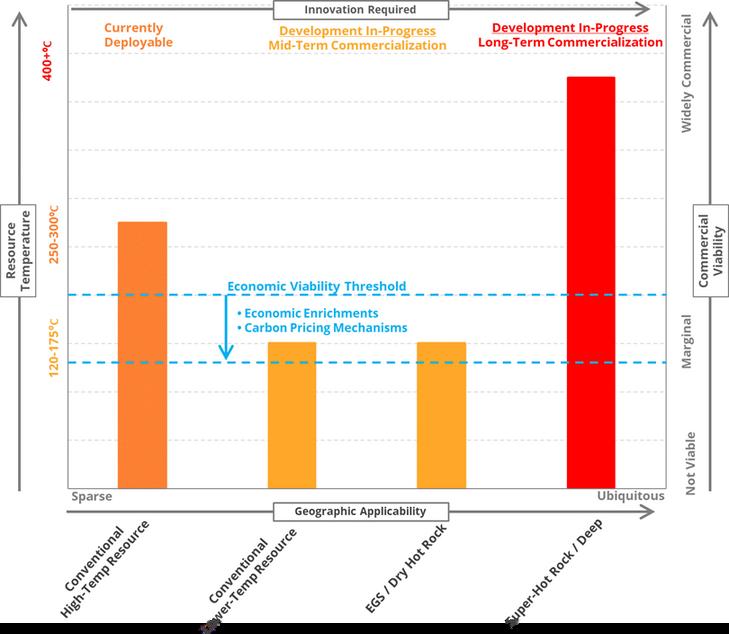
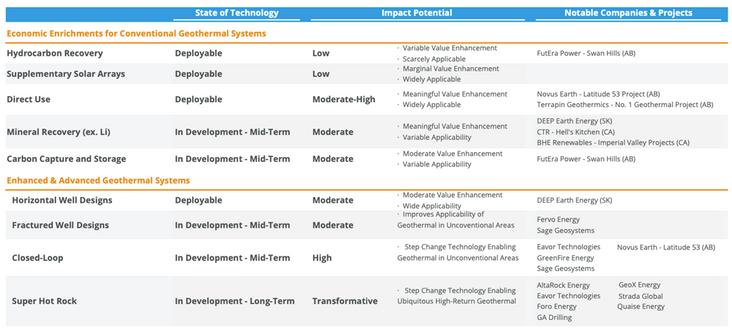
Innovation Could Make Geothermal Widely Commercial and Geographically Applicable Figure 2 Innovation Could Make Geothermal Widely Commercial and Geographically Applicable Source: ATB Capital Markets Inc.
Carbon Pricing is Critical to the Growth of the Geothermal Industry
Historically, the growth of geothermal has been limited by the scarcity of hightemperature hydrothermal resources that can generate high enough returns to be economic at a commercial level. Economic returns from lower temperature resources have generally been too low to incentivize capital Increasingly, carbon pricing mechanisms (and other grants and subsidies) that meaningfully increase the rate of return for geothermal developments and provide an opportunity to develop lower-temperature, more widely available projects are being introduced. Many new conventional projects (utilizing traditional geothermal technologies) are being proposed in regions where temperatures would have historically been too low to economically develop Many of these projects are seeing much stronger return potential through the addition of revenue streams from carbon pricing mechanisms and often through one or more additional value enhancements (i e , direct heat sales, mineral extraction, etc.). For context, we believe high-quality conventional hydrothermal projects often earn returns in the high single digits to mid teens (excluding carbon pricing), while certain lower-temperature projects are targeting returns in the low to mid teens when including carbon-related revenue streams. Specifically, we highlight Terrapin’s No.1 Geothermal project being pursued in Alberta our scenario analysis suggests its returns could increase from roughly 14% 16% to 20%-25% based on the Canadian federal government’s schedule to increase the price of carbon to $170/tCO2e by 2030.
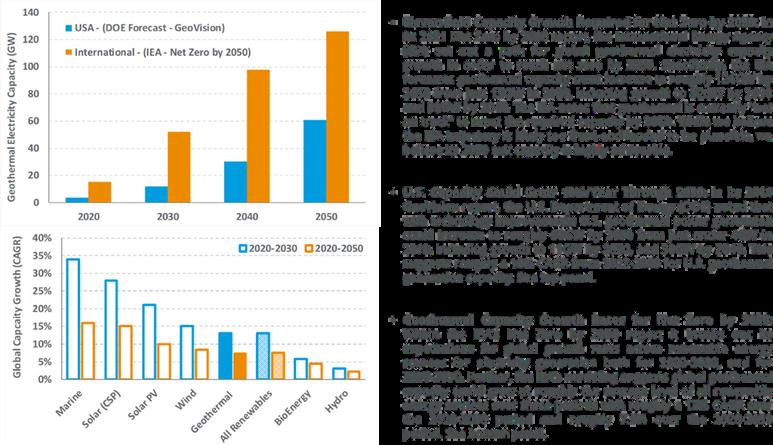
Geothermal energy is a source of renewable, zero Scope 1 and 2 emissions power. The IEA estimates that to achieve net zero by 2050, geothermal energy capacity will need to grow at a CAGR of roughly 13% from 2021 to 2030 (roughly 3.4 GW/year), representing roughly a 250% increase in global geothermal capacity from roughly 15 GW in 2020 to roughly 52 GW by 2030.
Zero
2050
Significant Geothermal Capacity Growth CHOAJOURNAL NOVEMBER2022I36
Net
by
Will Require
Longer term, the IEA’s modeling suggests geothermal capacity is required to grow to roughly 126 GW by 2050, representing roughly a 7% CAGR in order to meet its net zero target Further, the U S Department of Energy estimated that US geothermal electricity capacity alone could rise to roughly 60 GW by 2050 based on geothermal innovations, representing roughly a 10% CAGR from 2022 to 2050.
“Geothermal
Geothermal Likely to be Meaningful Opportunity for Energy Services Companies
energy is a source of renewable, zero Scope 1 and 2 emissions power.”
Figure 3 – IEA and US DOE Expect Significant Geothermal Capacity Growth through 2050
energy development leverages the billions of dollars invested in upstream energy R&D over recent decades to develop advanced well designs and drilling techniques. In our view, the energy sector’s involvement in geothermal
a significant catalyst to increase the pace of geothermal innovation, providing both capital and expertise, and 2) offers a 37ICHOAJOURNAL NOVEMBER2022
Source: International Energy Agency, US Department of Energy, ATB Capital Markets Inc
Geothermal
represents 1)
sizable opportunity for energy services companies to benefit from the growth in geothermal activity over time. Within this report, we present three scenarios for the pace of geothermal power generation growth through 2050. Scenario 1 is based on the IEA’s prescribed path of geothermal electric generation capacity within its Net Zero by 2050 report (left panel of Figure 4), with geothermal electricity capacity growing from roughly 15 GW in 2020 to 126 GW by 2050. Scenario 2 is based on a more progressive trajectory to 126 GW of global electricity capacity in 2050, which we believe is more realistic given the pace of innovation and our understanding of geothermal activity today (middle panel of Figure 4). Scenario 3 is based on step change innovations being commercialized and geothermal electricity capacity growing to roughly 1.0% (roughly 334 GW) of the IEA’s forecast global electricity capacity by 2050. We believe Scenarios 2 and 3 are the most realistic scenarios. Scenario 2 suggests the upstream market for geothermal well development could grow to roughly $5 bn $10 bn per year globally over the 2031 2050 period, representing demand for roughly 70 75 rigs. Based on the advancement of step-change innovations, such as deep closed-loop geothermal and super-hot rock geothermal, we believe geothermal could reasonably grow to be 1.0% of global electricity capacity; in this scenario, we estimate the global upstream market size could expand to roughly $18 bn-$32 bn per year globally over the 2031 2050 period, representing demand for roughly 240 250 rigs. For context, we believe there are roughly 150 250 geothermal wells likely to be drilled globally in 2022, representing demand for roughly 10-20 rigs and representing an upstream global market size of roughly $1.0 bn $2.0 bn (excluding facilities and related infrastructure).
CHOAJOURNAL NOVEMBER2022I38
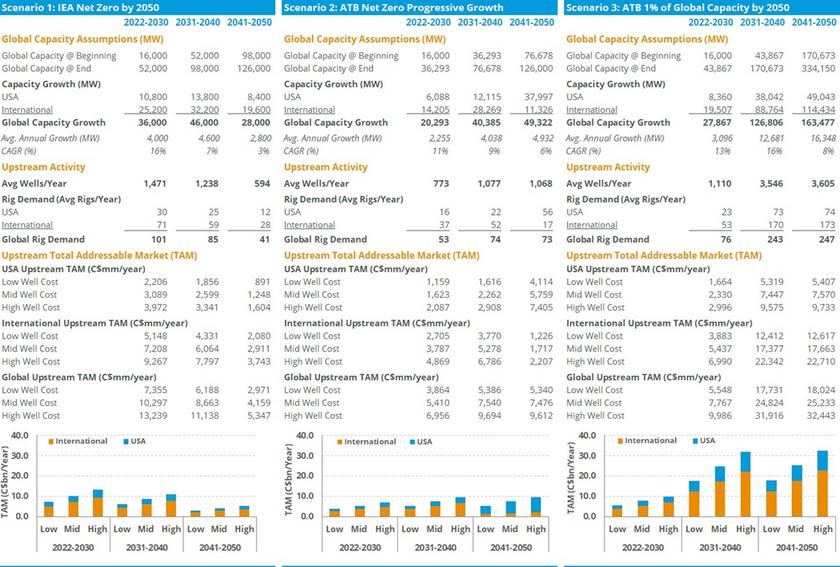
Figure 4 Scenario Analysis: Estimated Global Geothermal Market Size for Upstream Energy Services through 2050
Source: ATB Capital Markets Inc
39ICHOAJOURNAL NOVEMBER2022
Scenario Analysis: Global Geothermal Market Size for Upstream Energy Services through 2050
Geothermal Remains a Peripheral Opportunity, but Energy Services Companies are Gaining Exposure
Energy services companies are increasingly announcing strategic investments in geothermal companies, and many energy services companies have direct exposure to geothermal activity through existing business units
While we believe much of the upstream energy services industry would benefit from a build-out of geothermal capacity given inherent increased demand for wells to be drilled, we believe contract drillers and drilling oriented services lines have the most exposure.
“Now is the time to invest in innovative and bold geothermal solutions that have the potential to unlock terawatts of clean, renewable and reliable energy on a truly global scale. Given the expected sharp growth in global energy consumption over the next decades, the world will require an even sharper growth in sustainable energy supply. I am convinced that geothermal energy will be a key contributor to the necessary increase in clean energy generation.” -
placeyouradhere Contact us for details office@choa.ab.ca CHOAJOURNAL NOVEMBER2022I40


GEOTHERMAL ENERGY SERIES O&G EXPERTISE UNLOCKING THE EARTH’S ENERGY POTENTIAL: ABOUT GEOTHERMAL AUTHORS: Tim Monachello, CFA, Analyst, Managing Director, ATB Capital Markets Patrick Tang, CFA, CPA, Associate, ATB Capital Markets CHOAJOURNAL NOVEMBER2022I42
About Geothermal
Geothermal energy is ubiquitous around the globe; it is generated from the decay of radioactive isotopes in the Earth’s core, creating temperatures in excess of 5,000°C This heat radiates through the mantle to the Earth’s crust where it can be harnessed for generating electricity or used directly for heating. The aggregate amount of energy from geothermal sources is estimated to be 50,000 times the total energy from oil and coal reserves globally (International Renewable Energy Agency, 2017).
Until now, the substantial majority of geothermal development has been in the form of wells drilled into underground formations that produce heated brine (water present in the reservoir), which can then be used to produce electricity using heat-to-power technologies, with low-grade or residual heat utilized for direct use heating applications. While not a focus of this report, geothermal energy is also used in ‘heat pump’ applications, which circulate fluid in a shallow closed loop to harness geothermal heat or facilitate cooling in smallerscale applications.
“Geothermal energy has significant advantages over other forms of power. Most importantly, geothermal can be reliably used as a source of renewable baseload electricity.”
Geothermal energy has significant advantages over other forms of power. Most importantly, geothermal can be reliably used as a source of renewable baseload electricity Its capacity factor is above all other renewable sources, meaning it can consistently meet demand on the grid without any major intermittency. For certain designs, geothermal can also be load following if geothermal flows are halted when other renewables are generating, and restarted after absorbing more thermal energy when other renewables are offline. Moreover, geothermal plants are generally more productive in the winter when wind and solar are disrupted more frequently, making geothermal a suitable complement to these other technologies. Beyond this, geothermal also produces no meaningful emissions and often has a small surface footprint with minimal environmental disruption beyond the construction phase.
43ICHOAJOURNAL NOVEMBER2022
Regarding these latter points on footprint and disruption, these are often criticisms of wind, solar, and hydro development that can be a damper on land negotiations, which can often delay or halt development altogether. Also, geothermal does not produce waste beyond initial construction, which is an advantage over nuclear power plants
“ …
geothermal developments have been sparse over recent decades, largely because projects with conventional geothermal technologies have only been proven to be economic in regions where there are naturally high temperature geothermal resources at relatively low depths … ”
While the advantages of geothermal are promising, geothermal developments have been sparse over recent decades, largely because projects with conventional geothermal technologies have only been proven to be economic in regions where there are naturally high temperature geothermal resources at relatively low depths these tend to be near volcanically active regions or in regions near tectonic plate boundaries. That said, enhanced geothermal systems (EGS) are being developed that could ultimately improve the economics of lower temperature resources, which could significantly increase the viability of geothermal developments around the globe.

CHOAJOURNAL NOVEMBER2022I44
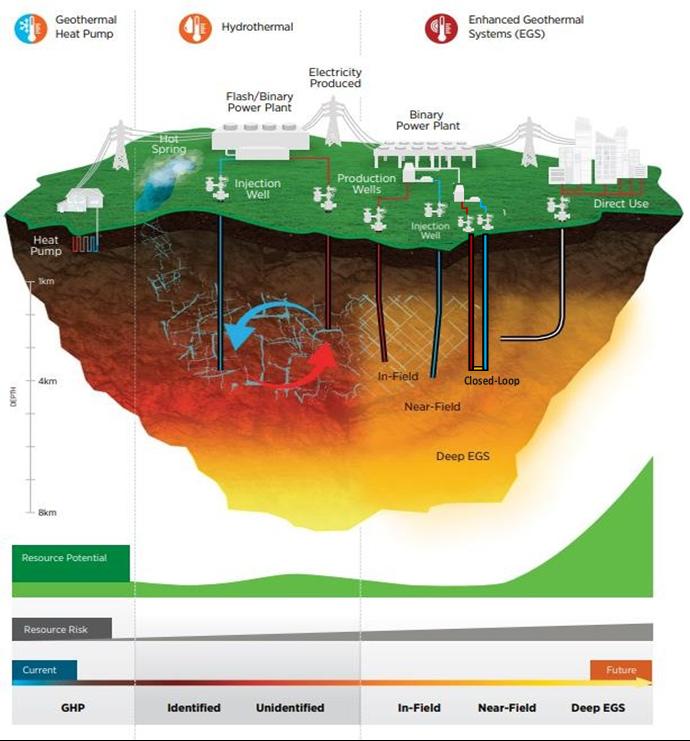 Figure 5 – Geothermal Innovation Could Unlock the “Holy Grail” of Renewable Resources
Source: US Department of Energy, ATB Capital Markets Inc. 45ICHOAJOURNAL NOVEMBER2022
Geothermal Innovation Could Unlock the “Holy Grail” of Renewable Resources
Conventional Geothermal Systems (Hydrothermal):
Geothermal developments have historically focused on known hydrothermal reservoirs. The scarcity of these resources has limited geothermal development.
Conventional Systems are Being Enriched: While not shown in the figure, conventional hydrothermal projects are finding new ways to improve returns, through supplementary revenue streams and carbon pricing mechanisms. These revenue enhancements are reducing the resource quality constraints for projects, thereby making lower temperature resource areas feasible.
Enhanced Geothermal Systems; Deeper, Hotter, Dryer, Cheaper: New
technologies are being developed that could significantly improve the economic viability of geothermal power generation outside of conventional hydrothermal resource areas. These innovations are generally looking to 1) cost effectively drill geothermal wells deeper where higher temperatures are present, 2) improve reservoir characteristics for hot rock resources where geology doesn’t support sufficient flow for conventional geothermal power generation, and 3) remove the requirement to produce and inject reservoir water all together (closed loop).
Step Change Technologies: Dubbed as the ‘holy grail’ of geothermal innovations is the ability to drill ultra deep into the Earth’s crust. At vertical depths greater than roughly 7 km, geothermal temperatures are generally in the 120 200°C range, hot enough to justify commercial development. At depths 10 20 km, temperatures across the globe are generally in the 200 400°C range, hot enough to make geothermal power generation widely commercially competitive with current sources of energy, both renewable and non renewable.
Geothermal Power Generation
For electricity generation, the majority of geothermal power plants have significant similarities. Most designs rely on produced brine from an underground aquifer This liquid is brought to the surface, where heat and temperature are controlled to drive a phase change to gas, either directly from the liquid brine or from the liquid phase of a working fluid in a binary cycle design (using a heat exchanger)
CHOAJOURNAL NOVEMBER2022I46
The expansion of the fluid provides mechanical energy for turning a turbine After the produced brine is no longer at high enough temperatures for power generation, it is pumped back into the ground through an injection well, which exerts a parasitic load on the system as the pumps draw power. Dry steam plants, which are less common today, are different in that the produced fluid is generally a ready use steam that can be directly passed through the turbine and released to the atmosphere, with no associated parasitic load. Geothermal heat is most commonly utilized in dry steam power plants, flash steam power plants, or binary cycle power plants.
Geothermal Power Plant Designs
Dry steam power plant: Dry steam power plants directly utilize sources of steam or hydrothermal fluids, which are generally geysers that exist near volcanoes. The steam is captured at the source and flowed through a turbine to drive a generator to produce electricity, then the steam is released to the atmosphere. These types of power plants are less common today but were the first design used for power generation.
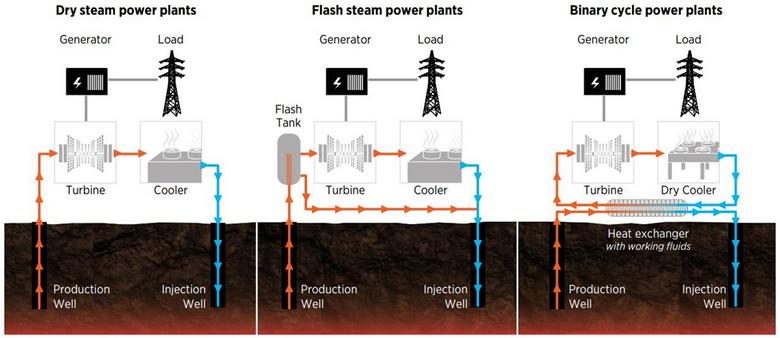 Figure 6 Geothermal Power Plant Designs
47ICHOAJOURNAL NOVEMBER2022
Source: U.S. Department of Energy
Flash steam power plant: Flash steam power plants are the most commonly used design. To generate electricity, these installations pump extremely hot fluids at temperatures typically above 180°C and under high pressure from geothermal wells into low-pressure flash tanks. Under these conditions, the fluids rapidly vaporize to gas, which is used to turn a turbine. The vapor is then pumped back into the ground through an injection well, where it will once again absorb heat and build up pressure.
Binary cycle power plant: To utilize lower temperature fluids, binary cycle power plants use a secondary liquid with a boiling point below that of water to turn the turbine. These liquids (“working fluids”) are typically hydrocarbons (e.g., isobutane) or organic compounds (e.g., hydrofluoroolefins). Moderate to high temperature fluids are pumped from beneath the Earth’s surface into a heat exchanger, where the working fluid absorbs the heat and subsequently flashes to vapour, driving a turbine that generates electricity. This process is commonly known as an organic Rankine cycle (“ORC”).
The U.S. Energy Information Administration (EIA) commissioned a capital cost study, published within its 2020 Annual Energy Outlook report, that compared numerous utility-scale electric power generating technologies, including binary cycle geothermal power plants. It found that a 5.0 MW binary cycle geothermal power plant had a capital cost of roughly US$2,500/kW, which ranked in the middle of other power-generation technologies While its fixed costs were among the highest of any competing technology, at roughly US$129/kW year, its variable operating and maintenance costs were among the lowest at $1 16/MWh We note that binary cycle power plants are non-emitting sources of power, including no CO2, SOX, or NOX emissions (excluding Scope 3). This analysis, however, did not include the costs for geothermal well drilling. See Appendix A for a detailed overview of comparative capital and operating costs
Combined Cycle Power Plants: Ormat has developed and patented a “Geothermal Combined Cycle Power Plant” where steam produces power in an initial backpressure steam turbine and then produces additional power as it condenses in the vaporizer of a binary power plant.
CHOAJOURNAL NOVEMBER2022I48
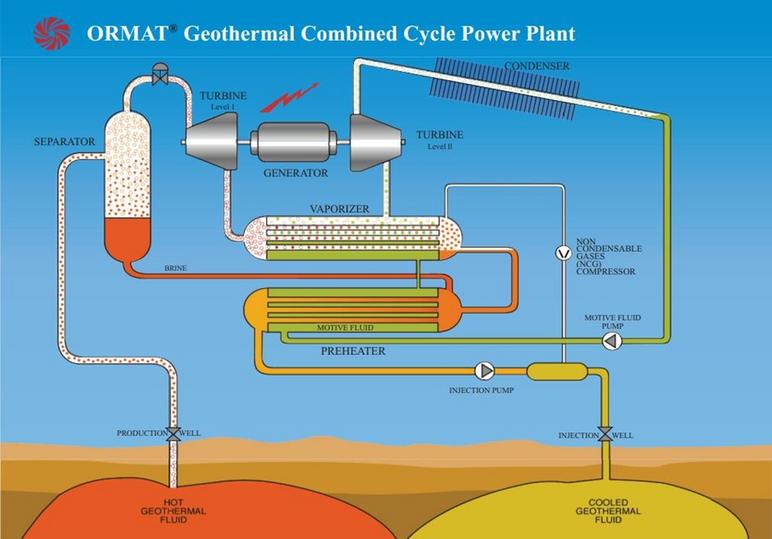
ORMAT Geothermal Combined Cycle Power Plant
The next articles in this series will drill down further into Conventional Geothermal, Enhanced Geothermal, Opportunities for the Oil and Gas Service Sector, Economic and Strategic Factors, and the Regional Landscape for Geothermal Development. Watch for your upcoming weekly issues of the CHOA eJournal, most Thursdays! 49ICHOAJOURNAL NOVEMBER2022
Figure 7 Ormat Geothermal Combined Cycle Power Plant Source: Ormat Technologies, Inc.
Appendix A: Power Generation Technology Statistics
Capital Costs and Emissions Statistics for Power Generation Technologies
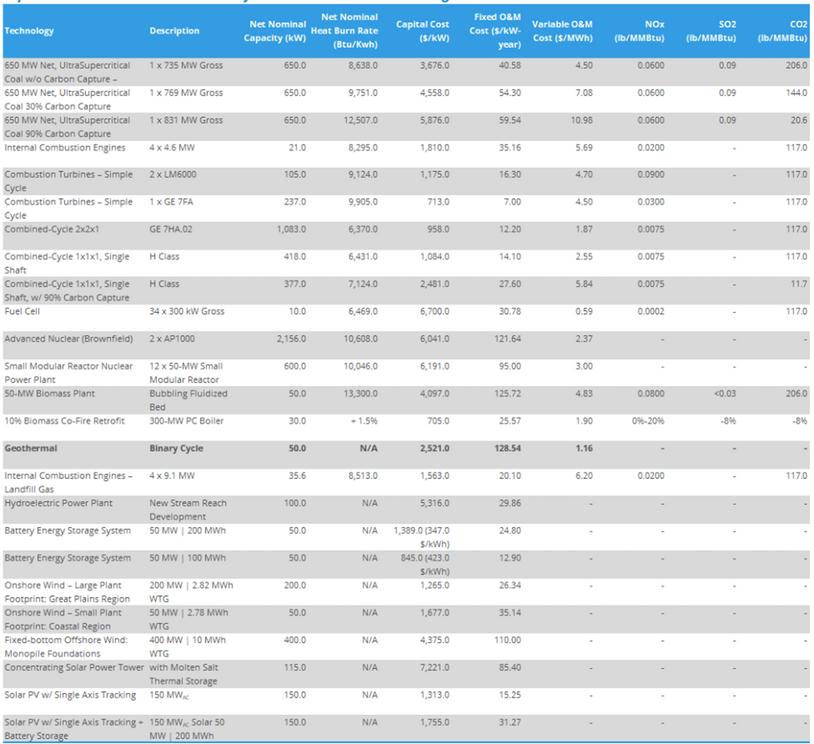
Figure 40 Capital Costs and Emissions Statistics for Power Generation Technologies
CHOAJOURNAL NOVEMBER2022I50
Source: Energy Information Administration, ATB Capital Markets Inc.


JOURNAL CHOA November2022 Connect. Share. Learn. Lead. Stay tuned for the next issue of the CHOA Journal.
