TECHNOLOGY – AEROBYTES
Picture 5: The wing at the minimum angle tested (at the modified location)
Picture 6: The wing at maximum angle tested (at the modified location)
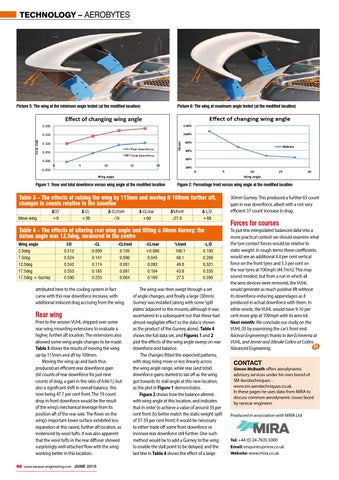
Effect of changing wing angle
Effect of changing wing angle 120%
0.150
100%
-‐CL & -‐CLR
0.200
%front
80%
0.100 Rear downforce
0.050 0.000
-‐0.050
Total downforce 0
5
10
15
Balance
60% 40%
20
20%
0
5
Wing angle
Figure 1: Rear and total downforce versus wing angle at the modified location
ΔCD
Δ-CL +39
+9
Δ-CLfront
Δ-CLrear
Δ%front
Δ-L/D
-19
+60
-27.9
+68
Table 4 – The effects of altering rear wing angle and fitting a 30mm Gurney; the datum angle was 12.5deg, measured in the centre Wing angle 2.5deg 7.5deg 12.5deg 17.5deg 17.5deg + Gurney
CD 0.512 0.524 0.542 0.553 0.590
-CL 0.099 0.141 0.174 0.185 0.233
-CLfront 0.105 0.096 0.081 0.081 0.064
attributed here to the cooling system in fact came with this rear downforce increase, with additional induced drag accruing from the wing.
Rear wing
Prior to the session VUHL shipped over some rear wing mounting extensions to evaluate a higher, further aft location. The extensions also allowed some wing angle changes to be made. Table 3 shows the results of moving the wing up by 115mm and aft by 100mm. Moving the wing up and back thus produced an efficient rear downforce gain (60 counts of rear downforce for just nine counts of drag, a gain in the ratio of 6.66:1), but also a significant shift in overall balance, this now being 47.7 per cent front. The 19 count drop in front downforce would be the result of the wing’s mechanical leverage from its position aft of the rear axle. The flows on the wing’s important lower surface exhibited less separation at this raised, further aft location, as evidenced by wool tufts. It was also apparent that the wool tufts in the rear diffuser showed surprisingly well-attached flow with the wing working better in this location. 60 www.racecar-engineering.com JUNE 2015
15
20
Figure 2: Percentage front versus wing angle at the modified location
Table 3 – The effects of raising the wing by 115mm and moving it 100mm further aft, changes in counts relative to the baseline Move wing
10 Wing angle
-CLrear +0.006 0.045 0.092 0.104 0.169
%front 106.1 68.1 46.6 43.8 27.5
-L/D 0.193 0.269 0.321 0.335 0.395
The wing was then swept through a set of angle changes, and finally a large (30mm) Gurney was installed (along with some ‘spill plates’ adjacent to the mounts, although it was ascertained in a subsequent run that these had almost negligible effect so the data is shown as the product of the Gurney alone). Table 4 shows the full data set, and Figures 1 and 2 plot the effects of the wing angle sweep on rear downforce and balance. The changes fitted the expected patterns, with drag rising more or less linearly across the wing angle range, while rear (and total) downforce gains started to tail off as the wing got towards its stall angle at this new location, as the plot in Figure 1 demonstrates. Figure 2 shows how the balance altered with wing angle at this location, and indicates that in order to achieve a value of around 35 per cent front (to better match the static weight split of 37-39 per cent front) it would be necessary to either trade off some front downforce or increase rear downforce still further. One such method would be to add a Gurney to the wing to enable the stall point to be delayed, and the last line in Table 4 shows the effect of a large
30mm Gurney. This produced a further 65 count gain in rear downforce, albeit with a not very efficient 37 count increase in drag.
Forces for courses
To put this interpolated ‘balanced data’ into a more practical context we should examine what the tyre contact forces would be relative to static weight. In rough terms these coefficients would see an additional 4.4 per cent vertical force on the front tyres and 5.3 per cent on the rear tyres at 100mph (44.7m/s). This may sound modest, but from a run in which all the aero devices were removed, the VUHL would generate as much positive lift without its downforce-inducing appendages as it produced in actual downforce with them. In other words, the VUHL would have 9-10 per cent more grip at 100mph with its aero kit. Next month: We conclude our study on the VUHL 05 by examining the car’s front end. Racecar Engineering’s thanks to Iker Echeverria at VUHL, and Jenner and Jilbruke Collins at Collins Advanced Engineering.
CONTACT
Simon McBeath offers aerodynamic advisory services under his own brand of SM Aerotechniques – www.sm-aerotechniques.co.uk. In these pages he uses data from MIRA to discuss common aerodynamic issues faced by racecar engineers Produced in association with MIRA Ltd
Tel: +44 (0) 24-7635 5000 Email: enquiries@mira.co.uk Website: www.mira.co.uk